cee 320 spring 2008 level of service and design traffic volumes cee 320 kelly pitera
Post on 21-Dec-2015
226 views
TRANSCRIPT
CE
E 3
20S
pri
ng
200
8Level of Service and Design Traffic Volumes
CEE 320Kelly Pitera
CE
E 3
20S
pri
ng
200
8
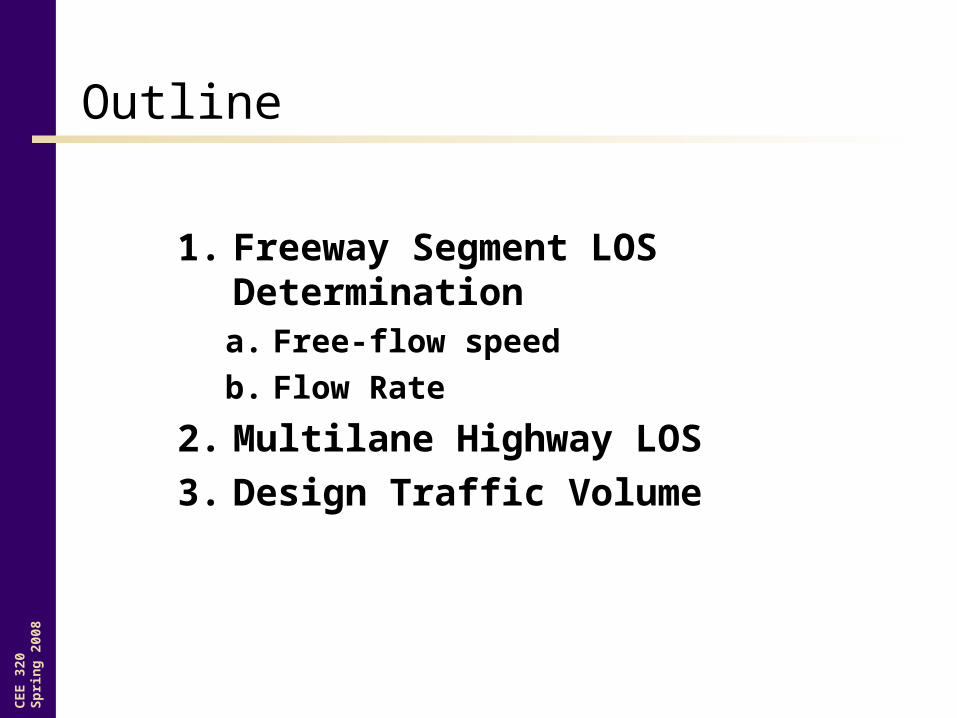
Outline
1. Freeway Segment LOS Determinationa. Free-flow speed
b. Flow Rate
2. Multilane Highway LOS
3. Design Traffic Volume
CE
E 3
20S
pri
ng
200
8
Freeway LOS
CE
E 3
20S
pri
ng
200
8
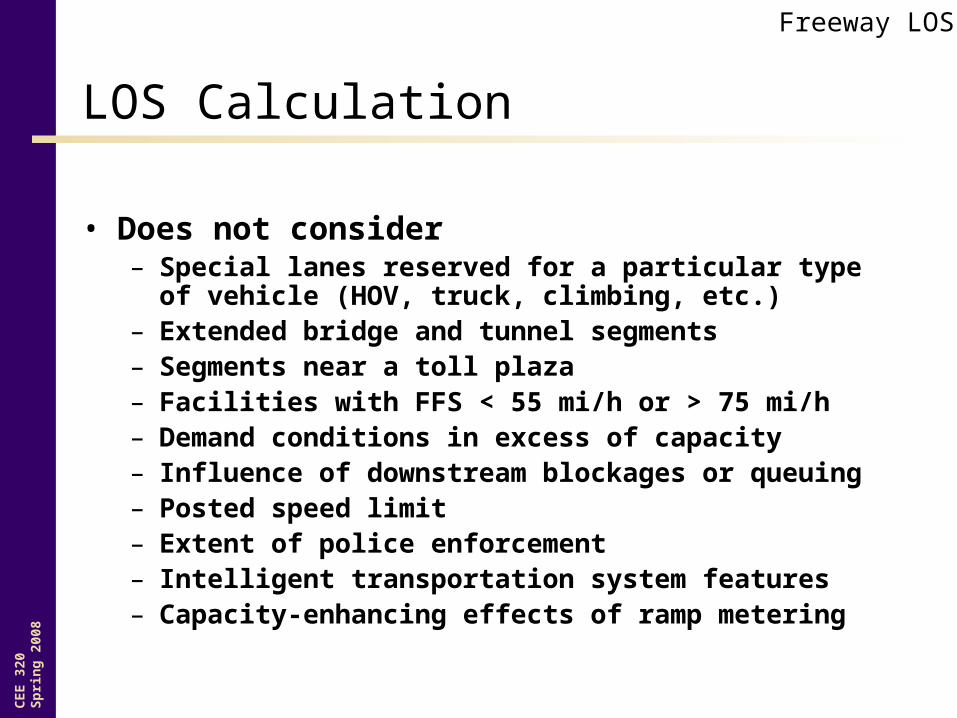
LOS Calculation
• Does not consider– Special lanes reserved for a particular type of vehicle
(HOV, truck, climbing, etc.)– Extended bridge and tunnel segments– Segments near a toll plaza– Facilities with FFS < 55 mi/h or > 75 mi/h– Demand conditions in excess of capacity– Influence of downstream blockages or queuing– Posted speed limit– Extent of police enforcement– Intelligent transportation system features – Capacity-enhancing effects of ramp metering
Freeway LOS

CE
E 3
20S
pri
ng
200
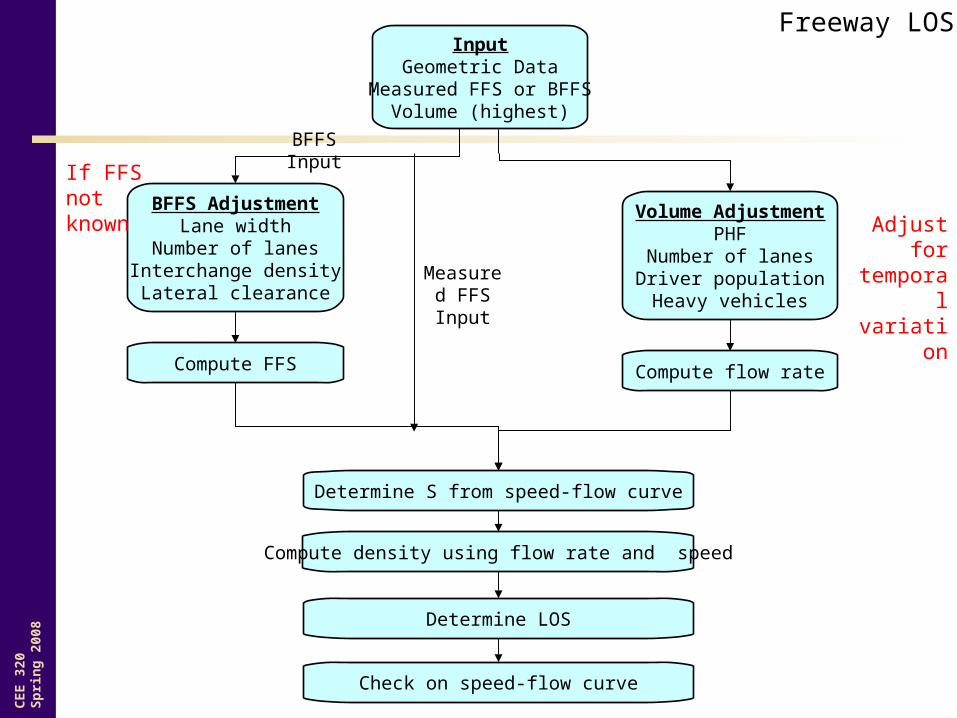
8Input
Geometric DataMeasured FFS or BFFS
Volume (highest)
BFFS AdjustmentLane width
Number of lanesInterchange densityLateral clearance
Volume AdjustmentPHF
Number of lanesDriver populationHeavy vehicles
Compute FFS Compute flow rate
Determine S from speed-flow curve
Determine LOS
Compute density using flow rate and speed
Check on speed-flow curve
BFFS Input
Measured FFS Input
Freeway LOS
If FFS notknown
Adjust for temporal variation
CE
E 3
20S
pri
ng
200
8
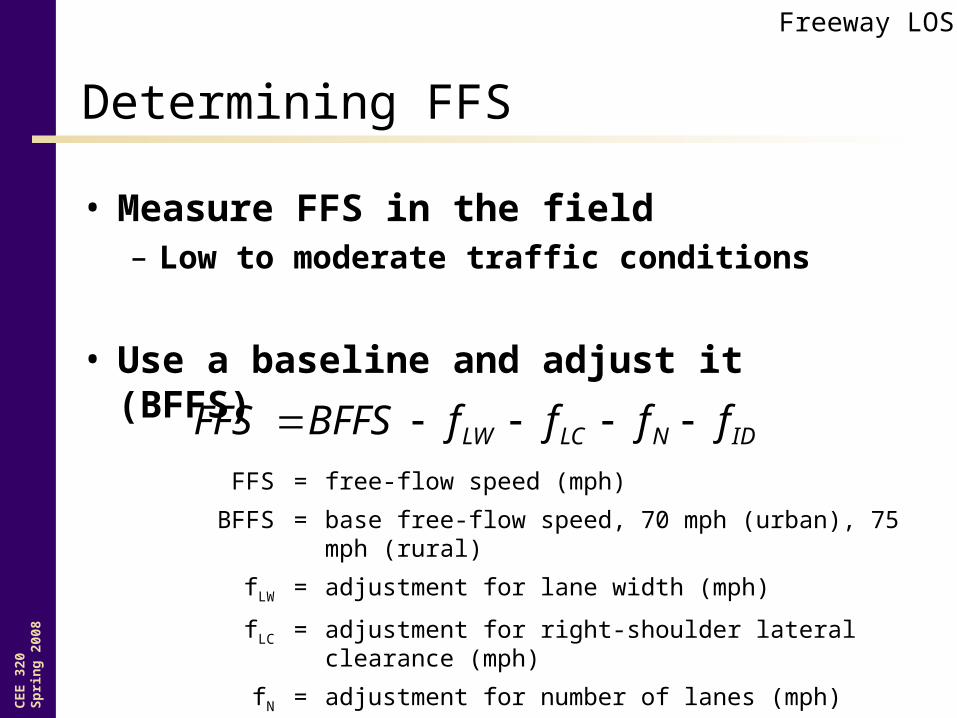
Determining FFS
• Measure FFS in the field– Low to moderate traffic conditions
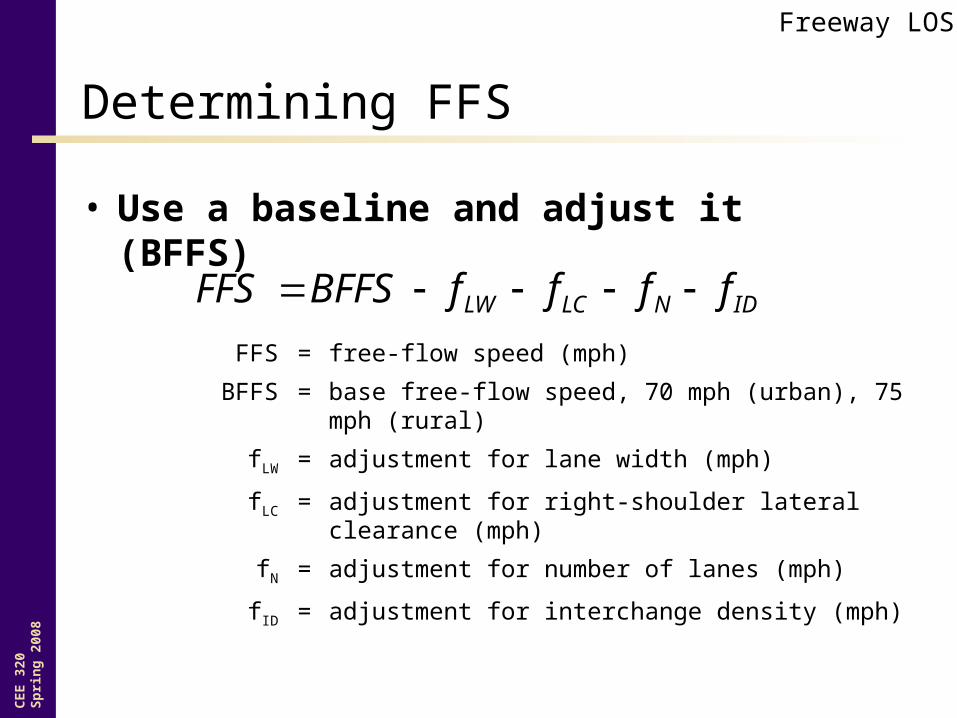
• Use a baseline and adjust it (BFFS)
IDNLCLW ffffBFFSFFS FFS = free-flow speed (mph)
BFFS = base free-flow speed, 70 mph (urban), 75 mph (rural)
fLW = adjustment for lane width (mph)
fLC = adjustment for right-shoulder lateral clearance (mph)
fN = adjustment for number of lanes (mph)
fID = adjustment for interchange density (mph)
Freeway LOS
CE
E 3
20S
pri
ng
200
8
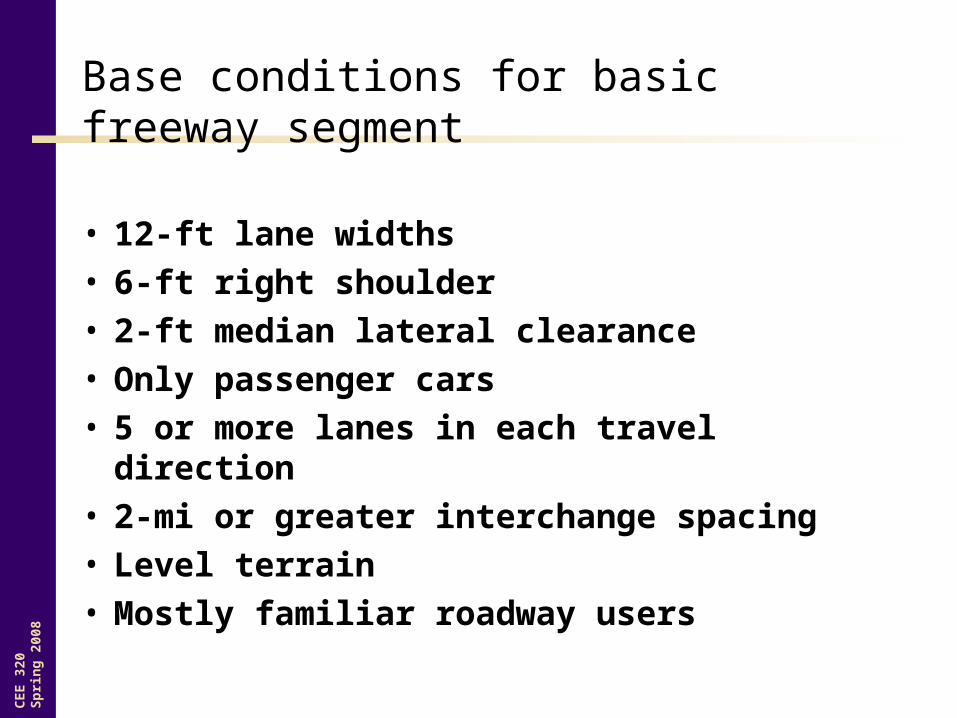
Base conditions for basic freeway segment
• 12-ft lane widths• 6-ft right shoulder• 2-ft median lateral clearance• Only passenger cars• 5 or more lanes in each travel direction• 2-mi or greater interchange spacing• Level terrain• Mostly familiar roadway users
CE
E 3
20S
pri
ng
200
8
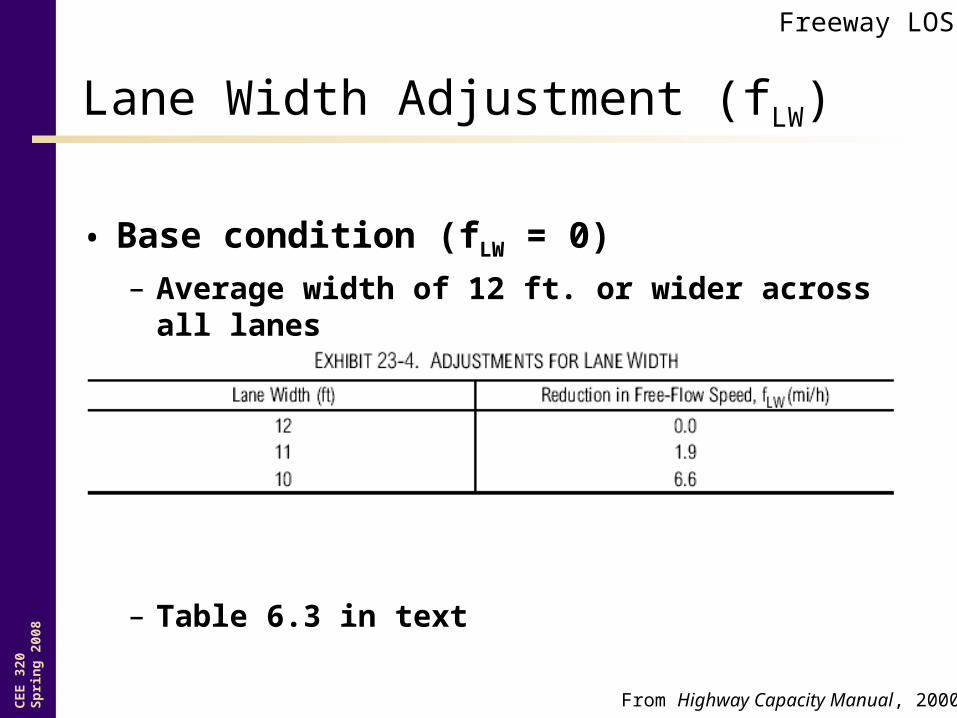
Lane Width Adjustment (fLW)
• Base condition (fLW = 0)– Average width of 12 ft. or wider across all lanes
– Table 6.3 in text
From Highway Capacity Manual, 2000
Freeway LOS
CE
E 3
20S
pri
ng
200
8
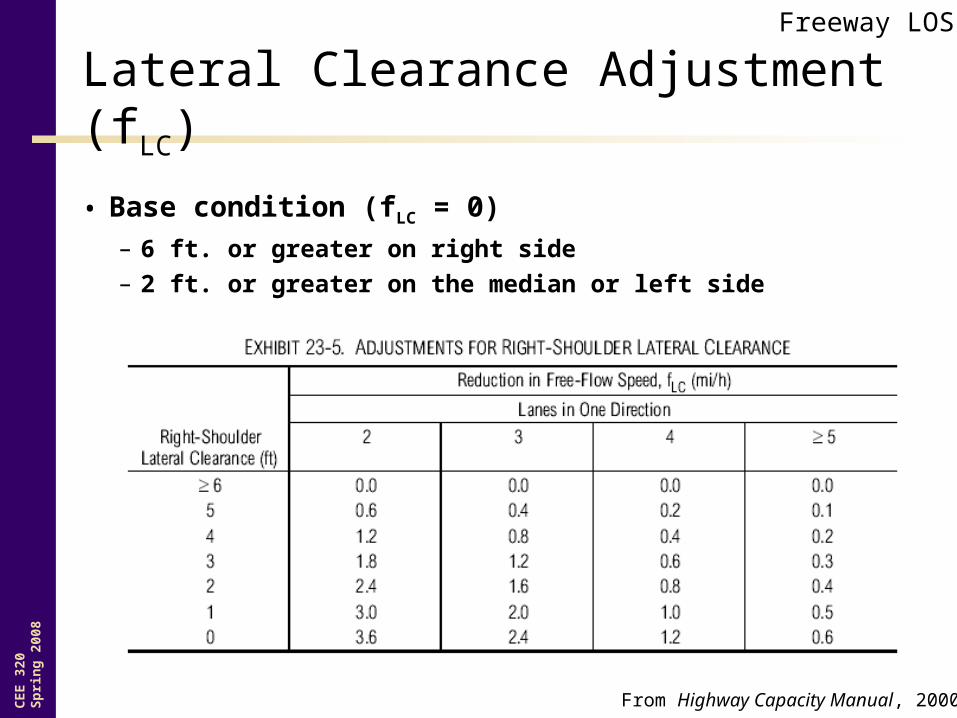
Lateral Clearance Adjustment (fLC)
• Base condition (fLC = 0)– 6 ft. or greater on right side– 2 ft. or greater on the median or left side
– Table 6.4 in text
From Highway Capacity Manual, 2000
Freeway LOS
CE
E 3
20S
pri
ng
200
8
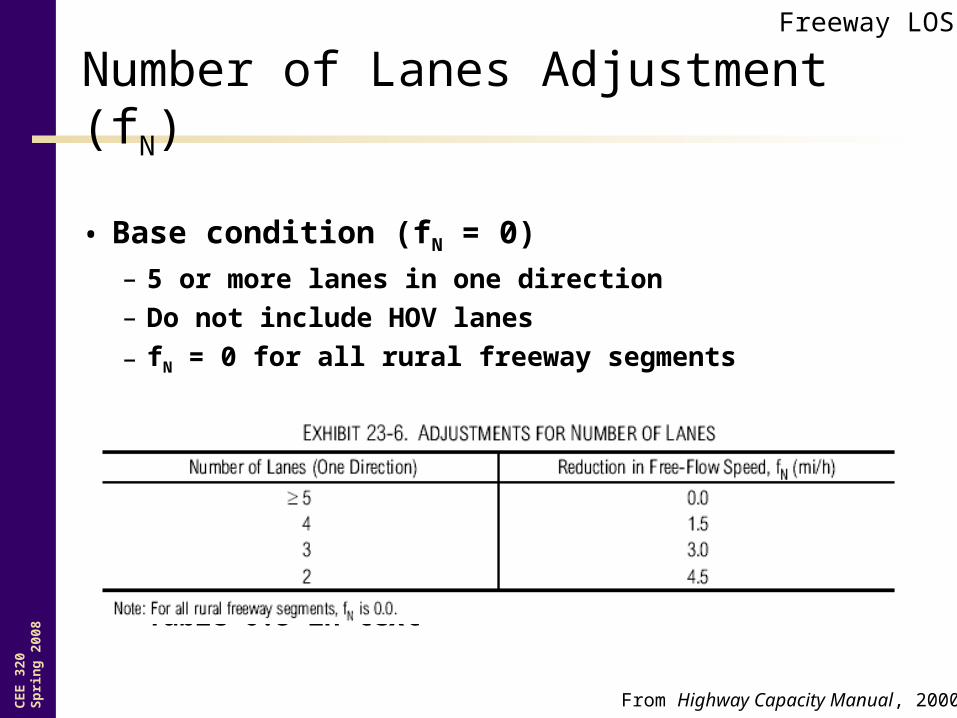
Number of Lanes Adjustment (fN)
• Base condition (fN = 0)– 5 or more lanes in one direction
– Do not include HOV lanes
– fN = 0 for all rural freeway segments
– Table 6.5 in text
From Highway Capacity Manual, 2000
Freeway LOS
CE
E 3
20S
pri
ng
200
8
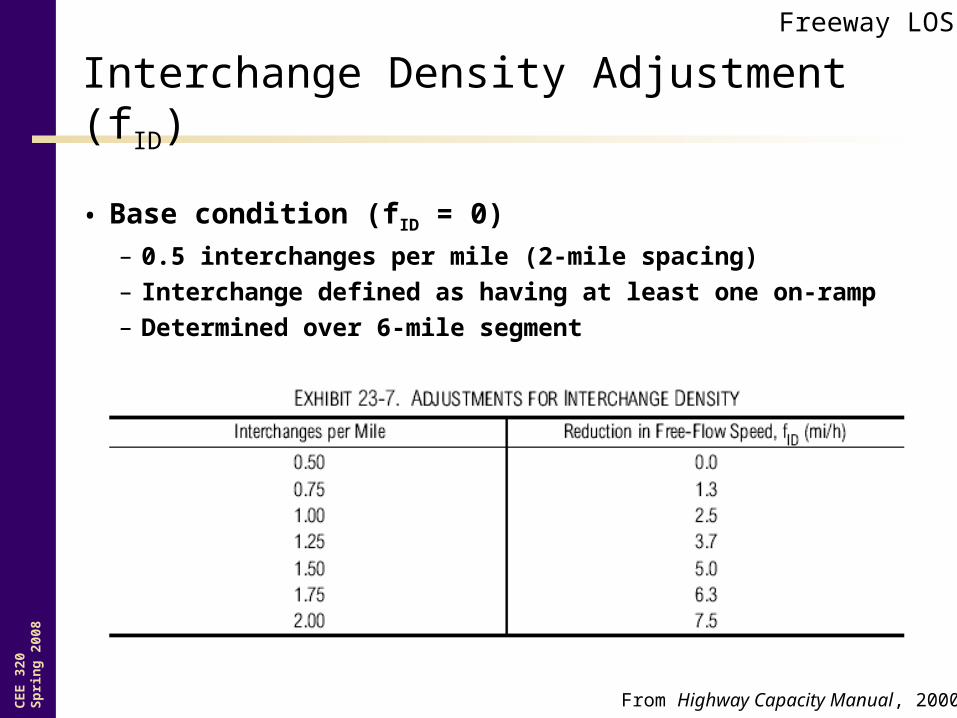
Interchange Density Adjustment (fID)
• Base condition (fID = 0)– 0.5 interchanges per mile (2-mile spacing)– Interchange defined as having at least one on-ramp– Determined over 6-mile segment
– Table 6.6 in text
From Highway Capacity Manual, 2000
Freeway LOS
CE
E 3
20S
pri
ng
200
8
Determining FFS
• Use a baseline and adjust it (BFFS)
IDNLCLW ffffBFFSFFS FFS = free-flow speed (mph)
BFFS = base free-flow speed, 70 mph (urban), 75 mph (rural)
fLW = adjustment for lane width (mph)
fLC = adjustment for right-shoulder lateral clearance (mph)
fN = adjustment for number of lanes (mph)
fID = adjustment for interchange density (mph)
Freeway LOS
CE
E 3
20S
pri
ng
200
8Input
Geometric DataMeasured FFS or BFFS
Volume (highest)
BFFS AdjustmentLane width
Number of lanesInterchange densityLateral clearance
Volume AdjustmentPHF
Number of lanesDriver populationHeavy vehicles
Compute FFS Compute flow rate
Determine S from speed-flow curve
Determine LOS
Compute density using flow rate and speed
Check on speed-flow curve
BFFS Input
Measured FFS Input
Freeway LOS
If FFS notknown
Adjust for temporal variation

CE
E 3
20S
pri
ng
200
8
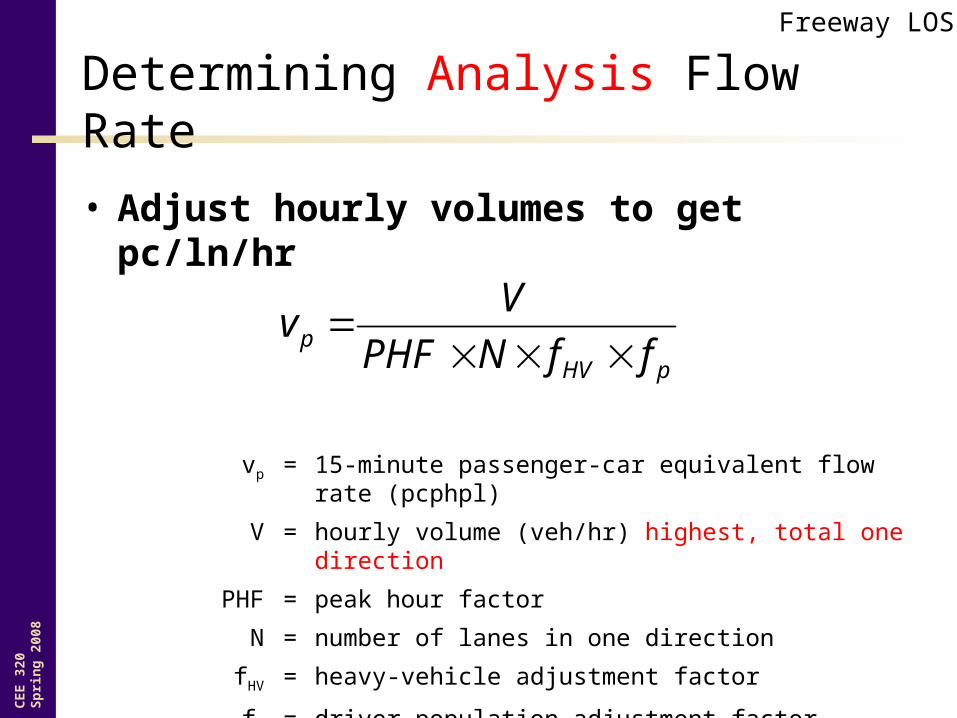
Determining Analysis Flow Rate
• Adjust hourly volumes to get pc/ln/hr
pHVp ffNPHF
Vv
vp = 15-minute passenger-car equivalent flow rate (pcphpl)
V = hourly volume (veh/hr) highest, total one direction
PHF = peak hour factor
N = number of lanes in one direction
fHV = heavy-vehicle adjustment factor
fP = driver population adjustment factor
Freeway LOS

CE
E 3
20S
pri
ng
200
8
Peak Hour Factor (PHF)
• Typical values– 0.80 to 0.95– Lower PHF characteristic of rural or off-peak– Higher PHF typical of urban peak-hour
415 V
VPHF
V = hourly volume (veh/hr) for hour of analysis
V15 = maximum 15-min. flow rate within hour of analysis
4 = Number of 15-min. periods per hour
Freeway LOS
CE
E 3
20S
pri
ng
200
8
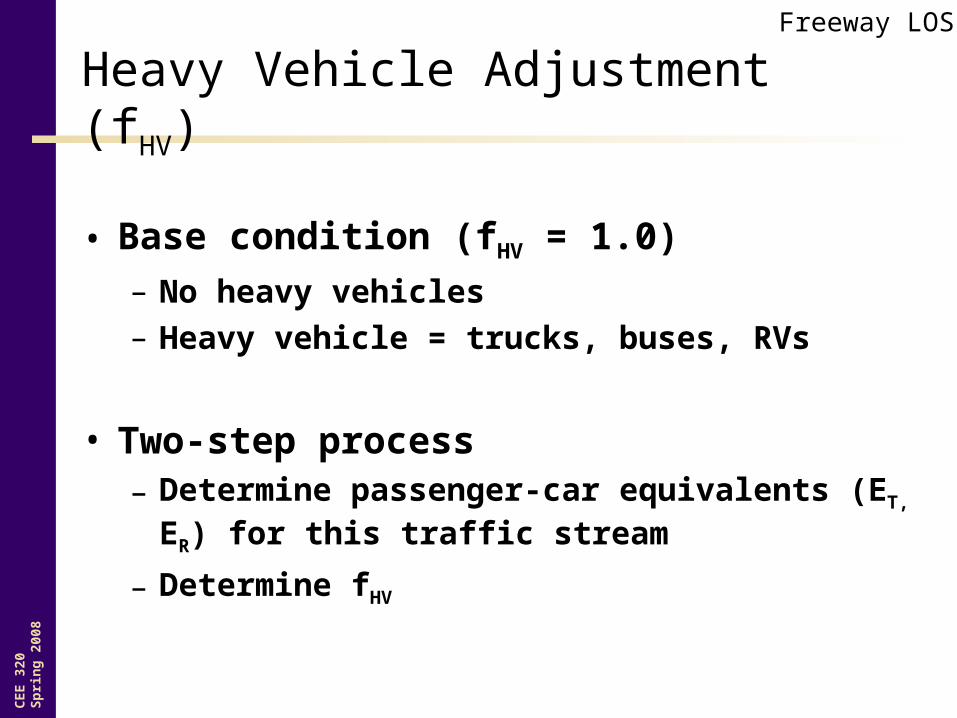
Heavy Vehicle Adjustment (fHV)
• Base condition (fHV = 1.0)– No heavy vehicles– Heavy vehicle = trucks, buses, RVs
• Two-step process– Determine passenger-car equivalents (ET, ER) for
this traffic stream
– Determine fHV
Freeway LOS
CE
E 3
20S
pri
ng
200
8
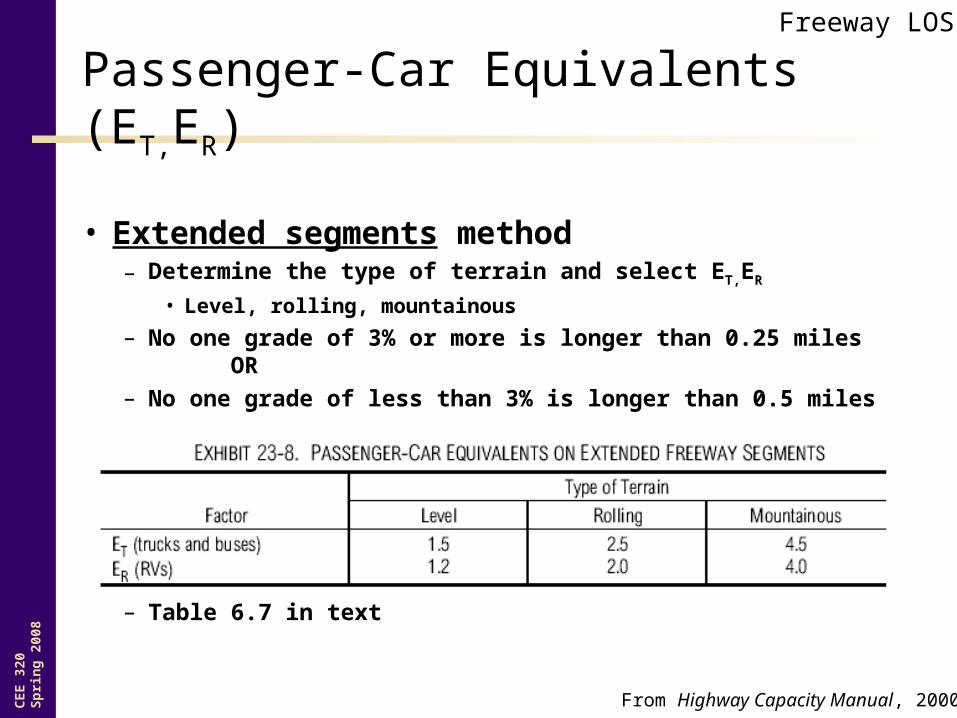
Passenger-Car Equivalents (ET,ER)
• Extended segments method– Determine the type of terrain and select ET,ER
• Level, rolling, mountainous
– No one grade of 3% or more is longer than 0.25 miles OR
– No one grade of less than 3% is longer than 0.5 miles
– Table 6.7 in text
From Highway Capacity Manual, 2000
Freeway LOS
CE
E 3
20S
pri
ng
200
8
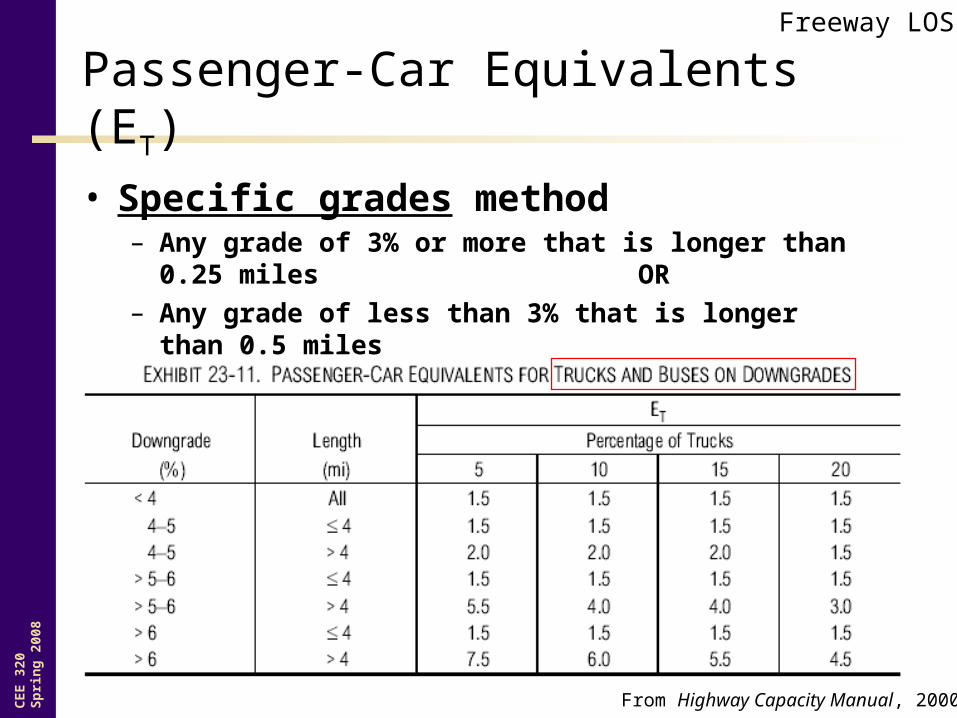
Passenger-Car Equivalents (ET)
• Specific grades method– Any grade of 3% or more that is longer than 0.25 miles
OR– Any grade of less than 3% that is longer than 0.5 miles
From Highway Capacity Manual, 2000
Freeway LOS
Fro
m H
ighw
ay C
apac
ity M
anua
l, 2
000
Freeway LOS
CE
E 3
20S
pri
ng
200
8
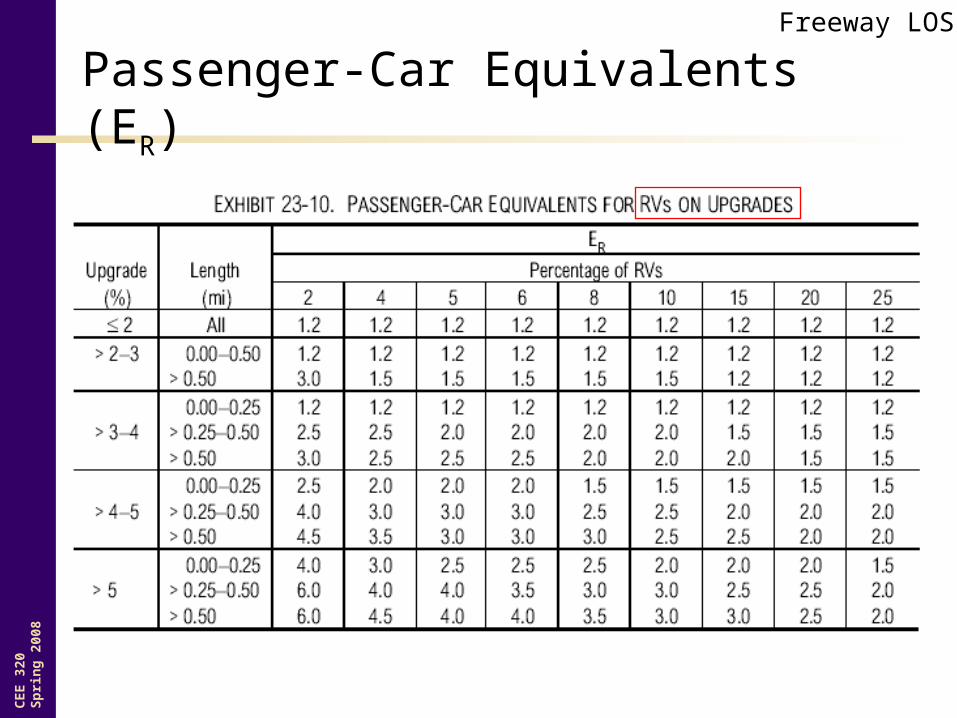
Passenger-Car Equivalents (ER)
Freeway LOS
CE
E 3
20S
pri
ng
200
8
Passenger-Car Equivalents (ET,ER)
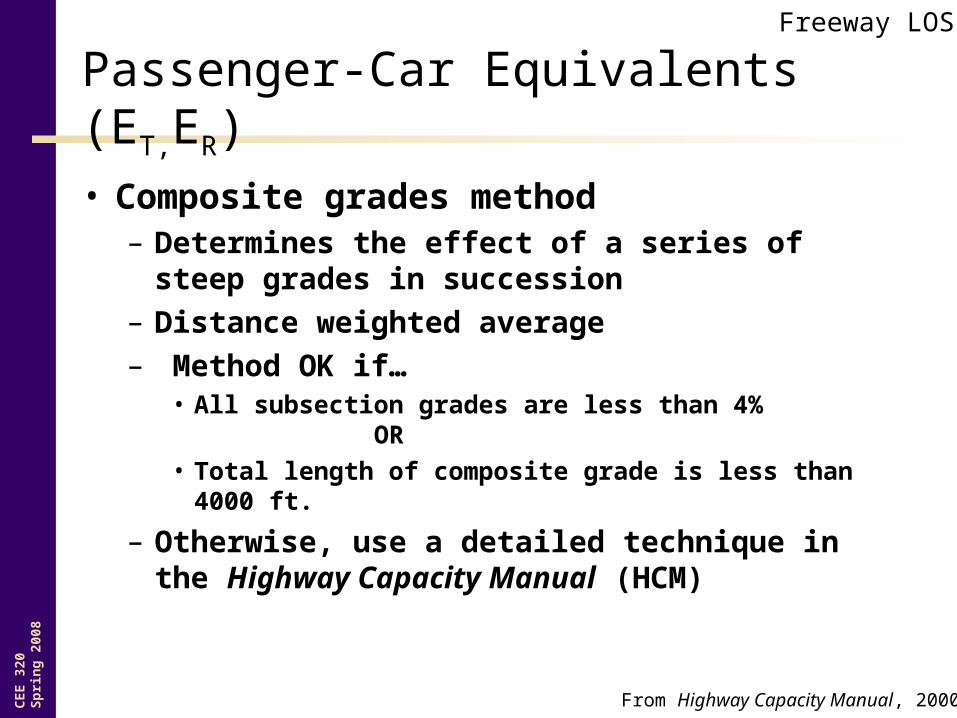
• Composite grades method– Determines the effect of a series of steep
grades in succession– Distance weighted average– Method OK if…
• All subsection grades are less than 4%OR
• Total length of composite grade is less than 4000 ft.
– Otherwise, use a detailed technique in the Highway Capacity Manual (HCM)
From Highway Capacity Manual, 2000
Freeway LOS
CE
E 3
20S
pri
ng
200
8
Determine fHV
111
1
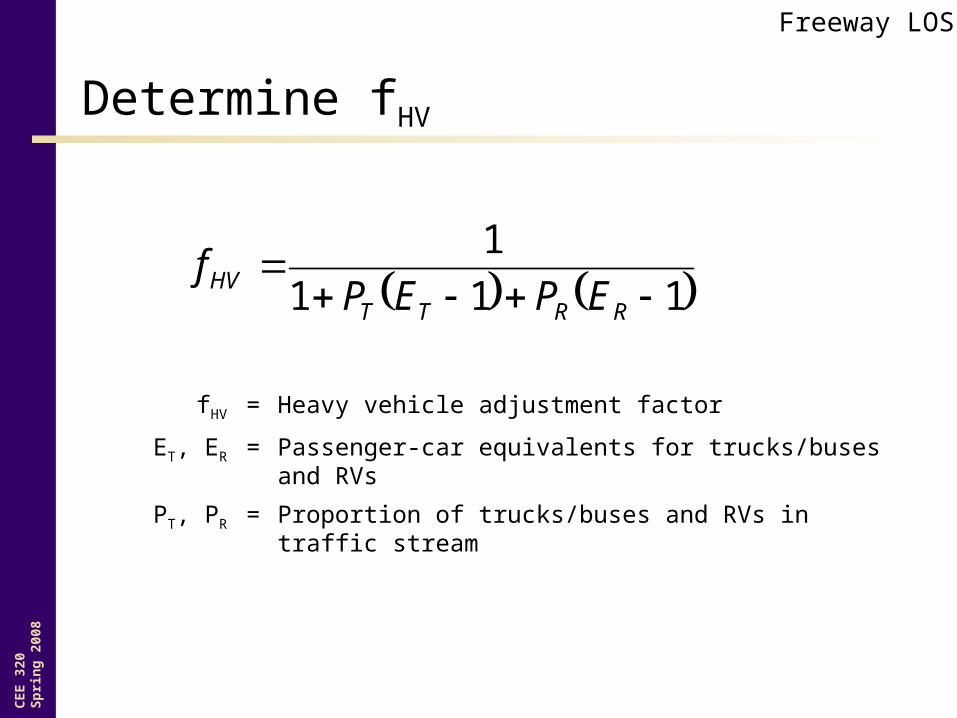
RRTTHV EPEPf
fHV = Heavy vehicle adjustment factor
ET, ER = Passenger-car equivalents for trucks/buses and RVs
PT, PR = Proportion of trucks/buses and RVs in traffic stream
Freeway LOS
CE
E 3
20S
pri
ng
200
8
Driver Population Adjustment (fP)
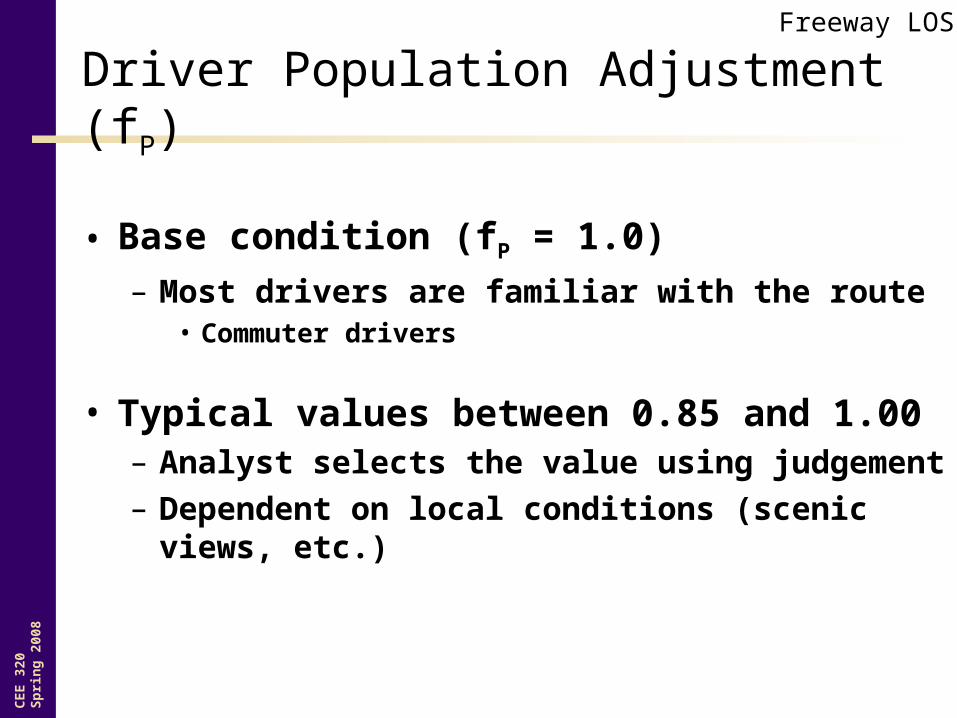
• Base condition (fP = 1.0)– Most drivers are familiar with the route
• Commuter drivers
• Typical values between 0.85 and 1.00– Analyst selects the value using judgement– Dependent on local conditions (scenic views, etc.)
Freeway LOS
CE
E 3
20S
pri
ng
200
8
Determining Analysis Flow Rate
• Adjust hourly volumes to get pc/ln/hr
pHVp ffNPHF
Vv
vp = 15-minute passenger-car equivalent flow rate (pcphpl)
V = hourly volume (veh/hr) highest, total one direction
PHF = peak hour factor
N = number of lanes in one direction
fHV = heavy-vehicle adjustment factor
fP = driver population adjustment factor
Freeway LOS

CE
E 3
20S
pri
ng
200
8Input
Geometric DataMeasured FFS or BFFS
Volume (highest)
BFFS AdjustmentLane width
Number of lanesInterchange densityLateral clearance
Volume AdjustmentPHF
Number of lanesDriver populationHeavy vehicles
Compute FFS Compute flow rate
Determine S from speed-flow curve
Determine LOS
Compute density using flow rate and speed
Check on speed-flow curve
BFFS Input
Measured FFS Input
Freeway LOS
If FFS notknown
Adjust for temporal variation

CE
E 3
20S
pri
ng
200
8
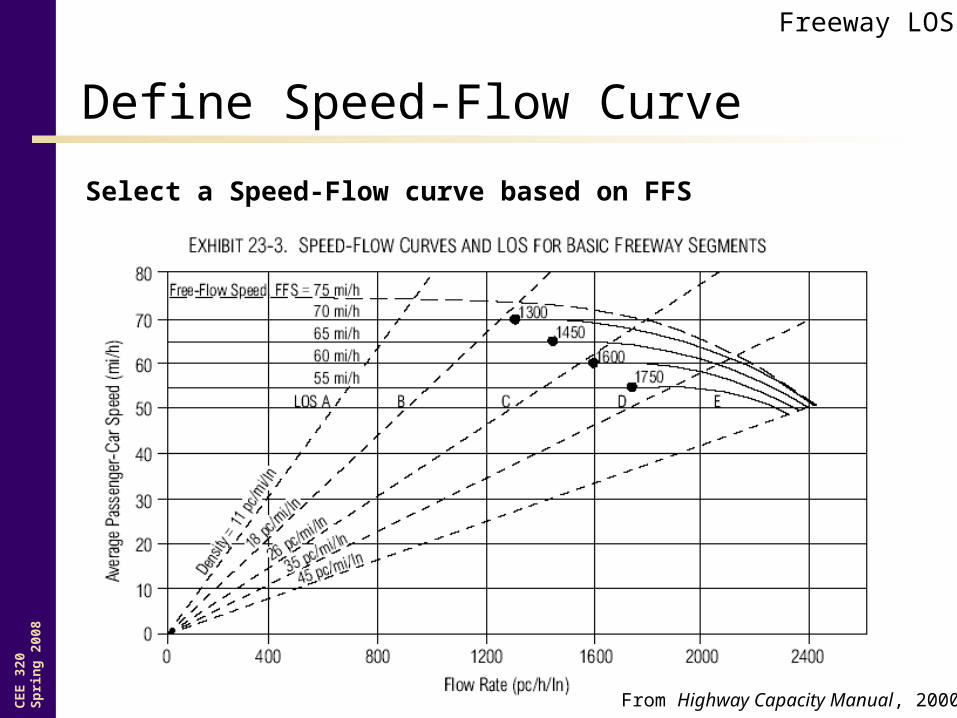
Define Speed-Flow Curve
Select a Speed-Flow curve based on FFS
From Highway Capacity Manual, 2000
Freeway LOS
CE
E 3
20S
pri
ng
200
8
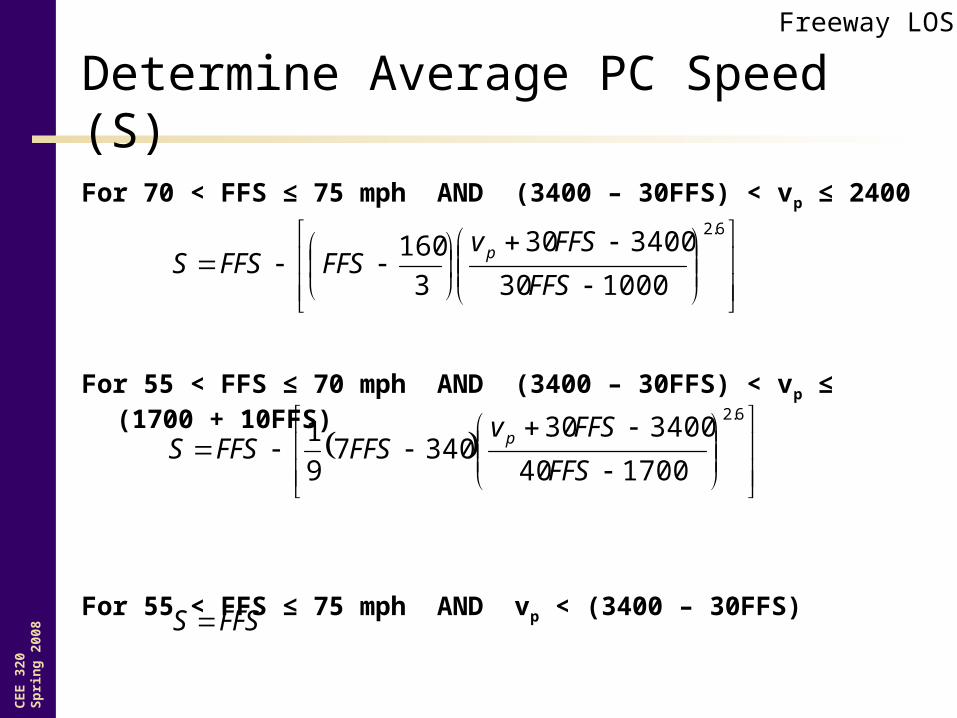
Determine Average PC Speed (S)
For 70 < FFS ≤ 75 mph AND (3400 – 30FFS) < vp ≤ 2400
For 55 < FFS ≤ 70 mph AND (3400 – 30FFS) < vp ≤ (1700 + 10FFS)
For 55 < FFS ≤ 75 mph AND vp < (3400 – 30FFS)
6.2
100030
340030
3
160
FFS
FFSvFFSFFSS p
6.2
170040
3400303407
9
1
FFS
FFSvFFSFFSS p
FFSS
Freeway LOS

CE
E 3
20S
pri
ng
200
8Input
Geometric DataMeasured FFS or BFFS
Volume (highest)
BFFS AdjustmentLane width
Number of lanesInterchange densityLateral clearance
Volume AdjustmentPHF
Number of lanesDriver populationHeavy vehicles
Compute FFS Compute flow rate
Determine S from speed-flow curve
Determine LOS
Compute density using flow rate and speed
Check on speed-flow curve
BFFS Input
Measured FFS Input
Freeway LOS
If FFS notknown
Adjust for temporal variation
CE
E 3
20S
pri
ng
200
8
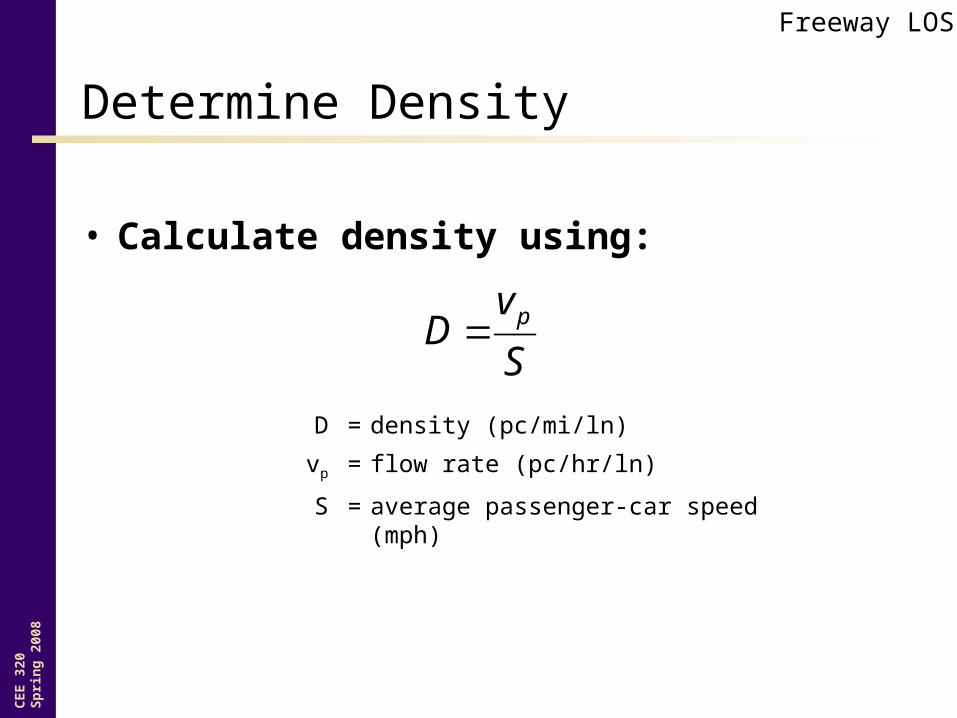
Determine Density
• Calculate density using:
S
vD p
D = density (pc/mi/ln)
vp = flow rate (pc/hr/ln)
S = average passenger-car speed (mph)
Freeway LOS
CE
E 3
20S
pri
ng
200
8
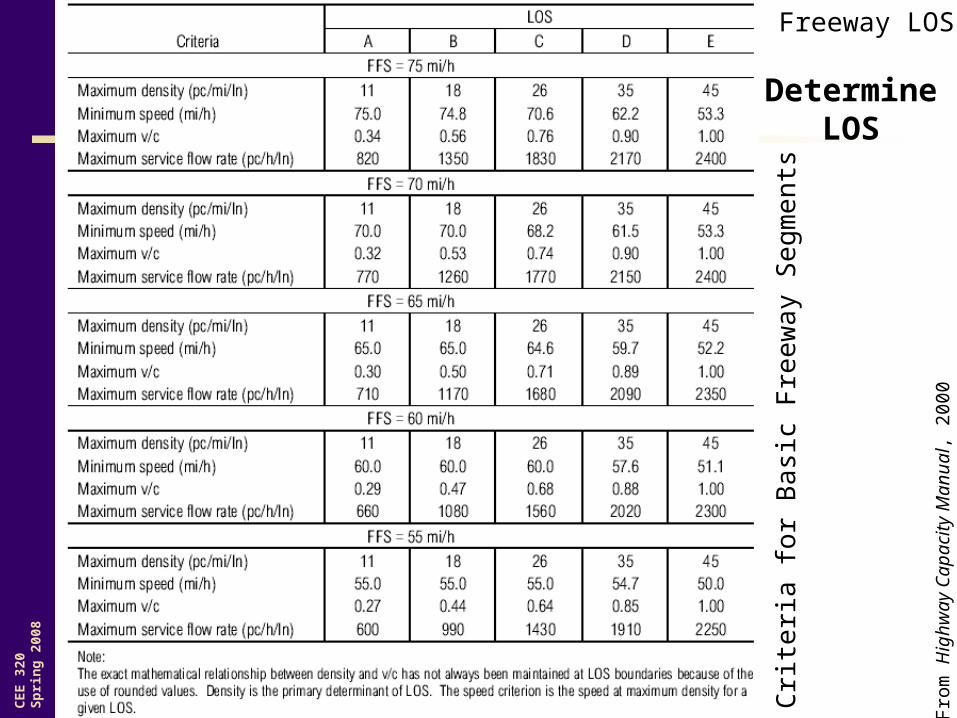
LO
S C
rite
ria
for
Ba
sic
Fre
ew
ay
Se
gme
nts
Fro
m H
ighw
ay C
apac
ity M
anua
l, 2
000
DetermineLOS
Freeway LOS
CE
E 3
20S
pri
ng
200
8
Define Speed-Flow Curve
Select a Speed-Flow curve based on FFS
From Highway Capacity Manual, 2000
Freeway LOS
CE
E 3
20S
pri
ng
200
8
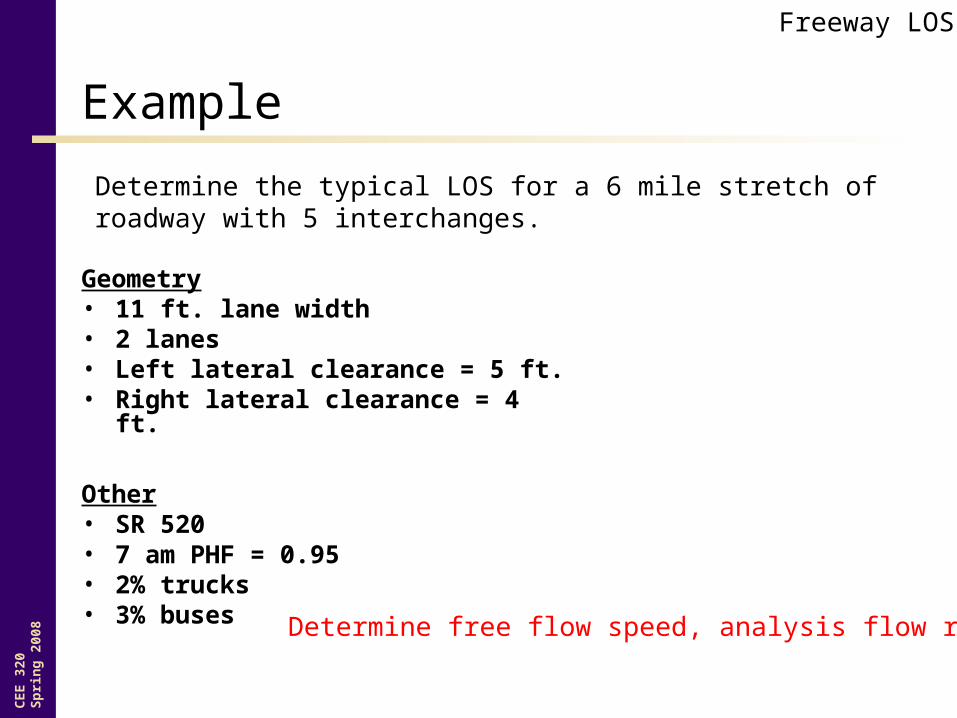
Example
Geometry• 11 ft. lane width• 2 lanes• Left lateral clearance = 5 ft.• Right lateral clearance = 4 ft.
Other• SR 520• 7 am PHF = 0.95• 2% trucks• 3% buses
Determine the typical LOS for a 6 mile stretch of roadway with 5 interchanges.
Freeway LOS
Determine free flow speed, analysis flow rate

CE
E 3
20S
pri
ng
200
8
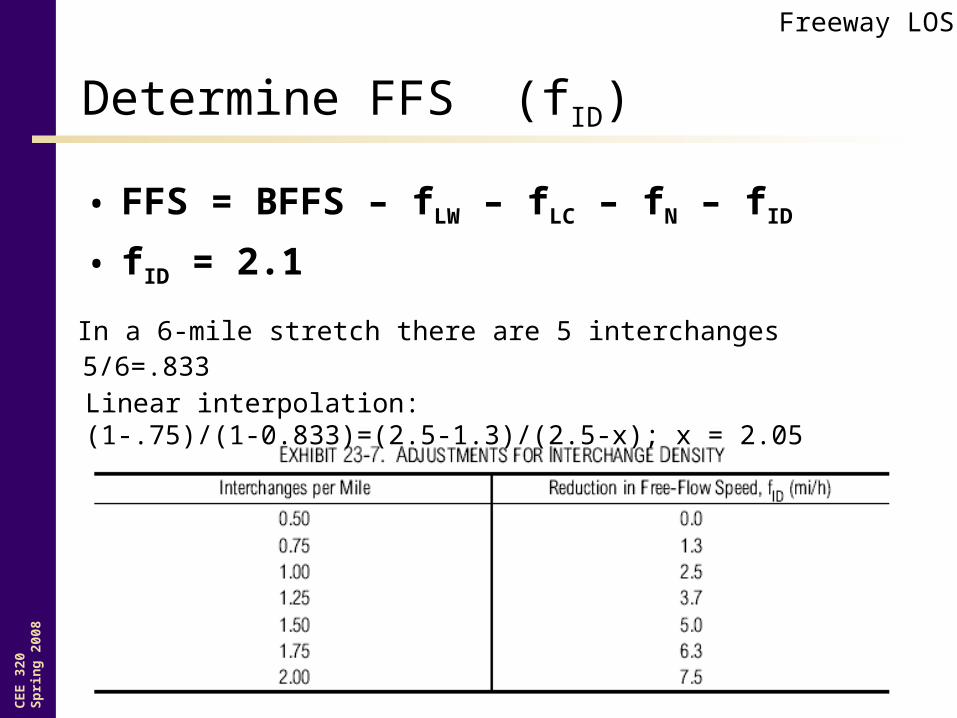
Determine FFS (fLW)
• FFS = BFFS – fLW – fLC – fN – fID
• BFFS is 70 mph for urban freeway• Given 11 ft lanes
• fLW = 1.9
Freeway LOS
CE
E 3
20S
pri
ng
200
8
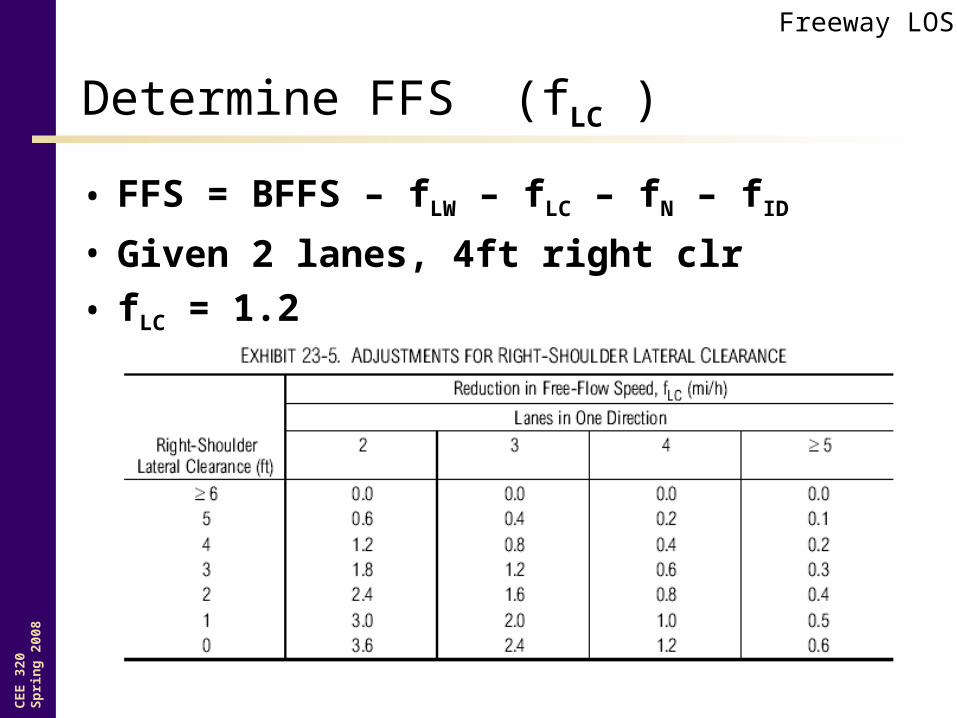
Determine FFS (fLC )
Freeway LOS
• FFS = BFFS – fLW – fLC – fN – fID
• Given 2 lanes, 4ft right clr
• fLC = 1.2
CE
E 3
20S
pri
ng
200
8
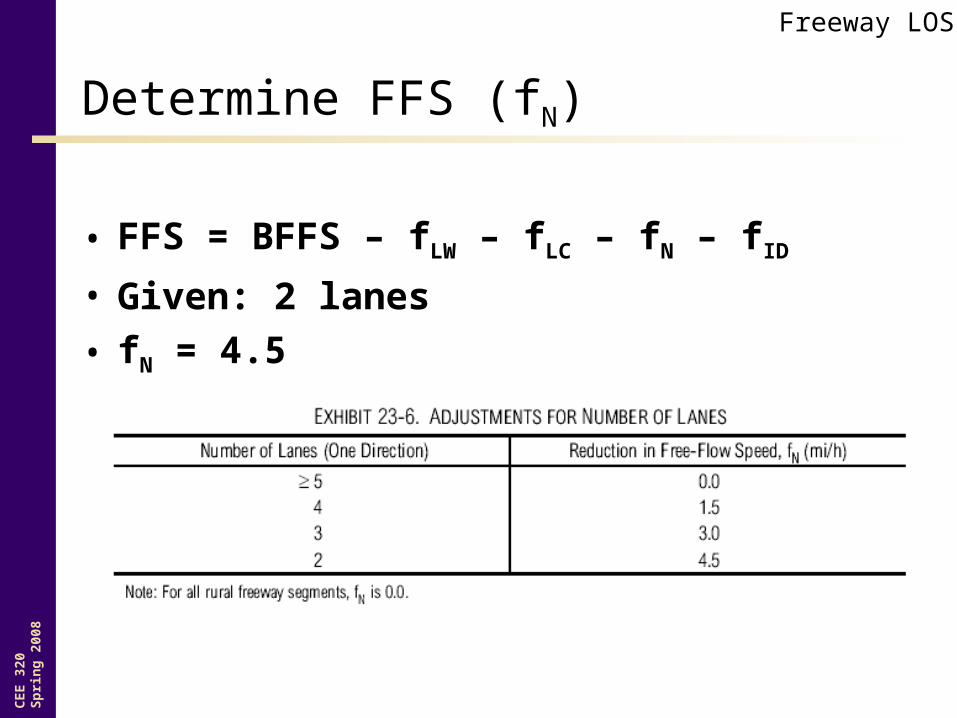
Determine FFS (fN)
• FFS = BFFS – fLW – fLC – fN – fID
• Given: 2 lanes
• fN = 4.5
Freeway LOS
CE
E 3
20S
pri
ng
200
8
Determine FFS (fID)
In a 6-mile stretch there are 5 interchanges
Freeway LOS
5/6=.833Linear interpolation: (1-.75)/(1-0.833)=(2.5-1.3)/(2.5-x); x = 2.05
• FFS = BFFS – fLW – fLC – fN – fID
• fID = 2.1
CE
E 3
20S
pri
ng
200
8
Determine FFS
• FFS = BFFS – fLW – fLC – fN – fID• FFS = 70 – 1.9 – 1.2 – 4.5 – 2.1 = 60.3 mph
CE
E 3
20S
pri
ng
200
8
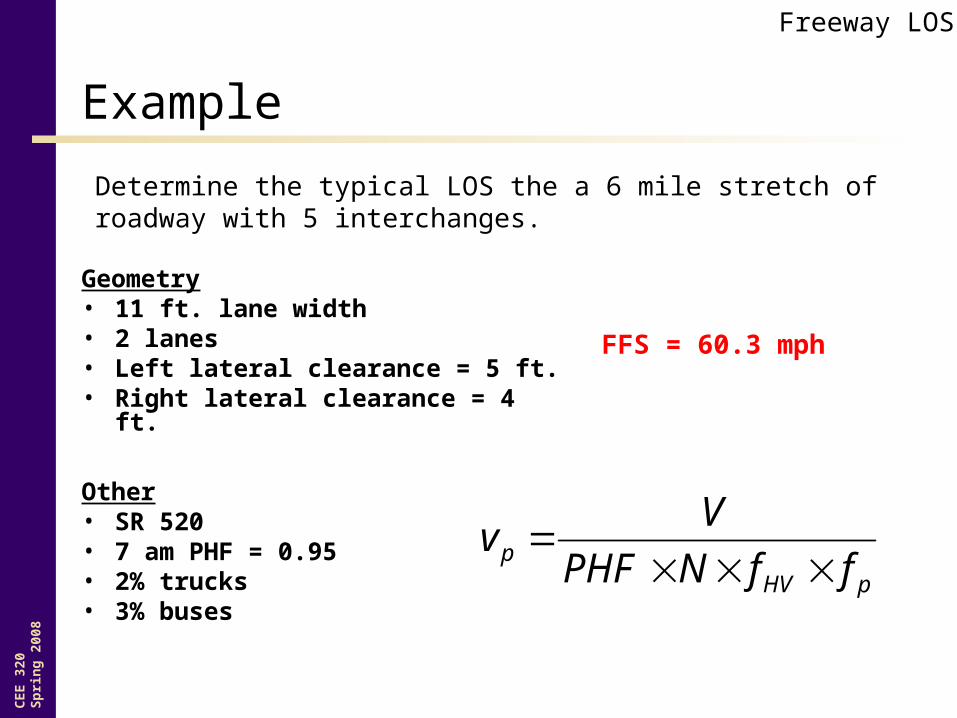
Example
Geometry• 11 ft. lane width• 2 lanes• Left lateral clearance = 5 ft.• Right lateral clearance = 4 ft.
Other• SR 520• 7 am PHF = 0.95• 2% trucks• 3% buses
Determine the typical LOS the a 6 mile stretch of roadway with 5 interchanges.
Freeway LOS
FFS = 60.3 mph
pHVp ffNPHF
Vv
CE
E 3
20S
pri
ng
200
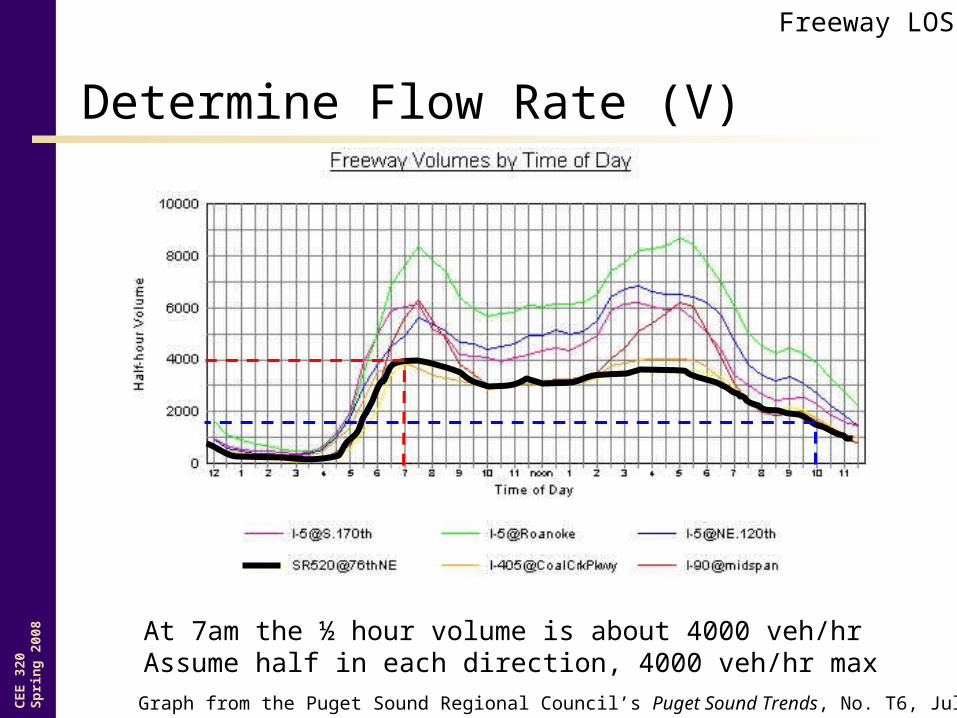
8 At 7am the ½ hour volume is about 4000 veh/hrAssume half in each direction, 4000 veh/hr max
Graph from the Puget Sound Regional Council’s Puget Sound Trends, No. T6, July 1997
Determine Flow Rate (V)
Freeway LOS
CE
E 3
20S
pri
ng
200
8
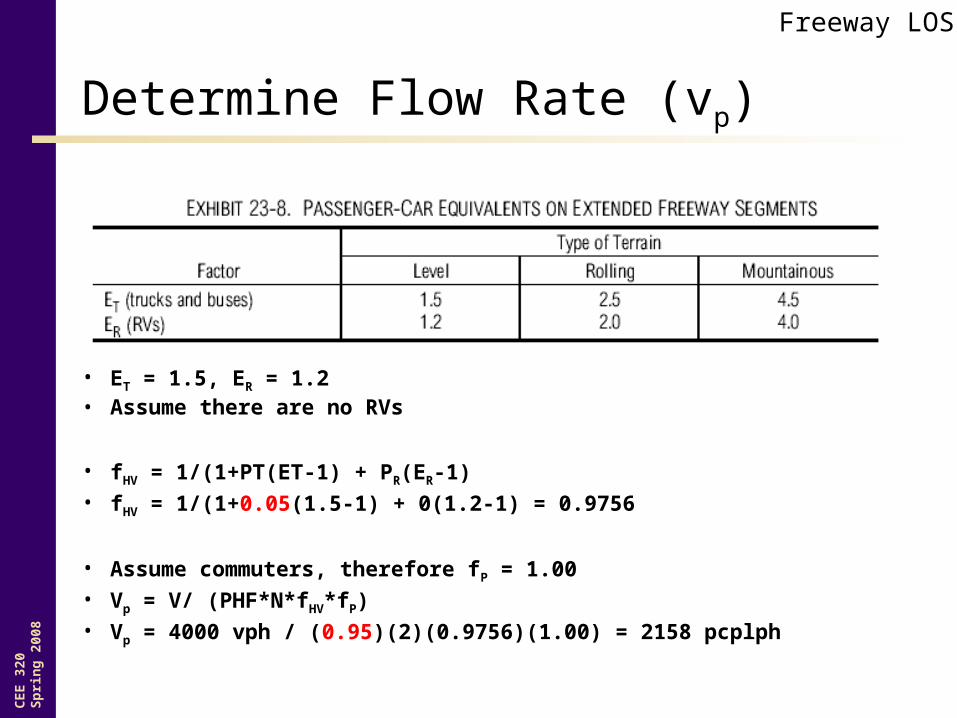
Determine Flow Rate (vp)
• ET = 1.5, ER = 1.2• Assume there are no RVs
• fHV = 1/(1+PT(ET-1) + PR(ER-1)• fHV = 1/(1+0.05(1.5-1) + 0(1.2-1) = 0.9756
• Assume commuters, therefore fP = 1.00• Vp = V/ (PHF*N*fHV*fP)• Vp = 4000 vph / (0.95)(2)(0.9756)(1.00) = 2158 pcplph
Freeway LOS
CE
E 3
20S
pri
ng
200
8
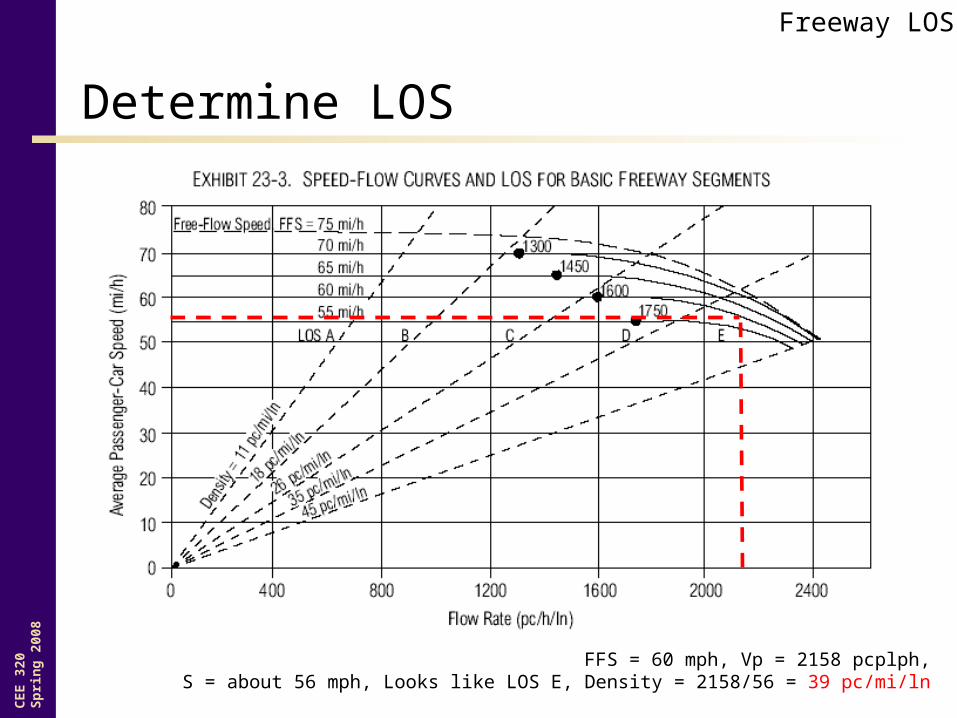
Determine LOS
Freeway LOS
FFS = 60 mph, Vp = 2158 pcplph,S = about 56 mph, Looks like LOS E, Density = 2158/56 = 39 pc/mi/ln
CE
E 3
20S
pri
ng
200
8
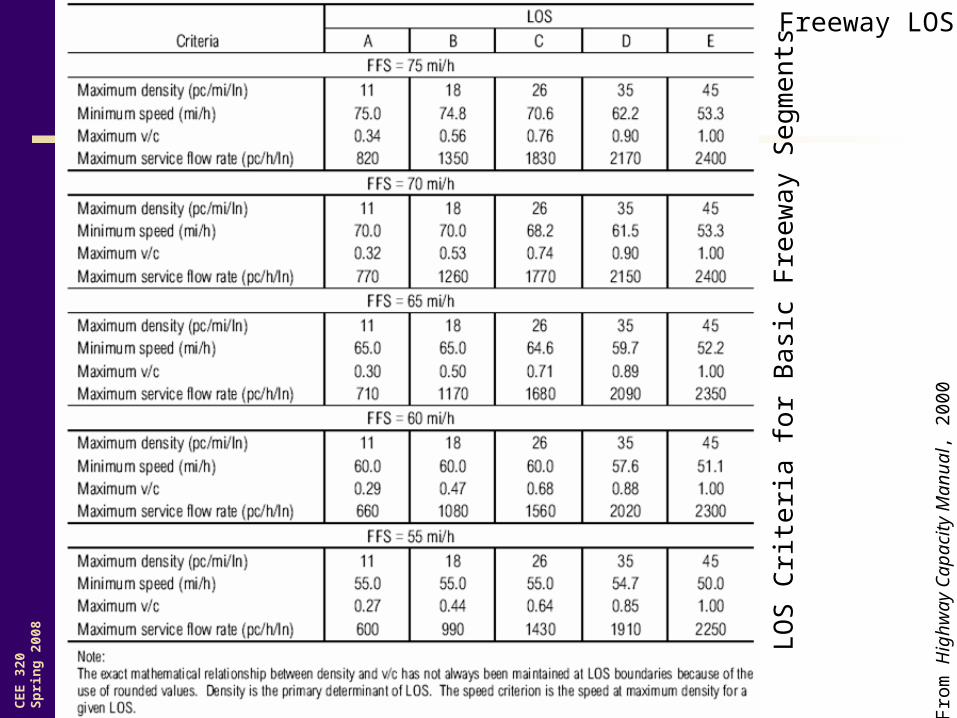
LO
S C
rite
ria
for
Ba
sic
Fre
ew
ay
Se
gme
nts
Fro
m H
ighw
ay C
apac
ity M
anua
l, 2
000
Freeway LOS
CE
E 3
20S
pri
ng
200
8
Multilane Highway LOS
CE
E 3
20S
pri
ng
200
8
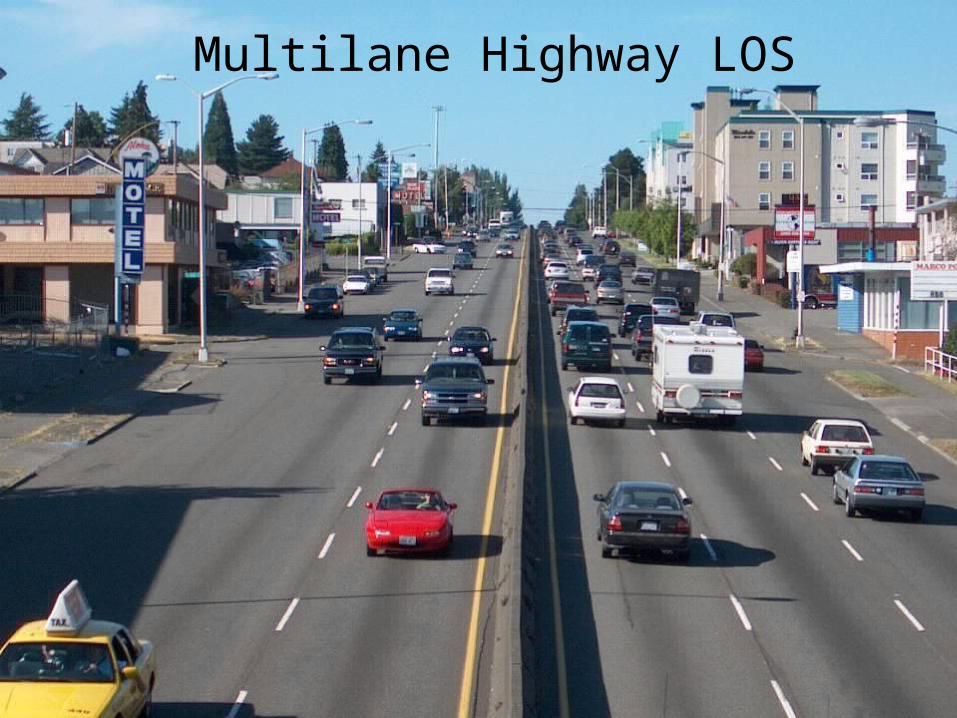
Multilane Highway LOS
• Similar to Freeway LOS• A few minor differences
Multilane Highway LOS
CE
E 3
20S
pri
ng
200
8
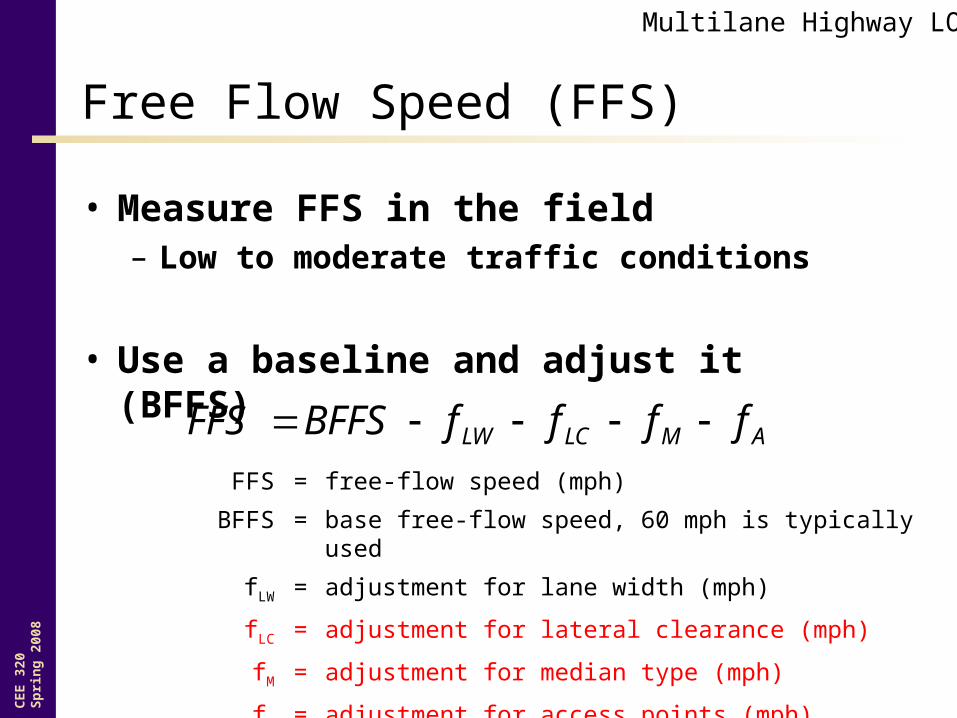
Free Flow Speed (FFS)
• Measure FFS in the field– Low to moderate traffic conditions
• Use a baseline and adjust it (BFFS)
AMLCLW ffffBFFSFFS FFS = free-flow speed (mph)
BFFS = base free-flow speed, 60 mph is typically used
fLW = adjustment for lane width (mph)
fLC = adjustment for lateral clearance (mph)
fM = adjustment for median type (mph)
fA = adjustment for access points (mph)
Multilane Highway LOS
CE
E 3
20S
pri
ng
200
8
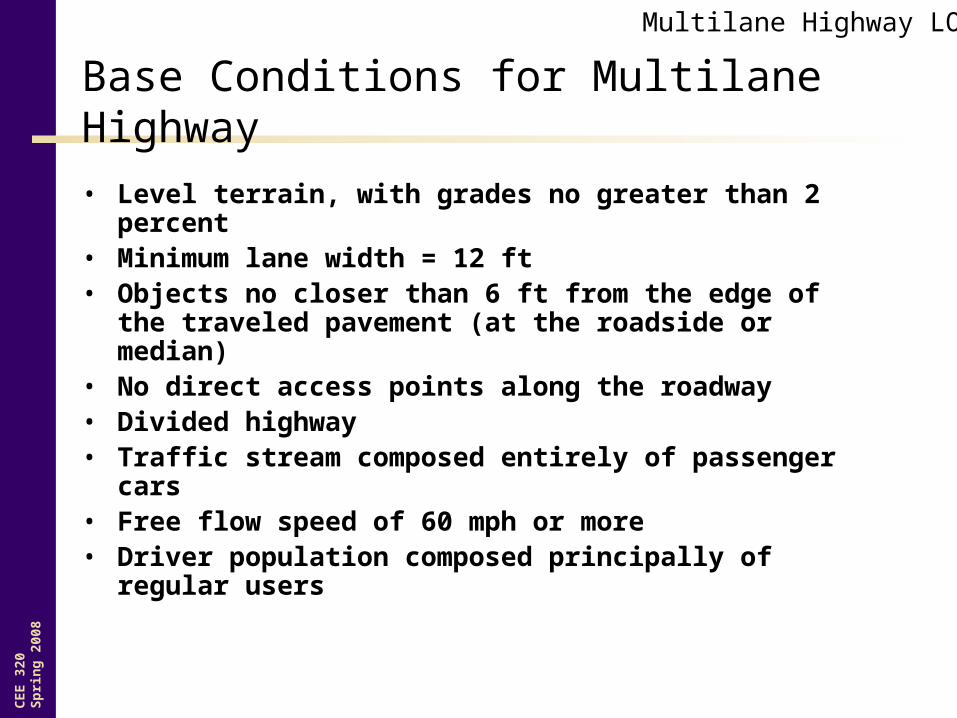
Base Conditions for Multilane Highway
• Level terrain, with grades no greater than 2 percent• Minimum lane width = 12 ft • Objects no closer than 6 ft from the edge of the traveled
pavement (at the roadside or median)• No direct access points along the roadway• Divided highway• Traffic stream composed entirely of passenger cars• Free flow speed of 60 mph or more• Driver population composed principally of regular users
Multilane Highway LOS
CE
E 3
20S
pri
ng
200
8
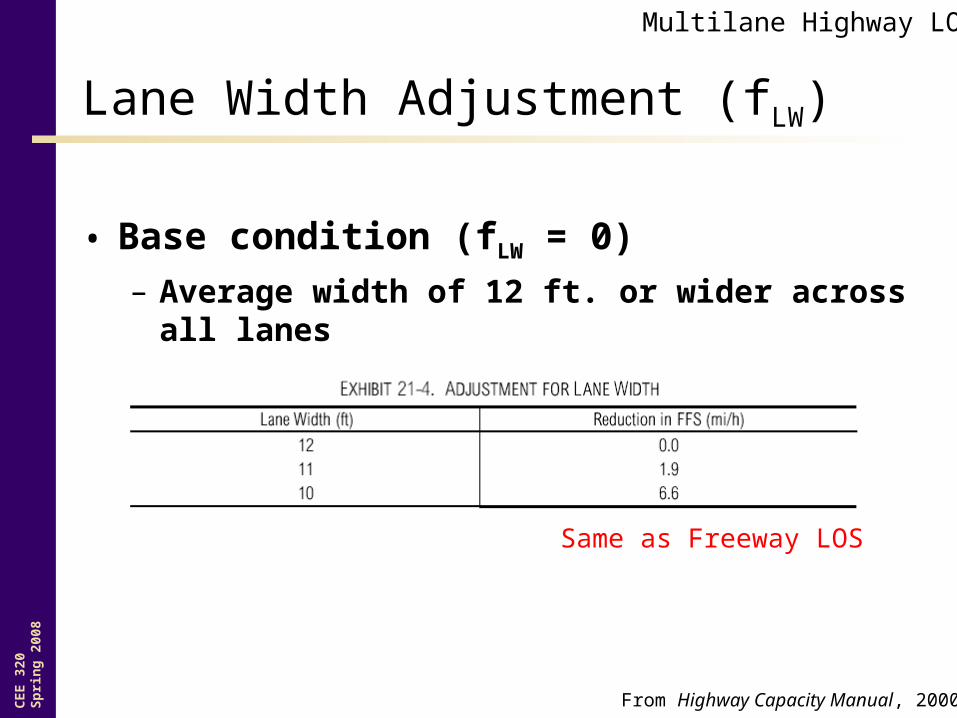
Lane Width Adjustment (fLW)
• Base condition (fLW = 0)– Average width of 12 ft. or wider across all lanes
From Highway Capacity Manual, 2000
Multilane Highway LOS
Same as Freeway LOS
CE
E 3
20S
pri
ng
200
8
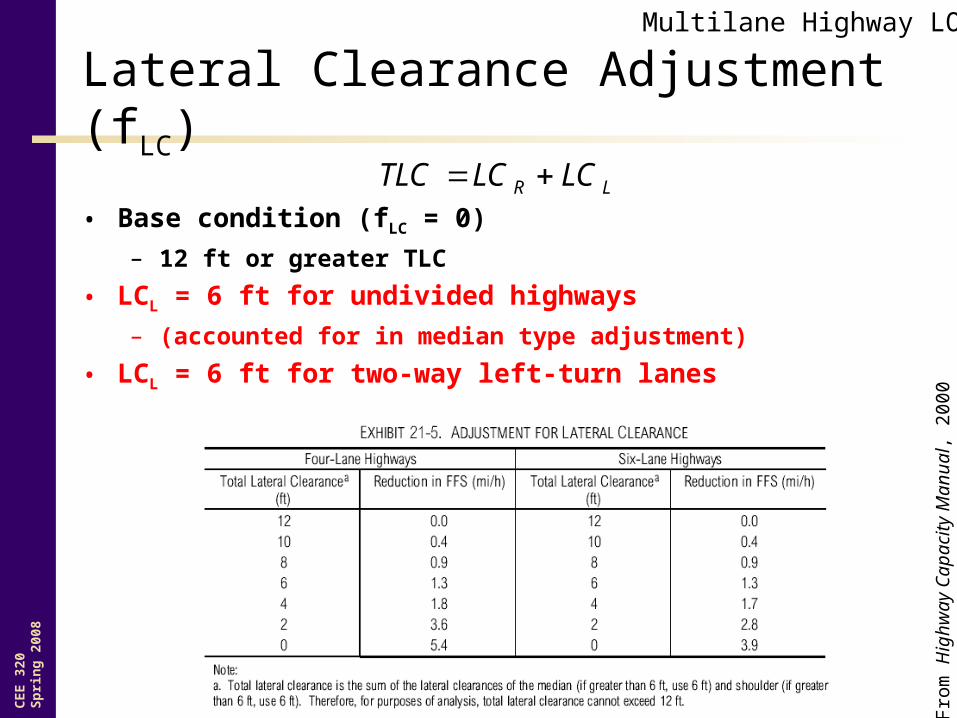
Lateral Clearance Adjustment (fLC)
• Base condition (fLC = 0)
– 12 ft or greater TLC
• LCL = 6 ft for undivided highways
– (accounted for in median type adjustment)
• LCL = 6 ft for two-way left-turn lanes
Fro
m H
ighw
ay C
apac
ity M
anua
l, 2
000
Multilane Highway LOS
LR LCLCTLC
CE
E 3
20S
pri
ng
200
8
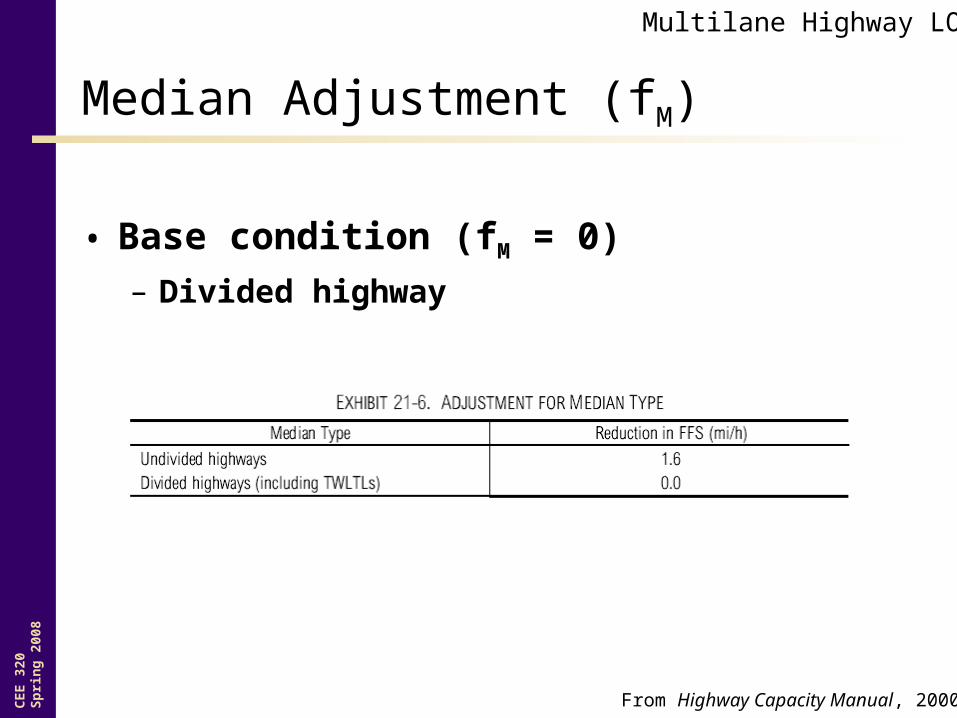
Median Adjustment (fM)
• Base condition (fM = 0)– Divided highway
From Highway Capacity Manual, 2000
Multilane Highway LOS
CE
E 3
20S
pri
ng
200
8
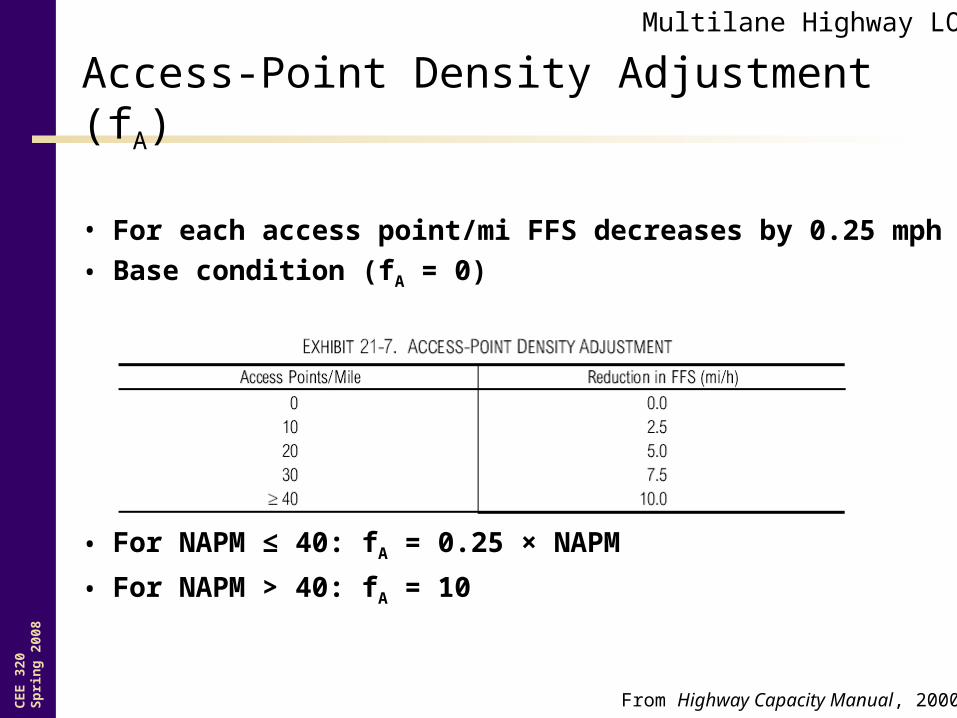
Access-Point Density Adjustment (fA)
• For each access point/mi FFS decreases by 0.25 mph
• Base condition (fA = 0)
– 0 access points per mile
• For NAPM ≤ 40: fA = 0.25 × NAPM
• For NAPM > 40: fA = 10
From Highway Capacity Manual, 2000
Multilane Highway LOS
CE
E 3
20S
pri
ng
200
8
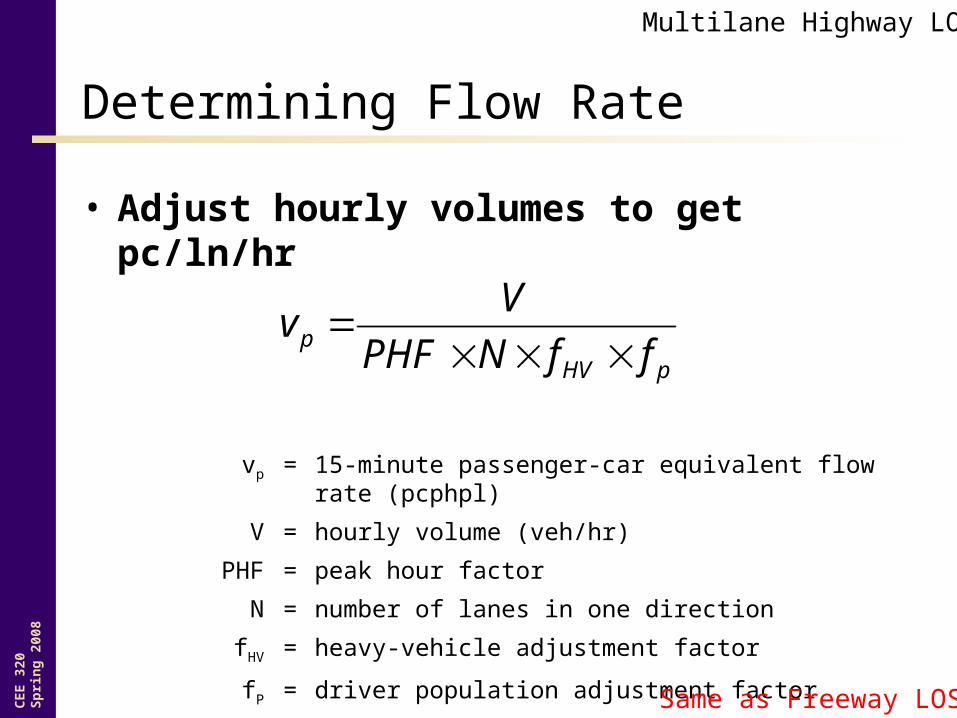
Determining Flow Rate
• Adjust hourly volumes to get pc/ln/hr
pHVp ffNPHF
Vv
vp = 15-minute passenger-car equivalent flow rate (pcphpl)
V = hourly volume (veh/hr)
PHF = peak hour factor
N = number of lanes in one direction
fHV = heavy-vehicle adjustment factor
fP = driver population adjustment factor
Multilane Highway LOS
Same as Freeway LOS
CE
E 3
20S
pri
ng
200
8
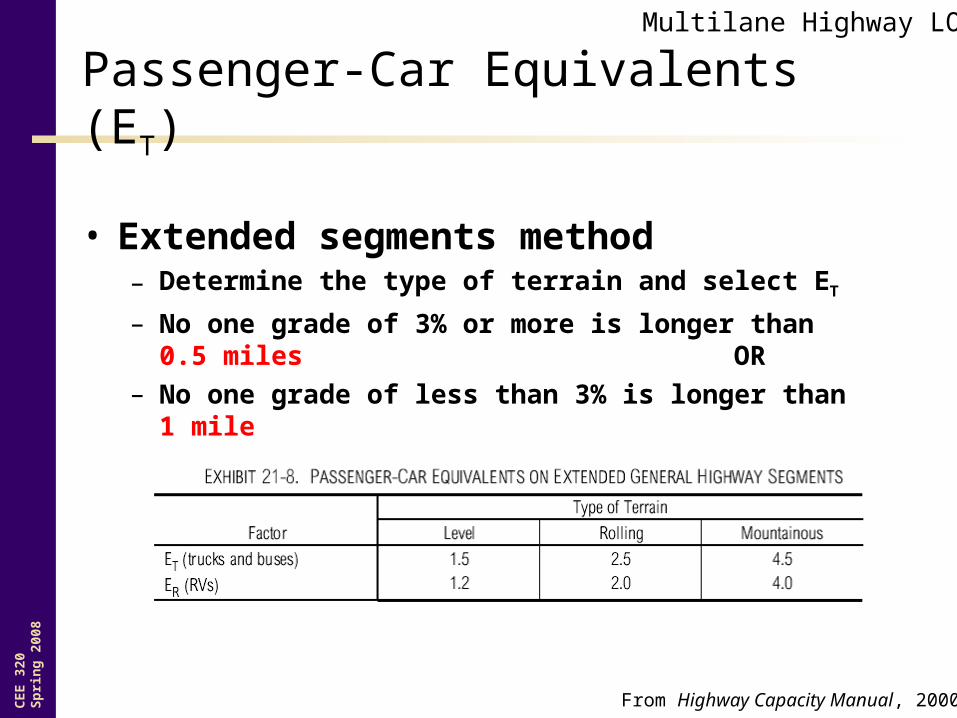
Passenger-Car Equivalents (ET)
• Extended segments method– Determine the type of terrain and select ET
– No one grade of 3% or more is longer than 0.5 miles OR
– No one grade of less than 3% is longer than 1 mile
From Highway Capacity Manual, 2000
Multilane Highway LOS
CE
E 3
20S
pri
ng
200
8
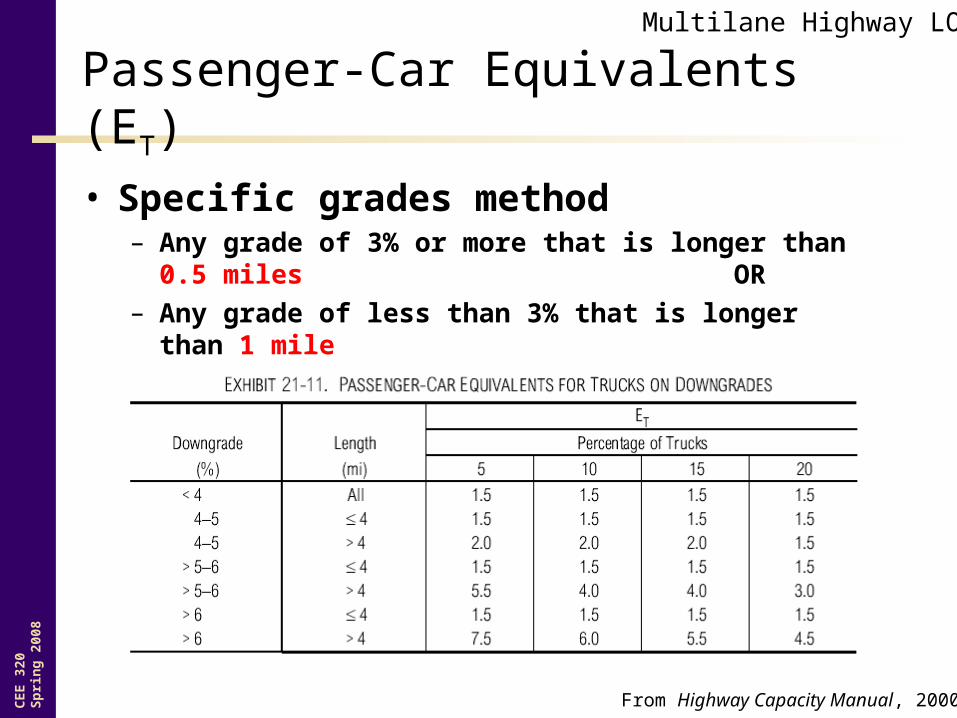
Passenger-Car Equivalents (ET)
• Specific grades method– Any grade of 3% or more that is longer than 0.5 miles
OR– Any grade of less than 3% that is longer than 1 mile
From Highway Capacity Manual, 2000
Multilane Highway LOS
CE
E 3
20S
pri
ng
200
8
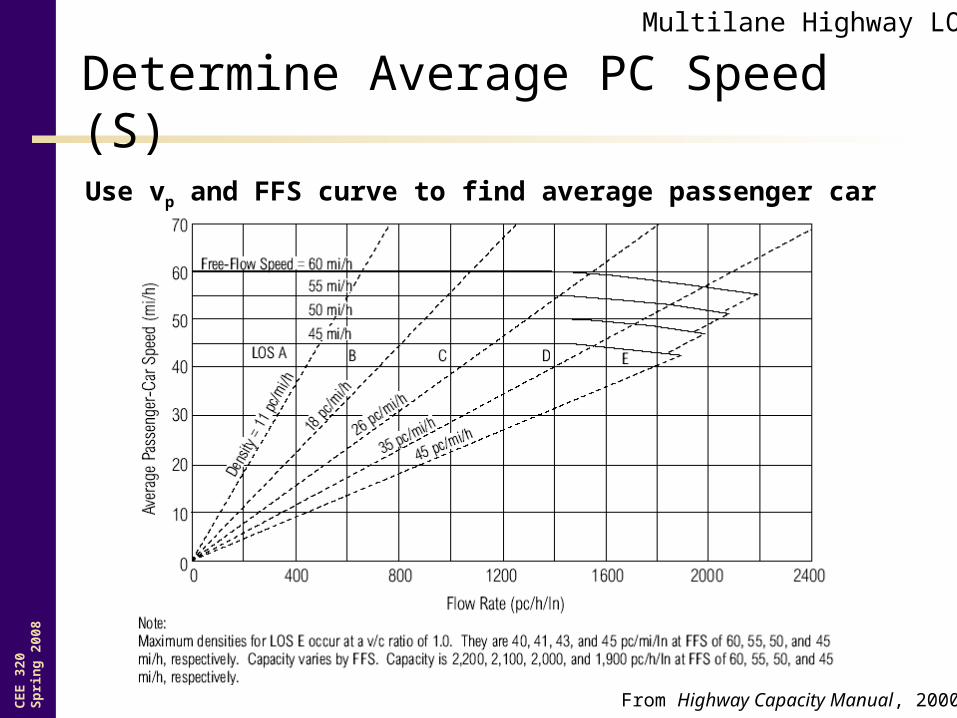
Determine Average PC Speed (S)
Use vp and FFS curve to find average passenger car speed (S)
From Highway Capacity Manual, 2000
Multilane Highway LOS
CE
E 3
20S
pri
ng
200
8
Fro
m H
ighw
ay C
apac
ity M
anua
l, 2
000
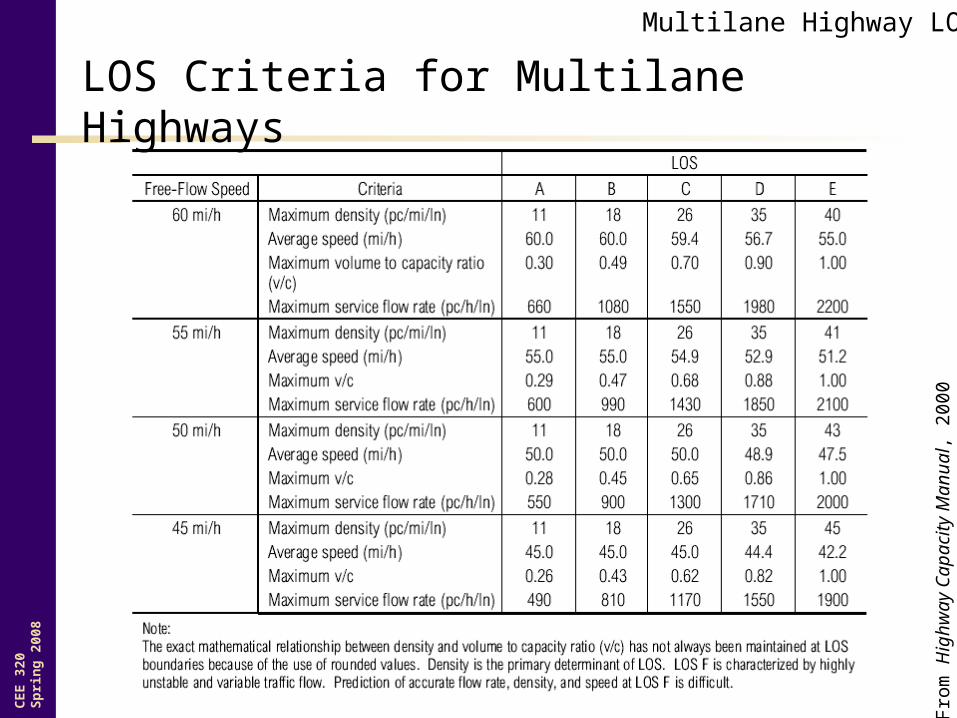
LOS Criteria for Multilane Highways
Multilane Highway LOS
CE
E 3
20S
pri
ng
200
8
Design Traffic Volumes
CE
E 3
20S
pri
ng
200
8
Design Traffic Volumes
• Need to select the appropriate hourly traffic volume to get the design LOS
CE
E 3
20S
pri
ng
200
8
Definitions
• Annual average daily traffic (AADT)– Annual traffic averaged on a daily basis
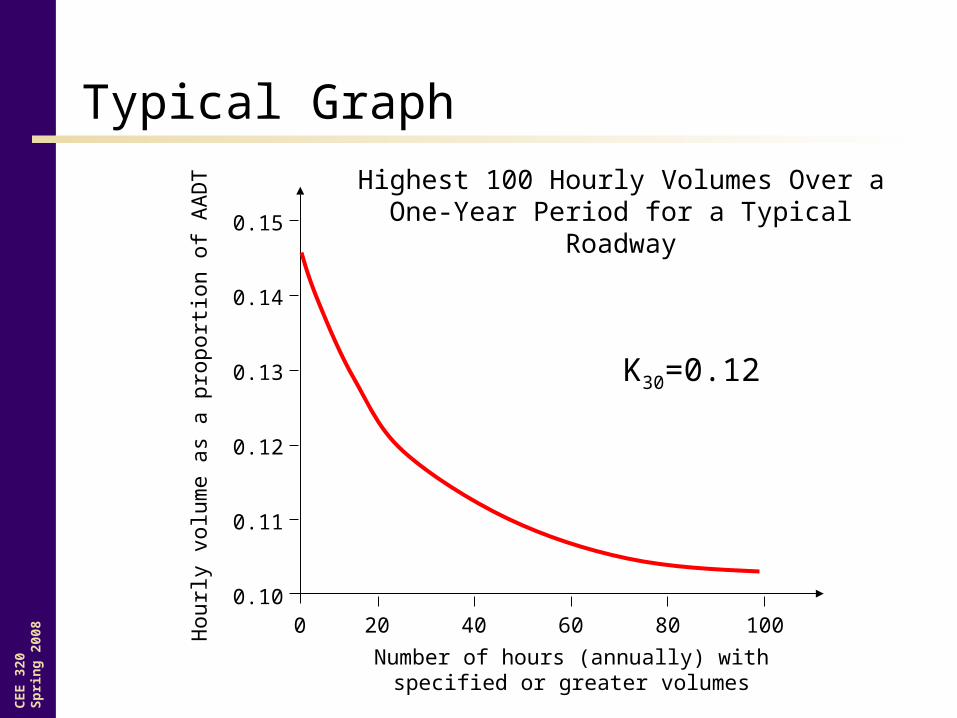
• Design hourly volume (DHV)– Traffic volume used for design calculations– Typically between the 10th and 50th highest volume hour
of the year (30th highest is most common)
• K-factor– Relationship between AADT and DHV
AADT
DHVK
CE
E 3
20S
pri
ng
200
8
Definitions
• Directional distribution factor (D)– Factor reflecting the proportion of peak-hour traffic
traveling in the peak direction– Often there is much more traffic in one direction than
the other
• Directional design-hour volume (DDHV)
AADTDKDDHV
CE
E 3
20S
pri
ng
200
8
Typical Graph
Hou
rly v
olum
e as
a p
ropo
rtio
n of
AA
DT
Number of hours (annually) withspecified or greater volumes
20 40 10060 8000.10
0.15
0.14
0.13
0.12
0.11
Highest 100 Hourly Volumes Over a One-Year Period for a Typical Roadway
K30=0.12
CE
E 3
20S
pri
ng
200
8
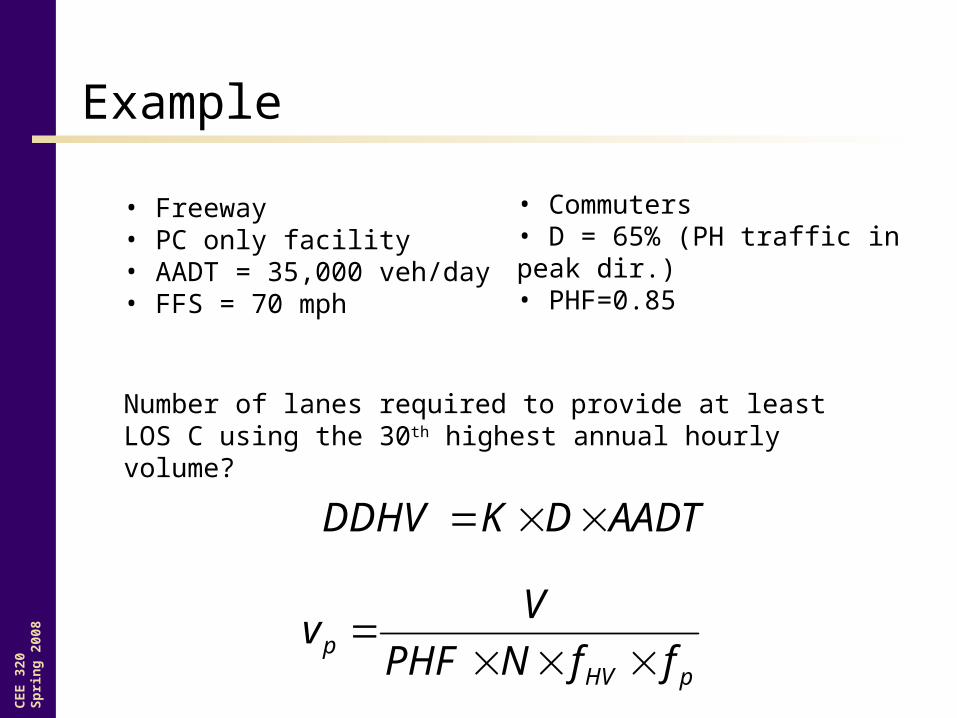
Example
• Freeway• PC only facility• AADT = 35,000 veh/day• FFS = 70 mph
Number of lanes required to provide at least LOS C using the 30th highest annual hourly volume?
pHVp ffNPHF
Vv
• Commuters• D = 65% (PH traffic in peak dir.)• PHF=0.85
AADTDKDDHV
CE
E 3
20S
pri
ng
200
8
Example
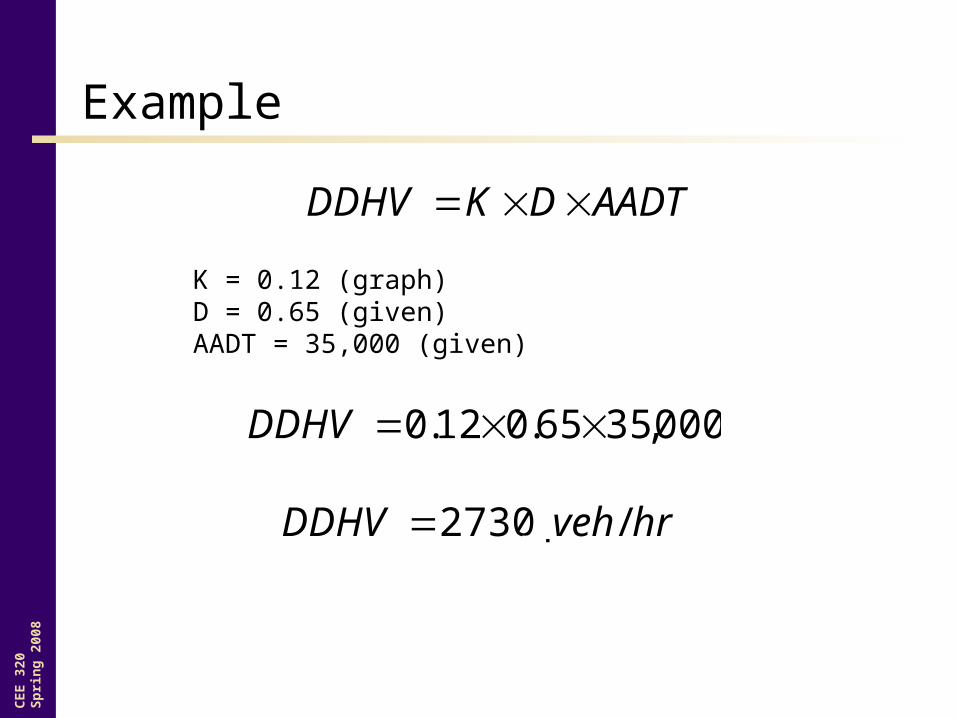
AADTDKDDHV
K = 0.12 (graph)D = 0.65 (given)AADT = 35,000 (given)
000,3565.012.0 DDHV
hrvehDDHV /_2730
CE
E 3
20S
pri
ng
200
8
Example
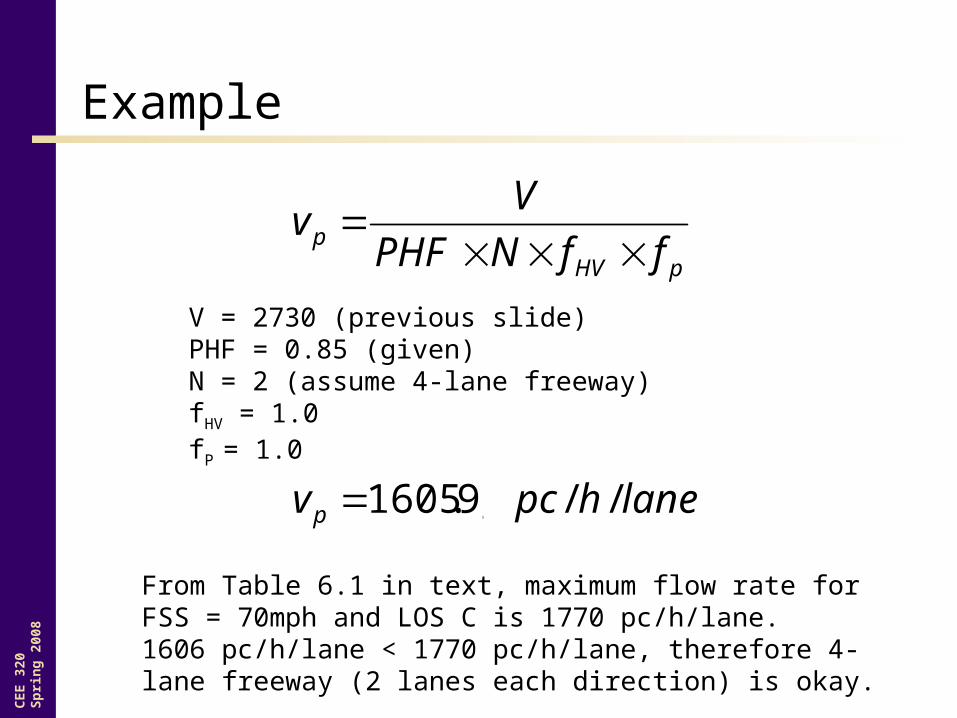
pHVp ffNPHF
Vv
V = 2730 (previous slide)PHF = 0.85 (given)N = 2 (assume 4-lane freeway)fHV = 1.0fP = 1.0
lanehpcvp //_9.1605
From Table 6.1 in text, maximum flow rate for FSS = 70mph and LOS C is 1770 pc/h/lane. 1606 pc/h/lane < 1770 pc/h/lane, therefore 4-lane freeway (2 lanes each direction) is okay.