geprüfter jahresbericht audited annual report -...
TRANSCRIPT
Geprüfter JahresberichtAudited Annual reportzum 31. März 2016 • as at March 31st, 2016
Richtlinienkonformer Investmentfonds Luxemburger Rechts
Directive‑compliant investment fund set up under Luxembourg law


1
zum 31. März 2016 • As at March 31st, 2016
Verwaltungsgesellschaft • Management Company
BayernInvest Luxembourg S.A.6B, rue Gabriel Lippmann, L-5365 Munsbach Handelsregister • Register of commerceR.C.S. Luxembourg B 37 803
Deutsche Wertpapier-Kennnummern/ISIN • German identification numbers/ISIN
DKB Neue Bundesländer Fonds ANL 921 867 LU0102278958DKB Europa Fonds AL A1C3WK LU0535527229DKB Europa Fonds InstAL2 A14WPP LU1262339143DKB Europa Fonds TNL 541 952 LU0117117746DKB Osteuropa Fonds TNL 795 321 LU0128942959DKB Nordamerika Fonds TNL 541 953 LU0117117829DKB Asien Fonds TNL 795 322 LU0128943502DKB Pharma Fonds AL 921 869 LU0102279501DKB Pharma Fonds TNL 541 954 LU0117118041DKB TeleTech Fonds AL 921 868 LU0102279253DKB TeleTech Fonds TNL 541 955 LU0117118124DKB Zukunftsfonds TNL A0M X5K LU0314225409DKB Ökofonds TNL A0N HJZ LU0355139220
Erläuterung Anteilklassen • Explanation of unit classes
ANL ==
ohne Ausgabeaufschlag/ausschüttendno-load fund/distribution of income
AL ==
mit Ausgabeaufschlag/ausschüttendload fund/distribution of income
TNL ==
ohne Ausgabeaufschlag/thesaurierendno-load fund/no distribution of income
InstAL2 ==
vorbehalten für institutionelle Investoren mit Ausgabeauschlag/ausschüttendreserved for institutional investors/load fund distribution of income
GEPRÜFTER JAHRESBERICHT • AUDITED ANNUAL REPORT
INHALT • CONTENTS
2
Management und Verwaltung • Management and administration 4
Bericht der Verwaltungsgesellschaft • Report of the Management Company 6
DKB Neue Bundesländer FondsVermögensaufstellung • Investment portfolio 19Verpflichtungen aus Derivaten •
Liabilities on derivatives 22Struktur des Wertpapiervermögens •
Structure of the investment portfolio 23Statistische Informationen • Statistical information 24Zusammensetzung des Teilfondsvermögens •
Statement of sub-fund assets 24Ertrags- und Aufwandsrechnung •
Statement of operations 25Entwicklung des Teilfondsvermögens •
Changes in sub-fund assets 26
DKB Europa FondsVermögensaufstellung • Investment portfolio 27Verpflichtungen aus Derivaten •
Liabilities on derivatives kötelezettségek derivatívokból 31
Struktur des Wertpapiervermögens • Structure of the investment portfolio 31
Statistische Informationen • Statistical information 32Zusammensetzung des Teilfondsvermögens •
Statement of sub-fund assets 34Ertrags- und Aufwandsrechnung •
Statement of operations 35Entwicklung des Teilfondsvermögens •
Changes in sub-fund assets 36
DKB Osteuropa FondsVermögensaufstellung • Investment portfolio 37Verpflichtungen aus Derivaten •
Liabilities on derivatives 41Struktur des Wertpapiervermögens •
Structure of the investment portfolio 41Statistische Informationen • Statistical information 43Zusammensetzung des Teilfondsvermögens •
Statement of sub-fund assets 43Ertrags- und Aufwandsrechnung •
Statement of operations 44Entwicklung des Teilfondsvermögens •
Changes in sub-fund assets 45
DKB Nordamerika FondsVermögensaufstellung • Investment portfolio 46Verpflichtungen aus Derivaten •
Liabilities on derivatives 50Struktur des Wertpapiervermögens •
Structure of the investment portfolio 50Statistische Informationen • Statistical information 51Zusammensetzung des Teilfondsvermögens •
Statement of sub-fund assets 52Ertrags- und Aufwandsrechnung •
Statement of operations 53Entwicklung des Teilfondsvermögens •
Changes in sub-fund assets 54
DKB Asien FondsVermögensaufstellung • Investment portfolio 55Struktur des Wertpapiervermögens •
Structure of the investment portfolio 58Statistische Informationen • Statistical information 59Zusammensetzung des Teilfondsvermögens •
Statement of sub-fund assets 59Ertrags- und Aufwandsrechnung •
Statement of operations 60Entwicklung des Teilfondsvermögens •
Changes in sub-fund assets 61
DKB Pharma FondsVermögensaufstellung • Investment portfolio 62Verpflichtungen aus Derivaten •
Liabilities on derivatives 67Struktur des Wertpapiervermögens •
Structure of the investment portfolio 67Statistische Informationen • Statistical information 68Zusammensetzung des Teilfondsvermögens •
Statement of sub-fund assets 69Ertrags- und Aufwandsrechnung •
Statement of operations 70Entwicklung des Teilfondsvermögens •
Changes in sub-fund assets 71
INHALT • CONTENTS

INHALT • CONTENTS
3
DKB TeleTech FondsVermögensaufstellung • Investment portfolio 72Verpflichtungen aus Derivaten •
Liabilities on derivatives 76Struktur des Wertpapiervermögens •
Structure of the investment portfolio 76Statistische Informationen • Statistical information 77Zusammensetzung des Teilfondsvermögens •
Statement of sub-fund assets 78Ertrags- und Aufwandsrechnung •
Statement of operations 79Entwicklung des Teilfondsvermögens •
Changes in sub-fund assets 80
DKB ZukunftsfondsVermögensaufstellung • Investment portfolio 81Struktur des Wertpapiervermögens •
Structure of the investment portfolio 84Statistische Informationen • Statistical information 85Zusammensetzung des Teilfondsvermögens •
Statement of sub-fund assets 85Ertrags- und Aufwandsrechnung •
Statement of operations 86Entwicklung des Teilfondsvermögens •
Changes in sub-fund assets 87
DKB Ökofonds 88Vermögensaufstellung • Investment portfolio 88Verpflichtungen aus Derivaten •
Liabilities on derivatives 92Struktur des Wertpapiervermögens •
Structure of the investment portfolio 93Statistische Informationen • Statistical information 94Zusammensetzung des Teilfondsvermögens •
Statement of sub-fund assets 94Ertrags- und Aufwandsrechnung •
Statement of operations 95Entwicklung des Teilfondsvermögens •
Changes in sub-fund assets 96
DKB KONSOLIDIERT • CONSOLIDATED 97Zusammensetzung des Fondsvermögens •
Statement of fund assets 97Ertrags- und Aufwandsrechnung •
Statement of operations 98Entwicklung des Fondsvermögens •
Changes in fund assets 99
Erläuterungen zum geprüften Jahresbericht • Notes to the audited annual report 100
Bericht des Réviseur d’Entreprises agréé • Report of the Réviseur d’Entreprises agréé 108

4
MANAGEMENT UND VERWALTUNG • MANAGEMENT AND ADMINISTRATION
Verwaltungsgesellschaft • Management company
BayernInvest Luxembourg S.A.6B, rue Gabriel LippmannL-5365 Munsbach
Verwaltungsrat • Board of directors
Vorsitzender • ChairmanDr. Volker van RüthSprecher der Geschäftsführung derBayernInvest Kapitalverwaltungsgesellschaft mbH, München
Stellvertretender Vorsitzender • Vice chairman
bis zum 31. Oktober 2015 • until October 31st, 2015Dr. Jörg SengerBankdirektor, Bereichsleiter Capital MarketsBayerische Landesbank, München
Mitglieder • Members
bis zum 31. Dezember 2015 • until December 31st, 2015Guy SchmitSprecher der Geschäftsführung derBayernInvest Luxembourg S.A., Luxembourg
Katja LammertGeschäftsführerin derBayernInvest Kapitalverwaltungsgesellschaft mbH, Münchenseit dem 1. November 2015 • since November 1st, 2015
Marjan GalunBereichsleiter Business Operations & Process ManagementBayernInvest Kapitalverwaltungsgesellschaft mbh, München
Geschäftsführer • Managing director
bis zum 31. Dezember 2015 • until December 31st, 2015Guy SchmitSprecher der Geschäftsführung derBayernInvest Luxembourg S.A., Luxembourg
bis zum 13. Mai 2016 • until May 13th, 2016Katja Mertes-TegebauerGeschäftsführerin derBayernInvest Luxembourg S.A., Luxembourg
Jörg SchwanitzGeschäftsführer derBayernInvest Luxembourg S.A., Luxembourg
seit dem 1. Juni 2016 • since June 1st, 2016Michael LöbSprecher der Geschäftsführung derBayernInvest Luxembourg S.A., Luxembourg
Initiator • Initiator
Deutsche Kreditbank AGTaubenstraße 7-9 D-10117 Berlin
Depotbank, Hauptzahl- und Transferstelle • Custodian bank, principal paying agent and transfer agent
M.M.Warburg & CO Luxembourg S.A.2, Place François-Joseph DargentL-1413 Luxembourg
Fondsmanager • Fund manager
BAWAG P.S.K. Invest GmbHGeorg-Coch-Platz 2 A-1010 Wien
Anlageberater • Investment advisor
BayernInvest Kapitalverwaltungsgesellschaft mbHKarlstraße 35D-80333 München
Zahlstelle in Deutschland (auch Informationsstelle) • Paying agent in Germany (also information agent)
Deutsche Kreditbank AGTaubenstraße 7-9D-10117 Berlin

5
MANAGEMENT UND VERWALTUNG • MANAGEMENT AND ADMINISTRATION
Vertriebs- und Zahlstelle in Ungarn • Sales and paying agent in Hungaria
MKB Bank Rt.Váci u. 38H-1056 Budapest V.
Zentraladministration, Service- und Registrierstelle • Central administration, service and register company
LRI Invest S.A.9A, rue Gabriel LippmannL-5365 Munsbach
Rechtsberater • Legal advisor
bis zum 29. Februar 2016 • until February 29 th, 2016Bonn & Schmitt22-24, rives de ClausenL-2015 Luxembourg
seit dem 1. März 2016 • since March 1st, 2016GSK STOCKMANN + KOLLEGEN44, Avenue John F. KennedyL-1855 Luxembourg
Réviseur d’Entreprises Agréé des Fonds und der Verwaltungsgesellschaft •Réviseur d’Entreprises Agréé of the fund and of the management company
KPMG LuxembourgSociété coopérativeCabinet de révision agréé39, Avenue John F. KennedyL-1855 Luxembourg
Steuerlicher Vertreter in Österreich • Tax agent in Austria
KPMG Austria GmbHWirtschaftsprüfungs- und SteuerberatungsgesellschaftPorzellangasse 51A-1090 Wien
6
BERICHT DER VERWALTUNGSGESELLSCHAFT • REPORT OF THE MANAGEMENT COMPANY
Rückblick Review
Die USA betreffend zeichnete sich zu Beginn des Berichts-zeitraums das Bild einer deutlichen Erholung ab. Vor allem die Lage am Arbeitsmarkt entwickelte sich derart zufrie-denstellend, dass die ersten Rufe nach einer Leitzinserhö-hung laut wurden.
The picture of a significant recovery in the USA began to emerge at the beginning of the reporting period. In par-ticular, the situation on the labour market developed so satisfactorily that the first calls for a rise in interest rates were raised.
Die Erholung am Arbeitsmarkt zeigte sich sowohl in rück-läufigen Erstanträgen auf Arbeitslosenunterstützung als auch in einer insgesamt rückläufigen Arbeitslosenquote. Die Partizipationsrate befand sich jedoch noch immer im negativen Wachstumsbereich. Dass dies aber zum einen auf eine alternde Bevölkerung und auf längere Ausbil-dungszeiten zurückzuführen ist, bestätigt die Annahme, dass es im Bereich der Beteiligung am Arbeitsmarkt deut-liche strukturelle Veränderungen gibt.
The recovery of the labour market was demonstrated through both the decline in initial applications for unem-ployment benefits and an overall decline in unemploy-ment. However, the participation rate was still in a negative growth area. This is partly due to an ageing population and more time being spent in education, which confirms the assumption that there are significant structural changes in terms of participation on the labour market.
Trotz dieser positiven Entwicklung konnte über den Berichtszeitraum kein deutlicher Lohndruck festgestellt werden. Ursächlich hierfür war die Rigidität der Löhne in den Krisenjahren. Gemessen an der Entwicklung der Arbeitslosenrate hätte die Dynamik des Lohnwachstums damals deutlich geringer ausfallen müssen. Lohnkürzun-gen fanden jedoch nicht statt. In der Konsequenz gingen und gehen aktuell keine deutlicheren Lohnsteigerungen mit der konjunkturellen Erholung einher. Diese sind erst dann zu erwarten, wenn der Arbeitsmarkt sich in einem Maß erholt hat, das dazu führt, dass zusätzliches Personal nur über höhere Löhne attrahiert werden kann.
Despite this positive development, no significant wage pressure was observed over the reporting period. This was due to the rigidity of wages during the crisis years. Judging by the change in the unemployment rate, the dynamics of wage growth should have been significantly less. How-ever, wage cuts did not take place. As a consequence, no significant wage increases have accompanied or are cur-rently accompanying the economic recovery. These are only to be expected if the labour market has recovered to such an extent that additional staff can only be attracted through higher wages.
Auch konsumseitig verbesserte sich der Datenkranz über den Berichtszeitraum hinweg. So notierte das Verbrau-chervertrauen zum Ende des Berichtzeitraums deutlich über der 80-Punkte-Marke. Auch das Jahreswachstum der Einzelhandelsumsätze befand sich auf einem komfor-tablen Wachstumsniveau, entsprach jedoch nur teilwei-se dem hervorragenden Konsumentenvertrauen. Grund hierfür war der Ölpreisrückgang, der zur Reduzierung der nominalen Umsätze an den Tankstellen führte. Insgesamt jedoch verzeichneten die Konsumausgaben der Ameri-kaner erfreuliche Zuwachsraten die zu deutlichen BIP-Wachstumsraten führten.
Data on the consumer side also improved over the report-ing period. For example, consumer confidence was consid-erably over the 80-point mark at the end of the reporting period. The annual growth in retail sales was also at a com-fortable growth level, but correlated only in part to the excellent consumer confidence. The reason for this was the fall in oil prices, which led to a reduction in nominal sales at filling stations. Overall, however, American consumer spending recorded satisfactory growth rates, which led to significant GDP growth rates.
Während zu Beginn und auch über den Berichtszeitraum hinweg nicht nur der Konsum, sondern auch der industri-elle Bereich vielversprechend liefen, zeichnete sich mit der aufkommenden Stärke des US-Dollars eine eher rückläu-fige Dynamik der Stimmungsindikatoren (ISM) und auch der harten Zahlen (Auftragseingänge) ab. Diese Entwick-lung verschärfte sich bis zum Ende des Berichtzeitraums.
While at the beginning and throughout the reporting period not only the consumption but also the industrial sector appeared promising, with the emerging strength of the US dollar came a rather declining trend in senti-ment indicators (ISM) and hard figures (incoming orders). This trend intensified by the end of the reporting period.

7
BERICHT DER VERWALTUNGSGESELLSCHAFT • REPORT OF THE MANAGEMENT COMPANY
Der Euroraum zeichnete zu Beginn des Berichtzeitraums ein dynamisches Bild. Das Wachstumsmomentum der Frühindikatoren zeigte nach oben und auch die Stim-mungsindikatoren verbesserten sich sowohl im Konsum- als auch im industriellen Bereich stetig.
A dynamic picture emerged in the eurozone at the begin-ning of the period under review. The growth momentum of early indicators pointed upwards and sentiment indi-cators improved steadily in both the consumption and industrial sectors.
Keine Dynamik zeigte jedoch die Inflationsrate. Sie ver-harrte nicht zuletzt ölpreisbedingt auf einem Niveau rund um die Null-Linie. Nicht zuletzt das zeitweise Absinken der Preissteigerung in negatives Terrain veranlasste die EZB im März 2015 ein Wertpapierkaufprogramm aufzulegen. Über den Ankauf von Staatsanleihen und Schuldtiteln europäi-scher Institutionen erhoffte man sich eine Ankurbelung der Kreditvergabe im Euroraum und damit einhergehend eine erhöhte Konsum- und Investitionstätigkeit, die zu Preisstei-gerungen führt. Bis zum Ende des Berichtzeitraums zeigte sich diesbezüglich jedoch kein Erfolg.
However, inflation rates remained stagnant. They remained at a level around the zero line, not least due to the price of oil. The ECB launched an asset purchase program in March 2015, prompted by the temporary drop of price increases into negative territory. Regarding the purchase of government bonds and debt securities from European institutions, it was hoped that boosting credit lending in the eurozone, and the consequential increased consump-tion and investment activity, would lead to price increas-es. However, by the end of the reporting period, this had proven to be unsuccessful.
Die Entwicklung an den internationalen Kapitalmärkten im Berichtszeitraum war gekennzeichnet durch eine hohe Vola-tilität bei den Renditen für europäische Staatsanleihen sowie bei den Kreditrisikoaufschlägen für Unternehmensanleihen. In Folge des Staatsanleihen Kaufprogramms der Europäi-schen Zentralbank sank die Rendite 10-jähriger Bundesan-leihen im April 2015 bis auf 0,04% ab, um dann innerhalb weniger Wochen wieder auf 1,06% anzusteigen. Ähnliche Renditesprünge verzeichneten Anleihen aus der europäi-schen Peripherie sowie Unternehmensanleihen. Kürzer lau-fende deutsche Staatsanleihen zeigten sich weniger volatil und verharrten im gesamten Berichtszeitraum im negativen Bereich. Nachdem die finanzielle Rettung Griechenlands im Juli 2015 in einer „last minute“-Konferenz beschlossen wurde, beruhigten sich die internationalen Kapitalmärk-te wieder deutlich und Renditen befanden sich wieder auf dem Rückzug. Die Marktteilnehmer beschäftigten sich ab dem 3.Quartal 2015 mit der Spekulation auf den Zeitpunkt der ersten Zinserhöhung der US-Notenbank FED nach neun-einhalb Jahren. Nachdem die FED-Vorsitzende Yellen den September-Termin für eine Zinserhöhung verstreichen ließ, interpretierten die Marktteilnehmer dies als ein Anzeichen für den schwachen Zustand der US-Wirtschaft. Aktienmärkte reagierten hierauf wieder mit fallenden Kursen und bilde-ten Ende September Jahrestiefststände aus, insbesonde-re die Kreditspreads von Unternehmensanleihen weiteten sich ebenfalls wieder deutlich aus bevor zum Jahresende eine Erholung einsetzte. Der anhaltende Verfall der Roh-stoff- und insbesondere der Ölpreise verstärkte zu Jahres-beginn 2016 jedoch wieder die globalen Konjunktursorgen und schürte erneute Deflationsängste. So fielen in den ers-ten beiden Monaten die Renditen für sichere Bundesanlei-hen erneut nahe ihrer Tiefstände vom Frühjahr 2015 und.
Developments on the international capital markets during the reporting period were characterised by high volatility both in European government bond yields and in credit spreads for corporate bonds. As a result of the European Central Bank’s government bond purchase programme, yields on 10-year German government bonds fell as low as 0.04% in April 2015, before recovering to 1.06% within a few weeks. Bonds in peripheral European countries and corporate bonds experienced similar yield jumps. Short-term German government bonds were less volatile, and they remained negative over the course of the reporting period. After Greece was bailed out in July 2015 following a last-minute conference decision, international capital markets experienced another period of significant calm, with yields on the decline once again. From Q3 2015 onwards, market participants were preoccupied by speculation around the timing of the US Federal Reserve’s first rate hike in 9.5 years. Chair of the FED Janet Yellen allowed the September deadline for a rate hike to elapse, with market participants interpreting this as an indication of the weak state of the US economy. Equity markets reacted to this with further price drops and reached annual lows at the end of September, with credit spreads for corporate bonds in particular significantly widening, before beginning to recover at the end of the year. However, the continuing fall in commodity prices and, in particular, oil prices led to intensified global economic worries at the start of 2016, as well as stoking renewed fears of deflation. In the first two months of the year, therefore, yields on secure German government bonds fell again as they closed in on the lows of spring 2015, and corporate bonds had to cope with

8
BERICHT DER VERWALTUNGSGESELLSCHAFT • REPORT OF THE MANAGEMENT COMPANY
Unternehmensanleihen mussten erhebliche Verluste einste-cken bevor die EZB in ihrer März Sitzung erneut die Zinsen senkte und eine Ausweitung ihres Kaufprogramms beschloss
substantial losses before the ECB’s March meeting, where it cut interest rates once more and decided to extend its asset purchasing programme.
Nach einem guten Start in das Jahr 2015 konnten die inter-nationalen Aktienbörsen ihre im ersten Quartal erziel-ten Gewinne nicht weiter verteidigen. Von April bis Ende September 2015 lasteten zunehmend globale Konjunk-tursorgen auf den Märkten und führten schließlich über den Sommer 2015 zu deutlichen Kursabgaben. Auch der sich erneut einstellende negative Trend bei den Gewinn-revisionen belastete das Sentiment ganz offensichtlich spürbarer als noch in den Jahren zuvor als die Aktionen der Notenbanken alles Negative in seiner Wirkung mehr als ausgleichen konnten.
After a good start to 2015, international equity markets were unable to keep up the profit levels they achieved in the first quarter. Global economic concerns increasingly weighed on the markets between April and the end of Sep-tember 2015 and ultimately led to significant price drops during the summer of 2015. The recent negative trend in earnings revisions also weighed on sentiment, and was much easier for the public to spot than in previous years when central banks’ measures were able to more than off-set the negative effects.
Dennoch dürften es gerade weitere Interventionen und Aussagen diverser Notenbanken gewesen sein, die im Oktober und November für einen nochmaligen zwischen-zeitigen Stimmungsumschwung und somit wieder stei-gende Notierungen sorgten. Doch schon der Verlauf des Novembers signalisierte eine wieder differenziertere Sicht-weise. Dem sich immer klarer abzeichnenden Bild einer ers-ten Zinsanhebung in den USA standen hohe Erwartungen auf eine nochmalige deutliche Ausweitung der geldpoli-tischen Lockerung seitens der EZB gegenüber. Als dann diese Hoffnungen zumindest teilweise enttäuscht wurden reagierten die Märkte mit spürbaren Gewinnmitnahmen im Dezember und zu Beginn des Jahres 2016. Und obwohl die Kurse ab Mitte Februar 2016 zu einer deutlichen Erho-lung ansetzen konnten, verbleiben unter dem Strich deut-liche Kursrückgänge in dieser Berichtsperiode.
It still fell on various central banks to implement fur-ther interventions and make further statements, as they brought about another swing in the mood in the time between October and November, which in turn brought price increases. However, in November the perspective changed yet again. The increasingly clear image of a first rate hike in the USA raised high expectations of there being another substantial expansion of monetary easing by the ECB. When these hopes were at least partially dashed, the markets reacted with considerable profits being taken in December and at the beginning of 2016. Although prices were showing signs of real recovery as of mid-February 2016, the bottom line is there were still significant price drops in this reporting period.
Zu Beginn des Berichtszeitraums wertete der Euro-Dollar-Wechselkurs zunächst auf bevor eine Seitwärtsbewegung einsetzte. Der Berichtszeitraum war geprägt von mehreren Richtungswechseln innerhalb einer engen Handelsspanne von 10 Cents. Maßgeblich für diese Seitwärtsbewegung war die Divergenz der Zentralbankpolitiken in den USA und Europa bzw. die wechselnde Erwartungshaltung der Marktteilnehmer hierüber. Während die amerikanische Notenbank FED erste Zinserhöhungen ins Auge fasste ver-folgte ihr europäisches Pendant EZB hingegen eine Aus-weitung ihrer lockeren Geldpolitik. Per Saldo führte dies zu einer Ausweitung des Zinsvorteils von in USD deno-minierten Anlagen und gleichzeitig erhielt der US-Dollar Unterstützung durch Kapitalzuflüsse. Allerdings wurden die hohen Erwartungen an die konjunkturelle Entwicklung der USA zeitweise enttäuscht, so dass die Gemeinschafts-währung wieder etwas verlorenes Vertrauen zurück gewin-nen und sich im Frühjahr/Sommer leicht festigen konnte.
The euro-dollar exchange rate appreciated initially at the beginning of the reporting period, before settling into a sideways movement. The reporting period was marked by several changes of direction within a narrow range of 10 cents. A crucial factor in this sideways movement was the divergence of the US and European central bank policies and the changing expectations of market participants in these two areas. While the US Federal Reserve envisaged the first interest rate rises, its European counterpart, the ECB, opted to expand its relaxed monetary policy. On bal-ance, this led to an increase in the interest advantage of investments denominated in USD, while the US dollar was boosted by capital inflows. However, the high expecta-tions of the economic development of the United States were temporarily not met, resulting in the euro being able to win back some lost confidence and strengthen slight-ly in the spring/summer. A first FED rate hike in Decem-ber 2015 was preceded by an ever stronger US dollar.

9
BERICHT DER VERWALTUNGSGESELLSCHAFT • REPORT OF THE MANAGEMENT COMPANY
Einem ersten Zinsschritt der amerikanischen Notenbank im Dezember 2015 ging noch ein festerer US-Dollar vor-aus. Dieser litt in Folge allerdings von der gestiegenen Unsicherheit gegenüber weiteren Zinsschritten. Gegen-über dem japanischen Yen tendierten beide Währungen unter Schwankungen seitwärts.
However, this suffered as a result of increased uncertainty around further rate hikes. Against the Japanese yen, both currencies trended sideways with fluctuations.
Ausblick Outlook
Die USA betreffend erwartet man für das bevorstehende Geschäftsjahr ein nur moderates Wachstum. Aufgrund der deutlichen Belastung des industriellen Bereiches wird der Hauptwachstumstreiber im Jahr 2016 der Konsum sein. Einer Vielzahl von Faktoren werden jedoch einer dynami-schen Entwicklung des Konsums entgegenstehen.
As far as the USA is concerned, only moderate growth was expected for the upcoming financial year. Due to the con-siderable impact of the industrial sector, the main growth driver in 2016 will be consumption. However, a variety of factors will be offset by a dynamic development of consumption.
So geht man davon aus, dass die Lohnsteigerungsra-ten im bevorstehenden Geschäftsjahr den Kaufkraftver-lust aus den erwarteten steigenden Inflationsraten nicht kompensieren werden können. Außerdem lässt die Tatsa-che, dass die Erholung am Arbeitsmarkt bereits sehr weit fortgeschritten ist, den Schluss zu, dass deutliche Konsu-mimpulse ausgehend von einer deutlichen Zunahme der Beschäftigung, nicht zu erwarten sind. Zusätzlich könnte der bereits sehr hoch bewertete Aktienmarkt in den USA zu einem negativen Vermögenseffekt führen, der nicht nur die Konsumentenstimmung, sondern auch die tatsächli-chen Konsumausgaben belastet.
As such, wage growth rates are not expected to compen-sate for the loss of purchasing power from the expected rising rates of inflation in the upcoming financial year. In addition, the fact that the recovery of the labour market is already well advanced allows us to conclude that signifi-cant consumer impulses arising from a significant increase in employment cannot be expected. Moreover, the already very highly valued stock market in the USA could lead to a negative wealth effect which not only affects consumer sentiment, but also actual consumer spending.
In der Konsequenz erwartet man auch nur zwei weitere Zinsschritte im bevorstehenden Geschäftsjahr.
As a consequence, only two more rate hikes are to be expected in the upcoming financial year.
Ähnlich wie in den USA zeichnet sich auch in der Eurozo-ne keine überdurchschnittliche Wachstumsdynamik ab. So wird auch hier der bisher stützende Sonderfaktor „nied-riger Ölpreis“ mit der sich bereits abzeichnenden Stabili-sierung der Ölpreise in Teilen entfallen. Zudem belasten noch immer strukturelle Sonderfaktoren.
As in the US, no exceptional growth dynamic is apparent in the eurozone. This means that the previously support-ive special factor of a low oil price is also no longer rele-vant given that oil prices have already begun to stabilise in many areas. In addition, there are still ever more struc-tural special factors in play.
Die Maßnahmen der EZB werden auch im bevorstehen-den Geschäftsjahr wohl nicht die gewünschten Effekte wie etwa die deutliche Ankurbelung der Kreditvergabe nach sich ziehen. Mit einer Zinsanhebung seitens der EZB ist auch im bevorstehenden Geschäftsjahr nicht zu rechnen. Die Inflationsraten werden sich jedoch aufgrund eines sich stabilisierenden Ölpreises und den damit einhergehenden auslaufenden Basiseffekt wieder in Richtung des EZB-Ziels von 2% bewegen. Dies wird jedoch sehr langsam erfolgen und frühestens zur Jahresmitte beginnen.
The ECB’s measures will probably not have the desired effects, such as the significant boost to credit lending, in the upcoming financial year. The ECB is not expected to increase interest rates in the upcoming financial year. However, as a result of stabilising oil prices and the asso-ciated dampening base effect, inflation rates will move back towards the ECB target of 2%. This will, however, be done very slowly and will begin in the middle of the year at the earliest.

10
BERICHT DER VERWALTUNGSGESELLSCHAFT • REPORT OF THE MANAGEMENT COMPANY
Renten- und Aktienmärkte Bond and equity markets
Mit den jüngsten Maßnahmen der EZB wird deutlich, dass auch im kommenden Jahr die Notenbankzinsen auf Rekordtiefs verharren werden. Da auch die Erwartungen an Zinssteigerungen der US Notenbank zunehmend unre-alistisch erscheinen, muss mit volatilen Zinsmärkten auf absolut niedrigem Niveau gerechnet werden. Einen ent-scheidenden Einfluss werden dabei die Rohölpreise haben, die letztlich Höhe und Zeitpunkt des Basiseffektes für die Inflationsrate bestimmen werden. Insgesamt muss in den kommenden 12 Monaten mit einer sowohl in den USA als auch Europa seitwärts bis leicht aufwärts gerichteten Tendenz bei den Kapitalmarktzinsen gerechnet werden, wobei sich bei anziehenden Inflationsraten eine leich-te Versteilerung der Zinsstrukturkurven einstellen sollte. Spreadprodukte werden aufgrund des allgemeinen Nied-rigzinsumfelds, einer moderaten Konjunkturentwicklung und Stützungsmaßnahmen der EZB nachgefragt bleiben und sich tendenziell weiter einengen.
The recent actions of the ECB have made it clear that central bank interest rates will remain at record lows in the coming year. Given that expectations of interest rate increases by the FED also appear increasingly unrealistic, volatile interest rate markets are expected to remain at their absolute lowest level. Crude oil prices play a decisive role in this process as they ultimately determine the level and timing of the base effect for the inflation rate. Over-all, a sideways to slightly upward trend in capital market interest rates is to be expected in the next 12 months in both the US and Europe, with a slight steepening of inter-est rate curves should inflation rates begin to rise. Spread products will remain in demand and their tendency to nar-row will continue due to generally low interest rates, mod-erate economic growth and the ECB’s support measures.
Der Ausblick auf die Aktienmärkte steht mehr denn je im Spannungsfeld zwischen sich nur moderat entwickelnden Konjunkturen, diversen möglichen Event-Risiken (wie z.B. „Brexit“, Flüchtlingskrise in Europa, Ölpreisschock oder wachsender internationaler Terrorismus) und der Frage des potentiellen Erfolgs möglicherer weiterer Stützungsmaß-nahmen der weltweiten Zentralbanken. Die bisher gefühl-te „Allmacht“ der Notenbanken wird heute zusehends in Zweifel gezogen, so dass tatsächliche fundamentale Ent-wicklungen in der Wirtschaft und in den Unternehmen wieder vordergründig betrachtet werden dürften. Hier spricht vorerst vieles für eine Fortsetzung des weltweit eher unterdurchschnittlichen Wachstumspfades. Damit verbunden sollten auch nur moderate Zuwächse bei den Unternehmensgewinnen verbunden sein. Diese für Aktien erst einmal eher gedämpft anmutenden Aussichten ver-bessern sich allerdings deutlich beim Blick auf die relative Attraktivität anderer Assetklassen. Investoren befinden sich weltweit in einem „Anlagenotstand“. Festverzinsliche Wert-papiere von als sicher geltenden Emittenten bieten immer niedrigere Kupons und rentieren über weite Strecken der Laufzeitkurve im negativen Bereich. Aktien dagegen wei-sen zurzeit einen steigenden Trend bei den Dividenden-zahlungen auf und können noch als weitgehend neutral bewertet gelten.
The outlook for equity markets is based more than ever before on the tightrope between economies that are only growing moderately, the risk of various potential events (e.g. the “Brexit” referendum, the refugee crisis in Europe, an oil price shock and growing international terrorism) and the potential success of any further support meas-ures from global central banks. The previously perceived “omnipotence” of the central banks is now increasingly being called into question, with the result that truly funda-mental economic and corporate developments are being brought back to the fore. One example of such develop-ments is the continued below-average growth levels cur-rently seen around the world, as well as the issue of only moderate growth in corporate profits. This initially rather subdued outlook for equities improves significantly, how-ever, when the relative attractiveness of other asset classes is taken into account. Investors worldwide are currently experiencing an “investment crisis”. Fixed-interest securi-ties from issuers that are deemed safe always offer lower coupon rates and yields from long stretches of the matu-rity curve in the negative section. Equities, on the other hand, are currently showing an upward trend in dividend payments and can still be considered as broadly neutral in value.

11
BERICHT DER VERWALTUNGSGESELLSCHAFT • REPORT OF THE MANAGEMENT COMPANY
USD USD
Aufgrund der unterschiedlichen konjunkturellen Verfas-sung und der entsprechenden Zinspolitik in den USA und dem Euroraum sollte der US-Dollar weiter nachgefragt bleiben und die Gemeinschaftswährung immer wieder zur Schwäche neigen. Nachlassende Unterstützung könnte der Euro noch durch den Renditeaufschlag der Periphe-rieländeranleihen erhalten. Sollte sich die amerikanische Volkswirtschaft besser entwickeln als die Konjunktur in Euroland – begleitet von weiteren Zinserhöhungen sei-tens der amerikanischen Zentralbank – führt dies zu einer gestiegenen Attraktivität von festverzinslichen Anlagen außerhalb des Euroraums. Die internationalen Kapitalströ-me würden dann vermehrt in USD-denominierte Anla-gen fließen und eine leichte Aufwertung des Greenbacks unterstützen.
Due to the different economies and the respective inter-est rate policies in the US and the eurozone, the US dol-lar should continue to be in demand and the euro will again tend towards weakness. The euro is still likely to be bolstered to a lesser extent by the yield premiums on peripheral state bonds. If the US economy develops bet-ter than economies in the eurozone – accompanied by further interest rate increases by the American central bank – this will make fixed-interest investments outside the eurozone more attractive. International capital streams would then increasingly flow into investments denominat-ed in US dollars and bolster a slight increase in the value of the greenback.
JPY JPY
Auch gegenüber dem Yen wirkt die Attraktivität der Zins-anlagen in der Peripherie der Eurozone im allgemeinen Niedrigzinsumfeld unterstützend. Hinzu kommt, dass Japan größere Lockerungsmaßnahmen zur Stützung der heimischen Wirtschaft durchführt und beabsichtigt, mit-telfristig nachhaltig positive Inflationsraten zu erreichen. Diese expansiven Maßnahmen sollten gemeinsam mit dem Lockerungskurs der europäischen Zentralbank EZB für zunehmenden Abwertungsdruck auf den Yen, respek-tive auf den Euro sorgen und per Saldo zu einer Seitwärts-bewegung des Wechselkurses EUR/JPY führen.
The attractiveness of fixed-income investments in the peripheral eurozone states in the general low interest rate environment will also play a supporting role against the yen. Moreover, Japan is implementing major easing measures to support the domestic economy and intends to achieve lasting positive inflation rates in the medium term. These expansionary measures, together with the easing stance of the European Central Bank (ECB), should ensure increasing downward pressure on the yen in rela-tion to the euro and lead, on balance, to a sideways trend in the EUR/JPY exchange rate.
DKB Neue Bundesländer Fonds DKB Neue Bundesländer Fonds
Über weite Abschnitte des Berichtszeitraums 01.04.15 – 31.03.16 standen deutsche Aktien unter Abgabedruck. So gab der DAX per Saldo um rund 17% nach. Deutsche Staats-anleihen konnten zwar leicht zulegen, allerdings gelang es ihnen in der Regel nicht, in einem gemischten Portfo-lio die höheren Verluste der Aktienseite auszugleichen.
Over long periods of the reporting period from 01.04.15 - 31.03.16, German equities came under sell-off pressure. As such, the DAX lost about 17% on balance. German govern-ment bonds rose slightly, but they largely failed to offset the higher losses on the equity side in a mixed portfolio.
Vor diesem Hintergrund fällt jedoch das Ergebnis des DKB Neue Bundesländer Fonds mit rund +1,3% erfreu-lich aus. Entscheidend für die positive Wertentwicklung des abgelaufenen Geschäftsjahres war die gute Perfor-mance der hochgewichteten Aktientitel. So stiegen z.B. die beiden größten Aktienpositionen Jenoptik und Carl Zeiss Meditec um +16,65% resp. +11,67% deutlich gegen den Markttrend.
Against this background, however, the result of the DKB Neue Bundesländer Fonds was pleasing at about +1.3%. Crucial for the positive value performance of the past finan-cial year was the good performance of the higher weight-ed equities. For instance, the two largest equity positions, Jenoptik and Carl Zeiss Meditec, rose strongly by +16.65% and +11.67% against the market trend.

12
BERICHT DER VERWALTUNGSGESELLSCHAFT • REPORT OF THE MANAGEMENT COMPANY
Erneut profitierten diverse Aktien von Übernahmeange-boten wie Deutsche Wohnen. Das Anleihenportfolio ent-wickelte sich bis auf eine Ausnahme erfreulich: Mit der Insolvenz von German Pellets mussten deutliche Kursab-schläge hingenommen werden.
Various stocks benefited again from takeover bids, such as Deutsche Wohnen. The bond portfolio performed pleas-ingly with one exception: with the insolvency of German Pellets, strong price falls were posted.
Die Aktienauslastung wurde über weite Zeiträume in der Nähe der Maximalquote von 50% des Fondsvermögens gehalten. Temporär erfolgte eine Teilabsicherung der Akti-enbestände mit Indexfutures und sonstigen derivativen Instrumenten. Deren Einsatz lieferte bei vergleichbar gerin-gem Risiko einen spürbaren Ergebnisbeitrag.
The equity utilisation was held near the maximum rate of 50% of fund assets over long periods. Temporarily, a par-tial hedge of the equity holdings was carried our using index futures and other derivative instruments. Their use made a tangible contribution to the result at a compara-tively low risk.
DKB Europa Fonds DKB Europa Fonds
Über weite Abschnitte des Berichtszeitraums 01.04.15 – 31.03.16 standen europäische Aktien unter Abgabedruck. Entsprechend musste auch der DKB Europa Fonds per Saldo marktbedingt Kursrückgänge verzeichnen. Wie schon in den vergangenen Jahren wurde bei der Zusam-menstellung des Fondsportfolios auf dividendenstarke Aktien gesetzt, bei denen die Verschuldungssituation und die Profitabilität des Geschäftsmodells auf stabile bzw. wachsende zukünftige Ausschüttungen schließen las-sen. Entsprechend mittel- bis langfristig ist der Invest-menthorizont ausgerichtet, ein vollständiger Austausch von Einzeltiteln erfolgt nur in Fällen, in denen die Divi-dendenzahlungsfähigkeit nachhaltig in Frage gestellt ist.
Over long periods of the reporting period from 01.04.15 - 31.03.16, European equities came under sell-off pressure. Accordingly, the DKB Europa Fonds was also forced to post price falls on balance due to the market. As in previous years, high dividend-yielding equities were favoured in the composition of the fund portfolio, for which the debt situation and the profitability of the business model sug-gest stable or growing future distributions. The investment horizon has an accordingly medium- to long-term align-ment, a complete exchange of individual stocks is only carried out in individual cases in which the ability to pay dividends is questioned fundamentally.
Die Aktienauslastung wurde über weite Strecken in der Nähe eines Vollinvestments gehalten, um damit der grund-sätzlich hohen relativen Attraktivität des Aktienmarktes gegenüber der überwiegenden Mehrheit anderer Asset-klassen Rechnung zu tragen. Die vergangenen Mona-te waren allerdings auch von politischen und sonstigen Event-Risiken (wie zum Beispiel der Flüchtlingskrise in Europa oder einer wachsenden weltweiten Terrorgefahr) geprägt, die das fundamentale Geschehen an Märkten zwischenzeitlich überlagerten. Um diesem beschriebenen Spannungsfeld gerecht zu werden, erfolgten temporäre Absicherungen für Teile des Portfolios mit Hilfe von Deriva-ten. Wo nachhaltig positive Tendenzen in der Entwicklung der relativen Performance einzelner Branchen zu erkennen waren, wurde vor allem über den Einsatz entsprechender Branchen-ETFs eine Höhergewichtung der jeweiligen Sek-toren vorgenommen, um somit das günstige Momentum ausnutzen zu können.
Equity utilisation was held close to full investment over long periods in order to thereby take into account the fundamentally high relative attractiveness of the equity market compared to the overwhelming majority of other asset classes. The past months were, however, also domi-nated by political and other event risks (such as the migra-tion crisis in Europe or a growing global terrorism threat), which occasionally overshadowed the fundamental events in markets. To address this stress field, temporary hedg-es were made for parts of the portfolio with the use of derivatives. Where sustainably positive tendencies in the relative performance of individual sectors were identified, a higher weighting of the relevant industries was carried out by using corresponding sector ETFs in order to utilise the favourable momentum.

13
BERICHT DER VERWALTUNGSGESELLSCHAFT • REPORT OF THE MANAGEMENT COMPANY
DKB Osteuropa Fonds DKB Osteuropa Fonds
Im abgelaufenen Berichtszeitraum musste ein Großteil der Aktienmärkte Osteuropas deutliche Kursrückgänge hinnehmen. Positive Ausnahme bildete im vergangenen Jahr die Budapester Börse.
In the past reporting period, the majority of the equity markets of Eastern Europe saw strong price losses. A posi-tive exception was the Budapest stock exchange last year.
Topthemen im abgelaufenen Berichtsjahr waren weiterhin die Sanktionen gegen Russland, die Ölpreisentwicklung sowie die Stimulierungsmaßnahmen der EZB. Darüber hin-aus spielten die verschärfte Situation in Syrien, der damit verbundene Flüchtlingsstrom und die anschließenden Spannungen innerhalb der EU und mit anderen betroffe-nen Ländern eine wichtige Rolle.
The top subjects over the past reporting year continued to be the sanctions imposed on Russia, the oil price per-formance and the ECB’s stimulus measures. In addition, the more serious situation in Syria, the associate flow of refugees and the subsequent tensions within the EU and with other countries affected played an important role.
Der russische Aktienindex konnte im Sog des wieder steigenden Ölpreises nach anfänglich deutlichen Kurs-verlusten wieder Boden gut machen. Die Türkei konn-te mit einem guten Wirtschaftswachstum und niedrigen Arbeitslosenzahlen aufwarten. Der Aktienmarkt in Istan-bul liegt jedoch auf Jahressicht trotzdem im negativen Terrain, entwickelte sich aber vor allem ab Februar 2016 sehr erfreulich.
The Russian equity market gained ground again follow-ing a recovering oil price after initial strong price losses. Turkey presented good economic growth and low unem-ployment figures. The equity market in Istanbul is, howev-er, in negative territory year on year, but performed very pleasingly from February 2016 in particular.
Der polnische Aktienmarkt wurde vorwiegend politisch beeinflusst. Unter dem Eindruck der Wahlen und einer neuen Regierung kamen vor allem Bankaktien unter Druck, die unter der Last der Kredite in Schweizer Franken zu lei-den hatten. Dazu kamen neue Steuern im Konsumbereich und kontroverse Pläne bei den Energieunternehmen.
The Polish stock market was mainly influenced political-ly. Under the impact of elections and a new government, banking stocks came under particular pressure, which suffered from the load of loans in Swiss francs. Taxes in the consumption area and controversial plans at energy companies added to this.
Der Gewinner im letzten Jahr war eindeutig die ungarische Börse. Das gestiegene Investoreninteresse traf dabei auf das niedrige Handelsvolumen in Budapest und trieb die Kurse überdurchschnittlich in die Höhe.
Last year’s winner was clearly the Hungarian stock exchange. Investors’ greater interest met the low trading volume in Budapest and drove prices in Budapest above average.
Der DKB Osteuropa Fonds wurde im Berichtszeitraum sehr aktiv gemanagt. Im ersten Quartal 2016 wurde der Tür-keianteil erhöht, abgebaut wurden Positionen in Polen, Ungarn und der Tschechischen Republik. In Russland wur-den ebenfalls sukzessive Positionen erhöht und der Fonds ist wieder signifikant an der Moskauer Börse investiert. Der Fokus des Fonds lag unverändert auf ausgesuchten und liquiden Standard- und Substanzwerten sowie den Kern-märkten der Region.
The DKB Osteuropa Fonds was managed very actively in the reporting period. In the first quarter of 2016, the Turkey share was increased, positions in Poland, Hungary and the Czech Republic were reduced. In Russia positions were also gradually increased and the fund is again strongly invest-ed in the Moscow stock exchange. The fund’s focus was unchanged on selected and liquid standard and material stocks as well as the core markets in the region.

14
BERICHT DER VERWALTUNGSGESELLSCHAFT • REPORT OF THE MANAGEMENT COMPANY
DKB Nordamerika Fonds DKB Nordamerika Fonds
Die vergleichsweise robuste wirtschaftliche Entwicklung in den USA und fortgesetzte expansive geldpolitische Maß-nahmen der US-Notenbank FED begünstigen das bis Juli 2015 freundliche Anlageumfeld für US-Aktien.
The comparatively robust economic performance in the US and continued expansionary monetary policy meas-ures of the US FED boosted the friendly investment envi-ronment for US stocks until July 2015.
Zusätzliche Impulse gaben Aktienrückkaufprogramme und ausgeprägte Übernahmeaktivitäten seitens der Unterneh-men. Unsicherheiten hinsichtlich der zukünftigen Geldpo-litik der US-amerikanischen Notenbank FED wirkten sich allerdings phasenweise dämpfend auf die Kursentwicklung aus. Der Rückgang des Ölpreises brachte zwar Kostenent-lastungen die dem Konsumsektor im Zuge höherer Kauf-kraft der Verbraucher zugutekamen, bremste jedoch die Geschäftsentwicklung im wichtigen Ölsektor.
Additional stimuli came from share buy-back programmes and strong takeover activities by companies. Uncertain-ties over the future monetary policy of the US FED, how-ever, had an occasionally dampening effect on the price performance. Although the fall in the oil price resulted in discharges that benefited the consumer sector in the course of higher purchasing power, but slowed the busi-ness performance in the key oil sector.
Die Turbulenzen an den internationalen Aktienmärkten im August 2015, einhergehend mit der Sorge um eine glo-bale Konjunkturabkühlung, ausgehend von den Schwel-lenländern und allen voran China, strahlten auch auf die US-Börse aus und führten zu temporären Kursrückgängen von bis zu 11%. Zwar startete die FED im Dezember 2015 den lang angekündigten Zinserhöhungszyklus, betonte aber zeitgleich weitere Zinserhöhungen mit Rücksicht auf die schwierigen Marktbedingungen, stark datenabhängig und äußerst vorsichtig vorzunehmen.
The turbulence in international equity markets in August 2015 along with the concern over the global economic cooling emanating from emerging markets and, above all, China, also radiated into the US stock exchange and result-ed in temporary price falls of up to 11%. Although the FED started the long-awaited interest rate cycle in December 2015, it announced at the same time that it would con-duct further interest rate rises taking into account the challenging market conditions and with a strongly data-based approach and extremely cautiously.
Auf Währungsebene konnte der Euro gegenüber dem US-Dollar im Berichtsjahr bis Ende März 2016 um etwa 6% aufwerten. Die Kurserholung war auf überzogene Erwar-tungen an die Geschwindigkeit und das Ausmaß des FED Zinserhöhungszyklus zurückzuführen. Für heimische Anle-ger wirkt sich die starke Aufwertung des Euro bei Anlagen in ausländischen Vermögenswerten daher negativ aus.
In terms of currencies, the euro appreciated by approxi-mately 6% relative to the US dollar in the reporting year by the end of March 2016. The price recovert was caused by excessive expectations for the speed and scope of the FED interest rate hike cycle. For domestic investors, the strong appreciation of the euro for investments in foreign assets was therefore negative.
Unterstützung im laufenden Geschäftsjahr sollten die Akti-enmärkte von der weiterhin ultraexpansiven Geldpolitik der großen Notenbanken erfahren. Die größten Risiken liegen vor allem in einer unerwartet starken Abkühlung der Weltkonjunktur, wobei auch Gefahren des niedrigen Ölpreises weiterhin eine wichtige Rolle spielen, sowie in einer stärker als erwartete Straffung der US-Geldpolitik durch die FED.
Equity markets will likely receive stimulus over the current financial year from the further ultra expansionary mone-tary policy of the major central banks. The biggest risks are above all in an unexpectedly strong cooling of the global economy, whereas the risks of the low oil also continue to play an important role, as well as in a stronger than expected tightening of US monetary policy by the FED.
15
BERICHT DER VERWALTUNGSGESELLSCHAFT • REPORT OF THE MANAGEMENT COMPANY
DKB Asien Fonds DKB Asien Fonds
Die asiatischen Aktienmärkte waren im vergangenen Berichtszeitraum durch Wachstumssorgen über die chi-nesische Wirtschaft, die Auswirkungen auf die westliche Welt und Zinsanhebungsbestrebungen geprägt. Letztere kamen nicht in dem erwarteten Ausmaß und sorgten dafür, dass Bedenken über die Effektivität der Zentralbankmaß-nahmen und die Bekämpfung von Deflation aufkamen. Die chinesische Zentralbank steuerte hier z.B. mit der Senkung der Mindestreserve entgegen und so konnte im 4. Quartal 2015 ein Anstieg bei den Immobilienpreisen verzeichnet werden, der bis ins aktuelle Jahr hinein andauert. Auf die Hochs im Juli 2015 folgte eine deutliche Korrektur, die bis in den September hineindauerte. In dieser Zeit sowie im Januar waren der Safe-Haven-Markt von Japan sowie der Yen durchaus gesucht und boten etwas Ausgleich im volatilem Umfeld. Durch eine kurzfristige Erholung der Rohstoffpreise zogen auch die Märkte in Asien wieder an, gaben aber ihre Gewinne im Januar und Februar 2016 wieder vollständig ab.
Asian equity markets were dominated by concerns over growth in the Chinese economy, the effects on the West-ern world and interest rate hike plans in the past reporting period. The later did not materialise to the degree expect-ed and resulted in concerns arising over the effectiveness of the central bank actions and combating deflation. The Chinese central bank counteracted this by reducing the minimum reserve, for instance, making a rise in property prices possible in the fourth quarter of 2015, which has continued into this year. A strong correction followed the highs in July 2015, which continued into September. Over this period and in January, the safe haven market of Japan and the yen were indeed in demand and offered some balance in a volatile environment. A short-term recovery of commodity prices boosted markets in Asia again, but they lost all their gains again in January and February 2016.
Der DKB Asien Fonds bewegte sich zum Ende des Geschäftsjahres mit einem leichten Untergewicht in Aus-tralien und Japan und ist auf Länderebene übergewichtet in Taiwan und Hong Kong. Für das kommende Geschäfts-jahr erwartet das Fondsmanagement im 2. Quartal 2016 einen Abverkauf in Rohstoffen, die somit auch zu einer Gegenbewegung in China führen könnte. In der zweiten Jahreshälfte sollte sich aber mit zunehmenden Inflations-erwartungen und einer Stabilisierung des Ölpreises das Bild für Asien nachhaltig verbessern.
The DKB Asien Fonds moved at the end of the financial year with a slight underweight in Australia and Japan and is overweight in Taiwan and Hong Kong at country level. For the coming financial year, the fund management expects a sell-off in commodities in Q2/2016, which could therefore result in a counter-movement in China. In the second half of the year, however, the picture for Asia should improve sustainably with increasing inflation expectations and a stabilization of the oil price.
DKB Pharma Fonds DKB Pharma Fonds
Der DKB Pharma Fonds investiert weltweit in ausgesuchte Aktienwerten des Pharma- und Gesundheitssektors. Ziel der Anlagepolitik ist die Erwirtschaftung einer attraktiven Rendite durch Anlagen in ertrags- und wachstumstarke Unternehmen aus dem Gesundheits-Sektor.
The DKB Pharma Fonds invested globally in selected stocks of the pharmaceuticals and healthcare sector. The aim of the investment policy is to achieve an attractive yield by investing in high-profit and high-growth companies in the healthcare sector.
Die Kapitalmärkte wurden im Berichtszeitraum durch eine sehr lockere Geldpolitik der Notenbanken beeinflusst. Während Immobilienmärkte von dieser Liquidität deut-lich profitierten, schwenkten die Aktienmärkte in eine sehr volatile Seitwärts- und Abwärtsbewegung ein. Ein massiv fallender Ölpreis, Sorgen um die Konjunktur in China und Zweifel an der Wirksamkeit der Notenbankpolitik in Euro-pa waren die Gründe für ein sehr volatiles Umfeld.
Capital markets were influenced by a very loose monetary policy of central banks over the reporting period. While property markets benefited strongly from this liquidity, equity markets embarked on a very volatile sideways and downward trajectory. A hugely falling oil price, concern over the economy in China and doubts over the effective-ness of the central banking policy in Europe were the rea-sons for a very volatile environment.

16
BERICHT DER VERWALTUNGSGESELLSCHAFT • REPORT OF THE MANAGEMENT COMPANY
Gesundheitsaktien zeichneten sich im Berichtszeitraum durch ein überdurchschnittliches Gewinnwachstum aus. Fusions- und Übernahmetransaktionen, Aktienrückkauf-programme und bedeutende Zulassungen innovativer Arzneimittel waren weitere Argumente, warum der Sektor bei Anlegern zu den Favoriten zählte. Die teilweise erhöh-ten Bewertungen führten aber auch im Gesundheitssektor zu Gewinnmitnahmen.
Healthcare stocks posted above-average profit growth over the reporting period. Merger and acquisition transac-tions, share buy-back programmes and significant approv-als of innovative medications were further arguments why the sector was a favourite among investors. The partially higher valuations, however, also resulted in profit taking in the healthcare sector.
Im DKB Pharma Fonds wurde während des Berichtszeitrau-mes eine defensive Anlagepolitik mit einem reduzierten Investitionsgrad umgesetzt. Die relative Unterperformance europäischer Pharmawerte gegenüber ihren US-amerika-nischen Pendants konnte damit ausgeglichen werden. Die relative Untergewichtung des Biotechnologie-Sektors war vor dem Hintergrund einer deutlichen Korrektur in diesem Sektor vorteilhaft.
In the DKB Pharma Fonds, a defensive investment policy was implemented with a reduced investment degree dur-ing the reporting period. The relative underperformance of European pharmaceuticals stocks compared to its US counterparts was offset. The relative underweight in the biotechnology sector was beneficial against the back-ground of a strong correction in this sector.
Die Perspektiven des Gesundheitssektors bleiben insge-samt weiterhin sehr positiv. Neben einer gefüllten Produkt-pipeline der Pharma- und Biotechunternehmen sprechen auch das Wachstum in den Entwicklungsländern und die demographische Entwicklung für ein Investment in den Gesundheitssektor.
The positive outlook for the healthcare sector remains very positive overall. In addition to the full product pipe-line of pharmaceutical and biotech enterprises, growth in the emerging markets and the demographic trend are factors in favour of investment in the healthcare sector.
DKB TeleTech Fonds DKB TeleTech Fonds
Der DKB TeleTech Fonds investiert weltweit in ausgesuchte Aktienwerte des Technologie- und Telekommunikations-sektors. Der Schwerpunkt der Anlagen erfolgt in amerikani-schen, europäischen sowie asiatischen Unternehmen. Ziel der Anlagepolitik ist die Erwirtschaftung einer attraktiven Rendite durch Aktienanlagen in ertrags- und wachstums-starke Unternehmen.
The DKB TeleTech Fonds invested globally in selected stocks of the technology and telecoms sectors. The focus of the investments is on American, European and Asian companies. The aim of the investment policy is to achieve an attractive yield through equity investments in high-profit and high-growth enterprises.
Die Kapitalmärkte wurden im Berichtszeitraum durch eine sehr lockere Geldpolitik der Notenbanken beeinflusst. Während Immobilienmärkte von dieser Liquidität deut-lich profitierten, schwenkten die Aktienmärkte in eine sehr volatile Seitwärts- und Abwärtsbewegung ein. Ein massiv fallender Ölpreis, Sorgen um die Konjunktur in China und Zweifel an der Wirksamkeit der Notenbankpolitik in Euro-pa waren die Gründe für ein sehr volatiles Umfeld.
Capital markets were influenced by a very loose monetary policy of central banks over the reporting period. While property markets benefited strongly from this liquidity, equity markets embarked on a very volatile sideways and downward trajectory. A hugely falling oil price, concern over the economy in China and doubts over the effective-ness of the central banking policy in Europe were the rea-sons for a very volatile environment.
Vor diesem Hintergrund haben sich Technologieaktien weltweit im Berichtszeitraum per Saldo seitwärts bewegt. Hightech-US-Werte, gemessen am Nasdaq-Index schwank-ten zwischen plus zehn und minus zehn Prozent. Europä-ische Technologie-Aktien konnten sich dem negativen Gesamtrend in Europa nicht entziehen.
Against this background, technology stocks globally moved sideways over the reporting period on balance. High-tech US stocks, measured by the Nasdaq index, fluc-tuated between plus ten and minus ten percent. European technology stocks failed to escape the negative overall trend in Europe.

17
BERICHT DER VERWALTUNGSGESELLSCHAFT • REPORT OF THE MANAGEMENT COMPANY
Im DKB TeleTech Fonds wurde während des Berichtszeit-raumes eine vergleichsweise defensive Anlagepolitik mit einem reduzierten Investitionsgrad umgesetzt. Die rela-tive Unterperformance europäischer Technologiewerte gegenüber ihren US-amerikanischen Pendants konnte damit ausgeglichen werden.
In the DKB TeleTech Fonds, a defensive investment policy was implemented with a reduced investment degree dur-ing the reporting period. The relative underperformance of European technology stocks compared to its US coun-terparts was offset.
Eine relativ robuste Konjunktur in den USA und ein hoher Investitionsbedarf in IT-Sicherheit und Cloud-Lösungen stützen den Technologie-Sektor. Darüber hinaus bleiben Automatisierung und Soziale Netzwerke im Fonds Schwer-punktthemen für die Zukunft.
A relatively robust economy in the US and a high invest-ment needs in IT security and cloud solutions are sup-porting the technology sector. In addition, automation and social networks remain the focus topics for the future.
DKB Zukunftsfonds DKB Zukunftsfonds
Im Berichtszeitraum hat die Geldpolitik der Notenbanken weiterhin eine zentrale Rolle gespielt. Im Kampf gegen Mini-Inflation und Konjunkturschwäche hat die EZB das Anleihekaufprogramm weiter ausgeweitet und Strafzinsen für Bankeinlagen eingeführt. In den USA hat die US-Noten-bank FED erstmals seit neuneinhalb Jahren die Zinsen angehoben. Ein massiv fallender Ölpreis, Sorgen um die Konjunktur in China und Zweifel an der Wirksamkeit der Notenbankpolitik in Europa waren der Grund für ein sehr volatiles Aktienmarktumfeld.
Central banks’ monetary policy continued to play a cen-tral role over the reporting period. In the struggle against mini-inflation and economic weakness, the ECB expand-ed further its bond purchasing programme and imposed negative interest rates on bank deposits. In the US, the FED has raised interest rates for the first time in 9.5 years. A hugely falling oil price, concern over the economy in China and doubts over the effectiveness of the central banking policy in Europe were the reason for a very vola-tile stock market environment.
Nach dem anfänglichen Aufschwung durch das Anleihe-kaufprogramm der EZB hat die Sorge um die nachlassende Dynamik der Weltwirtschaft die europäischen Aktienmärk-te im Griff gehabt und nach unten getrieben. Im Berichts-zeitraum hat der Vergleichsindex STOXX Europe 600 (Net Return) EUR um ca. 13% nachgegeben.
Following the initial uptick from the ECB’s bond purchasing programme, the concern over the petering-out momen-tum of the global economy firmly dominated equity mar-kets and pushed them down. Over the reporting period, the benchmark STOXX Europe 600 (Net Return) EUR fell by about 13%.
Im DKB Zukunftsfonds sind vor allem die Automobilwerte stark unter Druck geraten, was die Performance deutlich beeinflusst hat. Das Untergewicht in den Sektoren Ban-ken und Pharma hingegen hat sich als positiv erwiesen. Gute Titelselektion im Industrie-Sektor konnte zusätzlich positiv zur Performance beitragen. Insbesondere hat der DKB Zukunftsfonds von der sehr guten Entwicklung der Hersteller von Windkraftanlagen profitiert. Auf Ländere-bene ist Deutschland als Exportnation von der Konjunk-tursorge stark getroffen und das Übergewicht war somit belastend für die Gesamtperformance.
In the DKB Zukunftsfonds, car stocks came under par-ticularly strong pressure, which had a strong impact on performance. The underweight in the banking and phar-maceuticals sectors turned out to be positive. Good stock picking in the industrial sector made an additional, positive contribution to performance. In particular, the DKB Zuku-nftsfonds benefited from the very good performance in wind power pants manufacturing. At country level, Ger-many is strongly affected by the economic concern as an export nation, meaning that the overweight weighed on overall performance.
Die konsequente Anwendung strenger gefasster Nach-haltigkeitskriterien sollte den Fonds nun noch stärker im Marktvergleich abgrenzen und die Vorteilhaftigkeit des Managementansatzes unterstreichen.
The consistent application of strict sustainability criteria should now define the fund even more strongly by mar-ket comparison and underling the beneficial nature of the management approach.

18
BERICHT DER VERWALTUNGSGESELLSCHAFT • REPORT OF THE MANAGEMENT COMPANY
DKB Ökofonds DKB Ökofonds
Die Anlagestrategie des Fondsvermögens hat das Ziel, den Anleger an der Entwicklung der internationalen Aktien-märkte teilhaben zu lassen. Der Wertzuwachs soll überwie-gend aus Aktien von Unternehmen im Segment Klima- und Umwelttechnologie erzielt werden, die in den Geschäfts-feldern erneuerbare oder alternative Energien, Wasser, Klimaschutz und energieeffizienter Mobilität aktiv sind. Zusätzlich ist die Nachhaltigkeit der Unternehmen ein Aus-wahlkriterium. Dies umfasst Unternehmen, die eine lang-fristige Wertschöpfung anstreben und dabei ökologisch und nachhaltig agieren. Die Überprüfung der vorgenann-ten Kriterien erfolgt anhand eigener und externer Quellen.
The purpose of the investment strategy of the fund is to allow investors to participate in the development of inter-national stock markets. The added value is mainly to be achieved from shares of companies which are active in the climate and environmental technology segment and in the business fields of renewable or alternative energies, water, climate protection and energy-efficient mobility. In addition, corporate sustainability is a selection criterion. This includes companies striving towards long-term added value and thus operating in an ecological and sustainable fashion. The verification of the above criteria is carried out on the basis of own and external sources.
Die Kapitalmärkte wurden im Berichtszeitraum durch eine sehr lockere Geldpolitik der Notenbanken beeinflusst. Während Immobilienmärkte von dieser Liquidität deut-lich profitierten, schwenkten die Aktienmärkte in eine sehr volatile Seitwärts- und Abwärtsbewegung ein. Ein mas-siv fallender Ölpreis, Sorgen um die Konjunktur in China und Zweifel an der Wirksamkeit der Notenbankpolitik in Europa waren die Gründe für ein insgesamt sehr volatiles Aktienumfeld.
Capital markets were influenced by a very loose monetary policy of central banks over the reporting period. While property markets benefited strongly from this liquidity, equity markets embarked on a very volatile sideways and downward trajectory. A hugely falling oil price, concern over the economy in China and doubts over the effective-ness of the central banking policy in Europe were the rea-sons for an overall very volatile environment for stocks.
Die Aktienkursentwicklung von Unternehmen aus dem sog. „Clean-Tech“-Universum wurde im Berichtszeitraum sehr stark vom Verfall des Ölpreises und den damit ein-hergehenden Konjunktursorgen geprägt. Während Wind-turbinenhersteller deutlich zulegen konnten, verloren Solarmodulproduzenten teilweise zweistellig an Wert. Der DKB Ökofonds profitierte von seiner globalen Aufstellung in ausgesuchten Aktienwerten der nachhaltigen Sektoren. Hierbei sind insbesondere Investitionen in Werte aus dem Bereich Energieeffizienz, Umwelttechnologie und nach-haltiger Finanzwirtschaft hervorzuheben.
The share price performance of companies from the so-called clean-tech universe was very strongly dominated by the oil price collapse and the associated concerns over the economy over the reporting period. While wind tur-bine manufacturers rose strongly, some solar module pro-ducers saw double-digit value losses. The DKB Ökofonds benefited from its global setup in selected stocks of the sustainable sector. In this process, investments in stocks from the areas of energy efficiency, environmental technol-ogy and sustainabile finance are particularly noteworthy.
Luxemburg, im April 2016 Luxembourg, April 2016
BayernInvest Luxemburg S.A. BayernInvest Luxembourg S.A.

19
DKB NEUE BUNDESLÄNDER FONDS
VERMÖGENSAUFSTELLUNG ZUM 31. MÄRZ 2016 INVESTMENT PORTFOLIO AS AT MARCH 31ST, 2016
WertpapierbezeichnungSecurities
WährungCurrency
NominalNominal
MarktwertMarket value
EUR
% v. Teilfondsvermögen% of sub-fund assets
%-ában
Wertpapiervermögen • Securities holdings
Amtlich gehandelte Wertpapiere • Officially traded securities
Aktien • Shares
aap Implantate AG Inhaber-Aktien o.N. EUR 150.000,00 232.500,00 1,16
Axel Springer SE vink.Namens-Aktien o.N. EUR 15.000,00 718.800,00 3,58
Carl Zeiss Meditec AG Inhaber-Aktien o.N. EUR 35.000,00 951.125,00 4,74
DEAG Deutsche Entertainment AG Inhaber-Aktien o.N. EUR 83.417,00 308.642,90 1,54
Deutsche Wohnen AG Inhaber-Aktien o.N. EUR 15.000,00 411.375,00 2,05
Eckert & Ziegler Str.-u.Med.AG Inhaber-Aktien o.N. EUR 31.347,00 608.131,80 3,03
elumeo SE Inhaber-Aktien o.N. EUR 3.500,00 59.500,00 0,30
Epigenomics AG Namens-Aktien o.N. EUR 26.857,00 141.133,54 0,70
First Sensor AG Inhaber-Aktien o.N. EUR 40.000,00 438.000,00 2,18
Francotyp-Postalia Holding AG Inhaber-Aktien o.N. EUR 25.000,00 103.750,00 0,52
Geratherm Medical AG Inhaber-Aktien o.N. EUR 30.000,00 348.450,00 1,73
GK Software AG Inhaber-Aktien O.N. EUR 8.000,00 352.000,00 1,75
HAEMATO AG Inhaber-Aktien o.N. EUR 40.000,00 192.320,00 0,96
Halloren Schokoladenfabrik AG Inhaber-Aktien o.N. EUR 5.310,00 38.603,70 0,19
HanseYachts AG Inhaber-Aktien o.N. EUR 38.122,00 114.404,12 0,57
INTERSHOP Communications AG Inhaber-Aktien o.N. EUR 35.873,00 48.069,82 0,24
IVU Traffic Technologies AG Inhaber-Aktien o.N. EUR 150.000,00 552.000,00 2,75
JENOPTIK AG Inhaber-Aktien o.N. EUR 70.000,00 978.250,00 4,86
KTG Agrar SE Inhaber-Aktien o.N. EUR 10.000,00 116.700,00 0,58
KTG Energie AG Inhaber-Aktien o.N. EUR 32.019,00 304.500,69 1,52
MPH Mittelst.Pharma Hldg AG Inhaber-Aktien o.N. EUR 50.000,00 134.700,00 0,67
PSI AG Namens-Aktien o.N. EUR 35.000,00 469.000,00 2,34
Rocket Internet SE Inhaber-Aktien o.N. EUR 20.000,00 467.400,00 2,33
TAG Immobilien AG Inhaber-Aktien o.N. EUR 50.000,00 600.000,00 2,99
Travel24.com AG Inhaber-Aktien o.N. EUR 7.674,00 25.324,20 0,13
Vita 34 AG Namens-Aktien o.N. EUR 8.500,00 41.140,00 0,20
Wild Bunch AG Inhaber-Aktien o.N. EUR 53.000,00 82.680,00 0,41
YOC AG Inhaber-Aktien o.N. EUR 7.782,00 18.528,94 0,09
8.857.029,71 44,11
Verzinsliche Wertpapiere • Interest-bearing securities
9,250% Accentro Real Estate AG Anleihe v.2013(2017/2018) EUR 230.000,00 239.775,00 1,19
6,250% Accentro Real Estate AG Wandelanl.v.2014(2019) EUR 100.606,00 477.878,50 2,38
4,500% Berlin Hyp AG Öff.Pfdbr.E.149 v.07(19) EUR 200.000,00 228.560,00 1,14

20
DKB NEUE BUNDESLÄNDER FONDS
WertpapierbezeichnungSecurities
WährungCurrency
NominalNominal
MarktwertMarket value
EUR
% v. Teilfondsvermögen% of sub-fund assets
%-ában
0,000% Berlin, Land FLR-Landessch.v.12(2017)A.395 FRN EUR 400.000,00 401.032,00 2,00
0,000% Berlin, Land FLR-Landessch.v.12(2018)A.391 FRN EUR 450.000,00 450.945,00 2,25
3,500% Berlin, Land Landessch.v.2005(2017)Ausg.202 EUR 1.000.000,00 1.046.120,00 5,21
4,125% Berlin, Land Landessch.v.2006(2016)Ausg.214 EUR 550.000,00 553.542,00 2,76
0,000% Brandenburg, Land FLR-Schatzanw.v.12(17) FRN EUR 600.000,00 601.890,00 3,00
4,000% Brandenburg, Land Schatzanw.v.2006(2016) EUR 250.000,00 255.980,00 1,27
6,000% Deutsche Eff.-u.Wechs.-Bet. AG Anleihe v.2014(2015/2019) EUR 200.000,00 202.500,00 1,01
7,125% KTG Agrar SE Anleihe v.2011(2017) EUR 300.000,00 255.240,00 1,27
7,250% KTG Agrar SE Anleihe v.2014(15/2019) EUR 706.000,00 590.216,00 2,94
5,875% Landesbank Berlin AG Subordinated MTN-IHS v.09(19) EUR 700.000,00 792.120,00 3,94
4,000% Sachsen-Anhalt, Land Landessch. v.06(16) EUR 250.000,00 255.197,50 1,27
5,125% TAG Immobilien AG Anleihe v.2013(2018) EUR 300.000,00 318.750,00 1,59
4,000% Thüringen, Freistaat Landesschatz.v.07(17)S.2007/1 EUR 300.000,00 312.180,00 1,55
7,500% Travel24.com AG Inh.-Schv. v.2012(2017) EUR 400.000,00 104.000,00 0,52
7.085.926,00 35,29
Zertifikate auf Aktien • Share certificates
Commerzbank AG CL.DIZ 22.12.16 TAG Imm. 10 EUR 25.000,00 243.500,00 1,21
DZ BANK AG Deut.Zentral-Gen. DISC.Z 21.09.16 AxelSpr. 50 EUR 15.000,00 679.050,00 3,38
DZ BANK AG Deut.Zentral-Gen. DISC.Z 23.09.16 Rocket 28 EUR 15.000,00 316.200,00 1,57
DZ BANK AG Deut.Zentral-Gen. DISC.Z 23.12.16 CZ Medi. 20 EUR 20.000,00 396.200,00 1,97
1.634.950,00 8,13
Summe Wertpapiervermögen • Total securities holdings 17.577.905,71 87,53
Derivate • Derivatives
Optionsrechte auf Aktien • Stock options
Call Carl Zeiss Meditec 30 17.06.16 K100 EUR -100,00 -2.000,00 -0,01
Call Jenoptik 13 17.06.16 K100 EUR -100,00 -12.800,00 -0,06
Call Jenoptik 15 16.09.16 K100 EUR -100,00 -5.900,00 -0,03
Call Jenoptik 16 16.09.16 K100 EUR -100,00 -3.300,00 -0,02
Call Rocket Internet 32 16.09.16 K100 EUR -125,00 -17.500,00 -0,09
Call Rocket Internet 32 16.12.16 K100 EUR -75,00 -17.550,00 -0,09
Put Jenoptik 13 16.09.16 K100 EUR -100,00 -6.900,00 -0,03
Put Jenoptik 14 16.09.16 K100 EUR -100,00 -11.700,00 -0,06
Put Rocket Internet 15 16.09.16 K100 EUR -100,00 -6.200,00 -0,03
Put TAG Immobilien 10 17.06.16 K100 EUR -201,00 -603,00 0,00
Summe Derivate • Total Derivatives -84.453,00 -0,42
VERMÖGENSAUFSTELLUNG ZUM 31. MÄRZ 2016 (Fortsetzung) INVESTMENT PORTFOLIO AS AT MARCH 31ST, 2016 (continued)

DKB NEUE BUNDESLÄNDER FONDS
21
WertpapierbezeichnungSecurities
WährungCurrency
NominalNominal
MarktwertMarket value
EUR
% v. Teilfondsvermögen% of sub-fund assets
%-ában
Bankguthaben • Cash at banks
Bankkonto M.M.Warburg & CO Luxembourg S.A. EUR 2.345.949,26 2.345.949,26 11,68
Summe Bankguthaben • Total cash at banks 2.345.949,26 11,68
Sonstige Vermögensgegenstände • Other assets
Initial Margin M.M.Warburg & CO Luxembourg S.A. EUR 151.624,65 151.624,65 0,75
Wertpapierzinsen EUR 158.584,19 158.584,19 0,79
Summe Sonstige Vermögensgegenstände • Total other assets 310.208,84 1,54
Zinsverbindlichkeiten • Interest liabilities
Zinsverbindlichkeit Bankkonto M.M.Warburg & CO Luxembourg S.A. EUR -1.304,23 -1.304,23 -0,01
Summe Zinsverbindlichkeiten • Total interest liabilities -1.304,23 -0,01
Sonstige Verbindlichkeiten • Other liabilities EUR -63.469,02 -63.469,02 -0,32
Teilfondsvermögen • Sub-fund assets 20.084.837,56 100,00 *)
*) Durch Rundungen bei der Berechnung können geringe Differenzen entstanden sein • Slight deviations may have occurred as a result of rounding in the calculation
VERMÖGENSAUFSTELLUNG ZUM 31. MÄRZ 2016 (Fortsetzung) INVESTMENT PORTFOLIO AS AT MARCH 31ST, 2016 (continued)
Die Erläuterungen sind ein integraler Bestandteil dieses Berichtes • The accompanying notes are an integral part of this financial report

22
DKB NEUE BUNDESLÄNDER FONDS
VERPFLICHTUNGEN AUS DERIVATEN
LIABILITIES ON DERIVATIVES
OptionenOptions
WährungCurrency
Kontrakte Contracts
Kontraktgröße Contract size
Kurs Price
Dev.Kurs Exchange rate
Verpflichtungen aus Derivaten
Contingent liabilities under derivatives
contractsEUR
Call Carl Zeiss Meditec 30 17.06.16 K100 EUR -100,00 100,00 27,1750 1,0000 -271.750,00
Call Jenoptik 13 17.06.16 K100 EUR -100,00 100,00 13,9750 1,0000 -139.750,00
Call Jenoptik 15 16.09.16 K100 EUR -100,00 100,00 13,9750 1,0000 -139.750,00
Call Jenoptik 16 16.09.16 K100 EUR -100,00 100,00 13,9750 1,0000 -139.750,00
Call Rocket Internet 32 16.09.16 K100 EUR -125,00 100,00 23,3700 1,0000 -292.125,00
Call Rocket Internet 32 16.12.16 K100 EUR -75,00 100,00 23,3700 1,0000 -175.275,00
Put Jenoptik 13 16.09.16 K100 EUR -100,00 100,00 13,9750 1,0000 -139.750,00
Put Jenoptik 14 16.09.16 K100 EUR -100,00 100,00 13,9750 1,0000 -139.750,00
Put Rocket Internet 15 16.09.16 K100 EUR -100,00 100,00 23,3700 1,0000 -233.700,00
Put TAG Immobilien 10 17.06.16 K100 EUR -201,00 100,00 12,0000 1,0000 -241.200,00
Summe Optionen • Total options -1.912.800,00
Sämtliche Derivate wurden über die M.M.Warburg & CO Luxembourg S.A. abgewickelt. • All derivatives were handled by M.M.Warburg & CO Luxembourg S.A.
Die Erläuterungen sind ein integraler Bestandteil dieses Berichtes • The accompanying notes are an integral part of this financial report

DKB NEUE BUNDESLÄNDER FONDS
23
GEOGRAPHISCHE STRUKTUR DES WERTPAPIERVERMÖGENS IN PROZENT VOM TEILFONDSVERMÖGEN
STRUCTURE OF THE INVESTMENT PORTFOLIO BY GEOGRAPHICAL SECTOR IN PERCENT OF SUB-FUND ASSETS
Länder Countries
Kurswert in Mio. EUR Market value (millions) EUR
% v. Teilfondsvermögen % of sub-fund assets
Bundesrepublik Deutschland • Federal Republic of Germany 17,58 87,53
Summe • Total 17,58 87,53
WIRTSCHAFTLICHE STRUKTUR DES WERTPAPIERVERMÖGENS IN PROZENT VOM TEILFONDSVERMÖGEN
STRUCTURE OF THE INVESTMENT PORTFOLIO BY ECONOMIC SECTOR IN PERCENT OF SUB-FUND ASSETS
Branchen Sectors
Kurswert in Mio. EUR Market value (millions) EUR
% v. Teilfondsvermögen % of sub-fund assets
Bundesländer, Kommunen, Kantone • Local authorities, federal states, cantons
3,89 19,31
Technologie • Technology 3,00 14,92
Unternehmensanleihen • Corporate bonds 2,98 14,84
Gesundheitswesen • Healthcare 2,65 13,19
Zertifikate auf Aktien • Share certificates 1,63 8,13
Verbraucherdienstleistungen • Consumer services 1,19 5,92
Finanzdienstleistungen • Financial services 1,01 5,04
Industrieunternehmen • Industrial companies 0,55 2,75
Sonstige Branchen • Other sectors 0,38 1,91
Versorgungsunternehmen • Utilities 0,30 1,52
Summe • Total 17,58 87,53
Die Erläuterungen sind ein integraler Bestandteil dieses Berichtes • The accompanying notes are an integral part of this financial report

24
DKB NEUE BUNDESLÄNDER FONDS
STATISTISCHE INFORMATIONEN
STATISTICAL INFORMATION
01.04.201531.03.2016
01.04.201431.03.2015
01.04.201331.03.2014
Umlaufende Anteile zu Beginn des Geschäftsjahres Klasse ANL • Units outstanding at the beginning of the financial year class ANL
951.727,589 950.558,565 951.460,920
Ausgegebene Anteile Klasse ANL • Units issued class ANL 3.408,534 3.961,209 6.144,993
Zurückgenommene Anteile Klasse ANL • Units redeemed class ANL 4.259,382 2.792,185 7.047,348
Umlaufende Anteile am Ende des Geschäftsjahres Klasse ANL • Units outstanding at the end of the financial year class ANL
950.876,741 951.727,589 950.558,565
31.03.2016EUR
31.03.2015EUR
31.03.2014EUR
Teilfondsvermögen • Sub-fund assets 20.084.837,56 19.947.481,87 19.527.063,60
Nettovermögenswert pro Anteil Klasse ANL • Net asset value per unit class ANL 21,12 20,96 20,54
Ausgabepreis pro Anteil Klasse ANL • Issue price per unit class ANL 21,12 20,96 20,54
Zwischengewinn pro Anteil Klasse ANL • Interim profit per unit class ANL 0,28 0,22 0,20
ZUSAMMENSETZUNG DES TEILFONDSVERMÖGENS
STATEMENT OF SUB-FUND ASSETS
31.03.2016
Wertpapiervermögen • Securities holdings EUR 17.577.905,71
Derivate • Derivatives EUR -84.453,00
Bankguthaben • Cash at banks EUR 2.345.949,26
Sonstige Vermögensgegenstände • Other assets EUR 310.208,84
Zinsverbindlichkeiten • Interest liabilities EUR -1.304,23
Sonstige Verbindlichkeiten • Other liabilities EUR -63.469,02
Teilfondsvermögen • Sub-fund assets EUR 20.084.837,56
Das Teilfondsvermögen setzt sich zusammen aus insgesamt 950.876,74 umlaufenden Anteilen mit einem Inventarwert von EUR 21,12 (gerundet) pro Anteil.Sub-fund assets are represented by a net asset value of EUR 21.12 (rounded) per unit on 950,876.74 units outstanding.
Die Erläuterungen sind ein integraler Bestandteil dieses Berichtes • The accompanying notes are an integral part of this financial report

DKB NEUE BUNDESLÄNDER FONDS
25
Die Erläuterungen sind ein integraler Bestandteil dieses Berichtes • The accompanying notes are an integral part of this financial report
ERTRAGS- UND AUFWANDSRECHNUNG
STATEMENT OF OPERATIONS
01.04.201531.03.2016
Total total
Zinserträge aus Wertpapieren • Interest income from securities 343.050,71
Quellensteuer auf Zinserträge • Withholding tax on interest income -1.068,82
Dividendenerträge • Dividend income 91.758,72
Quellensteuer auf Dividendenerträge • Withholding tax on dividend income -21.563,85
Ordentlicher Ertragsausgleich • Income equalisation -316,62
ERTRÄGE INSGESAMT • TOTAL INCOME 411.860,14
Verwaltungsvergütung • Management fee 1) -219.811,61
Zentraladministrationsvergütung • Central administration fee -19.982,56
Depotbankvergütung • Custodian fee -12.191,07
Vertriebsprovision • Sales commission -120.273,70
Prüfungskosten • Audit fees -5.751,30
Taxe d‘abonnement • Taxe d’abonnement -10.001,87
Veröffentlichungskosten • Publication costs -8.064,40
Zinsaufwendungen • Interest expenses -1.859,62
Sonstige Aufwendungen • Other expenses -14.595,10
Ordentlicher Aufwandsausgleich • Equalisation expenses 297,97
AUFWENDUNGEN INSGESAMT • TOTAL EXPENSES -412.233,26
ORDENTLICHER AUFWANDSÜBERSCHUSS • ORDINARY EXPENDITURE SURPLUS -373,12
1) Gemäß den Vertragsbedingungen erhält die Verwaltungsgesellschaft eine Gebühr von 1,10% p.a. des am letzten Bewertungstages eines Monats festgestellten Teilfondsvermögens. Aus diesem Betrag wird auch das Anlageberaterhonorar vergütet.
The Management Company receives in accordance with the management regulations an annual fee of 1.10% of the sub-fund assets as at the last valuation date of each month. The advisory fee will be paid out of this amount.

26
DKB NEUE BUNDESLÄNDER FONDS
ENTWICKLUNG DES TEILFONDSVERMÖGENS
CHANGES IN SUB-FUND ASSETS
01.04.201531.03.2016
Total total
Teilfondsvermögen zu Beginn des Geschäftsjahres • Sub-fund assets at the beginning of the financial year 19.947.481,87
Ausschüttungen • Distribution -99.539,20
Mittelzufluss / -abfluss netto • Net subscriptions / redemptions -17.067,92
Ordentlicher Ertrags-/ Aufwandsausgleich • Income equalisation/ equalisation expenses 18,65
Ordentlicher Aufwandsüberschuss • Ordinary expenditure surplus -373,12
Außerordentlicher Ertrags-/Aufwandsausgleich • Extraordinary income equalisation/ equalisation expenses 1.318,15
Nettoergebnis der realisierten Gewinne und Verluste inkl. außerordentlicher Ertrags-/Aufwandsausgleich • Net realised profits / (–) losses incl. income/ expenses equalisation
1.480.930,76
Nettoveränderung der nicht realisierten Gewinne und Verluste • Net change in unrealised profits and losses -1.227.931,63
TEILFONDSVERMÖGEN ZUM ENDE DES GESCHÄFTSJAHRES • SUB-FUND ASSETS AT THE END OF THE FINANCIAL YEAR 20.084.837,56
Die Erläuterungen sind ein integraler Bestandteil dieses Berichtes • The accompanying notes are an integral part of this financial report

DKB EUROPA FONDS
27
VERMÖGENSAUFSTELLUNG ZUM 31. MÄRZ 2016 INVESTMENT PORTFOLIO AS AT MARCH 31ST, 2016
WertpapierbezeichnungSecurities
WährungCurrency
NominalNominal
MarktwertMarket value
EUR
% v. Teilfondsvermögen% of sub-fund assets
Wertpapiervermögen • Securities holdings
Amtlich gehandelte Wertpapiere • Officially traded securities
Aktien • Shares
ABB Ltd. Namens-Aktien SF 0,86 CHF 14.897,00 257.996,80 1,16
Nestlé S.A. Namens-Aktien SF -,10 CHF 3.960,00 262.311,04 1,18
Novartis AG Namens-Aktien SF 0,50 CHF 3.181,00 204.293,88 0,92
SGS S.A. Namens-Aktien SF 1 CHF 165,00 306.937,20 1,38
Swisscom AG Namens-Aktien SF 1 CHF 544,00 261.095,34 1,18
Swiss Re AG Namens-Aktien SF -,10 CHF 3.259,00 266.223,02 1,20
Syngenta AG Nam.-Aktien SF 0,10 CHF 839,00 307.761,33 1,39
UBS Group AG Namens-Aktien SF -,10 CHF 14.754,00 213.857,85 0,96
Zurich Insurance Group AG Nam.-Aktien SF 0,10 CHF 1.074,00 218.890,69 0,99
2.299.367,15 10,36
ACS, Act.de Constr.y Serv. SA Acciones Port. EO -,50 EUR 9.197,00 245.513,92 1,11
Allianz SE vink.Namens-Aktien o.N. EUR 1.796,00 259.611,80 1,17
Anheuser-Busch InBev N.V./S.A. Actions au Port. o.N. EUR 2.674,00 297.616,20 1,34
Atlantia S.p.A. Azioni Nom. EO 1 EUR 11.017,00 271.569,05 1,22
AXA S.A. Actions Port. EO 2,29 EUR 11.512,00 237.722,80 1,07
Axel Springer SE vink.Namens-Aktien o.N. EUR 4.937,00 236.581,04 1,07
Banco Bilbao Vizcaya Argent. Acciones Nom. EO 0,49 EUR 33.122,00 197.042,78 0,89
BASF SE Namens-Aktien o.N. EUR 3.666,00 246.061,92 1,11
Bayerische Motoren Werke AG Stammaktien EO 1 EUR 3.041,00 249.696,51 1,13
BNP Paribas S.A. Actions Port. EO 2 EUR 4.651,00 206.736,95 0,93
Bouygues S.A. Actions Port. EO 1 EUR 7.506,00 279.260,73 1,26
Cie Génle Éts Michelin SCpA Actions Nom. EO 2 EUR 3.480,00 317.828,40 1,43
Daimler AG Namens-Aktien o.N. EUR 3.485,00 236.736,05 1,07
Deutsche Post AG Namens-Aktien o.N. EUR 10.279,00 256.923,61 1,16
EDP - Energias de Portugal SA Acções Nom. EO 1 EUR 82.812,00 263.010,91 1,19
Enagas S.A. Acciones Port. EO 1,50 EUR 10.735,00 288.181,08 1,30
ENEL S.p.A. Azioni nom. EO 1 EUR 64.444,00 257.776,00 1,16
Engie S.A. Actions Port. EO 1 EUR 16.744,00 231.653,24 1,04
ENI S.p.A. Azioni nom. o.N. EUR 17.695,00 239.236,40 1,08
Eutelsat Communications Actions Port. EO 1 EUR 9.442,00 270.560,51 1,22
HUGO BOSS AG Namens-Aktien o.N. EUR 2.597,00 148.029,00 0,67
Iberdrola S.A. Acciones Port. EO -,75 EUR 44.082,00 262.331,98 1,18
ING Groep N.V. Cert.v.Aandelen EO 0,24 EUR 19.246,00 209.107,79 0,94
DKB EUROPA FONDS
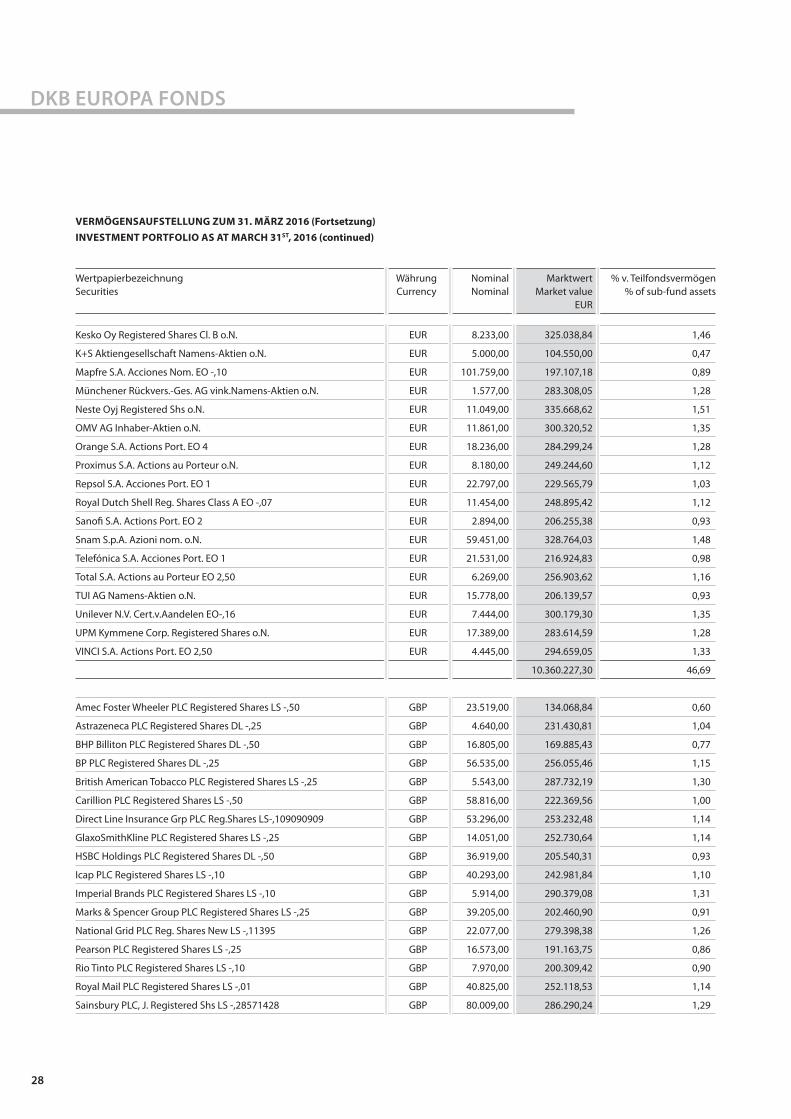
28
DKB EUROPA FONDS
WertpapierbezeichnungSecurities
WährungCurrency
NominalNominal
MarktwertMarket value
EUR
% v. Teilfondsvermögen% of sub-fund assets
Kesko Oy Registered Shares Cl. B o.N. EUR 8.233,00 325.038,84 1,46
K+S Aktiengesellschaft Namens-Aktien o.N. EUR 5.000,00 104.550,00 0,47
Mapfre S.A. Acciones Nom. EO -,10 EUR 101.759,00 197.107,18 0,89
Münchener Rückvers.-Ges. AG vink.Namens-Aktien o.N. EUR 1.577,00 283.308,05 1,28
Neste Oyj Registered Shs o.N. EUR 11.049,00 335.668,62 1,51
OMV AG Inhaber-Aktien o.N. EUR 11.861,00 300.320,52 1,35
Orange S.A. Actions Port. EO 4 EUR 18.236,00 284.299,24 1,28
Proximus S.A. Actions au Porteur o.N. EUR 8.180,00 249.244,60 1,12
Repsol S.A. Acciones Port. EO 1 EUR 22.797,00 229.565,79 1,03
Royal Dutch Shell Reg. Shares Class A EO -,07 EUR 11.454,00 248.895,42 1,12
Sanofi S.A. Actions Port. EO 2 EUR 2.894,00 206.255,38 0,93
Snam S.p.A. Azioni nom. o.N. EUR 59.451,00 328.764,03 1,48
Telefónica S.A. Acciones Port. EO 1 EUR 21.531,00 216.924,83 0,98
Total S.A. Actions au Porteur EO 2,50 EUR 6.269,00 256.903,62 1,16
TUI AG Namens-Aktien o.N. EUR 15.778,00 206.139,57 0,93
Unilever N.V. Cert.v.Aandelen EO-,16 EUR 7.444,00 300.179,30 1,35
UPM Kymmene Corp. Registered Shares o.N. EUR 17.389,00 283.614,59 1,28
VINCI S.A. Actions Port. EO 2,50 EUR 4.445,00 294.659,05 1,33
10.360.227,30 46,69
Amec Foster Wheeler PLC Registered Shares LS -,50 GBP 23.519,00 134.068,84 0,60
Astrazeneca PLC Registered Shares DL -,25 GBP 4.640,00 231.430,81 1,04
BHP Billiton PLC Registered Shares DL -,50 GBP 16.805,00 169.885,43 0,77
BP PLC Registered Shares DL -,25 GBP 56.535,00 256.055,46 1,15
British American Tobacco PLC Registered Shares LS -,25 GBP 5.543,00 287.732,19 1,30
Carillion PLC Registered Shares LS -,50 GBP 58.816,00 222.369,56 1,00
Direct Line Insurance Grp PLC Reg.Shares LS-,109090909 GBP 53.296,00 253.232,48 1,14
GlaxoSmithKline PLC Registered Shares LS -,25 GBP 14.051,00 252.730,64 1,14
HSBC Holdings PLC Registered Shares DL -,50 GBP 36.919,00 205.540,31 0,93
Icap PLC Registered Shares LS -,10 GBP 40.293,00 242.981,84 1,10
Imperial Brands PLC Registered Shares LS -,10 GBP 5.914,00 290.379,08 1,31
Marks & Spencer Group PLC Registered Shares LS -,25 GBP 39.205,00 202.460,90 0,91
National Grid PLC Reg. Shares New LS -,11395 GBP 22.077,00 279.398,38 1,26
Pearson PLC Registered Shares LS -,25 GBP 16.573,00 191.163,75 0,86
Rio Tinto PLC Registered Shares LS -,10 GBP 7.970,00 200.309,42 0,90
Royal Mail PLC Registered Shares LS -,01 GBP 40.825,00 252.118,53 1,14
Sainsbury PLC, J. Registered Shs LS -,28571428 GBP 80.009,00 286.290,24 1,29
VERMÖGENSAUFSTELLUNG ZUM 31. MÄRZ 2016 (Fortsetzung) INVESTMENT PORTFOLIO AS AT MARCH 31ST, 2016 (continued)

DKB EUROPA FONDS
29
WertpapierbezeichnungSecurities
WährungCurrency
NominalNominal
MarktwertMarket value
EUR
% v. Teilfondsvermögen% of sub-fund assets
Sky PLC Registered Shares LS -,50 GBP 18.365,00 241.895,30 1,09
South32 Ltd. Registered Shares o.N. GBP 14.646,00 14.552,23 0,07
SSE PLC Shs LS-,50 GBP 12.837,00 246.593,06 1,11
United Utilities Group PLC Registered Shares LS -,05 GBP 21.984,00 260.298,74 1,17
Vodafone Group PLC Registered Shares DL 0,2095238 GBP 83.045,00 235.374,53 1,06
4.956.861,72 22,34
Norsk Hydro ASA Navne-Aksjer NK 1,098 NOK 80.482,00 293.053,08 1,32
Orkla AS Navne-Aksjer NK 1,25 NOK 39.184,00 314.981,25 1,43
Statoil ASA Navne-Aksjer NK 2,50 NOK 19.671,00 275.518,83 1,24
Telenor ASA Navne-Aksjer NK 6 NOK 14.550,00 215.689,23 0,97
Yara International ASA Navne-Aksjer NK 1,70 NOK 6.758,00 231.075,61 1,04
1.330.318,00 6,00
Ericsson Namn-Aktier B (fria) o.N. SEK 29.469,00 260.738,78 1,18
Securitas AB Namn-Aktier B (fria) SK 1 SEK 22.147,00 329.826,70 1,49
Swedbank AB Namn-Aktier A o.N. SEK 12.654,00 239.809,53 1,08
TeliaSonera AB Namn-Aktier SK 3,20 SEK 50.404,00 231.413,21 1,04
1.061.788,22 4,79
Genussscheine • Profit participation certificates
Roche Holding AG Inhaber-Genußscheine o.N. CHF 1.139,00 247.384,41 1,11
247.384,41 1,11
Wertpapier-Investmentanteile • Investment fund units
ComS.-S.E.600Food+Bev.NR U.ETF Inhaber-Anteile I o.N. EUR 1.050,00 117.652,50 0,53
ComS.-STX.Euro.600 Uti.N.U.ETF Inhaber-Anteile I o.N. EUR 1.500,00 113.415,00 0,51
ComS.-SX.Eu.600 Teleco.N.U.ETF Inhaber-Anteile I o.N. EUR 1.400,00 107.506,00 0,48
ComSt.-SX.E.600 Banks NR U.ETF Inhaber-Anteile I o.N. EUR 2.800,00 89.796,00 0,40
ComSt.-SX.Eu.600 O+Gs NR U.ETF Inhaber-Anteile I o.N. EUR 1.850,00 113.960,00 0,51
Deka STOXX Europe 50 UCITS ETF Inhaber-Anteile EUR 7.200,00 204.912,00 0,93
iSh.ST.Euro.Large 200 U.ETF DE Inhaber-Anteile EUR 5.500,00 191.290,00 0,86
iSh.STO.Europe 50 UCITS ETF DE Inhaber-Anteile EUR 6.800,00 193.120,00 0,87
iSh.STOXX Europe 600 U.ETF DE Inhaber-Anteile EUR 6.000,00 205.140,00 0,93
1.336.791,50 6,02
Summe Wertpapiervermögen • Total securities holdings 21.592.738,30 97,31
VERMÖGENSAUFSTELLUNG ZUM 31. MÄRZ 2016 (Fortsetzung) INVESTMENT PORTFOLIO AS AT MARCH 31ST, 2016 (continued)

30
DKB EUROPA FONDS
WertpapierbezeichnungSecurities
WährungCurrency
NominalNominal
MarktwertMarket value
EUR
% v. Teilfondsvermögen% of sub-fund assets
Derivate • Derivatives
Aktienindex-Terminkontrakte • Share index future contracts
Euro STOXX 50 Future 17.06.16 EUR -90,00 -16.200,00 -0,07
Optionsrechte auf Aktienindizes • Options on stock market indices
Call Euro Stoxx 3000 17.06.16 EUR 150,00 149.250,00 0,67
Call Euro Stoxx 3150 15.04.16 EUR -50,00 -4.350,00 -0,02
Call Euro Stoxx 3200 17.06.16 EUR 25,00 6.500,00 0,03
Call Euro Stoxx 3500 17.06.16 EUR 50,00 800,00 0,00
Put Euro Stoxx 2850 15.04.16 EUR -50,00 -4.150,00 -0,02
Summe Derivate • Total derivatives 131.850,00 0,59
Bankguthaben • Cash at banks
Bankkonto M.M.Warburg & CO Luxembourg S.A. CHF 22.674,13 20.788,07 0,09
Bankkonto M.M.Warburg & CO Luxembourg S.A. EUR 283.255,33 283.255,33 1,29
Bankkonto M.M.Warburg & CO Luxembourg S.A. GBP 118.345,33 150.753,39 0,68
Bankkonto M.M.Warburg & CO Luxembourg S.A. NOK 92.793,39 9.853,65 0,04
Bankkonto M.M.Warburg & CO Luxembourg S.A. SEK 10.240,78 1.108,37 0,00
Forderungen aus Variation Margin M.M.Warburg & CO Luxembourg S.A. EUR 16.200,00 16.200,00 0,07
Summe Bankguthaben • Total cash at banks 481.958,81 2,17
Sonstige Vermögensgegenstände • Other assets
Dividendenforderungen EUR 2.676,86 2.676,86 0,01
Dividendenforderungen GBP 39.976,49 50.923,78 0,23
Zinsforderung Bankkonto M.M.Warburg & CO Luxembourg S.A. USD 7,01 6,19 0,00
Summe Sonstige Vermögensgegenstände • Total other assets 53.606,83 0,24
Zinsverbindlichkeiten • Interest liabilities
Zinsverbindlichkeit Bankkonto M.M.Warburg & CO Luxembourg S.A. CHF -0,27 -0,25 0,00
Zinsverbindlichkeit Bankkonto M.M.Warburg & CO Luxembourg S.A. EUR -147,63 -147,63 0,00
Summe Zinsverbindlichkeiten • Total interest liabilities -147,88 0,00
Sonstige Verbindlichkeiten • Other liabilities EUR -71.009,18 -71.009,18 -0,31
Teilfondsvermögen • Sub-fund assets 22.188.996,88 100,00 *)
*) Durch Rundungen bei der Berechnung können geringe Differenzen entstanden sein • Slight deviations may have occurred as a result of rounding in the calculation
VERMÖGENSAUFSTELLUNG ZUM 31. MÄRZ 2016 (Fortsetzung) INVESTMENT PORTFOLIO AS AT MARCH 31ST, 2016 (continued)
Die Erläuterungen sind ein integraler Bestandteil dieses Berichtes • The accompanying notes are an integral part of this financial report
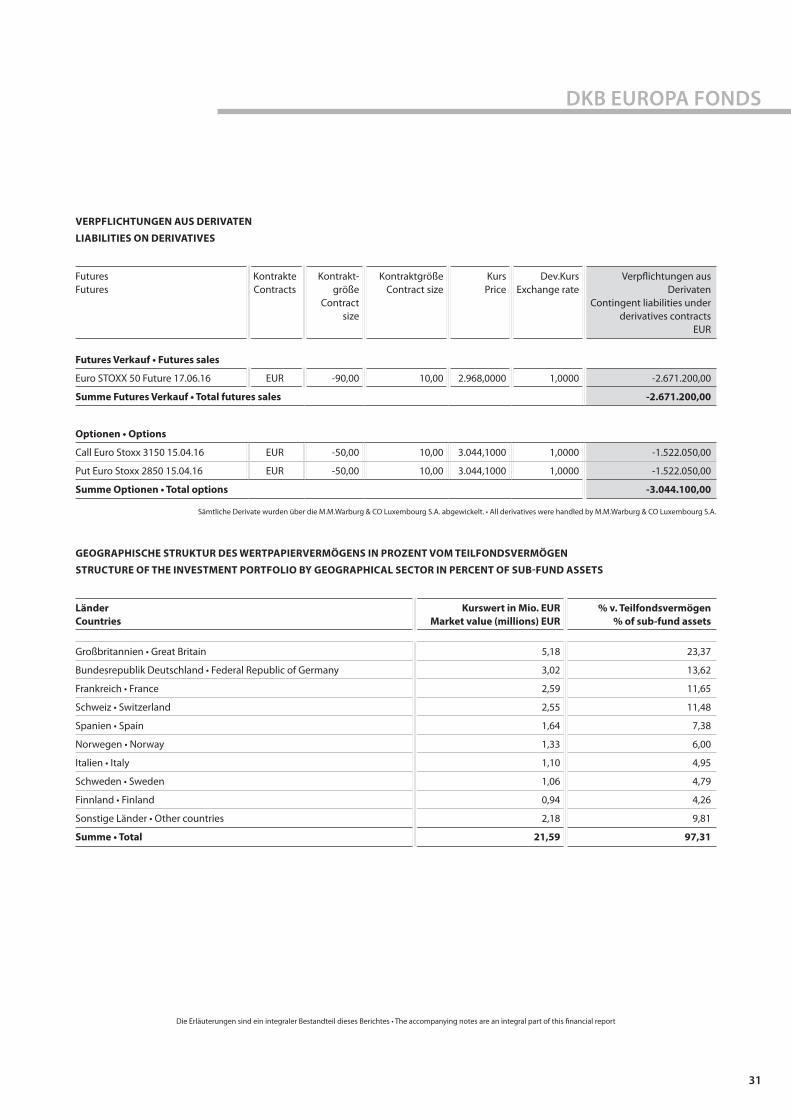
DKB EUROPA FONDS
31
VERPFLICHTUNGEN AUS DERIVATEN
LIABILITIES ON DERIVATIVES
Futures Futures
Kontrakte Contracts
Kontrakt-größe
Contract size
KontraktgrößeContract size
Kurs Price
Dev.Kurs Exchange rate
Verpflichtungen aus Derivaten
Contingent liabilities under derivatives contracts
EUR
Futures Verkauf • Futures sales
Euro STOXX 50 Future 17.06.16 EUR -90,00 10,00 2.968,0000 1,0000 -2.671.200,00
Summe Futures Verkauf • Total futures sales -2.671.200,00
Optionen • Options
Call Euro Stoxx 3150 15.04.16 EUR -50,00 10,00 3.044,1000 1,0000 -1.522.050,00
Put Euro Stoxx 2850 15.04.16 EUR -50,00 10,00 3.044,1000 1,0000 -1.522.050,00
Summe Optionen • Total options -3.044.100,00
Sämtliche Derivate wurden über die M.M.Warburg & CO Luxembourg S.A. abgewickelt. • All derivatives were handled by M.M.Warburg & CO Luxembourg S.A.
GEOGRAPHISCHE STRUKTUR DES WERTPAPIERVERMÖGENS IN PROZENT VOM TEILFONDSVERMÖGEN
STRUCTURE OF THE INVESTMENT PORTFOLIO BY GEOGRAPHICAL SECTOR IN PERCENT OF SUB-FUND ASSETS
LänderCountries
Kurswert in Mio. EURMarket value (millions) EUR
% v. Teilfondsvermögen% of sub-fund assets
Großbritannien • Great Britain 5,18 23,37
Bundesrepublik Deutschland • Federal Republic of Germany 3,02 13,62
Frankreich • France 2,59 11,65
Schweiz • Switzerland 2,55 11,48
Spanien • Spain 1,64 7,38
Norwegen • Norway 1,33 6,00
Italien • Italy 1,10 4,95
Schweden • Sweden 1,06 4,79
Finnland • Finland 0,94 4,26
Sonstige Länder • Other countries 2,18 9,81
Summe • Total 21,59 97,31
Die Erläuterungen sind ein integraler Bestandteil dieses Berichtes • The accompanying notes are an integral part of this financial report

32
DKB EUROPA FONDS
WIRTSCHAFTLICHE STRUKTUR DES WERTPAPIERVERMÖGENS IN PROZENT VOM TEILFONDSVERMÖGEN
STRUCTURE OF THE INVESTMENT PORTFOLIO BY ECONOMIC SECTOR IN PERCENT OF SUB-FUND ASSETS
BranchenSectors
Kurswert in Mio. EURMarket value (millions) EUR
% v. Teilfondsvermögen% of sub-fund assets
Finanzdienstleistungen • Financial services 3,22 14,57
Industrieunternehmen • Industrial companies 2,72 12,25
Verbrauchsgüter • Consumer goods 2,71 12,19
Versorgungsunternehmen • Utilities 2,42 10,90
Öl und Gas • Oil and gas 2,28 10,26
Verbraucherdienstleistungen • Consumer services 1,96 8,83
Rohstoffe • Commodities 1,85 8,34
Telekommunikation • Telecommunications 1,69 7,63
Sonstige Branchen•Other sectors 1,40 6,32
Investmentanteile Aktienindex • Investment fund equity index 1,34 6,02
Summe • Total 21,59 97,31
STATISTISCHE INFORMATIONEN
STATISTICAL INFORMATION
01.04.201531.03.2016
01.04.201431.03.2015
01.04.201331.03.2014
Umlaufende Anteile zu Beginn des Geschäftsjahres Klasse AL • Units outstanding at the beginning of the financial year class AL
105.807,896 197.658,505 306.111,795
Ausgegebene Anteile Klasse AL • Units issued class AL 1.149,000 620,000 200,000
Zurückgenommene Anteile Klasse AL • Units redeemed class AL 17.824,521 92.470,609 108.653,290
Umlaufende Anteile am Ende des Geschäftsjahres Klasse AL • Units outstanding at the end of the financial year class AL
89.132,375 105.807,896 197.658,505
Die Erläuterungen sind ein integraler Bestandteil dieses Berichtes • The accompanying notes are an integral part of this financial report

DKB EUROPA FONDS
33
01.04.201531.03.2016
01.04.201431.03.2015
01.04.201331.03.2014
Umlaufende Anteile zu Beginn des Geschäftsjahres Klasse TNL • Units outstanding at the beginning of the financial year class TNL
1.109.485,611 1.175.075,139 1.233.283,903
Ausgegebene Anteile Klasse TNL • Units issued class TNL 26.057,670 22.524,142 26.726,741
Zurückgenommene Anteile Klasse TNL • Units redeemed class TNL 40.148,262 88.113,670 84.935,504
Umlaufende Anteile am Ende des Geschäftsjahres Klasse TNL • Units outstanding at the end of the financial year class TNL
1.095.395,019 1.109.485,611 1.175.075,139
05.08.2015*)31.03.2016´´
Umlaufende Anteile zu Beginn des Geschäftsjahres Klasse InstAL2 • Units outstanding at the beginning of the financial year class InstAL2
0,000
Ausgegebene Anteile Klasse InstAL2 • Units issued class InstAL2 200,000
Zurückgenommene Anteile Klasse InstAL2 • Units redeemed class InstAL2 0,000
Umlaufende Anteile am Ende des Geschäftsjahres Klasse InstAL2 • Units outstanding at the end of the financial year class InstAL2
200,000
*) Erste NAV Berechnung am 5. August 2015. • First NAV-calculation as per August 5th, 2015.
Die Erläuterungen sind ein integraler Bestandteil dieses Berichtes • The accompanying notes are an integral part of this financial report
STATISTISCHE INFORMATIONEN (Fortsetzung)STATISTICAL INFORMATION (continued)

34
DKB EUROPA FONDS
31.03.2016EUR
31.03.2015EUR
31.03.2014EUR
Teilfondsvermögen • Sub-fund assets 22.188.996,88 25.542.490,20 25.054.468,45
Nettovermögenswert pro Anteil Klasse AL • Net asset value per unit class AL 12,83 15,29 12,71Ausgabepreis pro Anteil Klasse AL • Issue price per unit class AL 13,47 16,05 13,35Zwischengewinn pro Anteil Klasse AL • Interim profit per unit class AL 0,00 0,00 0,00
Nettovermögenswert pro Anteil Klasse TNL • Net asset value per unit class TNL 18,42 21,56 17,77Ausgabepreis pro Anteil Klasse TNL • Issue price per unit class TNL 18,42 21,56 17,77Zwischengewinn pro Anteil Klasse TNL • Interim profit per unit class TNL 0,00 0,00 0,00
Nettovermögenswert pro Anteil Klasse InstAL2 • Net asset value per unit class InstAL2 4.359,93Ausgabepreis pro Anteil Klasse InstAL2 • Issue price per unit class InstAL2 4.447,13Zwischengewinn pro Anteil Klasse InstAL2 • Interim profit per unit class InstAL2 0,22
ZUSAMMENSETZUNG DES TEILFONDSVERMÖGENS
STATEMENT OF SUB-FUND ASSETS
31.03.2016
Wertpapiervermögen • Securities holdings EUR 21.592.738,30
Derivate • Derivatives EUR 131.850,00
Bankguthaben • Cash at banks EUR 481.958,81
Sonstige Vermögensgegenstände • Other assets EUR 53.606,83
Zinsverbindlichkeiten • Interest liabilities EUR -147,88
Sonstige Verbindlichkeiten • Other liabilities EUR -71.009,18
Teilfondsvermögen • Sub-fund assets EUR 22.188.996,88
Das Teilfondsvermögen setzt sich zusammen aus 1.184.727,39 umlaufenden Anteilen. Davon entfallen 89.132,38 Anteile auf die Klasse AL mit einem Inventarwert von 12,83 EUR (gerundet) pro Anteil, 1.095.395,02 Anteile auf die Klasse TNL mit einem Inventarwert von 18,42 EUR
(gerundet) pro Anteil und 200,00 Anteile auf die Klasse InstAL2 mit einem Inventarwert von 4.359,93 EUR (gerundet) pro Anteil.
Sub-fund assets are represented by a total of 1,184,727.39 units outstanding. 89,132.38 units are allotted as class AL having a net asset value of 12.83 EUR (rounded) per unit, 1,095,395.02 units are allotted as class TNL having a net asset value of 18.42 EUR (rounded) per unit and 200.00 units are allotted as class InstAL2 having a net asset value of 4,359.93 EUR (rounded) per unit.
Die Erläuterungen sind ein integraler Bestandteil dieses Berichtes • The accompanying notes are an integral part of this financial report
STATISTISCHE INFORMATIONEN (Fortsetzung)STATISTICAL INFORMATION (continued)

DKB EUROPA FONDS
35
Die Erläuterungen sind ein integraler Bestandteil dieses Berichtes • The accompanying notes are an integral part of this financial report
ERTRAGS- UND AUFWANDSRECHNUNG
STATEMENT OF OPERATIONS
01.04.201531.03.2016
Total total EUR
01.04.201531.03.2016
Klasse AL class AL
EUR
01.04.201531.03.2016Klasse TNL
class TNL EUR
05.08.201531.03.2016
Klasse InstAL2 class Ins-tAL2 EUR
Zinserträge aus Wertpapieren • Interest income from securities 527,19 33,38 493,81
Dividendenerträge • Dividend income 935.169,26 53.860,10 868.595,96 12.713,20
Quellensteuer auf Dividendenerträge • Withholding tax on dividend income -148.268,73 -8.731,30 -138.034,05 -1.503,38
Erträge aus Investmentanteilen • Income from investment units 23.542,52 1.239,11 21.687,36 616,05
Erträge aus REITs • Income from REITs 5.654,40 309,38 5.345,02
Quellensteuer auf REITs-Erträge • Withholding tax on REITS income -1.696,32 -92,81 -1.603,51
Zinsen aus Geldanlagen • Interest on money-market investments 6,19 0,32 5,63 0,24
Sonstige Erträge • Other income 119.565,40 7.595,60 111.969,80
Ordentlicher Ertragsausgleich • Income equalisation -11.554,23 -5.055,14 -6.499,09 0,00
ERTRÄGE INSGESAMT • TOTAL INCOME 922.945,68 49.158,64 861.960,93 11.826,11
Verwaltungsvergütung • Management fee 1) -280.986,06 -15.309,30 -262.151,71 -3.525,05
Zentraladministrationsvergütung • Central administration fee -23.696,12 -1.281,31 -21.830,64 -584,17
Depotbankvergütung • Custodian fee -15.381,80 -839,14 -14.186,12 -356,54
Vertriebsprovision • Sales commission -138.126,68 0,00 -138.126,68 0,00
Prüfungskosten • Audit fees -4.984,50 -273,55 -4.612,23 -98,72
Taxe d‘abonnement • Taxe d’abonnement -11.274,24 -603,83 -10.604,35 -66,06
Veröffentlichungskosten • Publication costs -10.672,02 -578,22 -9.839,97 -253,83
Zinsaufwendungen • Interest expenses -1.695,99 -91,24 -1.576,24 -28,51
Sonstige Aufwendungen • Other expenses -34.844,71 -1.853,75 -31.962,44 -1.028,52
Ordentlicher Aufwandsausgleich • Equalisation expenses 3.070,05 803,78 2.266,27 0,00
AUFWENDUNGEN INSGESAMT • TOTAL EXPENSES -518.592,07 -20.026,56 -492.624,11 -5.941,40
ORDENTLICHER ERTRAGSÜBERSCHUSS • ORDINARY INCOME SURPLUS 404.353,61 29.132,08 369.336,82 5.884,71
1) Gemäß den Vertragsbedingungen erhält die Verwaltungsgesellschaft eine Gebühr von 1,20% p.a. für die Klassen AL und TNL und 0,60% p.a. für die Klasse InstAL2 des am letzten Bewertungstages eines Monats festgestellten Teilfondsvermögens. Aus diesem Betrag wird auch das Anlageberaterhonorar vergütet.
The Management Company receives in accordance with the management regulations an annual fee of 1.20% for the classes AL and TNL and 0.60% for the class InstAL2 of the sub-fund assets as at the last valuation date of each month. The advisory fee will be paid out of this amount.
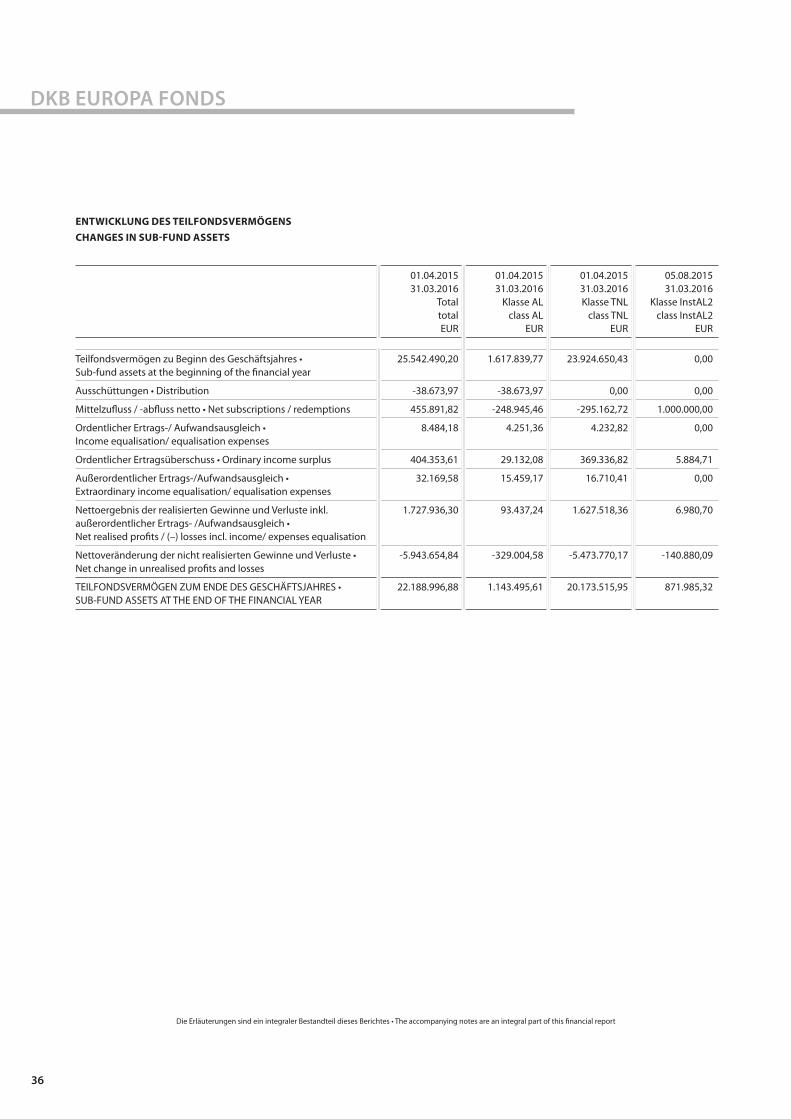
36
DKB EUROPA FONDS
ENTWICKLUNG DES TEILFONDSVERMÖGENS CHANGES IN SUB-FUND ASSETS
01.04.201531.03.2016
Total total EUR
01.04.201531.03.2016
Klasse AL class AL
EUR
01.04.201531.03.2016Klasse TNL
class TNL EUR
05.08.201531.03.2016
Klasse InstAL2 class InstAL2
EUR
Teilfondsvermögen zu Beginn des Geschäftsjahres • Sub-fund assets at the beginning of the financial year
25.542.490,20 1.617.839,77 23.924.650,43 0,00
Ausschüttungen • Distribution -38.673,97 -38.673,97 0,00 0,00
Mittelzufluss / -abfluss netto • Net subscriptions / redemptions 455.891,82 -248.945,46 -295.162,72 1.000.000,00
Ordentlicher Ertrags-/ Aufwandsausgleich • Income equalisation/ equalisation expenses
8.484,18 4.251,36 4.232,82 0,00
Ordentlicher Ertragsüberschuss • Ordinary income surplus 404.353,61 29.132,08 369.336,82 5.884,71
Außerordentlicher Ertrags-/Aufwandsausgleich • Extraordinary income equalisation/ equalisation expenses
32.169,58 15.459,17 16.710,41 0,00
Nettoergebnis der realisierten Gewinne und Verluste inkl. außerordentlicher Ertrags- /Aufwandsausgleich • Net realised profits / (–) losses incl. income/ expenses equalisation
1.727.936,30 93.437,24 1.627.518,36 6.980,70
Nettoveränderung der nicht realisierten Gewinne und Verluste • Net change in unrealised profits and losses
-5.943.654,84 -329.004,58 -5.473.770,17 -140.880,09
TEILFONDSVERMÖGEN ZUM ENDE DES GESCHÄFTSJAHRES • SUB-FUND ASSETS AT THE END OF THE FINANCIAL YEAR
22.188.996,88 1.143.495,61 20.173.515,95 871.985,32
Die Erläuterungen sind ein integraler Bestandteil dieses Berichtes • The accompanying notes are an integral part of this financial report

37
VERMÖGENSAUFSTELLUNG ZUM 31. MÄRZ 2016 INVESTMENT PORTFOLIO AS AT MARCH 31ST, 2016
WertpapierbezeichnungSecurities
WährungCurrency
NominalNominal
Névérték
MarktwertMarket value
EUR
% v. Teilfondsvermögen% of sub-fund assets
%-ában
Wertpapiervermögen • Securities holdings
Amtlich gehandelte Wertpapiere • Officially traded securities
Aktien • Shares
Kofola CeskoSlovensko AS Namens-Aktien KC 100 CZK 15.800,00 253.349,28 1,74
Komercní Banka AS Inhaber-Aktien KC 500 CZK 3.500,00 680.748,31 4,68
Pegas Nonwovens S.A. Actions au Porteur o.N. CZK 13.000,00 359.451,21 2,47
1.293.548,80 8,89
Erste Group Bank AG Inhaber-Aktien o.N. EUR 8.000,00 196.520,00 1,36
Immofinanz AG Inhaber-Aktien o.N. EUR 25.000,00 47.025,00 0,32
UNIQA Insurance Group AG Inhaber-Stammaktien o.N. EUR 18.000,00 110.970,00 0,76
354.515,00 2,44
Magyar Telekom Telecommun.PLC Namens-Aktien A UF 100 HUF 110.000,00 158.171,17 1,09
MOL Magyar Olaj-és Gázipa.Nyrt Namens-Aktien A UF 1000 HUF 4.500,00 235.348,01 1,62
OTP Bank Nyrt. Namens-Aktien UF 100 HUF 33.000,00 724.367,97 4,98
Richter Gedeon Vegye.Gyár Nyrt Namens-Aktien UF 100 HUF 22.000,00 384.229,97 2,64
1.502.117,12 10,33
Asseco Poland S.A. Inhaber-Aktien ZY 1 PLN 10.000,00 138.400,02 0,95
Bank Millennium S.A. Inhaber-Aktien ZY 1 PLN 51.000,00 71.206,32 0,49
Bank Pekao S.A. Inhaber-Aktien ZY 1 PLN 5.800,00 227.968,16 1,57
Bank Zachodni WBK S.A. Inhaber-Aktien ZY 10 PLN 2.100,00 149.114,41 1,03
CCC S.A. Inhaber-Aktien ZY 0,1 PLN 3.000,00 110.065,33 0,76
Cyfrowy Polsat S.A. Inhaber-Aktien ZY -,04 PLN 17.000,00 98.531,99 0,68
Eurocash S.A. Inhaber-Aktien Class A ZY 1 PLN 7.000,00 87.402,27 0,60
Grupa Azoty S.A. Inhaber-Aktien ZY 5 PLN 3.900,00 86.939,99 0,60
Grupa Kety S.A. Inhaber-Aktien A ZY 2,50 PLN 2.700,00 202.109,09 1,39
KGHM Polska Miedz S.A. Inhaber-Aktien ZY 10 PLN 11.000,00 196.688,54 1,35
Polski Koncern Naftowy Orlen Inhaber-Aktien ZY 1,25 PLN 18.900,00 327.213,98 2,25
Powszechna K.O.(PKO)Bk Polski Inhaber-Aktien ZY 1 PLN 72.000,00 462.591,16 3,17
Powszechny Zaklad Ubezpieczen Namens-Aktien ZY 0,10 PLN 30.000,00 250.471,66 1,72
Synthos S.A. Inhaber-Aktien ZY 0,03 PLN 40.000,00 35.198,38 0,24
Warsaw Stock Exchange Inhaber-Aktien ZY 1 PLN 8.000,00 73.212,63 0,50
Wirtualna Polska Holding S.A. Inhaber-Aktien B,C ZY -,05 PLN 19.000,00 184.134,45 1,27
2.701.248,38 18,57
DKB OSTEUROPA FONDS
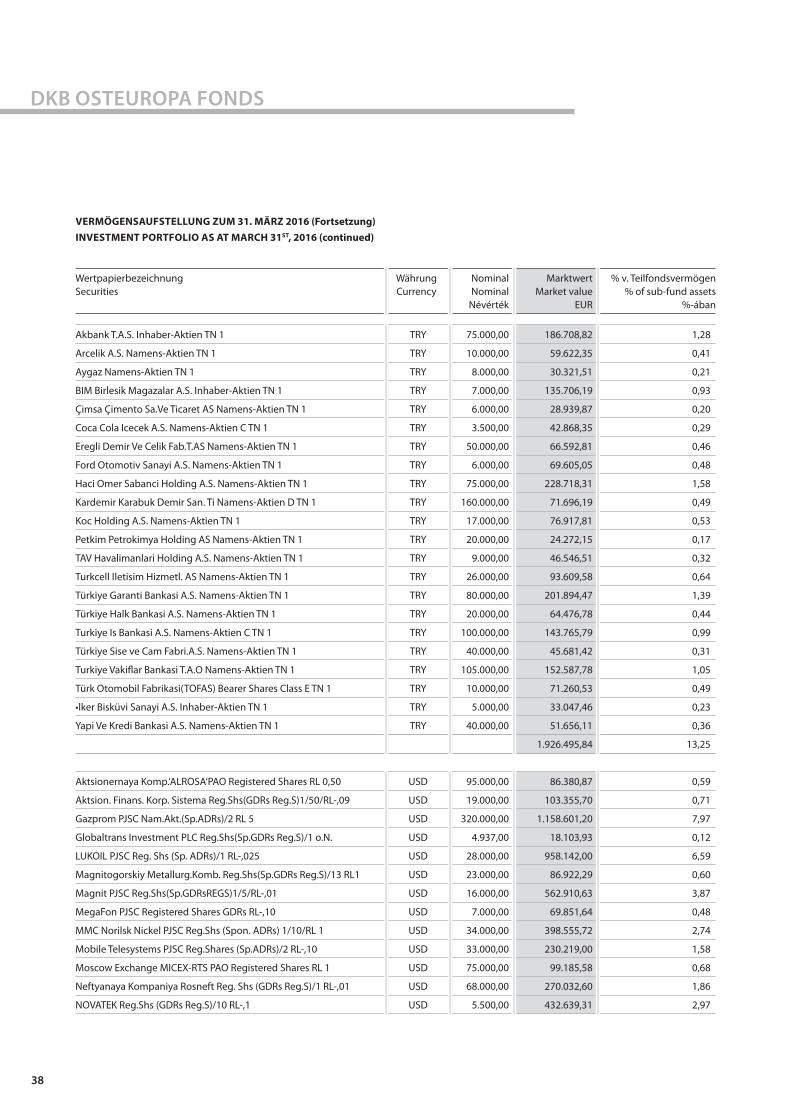
38
DKB OSTEUROPA FONDS
WertpapierbezeichnungSecurities
WährungCurrency
NominalNominal
Névérték
MarktwertMarket value
EUR
% v. Teilfondsvermögen% of sub-fund assets
%-ában
Akbank T.A.S. Inhaber-Aktien TN 1 TRY 75.000,00 186.708,82 1,28
Arcelik A.S. Namens-Aktien TN 1 TRY 10.000,00 59.622,35 0,41
Aygaz Namens-Aktien TN 1 TRY 8.000,00 30.321,51 0,21
BIM Birlesik Magazalar A.S. Inhaber-Aktien TN 1 TRY 7.000,00 135.706,19 0,93
Çimsa Çimento Sa.Ve Ticaret AS Namens-Aktien TN 1 TRY 6.000,00 28.939,87 0,20
Coca Cola Icecek A.S. Namens-Aktien C TN 1 TRY 3.500,00 42.868,35 0,29
Eregli Demir Ve Celik Fab.T.AS Namens-Aktien TN 1 TRY 50.000,00 66.592,81 0,46
Ford Otomotiv Sanayi A.S. Namens-Aktien TN 1 TRY 6.000,00 69.605,05 0,48
Haci Omer Sabanci Holding A.S. Namens-Aktien TN 1 TRY 75.000,00 228.718,31 1,58
Kardemir Karabuk Demir San. Ti Namens-Aktien D TN 1 TRY 160.000,00 71.696,19 0,49
Koc Holding A.S. Namens-Aktien TN 1 TRY 17.000,00 76.917,81 0,53
Petkim Petrokimya Holding AS Namens-Aktien TN 1 TRY 20.000,00 24.272,15 0,17
TAV Havalimanlari Holding A.S. Namens-Aktien TN 1 TRY 9.000,00 46.546,51 0,32
Turkcell Iletisim Hizmetl. AS Namens-Aktien TN 1 TRY 26.000,00 93.609,58 0,64
Türkiye Garanti Bankasi A.S. Namens-Aktien TN 1 TRY 80.000,00 201.894,47 1,39
Türkiye Halk Bankasi A.S. Namens-Aktien TN 1 TRY 20.000,00 64.476,78 0,44
Turkiye Is Bankasi A.S. Namens-Aktien C TN 1 TRY 100.000,00 143.765,79 0,99
Türkiye Sise ve Cam Fabri.A.S. Namens-Aktien TN 1 TRY 40.000,00 45.681,42 0,31
Turkiye Vakiflar Bankasi T.A.O Namens-Aktien TN 1 TRY 105.000,00 152.587,78 1,05
Türk Otomobil Fabrikasi(TOFAS) Bearer Shares Class E TN 1 TRY 10.000,00 71.260,53 0,49
•lker Bisküvi Sanayi A.S. Inhaber-Aktien TN 1 TRY 5.000,00 33.047,46 0,23
Yapi Ve Kredi Bankasi A.S. Namens-Aktien TN 1 TRY 40.000,00 51.656,11 0,36
1.926.495,84 13,25
Aktsionernaya Komp.‘ALROSA‘PAO Registered Shares RL 0,50 USD 95.000,00 86.380,87 0,59
Aktsion. Finans. Korp. Sistema Reg.Shs(GDRs Reg.S)1/50/RL-,09 USD 19.000,00 103.355,70 0,71
Gazprom PJSC Nam.Akt.(Sp.ADRs)/2 RL 5 USD 320.000,00 1.158.601,20 7,97
Globaltrans Investment PLC Reg.Shs(Sp.GDRs Reg.S)/1 o.N. USD 4.937,00 18.103,93 0,12
LUKOIL PJSC Reg. Shs (Sp. ADRs)/1 RL-,025 USD 28.000,00 958.142,00 6,59
Magnitogorskiy Metallurg.Komb. Reg.Shs(Sp.GDRs Reg.S)/13 RL1 USD 23.000,00 86.922,29 0,60
Magnit PJSC Reg.Shs(Sp.GDRsREGS)1/5/RL-,01 USD 16.000,00 562.910,63 3,87
MegaFon PJSC Registered Shares GDRs RL-,10 USD 7.000,00 69.851,64 0,48
MMC Norilsk Nickel PJSC Reg.Shs (Spon. ADRs) 1/10/RL 1 USD 34.000,00 398.555,72 2,74
Mobile Telesystems PJSC Reg.Shares (Sp.ADRs)/2 RL-,10 USD 33.000,00 230.219,00 1,58
Moscow Exchange MICEX-RTS PAO Registered Shares RL 1 USD 75.000,00 99.185,58 0,68
Neftyanaya Kompaniya Rosneft Reg. Shs (GDRs Reg.S)/1 RL-,01 USD 68.000,00 270.032,60 1,86
NOVATEK Reg.Shs (GDRs Reg.S)/10 RL-,1 USD 5.500,00 432.639,31 2,97
VERMÖGENSAUFSTELLUNG ZUM 31. MÄRZ 2016 (Fortsetzung) INVESTMENT PORTFOLIO AS AT MARCH 31ST, 2016 (continued)

DKB OSTEUROPA FONDS
39
WertpapierbezeichnungSecurities
WährungCurrency
NominalNominal
Névérték
MarktwertMarket value
EUR
% v. Teilfondsvermögen% of sub-fund assets
%-ában
Phosagro OJSC Reg.Shs(Sp.GDRs Reg.S)1/3/o.N. USD 2.570,00 31.428,26 0,22
RusHydro PAO Reg.Shs (Spons. ADRs)/100 RL 1 USD 63.000,00 56.414,37 0,39
Sberbank of Russia PJSC Reg.Shs (Sp.ADR‘s)/4 RL 3 USD 194.000,00 1.163.288,35 8,00
Surgutneftegaz Reg.Pfd Shs(Sp.ADRs)/10 RL 1 USD 32.500,00 191.429,71 1,32
Tatneft PJSC Reg.Shs (Sp.ADRs Reg.S)/6 DL 1 USD 13.500,00 379.990,39 2,61
VTB Bank PJSC Reg. Shs (GDRs Reg.S)/1 RL-,01 USD 140.000,00 265.859,80 1,83
X 5 Retail Group N.V. Reg.Shs (GDRs Reg S) 1/4/EO 1 USD 4.000,00 72.287,51 0,50
6.635.598,86 45,63
REITS • REITS
Emlak Konut Gayr. Yat. Ort. AS Namens-Aktien TN 1 TRY 60.000,00 52.838,60 0,36
52.838,60 0,36
Summe Wertpapiervermögen • Total securities holdings 14.466.362,60 99,47
Derivate • Derivatives
Aktienindex-Terminkontrakte • Share index future contracts
RXD Index Future 17.06.16 USD 30,00 13.246,20 0,09
Summe Derivate • Total derivatives 13.246,20 0,09
Bankguthaben • Cash at banks
Bankkonto M.M.Warburg & CO Luxembourg S.A. EUR 17.911,83 17.911,83 0,12
Bankkonto M.M.Warburg & CO Luxembourg S.A. PLN 132.316,20 31.048,77 0,22
Bankkonto M.M.Warburg & CO Luxembourg S.A. TRY 7.297,41 2.270,82 0,02
Bankkonto M.M.Warburg & CO Luxembourg S.A. USD 13.650,00 12.054,04 0,08
Summe Bankguthaben • Total cash at banks 63.285,46 0,44
Sonstige Vermögensgegenstände • Other assets
Dividendenforderungen TRY 37.316,00 11.612,04 0,08
Initial Margin M.M.Warburg & CO Luxembourg S.A. EUR 56.836,69 56.836,69 0,39
Zinsforderung Bankkonto M.M.Warburg & CO Luxembourg S.A. TRY 4,89 1,52 0,00
Summe Sonstige Vermögensgegenstände • Total other assets 68.450,25 0,47
Bankverbindlichkeiten • Bank debt/ bank liabilities/ bank loan facilities/ financial liabilities
Verbindlichkeiten aus Variation Margin M.M.Warburg & CO Luxembourg S.A.
USD -15.000,00 -13.246,20 -0,09
Summe Bankverbindlichkeiten • Total bank debt/ bank liabilities/ bank loan facilities/ financial liabilities
-13.246,20 -0,09
VERMÖGENSAUFSTELLUNG ZUM 31. MÄRZ 2016 (Fortsetzung) INVESTMENT PORTFOLIO AS AT MARCH 31ST, 2016 (continued)

40
DKB OSTEUROPA FONDS
WertpapierbezeichnungSecurities
WährungCurrency
NominalNominal
Névérték
MarktwertMarket value
EUR
% v. Teilfondsvermögen% of sub-fund assets
%-ában
Zinsverbindlichkeiten • Interest liabilities
Zinsverbindlichkeit Bankkonto M.M.Warburg & CO Luxembourg S.A. EUR -56,53 -56,53 0,00
Zinsverbindlichkeit Bankkonto M.M.Warburg & CO Luxembourg S.A. PLN -21,89 -5,14 0,00
Zinsverbindlichkeit Bankkonto M.M.Warburg & CO Luxembourg S.A. USD -6,50 -5,74 0,00
Summe Zinsverbindlichkeiten • Total interest liabilities -67,41 0,00
Sonstige Verbindlichkeiten • Other liabilities EUR -55.169,24 -55.169,24 -0,38
Teilfondsvermögen • Sub-fund assets 14.542.861,66 100,00 *)
*) Durch Rundungen bei der Berechnung können geringe Differenzen entstanden sein. • Slight deviations may have occurred as a result of rounding in the calculation.
Die Erläuterungen sind ein integraler Bestandteil dieses Berichtes • The accompanying notes are an integral part of this financial report
VERMÖGENSAUFSTELLUNG ZUM 31. MÄRZ 2016 (Fortsetzung) INVESTMENT PORTFOLIO AS AT MARCH 31ST, 2016 (continued)

DKB OSTEUROPA FONDS
41
VERPFLICHTUNGEN AUS DERIVATEN
LIABILITIES ON DERIVATIVES
FuturesFutures
WährungCurrency
Kontrakte Contracts
KontraktgrößeContract size
KursPrice
Dev.Kurs*) Exchange rate
Verpflichtungen aus Derivaten
Contingent liabilities under derivatives contracts
EUR
Futures Kauf • Futures purchases
RXD Index Future 17.06.16 USD 30,00 10,00 1.023,0000 1,1324 271.017,31
Summe Futures Kauf • Total futures: purchases 271.017,31
Sämtliche Derivate wurden über die M.M.Warburg & CO Luxembourg S.A. abgewickelt. • All derivatives were handled by M.M.Warburg & CO Luxembourg S.A.
*) Berechnung mit 6 Nachkommastellen (siehe Seite 102 f.). • Calculation with 6-digits (see page 102).
GEOGRAPHISCHE STRUKTUR DES WERTPAPIERVERMÖGENS IN PROZENT VOM TEILFONDSVERMÖGEN
STRUCTURE OF THE INVESTMENT PORTFOLIO BY GEOGRAPHICAL SECTOR IN PERCENT OF SUB-FUND ASSETS
LänderCountries
Kurswert in Mio. EUR Market value (millions) EUR
% v. Teilfondsvermögen % of sub-fund assets
Russland • Russia 6,56 45,01
Polen • Poland 2,70 18,57
Türkei • Turkey 1,98 13,61
Ungarn • Hungary 1,50 10,33
Tschechische Republik • Czech Republic 0,93 6,42
Luxemburg • Luxembourg 0,36 2,47
Österreich • Austria 0,35 2,44
Niederlande • Netherlands 0,07 0,50
Zypern • Cyprus 0,02 0,12
Summe • Total 14,47 99,47
Die Erläuterungen sind ein integraler Bestandteil dieses Berichtes • The accompanying notes are an integral part of this financial report
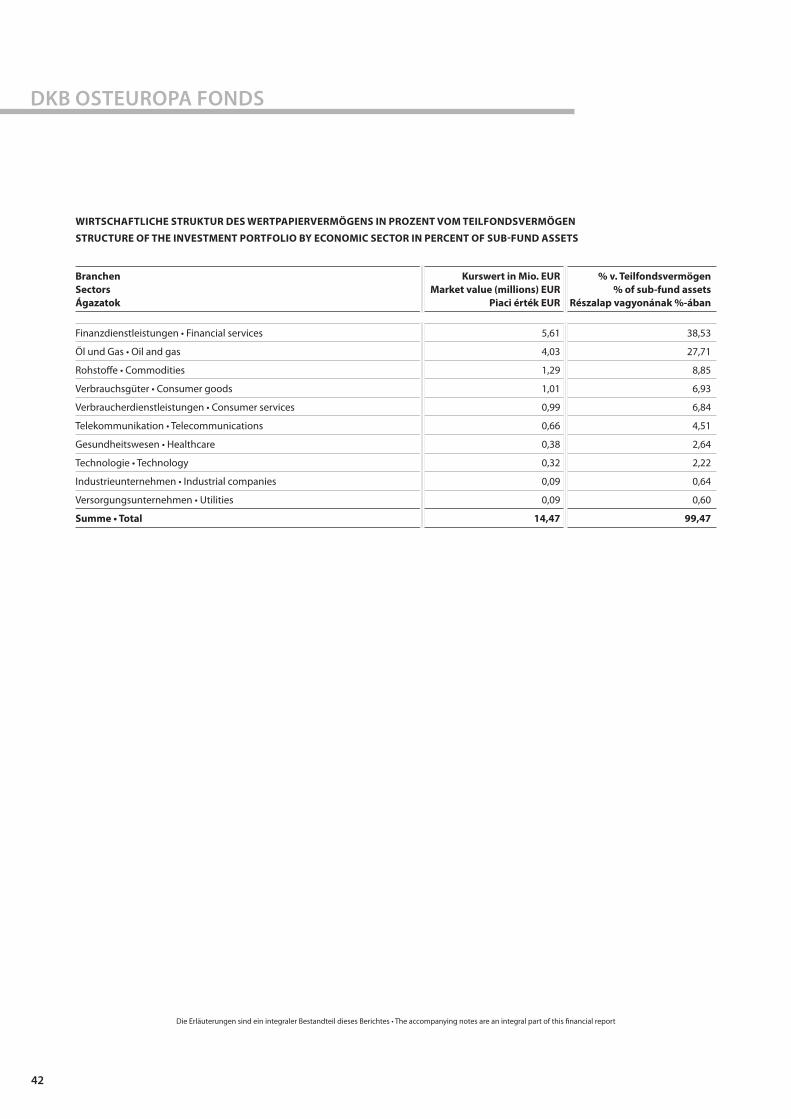
42
DKB OSTEUROPA FONDS
Die Erläuterungen sind ein integraler Bestandteil dieses Berichtes • The accompanying notes are an integral part of this financial report
WIRTSCHAFTLICHE STRUKTUR DES WERTPAPIERVERMÖGENS IN PROZENT VOM TEILFONDSVERMÖGEN
STRUCTURE OF THE INVESTMENT PORTFOLIO BY ECONOMIC SECTOR IN PERCENT OF SUB-FUND ASSETS
BranchenSectorsÁgazatok
Kurswert in Mio. EURMarket value (millions) EUR
Piaci érték EUR
% v. Teilfondsvermögen% of sub-fund assets
Részalap vagyonának %-ában
Finanzdienstleistungen • Financial services 5,61 38,53
Öl und Gas • Oil and gas 4,03 27,71
Rohstoffe • Commodities 1,29 8,85
Verbrauchsgüter • Consumer goods 1,01 6,93
Verbraucherdienstleistungen • Consumer services 0,99 6,84
Telekommunikation • Telecommunications 0,66 4,51
Gesundheitswesen • Healthcare 0,38 2,64
Technologie • Technology 0,32 2,22
Industrieunternehmen • Industrial companies 0,09 0,64
Versorgungsunternehmen • Utilities 0,09 0,60
Summe • Total 14,47 99,47

DKB OSTEUROPA FONDS
43
STATISTISCHE INFORMATIONEN
STATISTICAL INFORMATION
01.04.201531.03.2016
01.04.201431.03.2015
01.04.201331.03.2014
Umlaufende Anteile zu Beginn des Geschäftsjahres Klasse TNL • Units outstanding at the beginning of the financial year class TNL
218.432,2461 250.083,3522 317.676,4262
Ausgegebene Anteile Klasse TNL • Units issued class TNL 19.053,6730 19.806,5849 16.536,4820
Zurückgenommene Anteile Klasse TNL • Units redeemed class TNL 29.032,6960 51.457,6910 84.129,5560
Umlaufende Anteile am Ende des Geschäftsjahres Klasse TNL • Units outstanding at the end of the financial year class TNL
208.453,2231 218.432,2461 250.083,3522
31.03.2016EUR
31.03.2015EUR
31.03.2014EUR
Teilfondsvermögen • Sub-fund assets 14.542.861,66 16.614.617,40 17.786.603,75
Nettovermögenswert pro Anteil Klasse TNL • Net asset value per unit class TNL 69,77 76,06 71,12
Ausgabepreis pro Anteil Klasse TNL • Issue price per unit class TNL 69,77 76,06 71,12
Zwischengewinn pro Anteil Klasse TNL • Interim profit per unit class TNL 0,00 0,00 0,00
ZUSAMMENSETZUNG DES TEILFONDSVERMÖGENS
STATEMENT OF SUB-FUND ASSETS
31.03.2016
Wertpapiervermögen • Securities holdings EUR 14.466.362,60
Derivate • Derivatives EUR 13.246,20
Bankguthaben • Cash at banks EUR 63.285,46
Sonstige Vermögensgegenstände • Other assets EUR 68.450,25
Bankverbindlichkeiten • Bank debt/ bank liabilities/ bank loan facilities/ financial liabilities EUR -13.246,20
Zinsverbindlichkeiten • Interest liabilities EUR -67,41
Sonstige Verbindlichkeiten • Other liabilities EUR -55.169,24
Teilfondsvermögen • Sub-fund assets EUR 14.542.861,66
Das Teilfondsvermögen setzt sich zusammen aus insgesamt 208.453,22 umlaufenden Anteilen mit einem Inventarwert von EUR 69,77 (gerundet) pro Anteil.
Sub-fund assets are represented by a net asset value of EUR 69.77 (rounded) per unit on 208,453.22 units outstanding.
Die Erläuterungen sind ein integraler Bestandteil dieses Berichtes • The accompanying notes are an integral part of this financial report

44
DKB OSTEUROPA FONDS
ERTRAGS- UND AUFWANDSRECHNUNG
STATEMENT OF OPERATIONS
01.04.201531.03.2016
Total total EUR
Dividendenerträge • Dividend income 591.664,60
Quellensteuer auf Dividendenerträge • Withholding tax on dividend income -72.275,18
Erträge aus REITs • Income from REITs 3.357,69
Zinsen aus Geldanlagen • Interest on money-market investments 2,77
Ordentlicher Ertragsausgleich • Income equalisation -7.487,63
ERTRÄGE INSGESAMT • TOTAL INCOME 515.262,25
Verwaltungsvergütung • Management fee 1) -209.079,13
Zentraladministrationsvergütung • Central administration fee -14.933,87
Depotbankvergütung • Custodian fee -22.782,18
Vertriebsprovision • Sales commission -94.401,27
Prüfungskosten • Audit fees -8.877,90
Taxe d‘abonnement • Taxe d’abonnement -7.248,76
Veröffentlichungskosten • Publication costs -7.779,29
Zinsaufwendungen • Interest expenses -841,22
Sonstige Aufwendungen • Other expenses -43.424,21
Ordentlicher Aufwandsausgleich • Equalisation expenses 4.585,53
AUFWENDUNGEN INSGESAMT • TOTAL EXPENSES -404.782,30
ORDENTLICHER ERTRAGSÜBERSCHUSS • ORDINARY INCOME SURPLUS 110.479,95
1) Gemäß den Vertragsbedingungen erhält die Verwaltungsgesellschaft eine Gebühr von 1,40% p.a. für die Klasse TNL des am letzten Bewertungstages eines Monats festgestellten Fondsvermögens. Aus diesem Betrag wird auch das Anlageberaterhonorar vergütet.
The Management Company receives in accordance with the management regulations an annual fee of 1.40% for the class TNL of the fund assets as at the last valuation date of each month. The advisory fee will be paid out of this amount..
Die Erläuterungen sind ein integraler Bestandteil dieses Berichtes • The accompanying notes are an integral part of this financial report

DKB OSTEUROPA FONDS
45
ENTWICKLUNG DES TEILFONDSVERMÖGENS
CHANGES IN SUB-FUND ASSETS
01.04.201531.03.2016
Total total EUR
Teilfondsvermögen zu Beginn des Geschäftsjahres • Sub-fund assets at the beginning of the financial year 16.614.617,40
Mittelzufluss / -abfluss netto • Net subscriptions / redemptions -780.123,93
Ordentlicher Ertrags-/ Aufwandsausgleich • Income equalisation/ equalisation expenses 2.902,10
Ordentlicher Ertragsüberschuss • Ordinary income surplus 110.479,95
Außerordentlicher Ertrags-/Aufwandsausgleich • Extraordinary income equalisation/ equalisation expenses 2.966,29
Nettoergebnis der realisierten Gewinne und Verluste inkl. außerordentlicher Ertrags-/Aufwandsausgleich • Net realised profits / (–) losses incl. income/ expenses equalisation
-231.456,59
Nettoveränderung der nicht realisierten Gewinne und Verluste • Net change in unrealised profits and losses -1.176.523,56
TEILFONDSVERMÖGEN ZUM ENDE DES GESCHÄFTSJAHRES • SUB-FUND ASSETS AT THE END OF THE FINANCIAL YEAR 14.542.861,66
*) Die Anteilklasse InstAL wurde zum 21. November 2014 geschlossen. • The unit-class InstAL was closed as at November 21st, 2014. • Az InstAL részvényosztályt 2014. november 21-én megszüntették.
Die Erläuterungen sind ein integraler Bestandteil dieses Berichtes • The accompanying notes are an integral part of this financial report

46
DKB NORDAMERIKA FONDS
VERMÖGENSAUFSTELLUNG ZUM 31. MÄRZ 2016 INVESTMENT PORTFOLIO AS AT MARCH 31ST, 2016
WertpapierbezeichnungSecurities
WährungCurrency
NominalNominal
MarktwertMarket value
EUR
% v. Teilfondsvermögen% of sub-fund assets
Wertpapiervermögen • Securities holdings
Amtlich gehandelte Wertpapiere • Officially traded securities
Aktien • Shares
21st Century Fox Inc. Registered Shares A DL -,01 USD 2.126,00 52.399,03 0,28
21st Century Fox Inc. Registered Shares B DL -,01 USD 799,00 19.897,39 0,11
3M Co. Registered Shares DL -,01 USD 1.163,00 171.255,96 0,91
Abbott Laboratories Registered Shares o.N. USD 2.817,00 103.610,08 0,55
AbbVie Inc. Registered Shares DL -,01 USD 3.066,00 154.328,86 0,82
Accenture PLC Reg.Shares Class A DL -,000025 USD 1.187,00 120.932,70 0,64
Allergan PLC Registered Shares DL-,0001 USD 743,00 180.395,99 0,96
Allstate Corp., The Registered Shares DL -,01 USD 756,00 45.210,46 0,24
Alphabet Inc. Reg. Shs Cap.Stk Cl. C DL-,001 USD 561,00 371.818,55 1,97
Alphabet Inc. Reg. Shs Cl. A DL-,001 USD 550,00 373.178,21 1,98
Altria Group Inc. Registered Shares DL -,333 USD 3.726,00 205.910,53 1,09
Amazon.com Inc. Registered Shares DL -,01 USD 726,00 383.829,87 2,04
American Express Co. Registered Shares DL -,20 USD 1.556,00 82.842,85 0,44
American International Grp Inc Registered Shares New DL 2,50 USD 2.183,00 105.101,70 0,56
Amgen Inc. Registered Shares DL -,0001 USD 1.405,00 185.463,97 0,98
Apple Inc. Registered Shares o.N. USD 10.531,00 1.018.877,04 5,39
AT & T Inc. Registered Shares DL 1 USD 11.624,00 404.130,06 2,14
Bank of America Corp. Registered Shares DL 0,01 USD 19.407,00 231.019,39 1,23
Berkshire Hathaway Inc. Reg.Shares B New DL -,00333 USD 3.540,00 445.344,75 2,36
Biogen Inc. Registered Shares DL-,0005 USD 421,00 94.498,22 0,50
Bk of New York MellonCorp.,The Registered Shares DL -,01 USD 2.043,00 67.005,49 0,36
Blackrock Inc. Reg. Shares Class A DL -,01 USD 240,00 72.349,70 0,38
Bristol-Myers Squibb Co. Registered Shares DL -,10 USD 3.171,00 177.647,69 0,94
California Resources Corp. Registered Shares DL -,01 USD 137,00 127,03 0,00
Capital One Financial Corp. Registered Shares DL -,01 USD 1.010,00 61.675,64 0,33
Caterpillar Inc. Registered Shares DL 1 USD 1.106,00 74.726,30 0,40
Celgene Corp. Registered Shares DL -,01 USD 1.485,00 129.563,76 0,69
Chevron Corp. Registered Shares DL-,75 USD 3.576,00 300.789,47 1,60
Cisco Systems Inc. Registered Shares DL-,001 USD 9.608,00 241.472,70 1,28
Citigroup Inc. Registered Shares New DL -,01 USD 5.607,00 207.365,91 1,10
Coca-Cola Co., The Registered Shares DL -,25 USD 7.396,00 304.226,14 1,61
Colgate-Palmolive Co. Registered Shares DL 1 USD 1.631,00 101.858,28 0,54
Comcast Corp. Reg. Shares Class A DL -,01 USD 4.600,00 246.979,87 1,31
ConocoPhillips Registered Shares DL -,01 USD 2.278,00 80.627,20 0,43

DKB NORDAMERIKA FONDS
47
WertpapierbezeichnungSecurities
WährungCurrency
NominalNominal
MarktwertMarket value
EUR
% v. Teilfondsvermögen% of sub-fund assets
Costco Wholesale Corp. Registered Shares DL -,005 USD 822,00 114.400,57 0,61
CVS Health Corp. Registered Shares DL-,01 USD 2.086,00 191.671,05 1,02
Danaher Corp. Registered Shares DL -,01 USD 1.135,00 95.248,19 0,51
Disney Co., The Walt Registered Shares DL -,01 USD 2.851,00 249.021,91 1,32
Dow Chemical Co., The Registered Shares DL 2,50 USD 2.095,00 95.240,73 0,51
Duke Energy Corp. (New) Registered Shares New DL -,001 USD 1.307,00 92.738,83 0,49
Du Pont Nemours & Co., E.I. Registered Shares DL -,30 USD 1.656,00 93.840,97 0,50
EMC Corp. Registered Shares DL -,01 USD 3.589,00 84.622,31 0,45
Emerson Electric Co. Registered Shares DL -,50 USD 1.235,00 59.503,36 0,32
Exelon Corp. Registered Shares o.N. USD 1.747,00 54.659,32 0,29
Exxon Mobil Corp. Registered Shares o.N. USD 7.866,00 587.102,01 3,10
Facebook Inc. Reg.Shares Cl.A DL-,000006 USD 4.359,00 441.520,05 2,34
Fedex Corp. Registered Shares DL -,10 USD 487,00 69.484,80 0,37
Ford Motor Co. Registered Shares DL -,01 USD 7.417,00 87.439,91 0,46
General Electric Co. Registered Shares DL -,06 USD 17.722,00 498.137,81 2,64
General Motors Co. Registered Shares DL -,01 USD 2.670,00 73.068,97 0,39
Gilead Sciences Inc. Registered Shares DL -,001 USD 2.596,00 210.839,03 1,12
Goldman Sachs Group Inc., The Registered Shares DL -,01 USD 742,00 102.545,92 0,54
Halliburton Co. Registered Shares DL 2,50 USD 1.584,00 50.384,74 0,27
Home Depot Inc., The Registered Shares DL -,05 USD 2.400,00 282.769,34 1,50
Intel Corp. Registered Shares DL -,001 USD 9.007,00 260.172,17 1,38
Intl Business Machines Corp. Registered Shares DL -,20 USD 1.679,00 220.046,26 1,17
Johnson & Johnson Registered Shares DL 1 USD 5.228,00 503.132,67 2,66
JPMorgan Chase & Co. Registered Shares DL 1 USD 6.956,00 366.780,96 1,95
Kinder Morgan Inc. Registered Shares P DL -,01 USD 3.476,00 54.822,82 0,29
Lilly & Co., Eli Registered Shares o.N. USD 1.848,00 117.140,09 0,62
Lowe‘s Companies Inc. Registered Shares DL -,50 USD 1.725,00 115.802,28 0,61
MasterCard Inc. Registered Shares A DL -,0001 USD 1.857,00 153.837,13 0,82
McDonald‘s Corp. Registered Shares DL-,01 USD 1.712,00 190.233,98 1,01
Medtronic PLC Registered Shares DL -,0001 USD 2.633,00 175.362,82 0,93
Merck & Co. Inc. Registered Shares DL-,01 USD 5.279,00 248.099,95 1,32
MetLife Inc. Registered Shares DL -,01 USD 2.111,00 83.384,87 0,44
Microsoft Corp. Registered Shares DL-,00000625 USD 15.023,00 730.321,57 3,86
Mondelez International Inc. Registered Shares Class A o.N. USD 3.006,00 107.402,65 0,57
Monsanto Co. Registered Shares DL -,01 USD 831,00 66.845,45 0,35
Morgan Stanley Registered Shares DL -,01 USD 2.840,00 62.874,25 0,33
Nextera Energy Inc. Registered Shares DL -,01 USD 875,00 91.564,38 0,49
VERMÖGENSAUFSTELLUNG ZUM 31. MÄRZ 2016 (Fortsetzung) INVESTMENT PORTFOLIO AS AT MARCH 31ST, 2016 (continued)
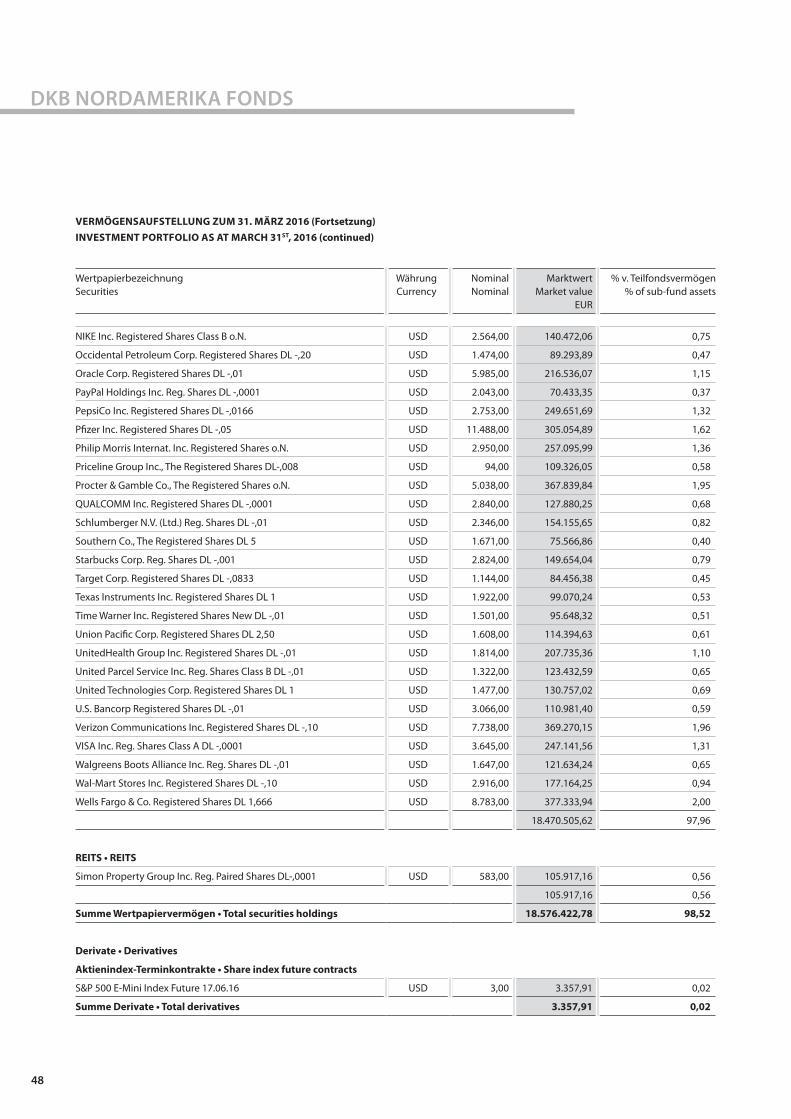
48
DKB NORDAMERIKA FONDS
WertpapierbezeichnungSecurities
WährungCurrency
NominalNominal
MarktwertMarket value
EUR
% v. Teilfondsvermögen% of sub-fund assets
NIKE Inc. Registered Shares Class B o.N. USD 2.564,00 140.472,06 0,75
Occidental Petroleum Corp. Registered Shares DL -,20 USD 1.474,00 89.293,89 0,47
Oracle Corp. Registered Shares DL -,01 USD 5.985,00 216.536,07 1,15
PayPal Holdings Inc. Reg. Shares DL -,0001 USD 2.043,00 70.433,35 0,37
PepsiCo Inc. Registered Shares DL -,0166 USD 2.753,00 249.651,69 1,32
Pfizer Inc. Registered Shares DL -,05 USD 11.488,00 305.054,89 1,62
Philip Morris Internat. Inc. Registered Shares o.N. USD 2.950,00 257.095,99 1,36
Priceline Group Inc., The Registered Shares DL-,008 USD 94,00 109.326,05 0,58
Procter & Gamble Co., The Registered Shares o.N. USD 5.038,00 367.839,84 1,95
QUALCOMM Inc. Registered Shares DL -,0001 USD 2.840,00 127.880,25 0,68
Schlumberger N.V. (Ltd.) Reg. Shares DL -,01 USD 2.346,00 154.155,65 0,82
Southern Co., The Registered Shares DL 5 USD 1.671,00 75.566,86 0,40
Starbucks Corp. Reg. Shares DL -,001 USD 2.824,00 149.654,04 0,79
Target Corp. Registered Shares DL -,0833 USD 1.144,00 84.456,38 0,45
Texas Instruments Inc. Registered Shares DL 1 USD 1.922,00 99.070,24 0,53
Time Warner Inc. Registered Shares New DL -,01 USD 1.501,00 95.648,32 0,51
Union Pacific Corp. Registered Shares DL 2,50 USD 1.608,00 114.394,63 0,61
UnitedHealth Group Inc. Registered Shares DL -,01 USD 1.814,00 207.735,36 1,10
United Parcel Service Inc. Reg. Shares Class B DL -,01 USD 1.322,00 123.432,59 0,65
United Technologies Corp. Registered Shares DL 1 USD 1.477,00 130.757,02 0,69
U.S. Bancorp Registered Shares DL -,01 USD 3.066,00 110.981,40 0,59
Verizon Communications Inc. Registered Shares DL -,10 USD 7.738,00 369.270,15 1,96
VISA Inc. Reg. Shares Class A DL -,0001 USD 3.645,00 247.141,56 1,31
Walgreens Boots Alliance Inc. Reg. Shares DL -,01 USD 1.647,00 121.634,24 0,65
Wal-Mart Stores Inc. Registered Shares DL -,10 USD 2.916,00 177.164,25 0,94
Wells Fargo & Co. Registered Shares DL 1,666 USD 8.783,00 377.333,94 2,00
18.470.505,62 97,96
REITS • REITS
Simon Property Group Inc. Reg. Paired Shares DL-,0001 USD 583,00 105.917,16 0,56
105.917,16 0,56
Summe Wertpapiervermögen • Total securities holdings 18.576.422,78 98,52
Derivate • Derivatives
Aktienindex-Terminkontrakte • Share index future contracts
S&P 500 E-Mini Index Future 17.06.16 USD 3,00 3.357,91 0,02
Summe Derivate • Total derivatives 3.357,91 0,02
VERMÖGENSAUFSTELLUNG ZUM 31. MÄRZ 2016 (Fortsetzung) INVESTMENT PORTFOLIO AS AT MARCH 31ST, 2016 (continued)
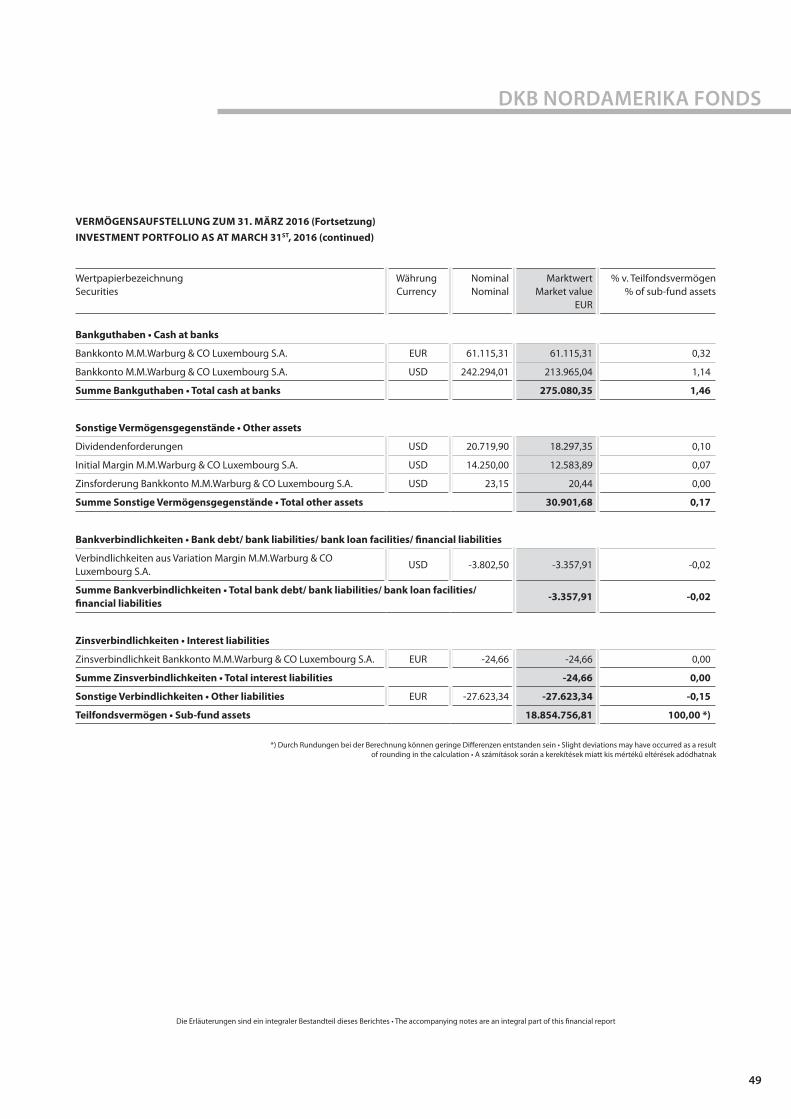
DKB NORDAMERIKA FONDS
49
WertpapierbezeichnungSecurities
WährungCurrency
NominalNominal
MarktwertMarket value
EUR
% v. Teilfondsvermögen% of sub-fund assets
Bankguthaben • Cash at banks
Bankkonto M.M.Warburg & CO Luxembourg S.A. EUR 61.115,31 61.115,31 0,32
Bankkonto M.M.Warburg & CO Luxembourg S.A. USD 242.294,01 213.965,04 1,14
Summe Bankguthaben • Total cash at banks 275.080,35 1,46
Sonstige Vermögensgegenstände • Other assets
Dividendenforderungen USD 20.719,90 18.297,35 0,10
Initial Margin M.M.Warburg & CO Luxembourg S.A. USD 14.250,00 12.583,89 0,07
Zinsforderung Bankkonto M.M.Warburg & CO Luxembourg S.A. USD 23,15 20,44 0,00
Summe Sonstige Vermögensgegenstände • Total other assets 30.901,68 0,17
Bankverbindlichkeiten • Bank debt/ bank liabilities/ bank loan facilities/ financial liabilities
Verbindlichkeiten aus Variation Margin M.M.Warburg & CO Luxembourg S.A.
USD -3.802,50 -3.357,91 -0,02
Summe Bankverbindlichkeiten • Total bank debt/ bank liabilities/ bank loan facilities/ financial liabilities
-3.357,91 -0,02
Zinsverbindlichkeiten • Interest liabilities
Zinsverbindlichkeit Bankkonto M.M.Warburg & CO Luxembourg S.A. EUR -24,66 -24,66 0,00
Summe Zinsverbindlichkeiten • Total interest liabilities -24,66 0,00
Sonstige Verbindlichkeiten • Other liabilities EUR -27.623,34 -27.623,34 -0,15
Teilfondsvermögen • Sub-fund assets 18.854.756,81 100,00 *)
*) Durch Rundungen bei der Berechnung können geringe Differenzen entstanden sein • Slight deviations may have occurred as a result of rounding in the calculation • A számítások során a kerekítések miatt kis mértékű eltérések adódhatnak
VERMÖGENSAUFSTELLUNG ZUM 31. MÄRZ 2016 (Fortsetzung) INVESTMENT PORTFOLIO AS AT MARCH 31ST, 2016 (continued)
Die Erläuterungen sind ein integraler Bestandteil dieses Berichtes • The accompanying notes are an integral part of this financial report

50
DKB NORDAMERIKA FONDS
VERPFLICHTUNGEN AUS DERIVATEN
LIABILITIES ON DERIVATIVES
FuturesFutures
WährungCurrency
KontrakteContracts
KontraktgrößeContract size
KursPrice
Dev.Kurs **) Exchange rate
Verpflichtungen aus Derivaten
Contingent liabilities under derivatives
contractsEUR
Futures Kauf • Futures purchases
S&P 500 E-Mini Index Future 17.06.16 USD 3,00 50,00 2.055,2000 1,1324 272.235,96
Summe Futures Kauf • Total futures purchases 272.235,96
Sämtliche Derivate wurden über die M.M.Warburg & CO Luxembourg S.A. abgewickelt. • All derivatives were handled by M.M.Warburg & CO Luxembourg S.A.
**) Berechnung mit 6 Nachkommastellen (siehe Seite 102 f.). • Calculation with 6-digits (see page 102).
GEOGRAPHISCHE STRUKTUR DES WERTPAPIERVERMÖGENS IN PROZENT VOM TEILFONDSVERMÖGEN
STRUCTURE OF THE INVESTMENT PORTFOLIO BY GEOGRAPHICAL SECTOR IN PERCENT OF SUB-FUND ASSETS
LänderCountries
Kurswert in Mio. EURMarket value (millions) EUR
% v. Teilfondsvermögen% of sub-fund assets
USA • USA 17,95 95,17
Irland • Ireland 0,48 2,53
Curaçao • Curacao 0,15 0,82
Summe • Total 18,58 98,52
Die Erläuterungen sind ein integraler Bestandteil dieses Berichtes • The accompanying notes are an integral part of this financial report

DKB NORDAMERIKA FONDS
51
WIRTSCHAFTLICHE STRUKTUR DES WERTPAPIERVERMÖGENS IN PROZENT VOM TEILFONDSVERMÖGEN
STRUCTURE OF THE INVESTMENT PORTFOLIO BY ECONOMIC SECTOR IN PERCENT OF SUB-FUND ASSETS
BranchenSectorsÁgazatok
Kurswert in Mio. EURMarket value (millions) EUR
Piaci érték EUR
% v. Teilfondsvermögen% of sub-fund assets
Részalap vagyonának %-ában
Technologie • Technology 4,20 22,20
Finanzdienstleistungen • Financial services 2,93 15,53
Gesundheitswesen • Healthcare 2,79 14,81
Verbraucherdienstleistungen • Consumer services 2,58 13,71
Verbrauchsgüter • Consumer goods 1,96 10,40
Industrieunternehmen • Industrial companies 1,53 8,11
Öl und Gas • Oil and gas 1,32 6,99
Telekommunikation • Telecommunications 0,77 4,10
Versorgungsunternehmen • Utilities 0,31 1,67
Rohstoffe • Commodities 0,19 1,00
Summe • Total 18,58 98,52
STATISTISCHE INFORMATIONEN STATISTICAL INFORMATION
01.04.201531.03.2016
01.04.201431.03.2015
01.04.201331.03.2014
Umlaufende Anteile zu Beginn des Geschäftsjahres Klasse TNL • Units outstanding at the beginning of the financial year class TNL
1.124.853,758 1.362.560,996 1.370.340,713
Ausgegebene Anteile Klasse TNL • Units issued class TNL 42.131,014 93.247,426 45.982,849
Zurückgenommene Anteile Klasse TNL • Units redeemed class TNL 58.097,420 330.954,664 53.762,566
Umlaufende Anteile am Ende des Geschäftsjahres Klasse TNL • Units outstanding at the end of the financial year class TNL
1.108.887,352 1.124.853,758 1.362.560,996
31.03.2016EUR
31.03.2015EUR
31.03.2014EUR
Teilfondsvermögen • Sub-fund assets 18.854.756,81 19.747.692,80 16.997.622,07
Nettovermögenswert pro Anteil Klasse TNL • Net asset value per unit class TNL 17,00 17,56 12,47
Ausgabepreis pro Anteil Klasse TNL • Issue price per unit class TNL 17,00 17,56 12,47
Zwischengewinn pro Anteil Klasse TNL • Interim profit per unit class TNL 0,00 0,00 0,00
Die Erläuterungen sind ein integraler Bestandteil dieses Berichtes • The accompanying notes are an integral part of this financial report
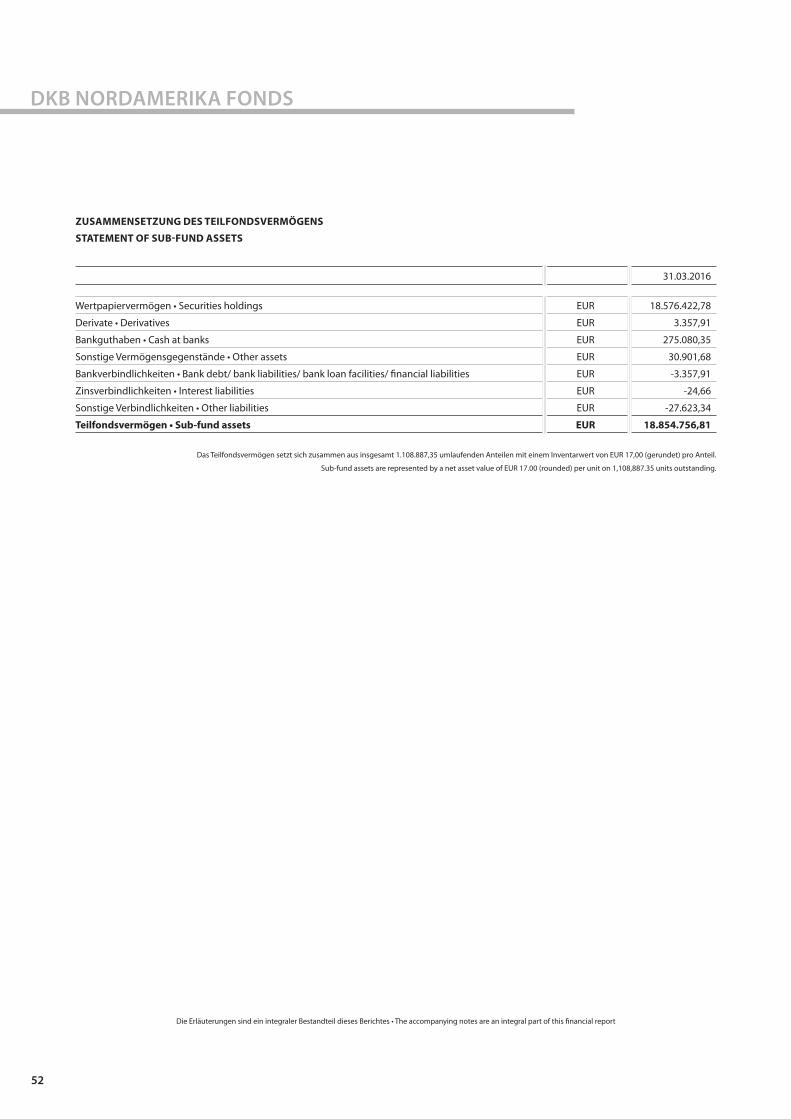
52
DKB NORDAMERIKA FONDS
ZUSAMMENSETZUNG DES TEILFONDSVERMÖGENS
STATEMENT OF SUB-FUND ASSETS
31.03.2016
Wertpapiervermögen • Securities holdings EUR 18.576.422,78
Derivate • Derivatives EUR 3.357,91
Bankguthaben • Cash at banks EUR 275.080,35
Sonstige Vermögensgegenstände • Other assets EUR 30.901,68
Bankverbindlichkeiten • Bank debt/ bank liabilities/ bank loan facilities/ financial liabilities EUR -3.357,91
Zinsverbindlichkeiten • Interest liabilities EUR -24,66
Sonstige Verbindlichkeiten • Other liabilities EUR -27.623,34
Teilfondsvermögen • Sub-fund assets EUR 18.854.756,81
Das Teilfondsvermögen setzt sich zusammen aus insgesamt 1.108.887,35 umlaufenden Anteilen mit einem Inventarwert von EUR 17,00 (gerundet) pro Anteil.
Sub-fund assets are represented by a net asset value of EUR 17.00 (rounded) per unit on 1,108,887.35 units outstanding.
Die Erläuterungen sind ein integraler Bestandteil dieses Berichtes • The accompanying notes are an integral part of this financial report

DKB NORDAMERIKA FONDS
53
Die Erläuterungen sind ein integraler Bestandteil dieses Berichtes • The accompanying notes are an integral part of this financial report
ERTRAGS- UND AUFWANDSRECHNUNG
STATEMENT OF OPERATIONS
01.04.201531.03.2016
Total total EUR
Dividendenerträge • Dividend income 432.002,98
Quellensteuer auf Dividendenerträge • Withholding tax on dividend income -127.874,97
Erträge aus REITs • Income from REITs 3.281,54
Quellensteuer auf REITs-Erträge • Withholding tax on REITS income -984,47
Zinsen aus Geldanlagen • Interest on money-market investments 20,44
Sonstige Erträge • Other income 1.028,94
Ordentlicher Ertragsausgleich • Income equalisation 357,74
ERTRÄGE INSGESAMT • TOTAL INCOME 307.832,20
Verwaltungsvergütung • Management fee 1) -85.803,89
Zentraladministrationsvergütung • Central administration fee -19.067,41
Depotbankvergütung • Custodian fee -11.633,55
Vertriebsprovision • Sales commission -28.037,83
Prüfungskosten • Audit fees -4.991,70
Taxe d‘abonnement • Taxe d’abonnement -9.327,48
Veröffentlichungskosten • Publication costs -8.062,81
Zinsaufwendungen • Interest expenses -113,74
Sonstige Aufwendungen • Other expenses -16.675,12
Ordentlicher Aufwandsausgleich • Equalisation expenses -208,47
AUFWENDUNGEN INSGESAMT • TOTAL EXPENSES -183.922,00
ORDENTLICHER ERTRAGSÜBERSCHUSS • ORDINARY INCOME SURPLUS 123.910,20
1) Gemäß den Vertragsbedingungen erhält die Verwaltungsgesellschaft eine Gebühr von 0,45% p.a. für die Klasse TNL des am letzten Bewertungstages eines Monats festgestellten Teilfondsvermögens. Aus diesem Betrag wird auch das Anlageberaterhonorar vergütet.
The Management Company receives in accordance with the management regulations an annual fee of 0.45% for the class TNL of the sub-fund assets as at the last valuation date of each month. The advisory fee will be paid out of this amount.

54
DKB NORDAMERIKA FONDS
ENTWICKLUNG DES TEILFONDSVERMÖGENS
CHANGES IN SUB-FUND ASSETS
01.04.201531.03.2016
Total total EUR
Teilfondsvermögen zu Beginn des Geschäftsjahres • Sub-fund assets at the beginning of the financial year 19.747.692,80
Mittelzufluss / -abfluss netto • Net subscriptions / redemptions -289.261,92
Ordentlicher Ertrags-/ Aufwandsausgleich • Income equalisation/ equalisation expenses -149,27
Ordentlicher Ertragsüberschuss • Ordinary income surplus 123.910,20
Außerordentlicher Ertrags-/Aufwandsausgleich • Extraordinary income equalisation/ equalisation expenses -677,98
Nettoergebnis der realisierten Gewinne und Verluste inkl. außerordentlicher Ertrags-/Aufwandsausgleich • Net realised profits / (–) losses incl. income/ expenses equalisation
406.880,22
Nettoveränderung der nicht realisierten Gewinne und Verluste • Net change in unrealised profits and losses -1.133.637,24
TEILFONDSVERMÖGEN ZUM ENDE DES GESCHÄFTSJAHRES • SUB-FUND ASSETS AT THE END OF THE FINANCIAL YEAR 18.854.756,81
Die Erläuterungen sind ein integraler Bestandteil dieses Berichtes • The accompanying notes are an integral part of this financial report

55
DKB ASIEN FONDS
VERMÖGENSAUFSTELLUNG ZUM 31. MÄRZ 2016 INVESTMENT PORTFOLIO AS AT MARCH 31ST, 2016
WertpapierbezeichnungSecurities
WährungCurrency
NominalNominal
MarktwertMarket value
EUR
% v. Teilfondsvermögen% of sub-fund assets
%-ában
Wertpapiervermögen • Securities holdings
Amtlich gehandelte Wertpapiere • Officially traded securities
Aktien • Shares
Australia & N. Z. Bkg Grp Ltd. Registered Shares o.N. AUD 20.000,00 316.220,66 1,75
BHP Billiton Ltd. Registered Shares DL -,50 AUD 26.600,00 302.253,58 1,67
Commonwealth Bank of Australia Registered Shares o.N. AUD 8.500,00 429.189,35 2,38
CSL Ltd. Registered Shares o.N. AUD 4.480,00 306.280,61 1,69
CYBG PLC Shs(Df.Ch.D.Int./D.CDIS)/LS-01 AUD 2.850,00 7.567,86 0,04
National Australia Bank Ltd. Registered Shares o.N. AUD 11.400,00 201.604,83 1,11
Suncorp Group Ltd. Registered Shares o.N. AUD 28.000,00 224.751,21 1,24
Telstra Corp. Ltd. Registered Shares o.N. AUD 66.900,00 240.317,60 1,33
Westpac Banking Corp. Registered Shares o.N. AUD 20.000,00 409.091,95 2,26
Woolworths Ltd. Registered Shares o.N. AUD 16.000,00 238.311,23 1,32
2.675.588,88 14,79
AIA Group Ltd Registerd Shares o.N. HKD 73.300,00 366.385,37 2,03
China Overseas Ppty Hldgs Ltd. Registered Shares HD-,001 HKD 28.366,00 3.645,46 0,02
China Ov.Land & Inv. Ltd. Registered Shares o.N. HKD 85.100,00 237.605,41 1,31
CK Hutchison Holdings Ltd. Registered Shares o.N. HKD 22.900,00 262.264,93 1,45
Hongkong Exch. + Clear. Ltd. Registered Shs (BL 100) o.N. HKD 10.000,00 212.447,76 1,17
1.082.348,93 5,98
AIN Holdings Inc. Registered Shares o.N. JPY 9.000,00 407.236,63 2,24
Asahi Glass Co. Ltd. Registered Shares o.N. JPY 44.000,00 212.550,39 1,17
Asahi Group Holdings Ltd. Registered Shares o.N. JPY 7.800,00 214.515,60 1,19
Astellas Pharma Inc. Registered Shares o.N. JPY 17.000,00 199.505,17 1,10
Bridgestone Corp. Registered Shares o.N. JPY 8.000,00 263.805,89 1,46
Central Japan Railway Co. Registered Shares o.N. JPY 1.700,00 265.362,54 1,47
Daiwa House Industry Co. Ltd. Registered Shares o.N. JPY 8.900,00 220.968,02 1,22
East Japan Railway Co. Registered Shares o.N. JPY 3.200,00 243.742,84 1,35
Eisai Co. Ltd. Registered Shares o.N. JPY 3.200,00 169.889,74 0,94
Fanuc Corp. Registered Shares o.N. JPY 1.500,00 205.676,85 1,14
Fast Retailing Co. Ltd. Registered Shares o.N. JPY 530,00 149.709,06 0,83
Fujifilm Holdings Corp. Registered Shares o.N. JPY 5.500,00 191.976,82 1,06
Fuji Heavy Industries Ltd. Registered Shares o.N. JPY 7.000,00 218.204,49 1,21
Fuji Media Holdings Inc. Registered Shares o.N. JPY 21.000,00 203.547,73 1,12
Hitachi Ltd. Registered Shares o.N. JPY 40.700,00 168.075,25 0,93
Honda Motor Co. Ltd. Registered Shares o.N. JPY 10.300,00 249.265,20 1,38

56
DKB ASIEN FONDS
WertpapierbezeichnungSecurities
WährungCurrency
NominalNominal
MarktwertMarket value
EUR
% v. Teilfondsvermögen% of sub-fund assets
%-ában
ITOCHU Corp. Registered Shares o.N. JPY 26.600,00 289.116,83 1,60
Japan Tobacco Inc. Registered Shares o.N. JPY 7.500,00 275.843,41 1,52
Kao Corp. Registered Shares o.N. JPY 5.100,00 240.086,11 1,33
KDDI Corp. Registered Shares o.N. JPY 11.100,00 261.661,88 1,45
Keyence Corp. Registered Shares o.N. JPY 570,00 274.410,67 1,52
Kuraray Co. Ltd. Registered Shares o.N. JPY 23.000,00 248.184,57 1,37
Lawson Inc. Registered Shares o.N. JPY 3.200,00 236.390,16 1,31
Mitsubishi Corp. Registered Shares o.N. JPY 16.800,00 251.108,08 1,39
Mitsubishi Estate Co. Ltd. Registered Shares o.N. JPY 11.100,00 181.970,78 1,01
Mitsubishi UFJ Finl Grp Inc. Registered Shares o.N. JPY 72.000,00 294.452,55 1,62
Mitsui Fudosan Co. Ltd. Registered Shares o.N. JPY 8.800,00 193.779,70 1,07
Mizuho Financial Group Inc. Registered Shares o.N. JPY 177.700,00 234.252,18 1,29
Nagoya Railroad Co. Ltd. Registered Shares o.N. JPY 75.000,00 309.368,09 1,70
Nintendo Co. Ltd. Registered Shares o.N. JPY 1.100,00 138.019,73 0,76
Nippon Tel. and Tel. Corp. Registered Shares o.N. JPY 7.500,00 285.136,22 1,58
NTT DOCOMO INC. Registered Shares o.N. JPY 11.000,00 220.184,60 1,22
Omron Corp. Registered Shares o.N. JPY 7.000,00 183.895,61 1,02
ORIX Corp. Registered Shares o.N. JPY 16.500,00 207.741,26 1,15
Sekisui Chemical Co. Ltd. Registered Shares o.N. JPY 20.100,00 218.467,98 1,21
Seven & I Holdings Co. Ltd. Registered Shares o.N. JPY 5.600,00 210.442,45 1,16
SMC Corp. Registered Shares o.N. JPY 1.000,00 204.990,67 1,13
SoftBank Group Corp. Registered Shares o.N. JPY 5.100,00 214.609,70 1,19
Sompo Japan Nipponkoa Holdings Registered Shares o.N. JPY 10.000,00 250.003,92 1,38
SONY Corp. Registered Shares o.N. JPY 9.500,00 215.526,44 1,19
Sumitomo Corp. Registered Shares o.N. JPY 30.000,00 263.139,32 1,45
Sumitomo Mitsui Financ. Group Registered Shares o.N. JPY 8.300,00 222.083,16 1,23
Sumitomo Realty & Dev. Co.Ltd. Registered Shares o.N. JPY 6.800,00 175.655,20 0,97
Suruga Bank Ltd., The Registered Shares o.N. JPY 15.000,00 232.673,03 1,29
Takeda Pharmaceutical Co. Ltd. Registered Shares o.N. JPY 5.100,00 205.411,00 1,14
Tokyo Electric Pwr Co.Hldg.Inc Registered Shares o.N. JPY 20.000,00 97.084,33 0,54
Toray Industries Inc. Registered Shares o.N. JPY 30.000,00 225.662,26 1,25
Toyota Industries Corp. Registered Shares o.N. JPY 5.400,00 214.275,63 1,18
Toyota Motor Corp. Registered Shares o.N. JPY 12.300,00 574.111,89 3,16
11.433.771,63 63,19
DBS Group Holdings Ltd. Registered Shares SD 1 SGD 23.000,00 231.121,04 1,28
Oversea-Chinese Bnkg Corp.Ltd. Registered Shares SD -,50 SGD 46.000,00 265.684,01 1,47
S‘pore Telecommunications Ltd. Registered Shares SD -,15 SGD 122.000,00 304.493,84 1,67
United Overseas Bank Ltd. Registered Shares SD 1 SGD 22.700,00 279.867,89 1,55
1.081.166,78 5,97
VERMÖGENSAUFSTELLUNG ZUM 31. MÄRZ 2016 (Fortsetzung) INVESTMENT PORTFOLIO AS AT MARCH 31ST, 2016 (continued)

DKB ASIEN FONDS
57
WertpapierbezeichnungSecurities
WährungCurrency
NominalNominal
MarktwertMarket value
EUR
% v. Teilfondsvermögen% of sub-fund assets
%-ában
Andere Wertpapiere • Other securities
Transurban Group Triple Stapled Securities o.N. AUD 38.000,00 290.677,69 1,61
290.677,69 1,61
REITS • REITS
Stockland Reg. Stapled Secs o.N. AUD 107.000,00 307.924,25 1,70
307.924,25 1,70
Wertpapier-Investmentanteile • Investment fund units
db x-tr.MSCI TAIWAN In.ETF(DR) Inhaber-Anteile 1C o.N. EUR 50.000,00 906.500,00 5,01
906.500,00 5,01
Summe Wertpapiervermögen • Total securities holdings 17.777.978,16 98,25
Bankguthaben • Cash at banks
Bankkonto M.M.Warburg & CO Luxembourg S.A. AUD 165.553,62 111.576,04 0,61
Bankkonto M.M.Warburg & CO Luxembourg S.A. EUR 26.998,91 26.998,91 0,15
Bankkonto M.M.Warburg & CO Luxembourg S.A. HKD 33.213,62 3.777,39 0,02
Bankkonto M.M.Warburg & CO Luxembourg S.A. JPY 13.086.748,00 102.626,67 0,57
Bankkonto M.M.Warburg & CO Luxembourg S.A. SGD 15.606,97 10.197,04 0,06
Summe Bankguthaben • Total cash at banks 255.176,05 1,41
Sonstige Vermögensgegenstände • Other assets
Dividendenforderungen AUD 51.971,64 35.026,66 0,19
Dividendenforderungen JPY 11.875.144,00 93.125,24 0,52
Summe Sonstige Vermögensgegenstände • Total other assets 128.151,90 0,71
Zinsverbindlichkeiten • Interest liabilities
Zinsverbindlichkeit Bankkonto M.M.Warburg & CO Luxembourg S.A. EUR -65,41 -65,41 0,00
Summe Zinsverbindlichkeiten • Total interest liabilities -65,41 0,00
Sonstige Verbindlichkeiten • Other liabilities EUR -66.108,21 -66.108,21 -0,37
Teilfondsvermögen • Sub-fund assets 18.095.132,49 100,00 *)
*) Durch Rundungen bei der Berechnung können geringe Differenzen entstanden sein. • Slight deviations may have occurred as a result of rounding in the calculation.
VERMÖGENSAUFSTELLUNG ZUM 31. MÄRZ 2016 (Fortsetzung) INVESTMENT PORTFOLIO AS AT MARCH 31ST, 2016 (continued)
Die Erläuterungen sind ein integraler Bestandteil dieses Berichtes • The accompanying notes are an integral part of this financial report

58
DKB ASIEN FONDS
GEOGRAPHISCHE STRUKTUR DES WERTPAPIERVERMÖGENS IN PROZENT VOM TEILFONDSVERMÖGEN
STRUCTURE OF THE INVESTMENT PORTFOLIO BY GEOGRAPHICAL SECTOR IN PERCENT OF SUB-FUND ASSETS
LänderCountriesOrszágok
Kurswert in Mio. EURMarket value (millions) EUR
Piaci érték EUR
% v. Teilfondsvermögen% of sub-fund assets
Részalap vagyonának %-ában
Japan • Japan 11,42 63,20
Australien • Australia 3,27 18,05
Singapur • Singapore 1,08 5,97
Luxemburg • Luxembourg 0,91 5,01
Hongkong • Hong Kong 0,82 4,51
Kaimaninseln • Cayman Islands 0,27 1,47
Großbritannien • Great Britain 0,01 0,04
Summe • Total 17,78 98,25
WIRTSCHAFTLICHE STRUKTUR DES WERTPAPIERVERMÖGENS IN PROZENT VOM TEILFONDSVERMÖGEN
STRUCTURE OF THE INVESTMENT PORTFOLIO BY ECONOMIC SECTOR IN PERCENT OF SUB-FUND ASSETS
BranchenSectorsOrszágok
Kurswert in Mio. EURMarket value (millions) EUR
Piaci érték EUR
% v. Teilfondsvermögen% of sub-fund assets
Részalap vagyonának %-ában
Finanzdienstleistungen • Financial services 5,48 30,31
Verbrauchsgüter • Consumer goods 3,04 16,82
Industrieunternehmen • Industrial companies 2,61 14,40
Verbraucherdienstleistungen • Consumer services 2,26 12,51
Telekommunikation • Telecommunications 1,53 8,44
Investmentanteile Aktienindex • Investment fund equity index 0,91 5,01
Gesundheitswesen • Healthcare 0,88 4,87
Rohstoffe • Commodities 0,78 4,29
Technologie • Technology 0,19 1,06
Versorgungsunternehmen • Utilities 0,10 0,54
Summe • Total 17,78 98,25
Die Erläuterungen sind ein integraler Bestandteil dieses Berichtes • The accompanying notes are an integral part of this financial report

DKB ASIEN FONDS
59
STATISTISCHE INFORMATIONEN
STATISTICAL INFORMATION
01.04.201531.03.2016
01.04.201431.03.2015
01.04.201331.03.2014
Umlaufende Anteile zu Beginn des Geschäftsjahres Klasse TNL • Units outstanding at the beginning of the financial year class TNL
785.233,068 874.818,979 1.001.767,527
Ausgegebene Anteile Klasse TNL • Units issued class TNL 9.960,714 12.331,847 29.384,901
Zurückgenommene Anteile Klasse TNL • Units redeemed class TNL 49.888,358 101.917,758 156.333,449
Umlaufende Anteile am Ende des Geschäftsjahres Klasse TNL • Units outstanding at the end of the financial year class TNL
745.305,424 785.233,068 874.818,979
31.03.2016EUR
31.03.2015EUR
31.03.2014EUR
Teilfondsvermögen • Sub-fund assets 18.095.132,49 22.262.355,69 18.535.199,09
Nettovermögenswert pro Anteil Klasse TNL • Net asset value per unit class TNL 24,28 28,35 21,19
Ausgabepreis pro Anteil Klasse TNL • Issue price per unit class TNL 24,28 28,35 21,19
Zwischengewinn pro Anteil Klasse TNL • Interim profit per unit class TNL 0,00 0,00 0,00
ZUSAMMENSETZUNG DES TEILFONDSVERMÖGENS
STATEMENT OF SUB-FUND ASSETS
31.03.2016
Wertpapiervermögen • Securities holdings EUR 17.777.978,16
Bankguthaben • Cash at banks EUR 255.176,05
Sonstige Vermögensgegenstände • Other assets EUR 128.151,90
Zinsverbindlichkeiten • Interest liabilities EUR -65,41
Sonstige Verbindlichkeiten • Other liabilities EUR -66.108,21
Teilfondsvermögen • Sub-fund assets EUR 18.095.132,49
Das Teilfondsvermögen setzt sich zusammen aus insgesamt 745.305,42 umlaufenden Anteilen mit einem Inventarwert von EUR 24,28 (gerundet) pro Anteil.
Sub-fund assets are represented by a net asset value of EUR 24.28 (rounded) per unit on 745,305.42 units outstanding.
Die Erläuterungen sind ein integraler Bestandteil dieses Berichtes • The accompanying notes are an integral part of this financial report

60
DKB ASIEN FONDS
ERTRAGS- UND AUFWANDSRECHNUNG
STATEMENT OF OPERATIONS
01.04.201531.03.2016
Total total EUR
Dividendenerträge • Dividend income 459.907,77
Quellensteuer auf Dividendenerträge • Withholding tax on dividend income -36.899,35
Erträge aus REITs • Income from REITs 19.913,40
Quellensteuer auf REITs-Erträge • Withholding tax on REITS income -2.029,46
Ordentlicher Ertragsausgleich • Income equalisation -7.224,92
ERTRÄGE INSGESAMT • TOTAL INCOME 433.667,44
Verwaltungsvergütung • Management fee 1) -278.118,63
Zentraladministrationsvergütung • Central administration fee -19.865,20
Depotbankvergütung • Custodian fee -30.308,06
Vertriebsprovision • Sales commission -125.637,01
Prüfungskosten • Audit fees -6.351,30
Taxe d‘abonnement • Taxe d’abonnement -9.645,20
Veröffentlichungskosten • Publication costs -7.893,23
Zinsaufwendungen • Interest expenses -405,66
Sonstige Aufwendungen • Other expenses -15.298,22
Ordentlicher Aufwandsausgleich • Equalisation expenses 10.378,31
AUFWENDUNGEN INSGESAMT • TOTAL EXPENSES -483.144,20
ORDENTLICHER AUFWANDSÜBERSCHUSS • ORDINARY EXPENDITURE SURPLUS -49.476,76
1) Gemäß den Vertragsbedingungen erhält die Verwaltungsgesellschaft eine Gebühr von 1,40% p.a. für die Klasse TNL des am letzten Bewertungstages eines Monats festgestellten Teilfondsvermögens. Aus diesem Betrag wird auch das Anlageberaterhonorar vergütet.
The Management Company receives in accordance with the management regulations an annual fee of 1.40% for the class TNL of the sub-fund assets as at the last valuation date of each month. The advisory fee will be paid out of this amount.
Die Erläuterungen sind ein integraler Bestandteil dieses Berichtes • The accompanying notes are an integral part of this financial report

DKB ASIEN FONDS
61
ENTWICKLUNG DES TEILFONDSVERMÖGENS
CHANGES IN SUB-FUND ASSETS
01.04.201531.03.2016
Total total EUR
Teilfondsvermögen zu Beginn des Geschäftsjahres • Sub-fund assets at the beginning of the financial year 22.262.355,69
Mittelzufluss / -abfluss netto • Net subscriptions / redemptions -1.059.064,06
Ordentlicher Ertrags-/ Aufwandsausgleich • Income equalisation/ equalisation expenses -3.153,39
Ordentlicher Aufwandsüberschuss • Ordinary expenditure surplus -49.476,76
Außerordentlicher Ertrags-/Aufwandsausgleich • Extraordinary income equalisation/ equalisation expenses 34.273,99
Nettoergebnis der realisierten Gewinne und Verluste inkl. außerordentlicher Ertrags-/Aufwandsausgleich •Net realised profits / (–) losses incl. income/ expenses equalisation
1.384.223,22
Nettoveränderung der nicht realisierten Gewinne und Verluste • Net change in unrealised profits and losses -4.474.026,20
TEILFONDSVERMÖGEN ZUM ENDE DES GESCHÄFTSJAHRES • SUB-FUND ASSETS AT THE END OF THE FINANCIAL YEAR 18.095.132,49
Die Erläuterungen sind ein integraler Bestandteil dieses Berichtes • The accompanying notes are an integral part of this financial report

62
DKB PHARMA FONDS
VERMÖGENSAUFSTELLUNG ZUM 31. MÄRZ 2016 INVESTMENT PORTFOLIO AS AT MARCH 31ST, 2016
WertpapierbezeichnungSecurities
WährungCurrency
NominalNominal
MarktwertMarket value
EUR
% v. Teilfondsvermögen% of sub-fund assets
%-ában
Wertpapiervermögen • Securities holdings
Amtlich gehandelte Wertpapiere • Officially traded securities
Aktien • Shares
Actelion Ltd. Nam.-Aktien SF 0,50 CHF 2.300,00 299.854,78 0,79
Lonza Group AG Namens-Aktien SF 1 CHF 800,00 118.819,72 0,31
Novartis AG Namens-Aktien SF 0,50 CHF 25.633,00 1.646.232,29 4,36
2.064.906,79 5,46
Coloplast AS Navne-Aktier B DK 1 DKK 1.600,00 107.454,74 0,28
GENMAB AS Navne Aktier DK 1 DKK 500,00 57.598,59 0,15
GN Store Nord AS Navne-Aktier DK 1 DKK 8.500,00 155.801,32 0,41
Novo-Nordisk AS Navne-Aktier B DK -,20 DKK 17.960,00 862.761,73 2,29
Novozymes A/S Navne-Aktier B DK 2 DKK 3.000,00 120.725,56 0,32
1.304.341,94 3,45
Bayer AG Namens-Aktien o.N. EUR 2.000,00 206.800,00 0,55
BB Biotech AG Namens-Aktien SF 0,20 EUR 14.000,00 587.230,00 1,55
Essilor Intl -Cie Génle Opt.SA Actions Port. EO 0,18 EUR 3.000,00 326.400,00 0,86
Fresenius SE & Co. KGaA Inhaber-Aktien o.N. EUR 4.900,00 313.355,00 0,83
Grifols S.A. Acciones Port. Class A EO -,25 EUR 5.800,00 114.637,00 0,30
Merck KGaA Inhaber-Aktien o.N. EUR 3.600,00 266.652,00 0,71
MorphoSys AG Inhaber-Aktien o.N. EUR 3.800,00 158.441,00 0,42
Orion Corp. (New) Registered Shares Cl.B o.N. EUR 4.600,00 133.354,00 0,35
Qiagen N.V. Aandelen op naam EO -,01 EUR 11.800,00 230.513,00 0,61
Sanofi S.A. Actions Port. EO 2 EUR 16.200,00 1.154.574,00 3,05
Sartorius AG Vorzugsaktien o.St. o.N. EUR 1.000,00 223.850,00 0,59
STADA Arzneimittel AG vink.Namens-Aktien o.N. EUR 8.000,00 278.280,00 0,74
UCB S.A. Actions Nom. o.N. EUR 3.100,00 210.025,00 0,56
4.204.111,00 11,12
Astrazeneca PLC Registered Shares DL -,25 GBP 17.207,00 858.239,20 2,27
GlaxoSmithKline PLC Registered Shares LS -,25 GBP 51.400,00 924.514,60 2,45
Hikma Pharmaceuticals PLC Registered Shares LS -,10 GBP 3.000,00 75.169,48 0,20
Shire PLC Registered Shares LS -,05 GBP 10.000,00 498.964,37 1,32
Smith & Nephew PLC Registered Shares DL -,20 GBP 5.000,00 73.182,29 0,19
2.430.069,94 6,43

DKB PHARMA FONDS
63
WertpapierbezeichnungSecurities
WährungCurrency
NominalNominal
MarktwertMarket value
EUR
% v. Teilfondsvermögen% of sub-fund assets
%-ában
Astellas Pharma Inc. Registered Shares o.N. JPY 34.900,00 412.451,56 1,08
Daiichi Sankyo Co. Ltd. Registered Shares o.N. JPY 6.600,00 130.836,09 0,35
Hisamitsu Pharmaceut. Co. Inc. Registered Shares o.N. JPY 2.500,00 101.197,11 0,27
Mitsubishi Tanabe Pharma Corp. Registered Shares o.N. JPY 3.000,00 47.374,37 0,13
Nihon Kohden Corp. Registered Shares o.N. JPY 6.800,00 152.084,35 0,40
Ono Pharmaceutical Co. Ltd. Registered Shares o.N. JPY 4.000,00 153.568,57 0,41
Otsuka Holdings Company Ltd. Registered Shares o.N. JPY 10.500,00 344.140,77 0,91
Rohto Pharmaceutical Co. Ltd. Registered Shares o.N. JPY 11.000,00 181.990,05 0,48
Santen Pharmaceutical Co. Ltd. Registered Shares o.N. JPY 4.500,00 61.318,39 0,16
Sawai Pharmaceutical Co. Ltd. Registered Shares o.N. JPY 3.800,00 212.843,40 0,56
Shionogi & Co. Ltd. Registered Shares o.N. JPY 3.000,00 127.979,04 0,34
Taisho Pharmac.Hldgs.Co.Ltd. Registered Shares o.N. JPY 1.200,00 86.135,21 0,23
Takeda Pharmaceutical Co. Ltd. Registered Shares o.N. JPY 9.300,00 381.195,38 1,01
Tsumura & Co. Registered Shares o.N. JPY 8.200,00 178.442,66 0,47
2.571.556,95 6,80
Getinge AB Namn-Aktier B (fria) SK 2 SEK 6.000,00 123.968,02 0,33
Swedish Orphan Biovitrum AB Namn-Aktier SK 1 SEK 7.000,00 83.792,59 0,22
207.760,61 0,55
Abbott Laboratories Registered Shares o.N. USD 16.000,00 588.484,63 1,56
AbbVie Inc. Registered Shares DL -,01 USD 18.500,00 931.208,05 2,46
Aetna Inc. Registered Shares DL -,01 USD 4.032,00 406.582,55 1,08
Alexion Pharmaceuticals Inc. Registered Shares DL -,0001 USD 2.400,00 285.736,49 0,76
Allergan PLC Registered Shares DL-,0001 USD 3.726,00 904.650,69 2,39
Amgen Inc. Registered Shares DL -,0001 USD 5.800,00 765.616,39 2,03
Anthem Inc. Registered Shares DL -,01 USD 2.500,00 309.011,83 0,82
Bard Inc. C.R. Registered Shares DL -,25 USD 1.900,00 340.402,68 0,90
Baxalta Inc. Registered Shares DL -,01 USD 5.500,00 195.006,18 0,52
Baxter International Inc. Registered Shares DL 1 USD 5.500,00 200.397,39 0,53
Becton, Dickinson & Co. Registered Shares DL 1 USD 2.233,00 300.796,38 0,80
Biogen Inc. Registered Shares DL-,0005 USD 2.400,00 538.707,17 1,42
Biomarin Pharmaceutical Inc. Registered Shares DL -,001 USD 1.050,00 72.416,99 0,19
Boston Scientific Corp. Registered Shares DL -,01 USD 20.650,00 343.194,10 0,91
Bristol-Myers Squibb Co. Registered Shares DL -,10 USD 19.900,00 1.114.849,88 2,95
Celgene Corp. Registered Shares DL -,01 USD 8.500,00 741.610,74 1,96
Cigna Corp. Registered Shares DL 1 USD 3.300,00 400.581,07 1,06
VERMÖGENSAUFSTELLUNG ZUM 31. MÄRZ 2016 (Fortsetzung) INVESTMENT PORTFOLIO AS AT MARCH 31ST, 2016 (continued)

64
DKB PHARMA FONDS
WertpapierbezeichnungSecurities
WährungCurrency
NominalNominal
MarktwertMarket value
EUR
% v. Teilfondsvermögen% of sub-fund assets
%-ában
Endo International PLC Registered Shares DL -,0001 USD 2.500,00 62.809,08 0,17
Express Scripts Holding Inc. Registered Shares DL -,01 USD 4.000,00 243.906,75 0,65
Gilead Sciences Inc. Registered Shares DL -,001 USD 11.300,00 917.750,79 2,43
HCA Holdings Inc. Registered Shares DL -,01 USD 1.300,00 89.659,13 0,24
Illumina Inc. Registered Shares DL -,01 USD 1.500,00 208.534,97 0,55
Incyte Corp. Registered Shares DL -,001 USD 1.800,00 108.645,35 0,29
Intuitive Surgical Inc. Registered Shares DL -,001 USD 550,00 290.581,07 0,77
Ionis Pharmaceuticals Inc. Reg. Shares 144A DL -,001 USD 1.000,00 34.113,39 0,09
Johnson & Johnson Registered Shares DL 1 USD 16.000,00 1.539.809,25 4,06
Lilly & Co., Eli Registered Shares o.N. USD 7.900,00 500.761,22 1,32
MacroGenics Inc. Registered Shares DL -,01 USD 1.000,00 15.215,47 0,04
Mallinckrodt PLC Registered Shares DL-,20 USD 1.200,00 63.486,40 0,17
Medtronic PLC Registered Shares DL -,0001 USD 16.797,00 1.118.712,24 2,96
Merck & Co. Inc. Registered Shares DL-,01 USD 36.000,00 1.691.910,99 4,47
Mylan N.V. Aandelen aan toonder EO -,01 USD 7.000,00 286.824,44 0,76
Pfizer Inc. Registered Shares DL -,05 USD 78.500,00 2.084.506,36 5,50
Quest Diagnostics Inc. Registered Shares DL -,01 USD 2.000,00 127.622,75 0,34
Regeneron Pharmaceuticals Inc. Registered Shares DL -,001 USD 500,00 158.813,14 0,42
ResMed Inc. Registered Shares DL -,004 USD 2.500,00 125.596,08 0,33
St. Jude Medical Inc. Registered Shares DL -,10 USD 4.200,00 204.176,97 0,54
Stryker Corp. Registered Shares DL -,10 USD 4.200,00 397.041,68 1,05
Teva Pharmaceutical Inds Ltd. Reg. Shares (ADRs)/1 IS-,10 USD 2.000,00 96.079,12 0,25
Thermo Fisher Scientific Inc. Registered Shares DL 1 USD 2.800,00 348.120,81 0,92
UnitedHealth Group Inc. Registered Shares DL -,01 USD 9.800,00 1.122.274,81 2,96
Valeant Pharma. Int. Inc. Registered Shares o.N. USD 3.120,00 74.583,54 0,20
Vertex Pharmaceuticals Inc. Registered Shares DL -,01 USD 1.400,00 96.926,88 0,26
Zimmer Biomet Holdings Inc. Registered Shares DL -,01 USD 2.600,00 244.984,10 0,65
Zoetis Inc. Registered Shares Cl.A DL -,01 USD 3.500,00 136.056,16 0,36
20.828.756,15 55,09
Bezugsrechte • Pre-emptive/subscription rights
Intercell AG Ansprüche auf Nachb.(Umt.) EUR 60.000,00 0,00 0,00
0,00 0,00
Genussscheine • Profit participation certificates
Roche Holding AG Inhaber-Genußscheine o.N. CHF 8.500,00 1.846.152,29 4,89
1.846.152,29 4,89
VERMÖGENSAUFSTELLUNG ZUM 31. MÄRZ 2016 (Fortsetzung) INVESTMENT PORTFOLIO AS AT MARCH 31ST, 2016 (continued)

DKB PHARMA FONDS
65
WertpapierbezeichnungSecurities
WährungCurrency
NominalNominal
MarktwertMarket value
EUR
% v. Teilfondsvermögen% of sub-fund assets
%-ában
Wertpapier-Investmentanteile • Investment fund units
Lacuna-BB Adam.Asia Pac.Health Inhaber-Anteile I o.N. EUR 250,00 469.350,00 1,24
469.350,00 1,24
Summe Wertpapiervermögen • Total securities holdings 35.927.005,67 95,03
Derivate • Derivatives
Aktienindex-Terminkontrakte • Share index future contracts
Nasdaq 100 E-Mini Future 17.06.16 USD -20,00 -44.401,27 -0,12
Optionsrechte auf Aktienindizes • Options on stock market indices
Put Euro Stoxx 2300 16.12.16 EUR -70,00 -38.010,00 -0,10
Put Euro Stoxx 2600 16.12.16 EUR 70,00 73.640,00 0,20
Put Euro Stoxx 2600 17.06.16 EUR -100,00 -29.100,00 -0,08
Devisenterminkontrakte • Currency futures contracts
EUR/GBP Future 13.06.16 GBP 6,00 -3.582,68 -0,01
EUR/USD Future 13.06.16 USD -12,00 -33.805,63 -0,09
JPY/USD Future 13.06.16 USD -9,00 -6.705,89 -0,02
Summe Derivate • Total derivatives -81.965,47 -0,22
Bankguthaben • Cash at banks
Bankkonto M.M.Warburg & CO Luxembourg S.A. CHF 407.025,73 373.168,87 0,99
Bankkonto M.M.Warburg & CO Luxembourg S.A. DKK 412,17 55,31 0,00
Bankkonto M.M.Warburg & CO Luxembourg S.A. EUR 1.444.949,92 1.444.949,92 3,82
Bankkonto M.M.Warburg & CO Luxembourg S.A. JPY 2.530.533,00 19.851,37 0,05
Bankkonto M.M.Warburg & CO Luxembourg S.A. SEK 11.069,29 1.198,04 0,00
Forderungen aus Variation Margin M.M.Warburg & CO Luxembourg S.A. GBP 2.812,50 3.582,68 0,01
Forderungen aus Variation Margin M.M.Warburg & CO Luxembourg S.A. USD 96.155,25 84.912,79 0,22
Summe Bankguthaben • Total cash at banks 1.927.718,98 5,09
Sonstige Vermögensgegenstände • Other assets
Dividendenforderungen EUR 4.186,00 4.186,00 0,01
Dividendenforderungen GBP 23.634,00 30.106,01 0,08
Dividendenforderungen JPY 2.773.178,00 21.754,86 0,06
Dividendenforderungen USD 29.190,69 25.777,73 0,07
VERMÖGENSAUFSTELLUNG ZUM 31. MÄRZ 2016 (Fortsetzung) INVESTMENT PORTFOLIO AS AT MARCH 31ST, 2016 (continued)

66
DKB PHARMA FONDS
WertpapierbezeichnungSecurities
WährungCurrency
NominalNominal
MarktwertMarket value
EUR
% v. Teilfondsvermögen% of sub-fund assets
%-ában
Initial Margin M.M.Warburg & CO Luxembourg S.A. EUR 38.795,52 38.795,52 0,10
Initial Margin M.M.Warburg & CO Luxembourg S.A. GBP 14.400,00 18.343,34 0,05
Initial Margin M.M.Warburg & CO Luxembourg S.A. USD 162.900,00 143.853,76 0,38
Summe Sonstige Vermögensgegenstände • Total other assets 282.817,22 0,75
Bankverbindlichkeiten • Bank debt/ bank liabilities/ bank loan facilities/ financial liabilities
Bankverbindlichkeiten M.M.Warburg & CO Luxembourg S.A. GBP -1.473,60 -1.877,14 0,00
Bankverbindlichkeiten M.M.Warburg & CO Luxembourg S.A. USD -139.456,26 -123.151,06 -0,33
Summe Bankverbindlichkeiten • Total Bank debt/ bank liabilities/ bank loan facilities/ financial liabilities
-125.028,20 -0,33
Zinsverbindlichkeiten • Interest liabilities
Zinsverbindlichkeit Bankkonto M.M.Warburg & CO Luxembourg S.A. CHF -514,61 -471,80 0,00
Zinsverbindlichkeit Bankkonto M.M.Warburg & CO Luxembourg S.A. EUR -630,17 -630,17 0,00
Zinsverbindlichkeit Bankkonto M.M.Warburg & CO Luxembourg S.A. GBP -3,96 -5,04 0,00
Zinsverbindlichkeit Bankkonto M.M.Warburg & CO Luxembourg S.A. SEK -5,97 -0,65 0,00
Zinsverbindlichkeit Bankkonto M.M.Warburg & CO Luxembourg S.A. USD -50,88 -44,93 0,00
Summe Zinsverbindlichkeiten • Total interest liabilities -1.152,59 0,00
Sonstige Verbindlichkeiten • Other liabilities EUR -122.035,03 -122.035,03 -0,32
Teilfondsvermögen • Sub-fund assets 37.807.360,58 100,00 *)
*) Durch Rundungen bei der Berechnung können geringe Differenzen entstanden sein • Slight deviations may have occurred as a result of rounding in the calculation • A számítások során a kerekítések miatt kis mértékű eltérések adódhatnak
VERMÖGENSAUFSTELLUNG ZUM 31. MÄRZ 2016 (Fortsetzung) INVESTMENT PORTFOLIO AS AT MARCH 31ST, 2016 (continued)
Die Erläuterungen sind ein integraler Bestandteil dieses Berichtes • The accompanying notes are an integral part of this financial report

DKB PHARMA FONDS
67
VERPFLICHTUNGEN AUS DERIVATEN
LIABILITIES ON DERIVATIVES
Futures Futures
WährungCurrency
KontrakteContracts
KontraktgrößeContract size
KursPrice
Dev.Kurs Exchange rate
Verpflichtungen aus Derivaten
Contingent liabilities under derivatives contracts
EUR
Futures Kauf • Futures purchases
EUR/GBP Future 13.06.16 GBP 6,00 125.000,00 0,7895 0,7850 754.274,38
Summe Futures Kauf • Total futures purchases 754.274,38
Futures Verkauf • Futures sales
EUR/USD Future 13.06.16 USD -12,00 125.000,00 1,1360 1,1324 -1.504.768,63
JPY/USD Future 13.06.16 USD -9,00 12.500.000,00 0,0089 1,1324 -885.127,83
Nasdaq 100 E-Mini Future 17.06.16 USD -20,00 20,00 4.482,0000 1,1324 -1.583.186,15
Summe Futures Verkauf • Total futures sales -3.973.082,61
Optionen • Options
Put Euro Stoxx 2300 16.12.16 EUR -70,00 10,00 3.044,1000 1,0000 -2.130.870,00
Put Euro Stoxx 2600 17.06.16 EUR -100,00 10,00 3.044,1000 1,0000 -3.044.100,00
Summe Optionen • Total options -5.174.970,00
Sämtliche Derivate wurden über die M.M.Warburg & CO Luxembourg S.A. abgewickelt. • All derivatives were handled by M.M.Warburg & CO Luxembourg S.A.
**) Berechnung mit 6 Nachkommastellen (siehe Seite 102 f.). • Calculation with 6-digits (see page 102).
GEOGRAPHISCHE STRUKTUR DES WERTPAPIERVERMÖGENS IN PROZENT VOM TEILFONDSVERMÖGEN
STRUCTURE OF THE INVESTMENT PORTFOLIO BY GEOGRAPHICAL SECTOR IN PERCENT OF SUB-FUND ASSETS
LänderCountriesOrszágok
Kurswert in Mio. EURMarket value (millions) EUR
Piaci érték EUR
% v. Teilfondsvermögen% of sub-fund assets
Részalap vagyonának %-ában
USA • USA 18,23 48,19
Schweiz • Switzerland 4,50 11,90
Japan • Japan 2,57 6,80
Irland • Ireland 2,15 5,69
Großbritannien • Great Britain 1,93 5,11
Frankreich • France 1,48 3,92
Bundesrepublik Deutschland • Federal Republic of Germany 1,45 3,83
Dänemark • Denmark 1,30 3,45
Niederlande • Netherlands 0,52 1,37
Sonstige Länder • Other countries 1,80 4,77
Summe • Total 35,93 95,03
Die Erläuterungen sind ein integraler Bestandteil dieses Berichtes • The accompanying notes are an integral part of this financial report

68
DKB PHARMA FONDS
Die Erläuterungen sind ein integraler Bestandteil dieses Berichtes • The accompanying notes are an integral part of this financial report
WIRTSCHAFTLICHE STRUKTUR DES WERTPAPIERVERMÖGENS IN PROZENT VOM TEILFONDSVERMÖGEN
STRUCTURE OF THE INVESTMENT PORTFOLIO BY ECONOMIC SECTOR IN PERCENT OF SUB-FUND ASSETS
BranchenSectorsOrszágok
Kurswert in Mio. EURMarket value (millions) EUR
Piaci érték EUR
% v. Teilfondsvermögen% of sub-fund assets
Részalap vagyonának %-ában
Gesundheitswesen • Healthcare 33,18 87,77
Genussscheine • Profit participation certificates 1,85 4,88
Investmentanteile Aktien • Equity funds 0,47 1,24
Industrieunternehmen • Industrial companies 0,22 0,59
Rohstoffe • Commodities 0,21 0,55
Summe • Total 35,93 95,03
STATISTISCHE INFORMATIONEN
STATISTICAL INFORMATION
01.04.201531.03.2016
01.04.201431.03.2015
01.04.201331.03.2014
Umlaufende Anteile zu Beginn des Geschäftsjahres Klasse AL • Units outstanding at the beginning of the financial year class AL
146.283,396 132.610,135 230.283,546
Ausgegebene Anteile Klasse AL • Units issued class AL 20.750,000 92.767,771 59.607,362
Zurückgenommene Anteile Klasse AL • Units redeemed class AL 92.854,340 79.094,510 157.280,773
Umlaufende Anteile am Ende des Geschäftsjahres Klasse AL • Units outstanding at the end of the financial year class AL
74.179,056 146.283,396 132.610,135
Umlaufende Anteile zu Beginn des Geschäftsjahres Klasse TNL • Units outstanding at the beginning of the financial year class TNL
630.903,910 608.592,625 715.050,492
Ausgegebene Anteile Klasse TNL • Units issued class TNL 40.813,903 55.568,495 46.663,369
Zurückgenommene Anteile Klasse TNL • Units redeemed class TNL 43.030,798 33.257,210 153.121,236
Umlaufende Anteile am Ende des Geschäftsjahres Klasse TNL • Units outstanding at the end of the financial year class TNL
628.687,015 630.903,910 608.592,625
31.03.2016EUR
31.03.2015EUR
31.03.2014EUR
Teilfondsvermögen • Sub-fund assets 37.807.360,58 49.691.128,63 31.205.559,79
Nettovermögenswert pro Anteil Klasse AL • Net asset value per unit class AL 57,03 67,60 44,31
Ausgabepreis pro Anteil Klasse AL • Issue price per unit class AL 59,88 70,98 46,53
Zwischengewinn pro Anteil Klasse AL • Interim profit per unit class AL 0,00 0,00 0,00
Nettovermögenswert pro Anteil Klasse TNL • Net asset value per unit class TNL 53,41 63,09 41,62
Ausgabepreis pro Anteil Klasse TNL • Issue price per unit class TNL 53,41 63,09 41,62
Zwischengewinn pro Anteil Klasse TNL • Interim profit per unit class TNL 0,00 0,00 0,00

DKB PHARMA FONDS
69
Die Erläuterungen sind ein integraler Bestandteil dieses Berichtes • The accompanying notes are an integral part of this financial report
ZUSAMMENSETZUNG DES TEILFONDSVERMÖGENS
STATEMENT OF SUB-FUND ASSETS
31.03.2016
Wertpapiervermögen • Securities holdings EUR 35.927.005,67
Derivate • Derivatives EUR -81.965,47
Bankguthaben • Cash at banks EUR 1.927.718,98
Sonstige Vermögensgegenstände • Other assets EUR 282.817,22
Bankverbindlichkeiten • Bank debt/ bank liabilities/ bank loan facilities/ financial liabilities EUR -125.028,20
Zinsverbindlichkeiten • Interest liabilities EUR -1.152,59
Sonstige Verbindlichkeiten • Other liabilities EUR -122.035,03
Teilfondsvermögen • Sub-fund assets EUR 37.807.360,58
Das Teilfondsvermögen setzt sich zusammen aus 702.866,07 umlaufenden Anteilen. Davon entfallen 74.179,06 Anteile auf die Klasse AL mit einem Inventarwert von 57,03 EUR (gerundet) pro Anteil und 628.687,02 Anteile auf die Klasse TNL mit einem Inventarwert von 53,41 EUR (gerundet) pro Anteil.
Sub-fund assets are represented by a total of 702,866.07 units outstanding. 74,179.06 units are allotted as class AL having a net asset value of 57.03 EUR (rounded) per unit and 628,687.02 units are allotted as class TNL having a net asset value of 53.41 EUR (rounded) per unit.

70
DKB PHARMA FONDS
ERTRAGS- UND AUFWANDSRECHNUNG
STATEMENT OF OPERATIONS
01.04.201531.03.2016
Total total EUR
01.04.201531.03.2016
Klasse AL class AL
EUR
01.04.201531.03.2016Klasse TNL
class TNL EUR
Dividendenerträge • Dividend income 849.283,01 102.868,74 746.414,27
Quellensteuer auf Dividendenerträge • Withholding tax on dividend income -201.795,35 -24.508,39 -177.286,96
Zinsen aus Geldanlagen • Interest on money-market investments 23,52 2,61 20,91
Sonstige Erträge • Other income 30.694,25 5.702,15 24.992,10
Ordentlicher Ertragsausgleich • Income equalisation -7.877,76 -9.192,70 1.314,94
ERTRÄGE INSGESAMT • TOTAL INCOME 670.327,67 74.872,41 595.455,26
Verwaltungsvergütung • Management fee 1) -592.709,99 -73.976,71 -518.733,28
Zentraladministrationsvergütung • Central administration fee -42.325,75 -5.282,83 -37.042,92
Depotbankvergütung • Custodian fee -25.838,97 -3.224,96 -22.614,01
Vertriebsprovision • Sales commission -234.980,27 0,00 -234.980,27
Prüfungskosten • Audit fees -375,00 -122,49 -252,51
Taxe d‘abonnement • Taxe d’abonnement -20.090,15 -2.261,25 -17.828,90
Veröffentlichungskosten • Publication costs -9.653,84 -1.338,27 -8.315,57
Zinsaufwendungen • Interest expenses -2.726,47 -336,04 -2.390,43
Sonstige Aufwendungen • Other expenses -30.316,94 -3.947,67 -26.369,27
Ordentlicher Aufwandsausgleich • Equalisation expenses 10.753,51 11.105,21 -351,70
AUFWENDUNGEN INSGESAMT • TOTAL EXPENSES -948.263,87 -79.385,01 -868.878,86
ORDENTLICHER AUFWANDSÜBERSCHUSS • ORDINARY EXPENDITURE SURPLUS -277.936,20 -4.512,60 -273.423,60
1) Gemäß den Vertragsbedingungen erhält die Verwaltungsgesellschaft eine Gebühr von 1,40% p.a. für die Klassen AL und TNL des am letzten Bewertungstages eines Monats festgestellten Teilfondsvermögens. Aus diesem Betrag wird auch das Anlageberaterhonorar vergütet.
The Management Company receives in accordance with the management regulations an annual fee of 1.40% for the classes AL and TNL of the sub-fund assets as at the last valuation date of each month. The advisory fee will be paid out of this amount.

DKB PHARMA FONDS
71
ENTWICKLUNG DES TEILFONDSVERMÖGENS
CHANGES IN SUB-FUND ASSETS
01.04.201531.03.2016
Total total EUR
01.04.201531.03.2016
Klasse AL class AL
EUR
01.04.201531.03.2016Klasse TNL
class TNL EUR
Teilfondsvermögen zu Beginn des Geschäftsjahres • Sub-fund assets at the beginning of the financial year
49.691.128,63 9.889.352,91 39.801.775,72
Ausschüttungen • Distribution -59.432,18 -59.432,18 0,00
Mittelzufluss / -abfluss netto • Net subscriptions / redemptions -4.690.271,63 -4.571.357,16 -118.914,47
Ordentlicher Ertrags-/ Aufwandsausgleich • Income equalisation/ equalisation expenses -2.875,76 -1.912,52 -963,24
Ordentlicher Aufwandsüberschuss • Ordinary expenditure surplus -277.936,20 -4.512,60 -273.423,60
Außerordentlicher Ertrags-/Aufwandsausgleich • Extraordinary income equalisation/ equalisation expenses
113.079,05 128.727,65 -15.648,60
Nettoergebnis der realisierten Gewinne und Verluste inkl. außerordentlicher Ertrags-/Aufwandsausgleich • Net realised profits / (–) losses incl. income/ expenses equalisation
3.556.034,21 397.355,80 3.158.678,41
Nettoveränderung der nicht realisierten Gewinne und Verluste • Net change in unrealised profits and losses
-10.522.365,54 -1.547.998,12 -8.974.367,42
TEILFONDSVERMÖGEN ZUM ENDE DES GESCHÄFTSJAHRES • SUB-FUND ASSETS AT THE END OF THE FINANCIAL YEAR
37.807.360,58 4.230.223,78 33.577.136,80
Die Erläuterungen sind ein integraler Bestandteil dieses Berichtes • The accompanying notes are an integral part of this financial report

72
DKB TELETECH FONDS
VERMÖGENSAUFSTELLUNG ZUM 31. MÄRZ 2016 INVESTMENT PORTFOLIO AS AT MARCH 31ST, 2016
WertpapierbezeichnungSecurities
WährungCurrency
NominalNominal
MarktwertMarket value
EUR
% v. Teilfondsvermögen% of sub-fund assets
%-ában
Wertpapiervermögen • Securities holdings
Amtlich gehandelte Wertpapiere • Officially traded securities
Aktien • Shares
CGI Group Inc. Reg.Shs Class A (Sub.Vtg) o.N. CAD 3.000,00 126.192,44 0,48
Constellation Software Inc. Registered Shares o.N. CAD 350,00 128.663,59 0,48
254.856,03 0,96
ams AG Inhaber-Aktien o.N. CHF 3.100,00 92.227,39 0,35
Temenos Group AG Nam.-Aktien SF 5 CHF 1.000,00 47.399,53 0,18
139.626,92 0,53
ASML Holding N.V. Aandelen op naam EO -,09 EUR 4.960,00 442.878,40 1,67
Atos SE Actions au Porteur EO 1 EUR 1.000,00 71.860,00 0,27
Cap Gemini S.A. Actions Port. EO 8 EUR 2.600,00 218.530,00 0,82
Dassault Systèmes S.A. Actions Port. EO 0,50 EUR 2.220,00 156.954,00 0,59
Deutsche Telekom AG Namens-Aktien o.N. EUR 12.000,00 191.340,00 0,72
Dialog Semiconductor PLC Registered Shares LS -,10 EUR 2.000,00 69.030,00 0,26
Gemalto N.V. Aandelen EO 1 EUR 1.500,00 98.175,00 0,37
Iliad S.A. Actions au Porteur o.N. EUR 580,00 134.792,00 0,51
Infineon Technologies AG Namens-Aktien o.N. EUR 13.400,00 169.577,00 0,64
Ingenico Group S.A. Actions Port. EO 1 EUR 1.100,00 112.970,00 0,43
Nokia Corp. Registered Shares EO 0,06 EUR 55.000,00 293.425,00 1,11
SAP SE Inhaber-Aktien o.N. EUR 8.743,00 622.151,88 2,35
United Internet AG Namens-Aktien o.N. EUR 1.800,00 79.515,00 0,30
2.661.198,28 10,04
ARM Holdings PLC Registered Shares LS -,0005 GBP 12.500,00 163.051,92 0,61
Sage Group PLC, The Registered Shares LS-,01051948 GBP 18.500,00 147.877,27 0,56
310.929,19 1,17
Brother Industries Ltd. Registered Shares o.N. JPY 5.500,00 55.917,29 0,21
Canon Inc. Registered Shares o.N. JPY 10.450,00 273.640,90 1,03
Cyberagent Inc. Registered Shares o.N. JPY 1.500,00 63.189,36 0,24
Fujitsu Ltd. Registered Shares o.N. JPY 26.000,00 83.726,88 0,32
IT Holdings Corp. Registered Shares o.N. JPY 2.500,00 52.795,08 0,20
KDDI Corp. Registered Shares o.N. JPY 7.200,00 173.851,92 0,66
Konica Minolta Inc. Registered Shares o.N. JPY 9.000,00 67.143,10 0,25

DKB TELETECH FONDS
73
WertpapierbezeichnungSecurities
WährungCurrency
NominalNominal
MarktwertMarket value
EUR
% v. Teilfondsvermögen% of sub-fund assets
%-ában
NEC Corp. Registered Shares o.N. JPY 18.000,00 39.113,86 0,15
Nomura Research Institute Ltd. Registered Shares o.N. JPY 1.980,00 59.256,79 0,22
Obic Co. Ltd. Registered Shares o.N. JPY 3.100,00 150.289,47 0,57
Oki Electric Industry Co. Ltd. Registered Shares o.N. JPY 44.000,00 53.846,27 0,20
Otsuka Corp. Registered Shares o.N. JPY 2.700,00 126.661,12 0,48
Ricoh Co. Ltd. Registered Shares o.N. JPY 5.500,00 49.876,84 0,19
Rohm Co. Ltd. Registered Shares o.N. JPY 1.000,00 36.987,93 0,14
Seiko Epson Corp. Registered Shares o.N. JPY 3.000,00 42.808,73 0,16
Trend Micro Inc. Registered Shares o.N. JPY 3.200,00 104.178,11 0,39
Yahoo Japan Corp. Registered Shares o.N. JPY 42.000,00 158.808,86 0,60
1.592.092,51 6,01
Telenor ASA Navne-Aksjer NK 6 NOK 5.000,00 74.120,01 0,28
74.120,01 0,28
Ericsson Namn-Aktier B (fria) o.N. SEK 36.715,00 324.850,67 1,22
Hexagon AB Namn-Aktier B (fria)SK1,333 SEK 4.000,00 136.674,36 0,52
461.525,03 1,74
Adobe Systems Inc. Registered Shares o.N. USD 1.300,00 107.659,84 0,41
Akamai Technologies Inc. Registered Shares DL -,01 USD 3.801,00 184.947,99 0,70
Alphabet Inc. Reg. Shs Cap.Stk Cl. C DL-,001 USD 2.305,00 1.527.703,68 5,76
Amdocs Ltd. Registered Shares LS -,01 USD 4.365,00 231.548,53 0,87
Analog Devices Inc. Registered Shares DL -,166 USD 5.200,00 271.434,12 1,02
Ansys Inc. Registered Shares DL -,01 USD 1.800,00 140.785,94 0,53
Apple Inc. Registered Shares o.N. USD 24.460,00 2.366.511,48 8,94
Applied Materials Inc. Registered Shares o.N. USD 11.101,00 206.256,66 0,78
Autodesk Inc. Registered Shares o.N. USD 3.000,00 153.391,03 0,58
Broadcom Ltd. Registered Shares o.N. USD 147,00 20.371,52 0,08
Cerner Corp. Registered Shares DL -,01 USD 3.000,00 139.667,96 0,53
Check Point Software Techs Ltd Registered Shares IS -,01 USD 2.100,00 160.114,80 0,60
Cisco Systems Inc. Registered Shares DL-,001 USD 49.700,00 1.249.083,36 4,71
Cognizant Technology Sol.Corp. Reg. Shs Class A DL -,01 USD 6.000,00 330.890,14 1,25
Corning Inc. Registered Shares DL -,50 USD 8.669,00 159.539,00 0,60
EMC Corp. Registered Shares DL -,01 USD 13.591,00 320.451,87 1,21
F5 Networks Inc. Registered Shares o.N. USD 1.900,00 176.963,09 0,67
Facebook Inc. Reg.Shares Cl.A DL-,000006 USD 21.200,00 2.147.333,10 8,11
VERMÖGENSAUFSTELLUNG ZUM 31. MÄRZ 2016 (Fortsetzung) INVESTMENT PORTFOLIO AS AT MARCH 31ST, 2016 (continued)

74
DKB TELETECH FONDS
WertpapierbezeichnungSecurities
WährungCurrency
NominalNominal
MarktwertMarket value
EUR
% v. Teilfondsvermögen% of sub-fund assets
%-ában
Hewlett Packard Enterprise Co. Registered Shares DL -,01 USD 13.300,00 210.117,45 0,79
HP Inc. Registered Shares DL -,01 USD 13.300,00 144.463,09 0,54
Intel Corp. Registered Shares DL -,001 USD 37.178,00 1.073.907,08 4,05
Intl Business Machines Corp. Registered Shares DL -,20 USD 6.303,00 826.058,13 3,12
Intuit Inc. Registered Shares DL -,01 USD 823,00 74.988,64 0,28
KLA-Tencor Corp. Registered Shares DL 0,001 USD 2.200,00 140.967,86 0,53
Lam Research Corp. Registered Shares DL -,001 USD 3.000,00 217.741,08 0,82
Micron Technology Inc. Registered Shares DL -,10 USD 4.500,00 41.646,06 0,16
Microsoft Corp. Registered Shares DL-,00000625 USD 49.300,00 2.396.648,71 9,05
NVIDIA Corp. Registered Shares DL-,001 USD 6.000,00 189.473,68 0,71
Oracle Corp. Registered Shares DL -,01 USD 24.705,00 893.821,84 3,37
QUALCOMM Inc. Registered Shares DL -,0001 USD 12.800,00 576.361,71 2,17
Red Hat Inc. Registered Shares DL -,0001 USD 2.000,00 130.766,51 0,49
salesforce.com Inc. Registered Shares DL -,001 USD 3.450,00 226.364,36 0,85
SanDisk Corp. Registered Shares DL -,001 USD 1.200,00 80.483,93 0,30
Seagate Technology PLC Registered Shares DL -,00001 USD 4.500,00 135.786,82 0,51
Skyworks Solutions Inc. Registered Shares DL -,25 USD 2.000,00 137.495,58 0,52
Symantec Corp. Registered Shares DL -,01 USD 3.541,00 57.474,02 0,22
Texas Instruments Inc. Registered Shares DL 1 USD 10.701,00 551.587,22 2,08
Twitter Inc. Registered Shares DL -,000005 USD 3.700,00 53.454,61 0,20
Western Digital Corp. Registered Shares DL -,01 USD 1.300,00 52.968,92 0,20
Xilinx Inc. Registered Shares DL -,01 USD 3.900,00 164.864,89 0,62
Yahoo! Inc. Registered Shares DL-,001 USD 4.875,00 157.391,38 0,59
18.429.487,68 69,52
Summe Wertpapiervermögen • Total securities holdings 23.923.835,65 90,25
Derivate • Derivatives
Optionsrechte auf Aktienindizes • Options on stock market indices
Put Nasdaq 3200 16.12.16 USD -5,00 -15.431,83 -0,06
Put Nasdaq 3700 16.12.16 USD 5,00 37.663,37 0,14
Devisenterminkontrakte (Kauf/Verkauf) • Forward foreign exchange transactions purchase/sale
Devisenterminkontrakte • Currency futures contracts
EUR/USD Future 13.06.16 USD -10,00 -29.951,21 -0,11
JPY/USD Future 13.06.16 USD -6,00 -4.470,60 -0,02
Summe Derivate • Total Derivatives -12.190,27 -0,05
VERMÖGENSAUFSTELLUNG ZUM 31. MÄRZ 2016 (Fortsetzung) INVESTMENT PORTFOLIO AS AT MARCH 31ST, 2016 (continued)

DKB TELETECH FONDS
75
WertpapierbezeichnungSecurities
WährungCurrency
NominalNominal
MarktwertMarket value
EUR
% v. Teilfondsvermögen% of sub-fund assets
%-ában
Bankguthaben • Cash at banks
Bankkonto M.M.Warburg & CO Luxembourg S.A. CAD 8.840,69 6.018,39 0,02
Bankkonto M.M.Warburg & CO Luxembourg S.A. CHF 343,78 315,18 0,00
Bankkonto M.M.Warburg & CO Luxembourg S.A. EUR 902.364,97 902.364,97 3,40
Bankkonto M.M.Warburg & CO Luxembourg S.A. GBP 40.244,47 51.265,14 0,19
Bankkonto M.M.Warburg & CO Luxembourg S.A. JPY 37.209.395,00 291.897,92 1,10
Bankkonto M.M.Warburg & CO Luxembourg S.A. NOK 27.695,33 2.940,94 0,01
Bankkonto M.M.Warburg & CO Luxembourg S.A. SEK 45.450,73 4.919,19 0,02
Bankkonto M.M.Warburg & CO Luxembourg S.A. USD 1.487.400,18 1.313.493,62 4,97
Forderungen aus Variation Margin M.M.Warburg & CO Luxembourg S.A. USD 38.979,25 34.421,80 0,13
Summe Bankguthaben • Total cash at banks 2.607.637,15 9,84
Sonstige Vermögensgegenstände • Other assets
Dividendenforderungen CAD 350,83 238,83 0,00
Dividendenforderungen JPY 2.102.365,00 16.492,49 0,06
Dividendenforderungen USD 5.588,00 4.934,65 0,02
Initial Margin M.M.Warburg & CO Luxembourg S.A. USD 51.700,00 45.655,25 0,17
Zinsforderung Bankkonto M.M.Warburg & CO Luxembourg S.A. USD 130,08 114,87 0,00
Summe Sonstige Vermögensgegenstände • Total other assets 67.436,09 0,25
Zinsverbindlichkeiten • Interest liabilities
Zinsverbindlichkeit Bankkonto M.M.Warburg & CO Luxembourg S.A. CHF -36,62 -33,57 0,00
Zinsverbindlichkeit Bankkonto M.M.Warburg & CO Luxembourg S.A. EUR -527,01 -527,01 0,00
Summe Zinsverbindlichkeiten • Total interest liabilities -560,58 0,00
Sonstige Verbindlichkeiten • Other liabilities EUR -77.934,37 -77.934,37 -0,29
Teilfondsvermögen • Sub-fund assets 26.508.223,67 100,00 *)
*) Durch Rundungen bei der Berechnung können geringe Differenzen entstanden sein • Slight deviations may have occurred as a result of rounding in the calculation • A számítások során a kerekítések miatt kis mértékű eltérések adódhatnak
VERMÖGENSAUFSTELLUNG ZUM 31. MÄRZ 2016 (Fortsetzung) INVESTMENT PORTFOLIO AS AT MARCH 31ST, 2016 (continued)
Die Erläuterungen sind ein integraler Bestandteil dieses Berichtes • The accompanying notes are an integral part of this financial report

76
DKB TELETECH FONDS
VERPFLICHTUNGEN AUS DERIVATEN
LIABILITIES ON DERIVATIVES
FuturesFutures
WährungCurrency
KontrakteContracts
KontraktgrößeContract size
KursPrice
Dev.Kurs **) Exchange rate
Verpflichtungen aus Derivaten
Contingent liabilities under derivatives contracts
EUR
Futures Verkauf • Futures sales
EUR/USD Future 13.06.16 USD -10,00 125.000,00 1,1360 1,1324 -1.253.973,86
JPY/USD Future 13.06.16 USD -6,00 12.500.000,00 0,0089 1,1324 -590.085,22
Summe Futures Verkauf • Total futures: sales -1.844.059,08
Optionen • Options
Put Nasdaq 3200 16.12.16 USD -5,00 100,00 4.490,8757 1,1324 -1.982.901,67
Summe Optionen • Total options -1.982.901,67
Sämtliche Derivate wurden über die M.M.Warburg & CO Luxembourg S.A. abgewickelt. • All derivatives were handled by M.M.Warburg & CO Luxembourg S.A.
**) Berechnung mit 6 Nachkommastellen (siehe Seite 102 f.). • Calculation with 6-digits (see page 102).
GEOGRAPHISCHE STRUKTUR DES WERTPAPIERVERMÖGENS IN PROZENT VOM TEILFONDSVERMÖGEN
STRUCTURE OF THE INVESTMENT PORTFOLIO BY GEOGRAPHICAL SECTOR IN PERCENT OF SUB-FUND ASSETS
LänderCountriesOrszágok
Kurswert in Mio. EURMarket value (millions) EUR
Piaci érték EUR
% v. Teilfondsvermögen% of sub-fund assets
Részalap vagyonának %-ában
USA • USA 17,89 67,46
Japan • Japan 1,59 6,01
Bundesrepublik Deutschland • Federal Republic of Germany 1,06 4,01
Frankreich • France 0,70 2,62
Niederlande • Netherlands 0,54 2,04
Schweden • Sweden 0,46 1,74
Großbritannien • Great Britain 0,38 1,43
Finnland • Finland 0,29 1,11
Kanada • Canada 0,25 0,96
Sonstige Länder • Other countries 0,76 2,87
Summe • Total 23,92 90,25
Die Erläuterungen sind ein integraler Bestandteil dieses Berichtes • The accompanying notes are an integral part of this financial report

DKB TELETECH FONDS
77
WIRTSCHAFTLICHE STRUKTUR DES WERTPAPIERVERMÖGENS IN PROZENT VOM TEILFONDSVERMÖGEN
STRUCTURE OF THE INVESTMENT PORTFOLIO BY ECONOMIC SECTOR IN PERCENT OF SUB-FUND ASSETS
BranchenSectorsOrszágok
Kurswert in Mio. EURMarket value (millions) EUR
Piaci érték EUR
% v. Teilfondsvermögen% of sub-fund assets
Részalap vagyonának %-ában
Technologie • Technology 23,48 88,59
Telekommunikation • Telecommunications 0,44 1,66
Summe • Total 23,92 90,25
STATISTISCHE INFORMATIONEN
STATISTICAL INFORMATION
01.04.201531.03.2016
01.04.201431.03.2015
01.04.201331.03.2014
Umlaufende Anteile zu Beginn des Geschäftsjahres Klasse AL • Units outstanding at the beginning of the financial year class AL
1.053.316,903 1.067.781,486 1.084.392,175
Ausgegebene Anteile Klasse AL • Units issued class AL 163.335,000 99,000 71,000
Zurückgenommene Anteile Klasse AL • Units redeemed class AL 163.627,297 14.563,583 16.681,689
Umlaufende Anteile am Ende des Geschäftsjahres Klasse AL • Units outstanding at the end of the financial year class AL
1.053.024,606 1.053.316,903 1.067.781,486
Umlaufende Anteile zu Beginn des Geschäftsjahres Klasse TNL • Units outstanding at the beginning of the financial year class TNL
2.350.327,771 2.339.301,423 2.367.168,823
Ausgegebene Anteile Klasse TNL • Units issued class TNL 33.605,507 40.353,791 25.979,443
Zurückgenommene Anteile Klasse TNL • Units redeemed class TNL 28.296,916 29.327,443 53.846,843
Umlaufende Anteile am Ende des Geschäftsjahres Klasse TNL • Units outstanding at the end of the financial year class TNL
2.355.636,362 2.350.327,771 2.339.301,423
31.03.2016EUR
31.03.2015EUR
31.03.2014EUR
Teilfondsvermögen • Sub-fund assets 26.508.223,67 27.839.154,55 20.251.785,12
Nettovermögenswert pro Anteil Klasse AL • Net asset value per unit class AL 8,15 8,55 6,18
Ausgabepreis pro Anteil Klasse AL • Issue price per unit class AL 8,56 8,98 6,49
Zwischengewinn pro Anteil Klasse AL • Interim profit per unit class AL 0,00 0,00 0,00
Nettovermögenswert pro Anteil Klasse TNL • Net asset value per unit class TNL 7,61 8,01 5,83
Ausgabepreis pro Anteil Klasse TNL • Issue price per unit class TNL 7,61 8,01 5,83
Zwischengewinn pro Anteil Klasse TNL • Interim profit per unit class TNL 0,00 0,00 0,00
Die Erläuterungen sind ein integraler Bestandteil dieses Berichtes • The accompanying notes are an integral part of this financial report

78
DKB TELETECH FONDS
ZUSAMMENSETZUNG DES TEILFONDSVERMÖGENS
STATEMENT OF SUB-FUND ASSETS
31.03.2016
Wertpapiervermögen • Securities holdings EUR 23.923.835,65
Derivate • Derivatives EUR -12.190,27
Bankguthaben • Cash at banks EUR 2.607.637,15
Sonstige Vermögensgegenstände • Other assets EUR 67.436,09
Zinsverbindlichkeiten • Interest liabilities EUR -560,58
Sonstige Verbindlichkeiten • Other liabilities EUR -77.934,37
Teilfondsvermögen • Sub-fund assets EUR 26.508.223,67
Das Teilfondsvermögen setzt sich zusammen aus 3.408.660,97 umlaufenden Anteilen. Davon entfallen 1.053.024,61 Anteile auf die Klasse AL mit einem Inventarwert von 8,15 EUR (gerundet) pro Anteil und 2.355.636,36 Anteile auf die Klasse TNL mit einem Inventarwert von 7,61 EUR (gerundet) pro Anteil.
Sub-fund assets are represented by a total of 3,408,660.97 units outstanding. 1,053,024.61 units are allotted as class AL having a net asset value of 8.15 EUR (rounded) per unit and 2,355,636.36 units are allotted as class TNL having a net asset value of 7.61 EUR (rounded) per unit.
Die Erläuterungen sind ein integraler Bestandteil dieses Berichtes • The accompanying notes are an integral part of this financial report

DKB TELETECH FONDS
79
ERTRAGS- UND AUFWANDSRECHNUNG
STATEMENT OF OPERATIONS
01.04.201531.03.2016
Klasse AL class AL
EUR
01.04.201531.03.2016
Klasse AL class AL
EUR
01.04.201531.03.2016Klasse TNL
class TNL EUR
Dividendenerträge • Dividend income 474.404,59 157.740,50 316.664,09
Quellensteuer auf Dividendenerträge • Withholding tax on dividend income -130.924,84 -43.448,13 -87.476,71
Zinsen aus Geldanlagen • Interest on money-market investments 114,87 37,87 77,00
Sonstige Erträge • Other income 3.028,26 979,26 2.049,00
Ordentlicher Ertragsausgleich • Income equalisation -4.689,53 -4.938,83 249,30
ERTRÄGE INSGESAMT • TOTAL INCOME 341.933,35 110.370,67 231.562,68
Verwaltungsvergütung • Management fee 1) -378.115,21 -125.005,40 -253.109,81
Zentraladministrationsvergütung • Central administration fee -27.002,70 -8.927,56 -18.075,14
Depotbankvergütung • Custodian fee -16.478,41 -5.447,65 -11.030,76
Vertriebsprovision • Sales commission -115.431,87 0,00 -115.431,87
Prüfungskosten • Audit fees -5.752,30 -1.904,19 -3.848,11
Taxe d‘abonnement • Taxe d’abonnement -13.267,08 -4.405,60 -8.861,48
Veröffentlichungskosten • Publication costs -9.519,08 -3.170,92 -6.348,16
Zinsaufwendungen • Interest expense -897,22 -301,71 -595,51
Sonstige Aufwendungen • Other expenses -19.722,09 -6.549,05 -13.173,04
Ordentlicher Aufwandsausgleich • Equalisation expenses 4.874,20 5.357,62 -483,42
AUFWENDUNGEN INSGESAMT • TOTAL EXPENSES -581.311,76 -150.354,46 -430.957,30
ORDENTLICHER AUFWANDSÜBERSCHUSS • ORDINARY EXPENDITURE SURPLUS -239.378,41 -39.983,79 -199.394,62
1) Gemäß den Vertragsbedingungen erhält die Verwaltungsgesellschaft eine Gebühr von 1,40% p.a. für die Klassen AL und TNL des am letzten Bewertungstages eines Monats festgestellten Teilfondsvermögens. Aus diesem Betrag wird auch das Anlageberaterhonorar vergütet.
The Management Company receives in accordance with the management regulations an annual fee of 1.40% for the classes AL and TNL of the sub-fund assets as at the last valuation date of each month. The advisory fee will be paid out of this amount.

80
DKB TELETECH FONDS
ENTWICKLUNG DES TEILFONDSVERMÖGENS
CHANGES IN SUB-FUND ASSETS
01.04.201531.03.2016
Total total EUR
01.04.201531.03.2016
Klasse AL class AL
EUR
01.04.201531.03.2016Klasse TNL
class TNL EUR
Teilfondsvermögen zu Beginn des Geschäftsjahres • Sub-fund assets at the beginning of the financial year
27.839.154,55 9.004.132,24 18.835.022,31
Ausschüttungen • Distribution -27.915,81 -27.915,81 0,00
Mittelzufluss / -abfluss netto • Net subscriptions / redemptions 143.735,63 102.850,67 40.884,96
Ordentlicher Ertrags-/ Aufwandsausgleich • Income equalisation/ equalisation expenses -184,67 -418,79 234,12
Ordentlicher Aufwandsüberschuss • Ordinary expenditure surplus -239.378,41 -39.983,79 -199.394,62
Außerordentlicher Ertrags-/Aufwandsausgleich • Extraordinary income equalisation/ equalisation expenses
9.198,22 10.257,04 -1.058,82
Nettoergebnis der realisierten Gewinne und Verluste inkl. außerordentlicher Ertrags-/Aufwandsausgleich • Net realised profits / (–) losses incl. income/ expenses equalisation
1.141.404,98 368.603,01 772.801,97
Nettoveränderung der nicht realisierten Gewinne und Verluste • Net change in unrealised profits and losses
-2.357.790,82 -838.441,11 -1.519.349,71
TEILFONDSVERMÖGEN ZUM ENDE DES GESCHÄFTSJAHRES • SUB-FUND ASSETS AT THE END OF THE FINANCIAL YEAR
26.508.223,67 8.579.083,46 17.929.140,21

81
DKB ZUKUNFTSFONDS
VERMÖGENSAUFSTELLUNG ZUM 31. MÄRZ 2016 INVESTMENT PORTFOLIO AS AT MARCH 31ST, 2016
WertpapierbezeichnungSecurities
WährungCurrency
NominalNominal
MarktwertMarket value
EUR
% v. Teilfondsvermögen% of sub-fund assets
%-ában
Wertpapiervermögen • Securities holdings
Amtlich gehandelte Wertpapiere • Officially traded securities
Aktien • Shares
Geberit AG Nam.-Akt. (Dispost.) SF -,10 CHF 600,00 198.803,00 1,09
Novartis AG Namens-Aktien SF 0,50 CHF 2.200,00 141.290,95 0,78
Sonova Holding AG Namens-Aktien SF 0,05 CHF 1.000,00 112.677,04 0,62
452.770,99 2,49
Coloplast AS Navne-Aktier B DK 1 DKK 6.500,00 436.534,88 2,41
Novo-Nordisk AS Navne-Aktier B DK -,20 DKK 5.000,00 240.189,79 1,32
Novozymes A/S Navne-Aktier B DK 2 DKK 4.800,00 193.160,90 1,06
Rockwool International A/S Navne-Aktier B DK 10 DKK 2.400,00 330.415,27 1,82
Vestas Wind Systems AS Navne-Aktier DK 1 DKK 6.500,00 410.107,29 2,26
1.610.408,13 8,87
Aareal Bank AG Inhaber-Aktien o.N. EUR 10.600,00 304.803,00 1,68
ACEA S.p.A. Azioni nom. EO 5,16 EUR 28.000,00 392.000,00 2,16
Akzo Nobel N.V. Aandelen aan toonder EO 2 EUR 4.900,00 295.813,00 1,63
Allianz SE vink.Namens-Aktien o.N. EUR 3.800,00 549.290,00 3,03
Assicurazioni Generali S.p.A. Azioni nom. EO 1 EUR 18.000,00 236.880,00 1,30
AXA S.A. Actions Port. EO 2,29 EUR 9.000,00 185.850,00 1,02
Banco Bilbao Vizcaya Argent. Acciones Nom. EO 0,49 EUR 29.164,00 173.496,64 0,96
BASF SE Namens-Aktien o.N. EUR 4.800,00 322.176,00 1,77
Bayerische Motoren Werke AG Stammaktien EO 1 EUR 4.200,00 344.862,00 1,90
Continental AG Inhaber-Aktien o.N. EUR 1.000,00 200.600,00 1,10
Deutsche Post AG Namens-Aktien o.N. EUR 10.200,00 254.949,00 1,40
Deutsche Telekom AG Namens-Aktien o.N. EUR 12.500,00 199.312,50 1,10
Henkel AG & Co. KGaA Inhaber-Stammaktien o.N. EUR 6.300,00 554.400,00 3,05
Hera S.p.A. Azioni nom. EO 1 EUR 60.000,00 158.280,00 0,87
Infineon Technologies AG Namens-Aktien o.N. EUR 20.000,00 253.100,00 1,39
ING Groep N.V. Cert.v.Aandelen EO 0,24 EUR 8.080,00 87.789,20 0,48
JCDecaux S.A. Actions au Porteur o.N. EUR 3.000,00 115.695,00 0,64
KONE Corp. (New) Registered Shares Cl.B o.N. EUR 7.400,00 320.346,00 1,76
KRONES AG Inhaber-Aktien o.N. EUR 3.000,00 317.700,00 1,75
Linde AG Inhaber-Aktien o.N. EUR 1.900,00 248.710,00 1,37
Merck KGaA Inhaber-Aktien o.N. EUR 4.800,00 355.536,00 1,96
Münchener Rückvers.-Ges. AG vink.Namens-Aktien o.N. EUR 1.215,00 218.274,75 1,20

82
DKB ZUKUNFTSFONDS
WertpapierbezeichnungSecurities
WährungCurrency
NominalNominal
MarktwertMarket value
EUR
% v. Teilfondsvermögen% of sub-fund assets
%-ában
Nokia Corp. Registered Shares EO 0,06 EUR 106.700,00 569.244,50 3,14
OMV AG Inhaber-Aktien o.N. EUR 13.000,00 329.160,00 1,81
Orange S.A. Actions Port. EO 4 EUR 14.000,00 218.260,00 1,20
Peugeot S.A. Actions Port. (C.R.) EO 1 EUR 27.000,00 414.585,00 2,28
Red Electrica Corporacion S.A. Acciones Port. EO 2 EUR 8.700,00 671.814,00 3,71
Renault S.A. Actions Port. EO 3,81 EUR 4.500,00 395.280,00 2,18
SAP SE Inhaber-Aktien o.N. EUR 7.700,00 547.932,00 3,02
Siemens AG Namens-Aktien o.N. EUR 2.500,00 233.325,00 1,29
Smurfit Kappa Group PLC Registered Shares EO -,001 EUR 10.000,00 226.850,00 1,25
Société Générale S.A. Actions Port. EO 1,25 EUR 4.600,00 150.857,00 0,83
Tieto Oyj Registered Shares o.N. EUR 5.000,00 115.700,00 0,64
UniCredit S.p.A. Azioni nom. o.N. EUR 100.400,00 328.308,00 1,81
UPM Kymmene Corp. Registered Shares o.N. EUR 14.000,00 228.340,00 1,26
Valéo S.A. Actions Port. EO 3 EUR 1.500,00 204.750,00 1,13
Verbund AG Inhaber-Aktien A o.N. EUR 22.700,00 254.126,50 1,40
Wacker Chemie AG Inhaber-Aktien o.N. EUR 3.600,00 280.440,00 1,54
Wartsila Corp. Reg. Shares o.N. EUR 7.200,00 290.016,00 1,60
11.548.851,09 63,61
Astrazeneca PLC Registered Shares DL -,25 GBP 2.500,00 124.693,32 0,69
BT Group PLC Registered Shares LS 0,05 GBP 34.000,00 193.208,89 1,06
Carnival PLC Registered Shares DL 1,66 GBP 5.200,00 244.557,51 1,35
Kingfisher PLC Reg. Shares LS -,157142857 GBP 63.000,00 302.871,50 1,67
Relx PLC Registered Shares LS -,144397 GBP 20.000,00 332.727,83 1,82
Sky PLC Registered Shares LS -,50 GBP 15.000,00 197.573,07 1,09
Tesco PLC Registered Shares LS -,05 GBP 60.000,00 148.084,27 0,82
1.543.716,39 8,50
Norsk Hydro ASA Navne-Aksjer NK 1,098 NOK 25.000,00 91.030,63 0,50
Telenor ASA Navne-Aksjer NK 6 NOK 5.600,00 83.014,41 0,46
174.045,04 0,96
Assa-Abloy AB Namn-Aktier B SK -,33 SEK 18.000,00 313.264,38 1,72
BillerudKorsnäs AB Namn-Aktier SK 12,50 SEK 13.000,00 194.166,77 1,07
Boliden AB Namn-Aktier SK 2 SEK 20.000,00 281.184,66 1,55
Ericsson Namn-Aktier B (fria) o.N. SEK 34.800,00 307.906,94 1,70
Svenska Cellulosa AB Namn-Aktier B (fria) SK 10 SEK 10.000,00 280.427,04 1,54
1.376.949,79 7,58
VERMÖGENSAUFSTELLUNG ZUM 31. MÄRZ 2016 (Fortsetzung) INVESTMENT PORTFOLIO AS AT MARCH 31ST, 2016 (continued)

DKB ZUKUNFTSFONDS
83
WertpapierbezeichnungSecurities
WährungCurrency
NominalNominal
MarktwertMarket value
EUR
% v. Teilfondsvermögen% of sub-fund assets
%-ában
Genussscheine • Profit participation certificates
Roche Holding AG Inhaber-Genußscheine o.N. CHF 1.300,00 282.352,70 1,56
282.352,70 1,56
Summe Wertpapiervermögen • Total securities holdings 16.989.094,13 93,58
Bankguthaben • Cash at banks
Bankkonto M.M.Warburg & CO Luxembourg S.A. CHF 11.552,22 10.591,29 0,06
Bankkonto M.M.Warburg & CO Luxembourg S.A. DKK 4.421.690,94 593.321,24 3,27
Bankkonto M.M.Warburg & CO Luxembourg S.A. EUR 438.748,99 438.748,99 2,42
Bankkonto M.M.Warburg & CO Luxembourg S.A. GBP 68.458,08 87.204,86 0,48
Bankkonto M.M.Warburg & CO Luxembourg S.A. NOK 886.271,06 94.112,35 0,52
Bankkonto M.M.Warburg & CO Luxembourg S.A. SEK 48.680,19 5.268,72 0,03
Summe Bankguthaben • Total cash at banks 1.229.247,45 6,78
Sonstige Vermögensgegenstände • Other assets
Dividendenforderungen GBP 1.882,50 2.398,01 0,01
Summe Sonstige Vermögensgegenstände • Total other assets 2.398,01 0,01
Zinsverbindlichkeiten • Interest liabilities
Zinsverbindlichkeit Bankkonto M.M.Warburg & CO Luxembourg S.A. CHF -8,93 -8,19 0,00
Zinsverbindlichkeit Bankkonto M.M.Warburg & CO Luxembourg S.A. EUR -759,01 -759,01 0,00
Zinsverbindlichkeit Bankkonto M.M.Warburg & CO Luxembourg S.A. SEK -7,57 -0,82 0,00
Summe Zinsverbindlichkeiten • Total interest liabilities -768,02 0,00
Sonstige Verbindlichkeiten • Other liabilities EUR -64.602,85 -64.602,85 -0,37
Teilfondsvermögen • Sub-fund assets 18.155.368,72 100,00 *)
*) Durch Rundungen bei der Berechnung können geringe Differenzen entstanden sein. • Slight deviations may have occurred as a result of rounding in the calculation.
VERMÖGENSAUFSTELLUNG ZUM 31. MÄRZ 2016 (Fortsetzung) INVESTMENT PORTFOLIO AS AT MARCH 31ST, 2016 (continued)
Die Erläuterungen sind ein integraler Bestandteil dieses Berichtes • The accompanying notes are an integral part of this financial report

84
DKB ZUKUNFTSFONDS
GEOGRAPHISCHE STRUKTUR DES WERTPAPIERVERMÖGENS IN PROZENT VOM TEILFONDSVERMÖGEN
STRUCTURE OF THE INVESTMENT PORTFOLIO BY GEOGRAPHICAL SECTOR IN PERCENT OF SUB-FUND ASSETS
LänderCountriesOrszágok
Kurswert in Mio. EURMarket value (millions) EUR
Piaci érték EUR
% v. Teilfondsvermögen% of sub-fund assets
Részalap vagyonának %-ában
Bundesrepublik Deutschland • Federal Republic of Germany 5,17 28,58
Frankreich • France 1,69 9,28
Dänemark • Denmark 1,61 8,87
Großbritannien • Great Britain 1,54 8,50
Finnland • Finland 1,52 8,39
Schweden • Sweden 1,38 7,58
Italien • Italy 1,12 6,14
Spanien • Spain 0,85 4,66
Schweiz • Switzerland 0,74 4,05
Sonstige Länder • Other countries 1,37 7,53
Summe • Total 16,99 93,58
WIRTSCHAFTLICHE STRUKTUR DES WERTPAPIERVERMÖGENS IN PROZENT VOM TEILFONDSVERMÖGEN
STRUCTURE OF THE INVESTMENT PORTFOLIO BY ECONOMIC SECTOR IN PERCENT OF SUB-FUND ASSETS
BranchenSectorsOrszágok
Kurswert in Mio. EURMarket value (millions) EUR
Piaci érték EUR
% v. Teilfondsvermögen% of sub-fund assets
Részalap vagyonának %-ában
Industrieunternehmen • Industrial companies 2,49 13,69
Verbrauchsgüter • Consumer goods 2,39 13,19
Finanzdienstleistungen • Financial services 2,24 12,31
Rohstoffe • Commodities 1,94 10,70
Technologie • Technology 1,79 9,88
Gesundheitswesen • Healthcare 1,60 8,84
Versorgungsunternehmen • Utilities 2,22 12,20
Verbraucherdienstleistungen • Consumer services 1,34 7,39
Sonstige Branchen•Other sectors 0,98 5,38
Summe • Total 16,99 93,58

DKB ZUKUNFTSFONDS
85
STATISTISCHE INFORMATIONEN
STATISTICAL INFORMATION
01.04.201531.03.2016
01.04.201431.03.2015
01.04.201331.03.2014
Umlaufende Anteile zu Beginn des Geschäftsjahres Klasse TNL • Units outstanding at the beginning of the financial year class TNL
719.584,9019 638.830,5639 643.156,7339
Ausgegebene Anteile Klasse TNL • Units issued class TNL 48.709,2340 104.587,2800 32.389,0200
Zurückgenommene Anteile Klasse TNL • Units redeemed class TNL 112.530,4710 23.832,9420 36.715,1900
Umlaufende Anteile am Ende des Geschäftsjahres Klasse TNL • Units outstanding at the end of the financial year class TNL
655.763,6649 719.584,9019 638.830,5639
31.03.2016EUR
31.03.2015EUR
31.03.2014EUR
Teilfondsvermögen • Sub-fund assets 18.155.368,72 21.514.391,04 16.315.128,79
Nettovermögenswert pro Anteil Klasse TNL • Net asset value per unit class TNL 27,69 29,90 25,54
Ausgabepreis pro Anteil Klasse TNL • Issue price per unit class TNL 27,69 29,90 25,54
Zwischengewinn pro Anteil Klasse TNL • Interim profit per unit class TNL 0,00 0,00 0,00
ZUSAMMENSETZUNG DES TEILFONDSVERMÖGENS
STATEMENT OF SUB-FUND ASSETS
31.03.2016
Wertpapiervermögen • Securities holdings EUR 16.989.094,13
Bankguthaben • Cash at banks EUR 1.229.247,45
Sonstige Vermögensgegenstände • Other assets EUR 2.398,01
Zinsverbindlichkeiten • Interest liabilities EUR -768,02
Sonstige Verbindlichkeiten • Other liabilities EUR -64.602,85
Teilfondsvermögen • Sub-fund assets EUR 18.155.368,72
Das Teilfondsvermögen setzt sich zusammen aus insgesamt 655.763,66 umlaufenden Anteilen mit einem Inventarwert von EUR 27,69 (gerundet) pro Anteil.
Sub-fund assets are represented by a net asset value of EUR 27.69 (rounded) per unit on 655,763.66 units outstanding.

86
DKB ZUKUNFTSFONDS
ERTRAGS- UND AUFWANDSRECHNUNG
STATEMENT OF OPERATIONS
01.04.201531.03.2016
Total total EUR
Dividendenerträge • Dividend income 525.806,32
Quellensteuer auf Dividendenerträge • Withholding tax on dividend income -117.536,54
Sonstige Erträge • Other income 13.542,57
Ordentlicher Ertragsausgleich • Income equalisation -32.253,96
ERTRÄGE INSGESAMT • TOTAL INCOME 389.558,39
Verwaltungsvergütung • Management fee 1) -284.524,96
Zentraladministrationsvergütung • Central administration fee -20.322,30
Depotbankvergütung • Custodian fee -12.401,71
Vertriebsprovision • Sales commission -130.195,48
Prüfungskosten • Audit fees -6.472,00
Taxe d‘abonnement • Taxe d’abonnement -9.992,50
Veröffentlichungskosten • Publication costs -7.886,83
Zinsaufwendungen • Interest expenses -2.088,03
Sonstige Aufwendungen • Other expenses -20.551,84
Ordentlicher Aufwandsausgleich • Equalisation expenses 42.573,48
AUFWENDUNGEN INSGESAMT • TOTAL EXPENSES -451.862,17
ORDENTLICHER AUFWANDSÜBERSCHUSS • ORDINARY EXPENDITURE SURPLUS -62.303,78
1) Gemäß den Vertragsbedingungen erhält die Verwaltungsgesellschaft eine Gebühr von 1,40% p.a. für die Klasse TNL des am letzten Bewertungstages eines Monats festgestellten Teilfondsvermögens. Aus diesem Betrag wird auch das Anlageberaterhonorar vergütet.
The Management Company receives in accordance with the management regulations an annual fee of 1.40% for the class TNL of the sub-
fund assets as at the last valuation date of each month. The advisory fee will be paid out of this amount.
Die Erläuterungen sind ein integraler Bestandteil dieses Berichtes • The accompanying notes are an integral part of this financial report
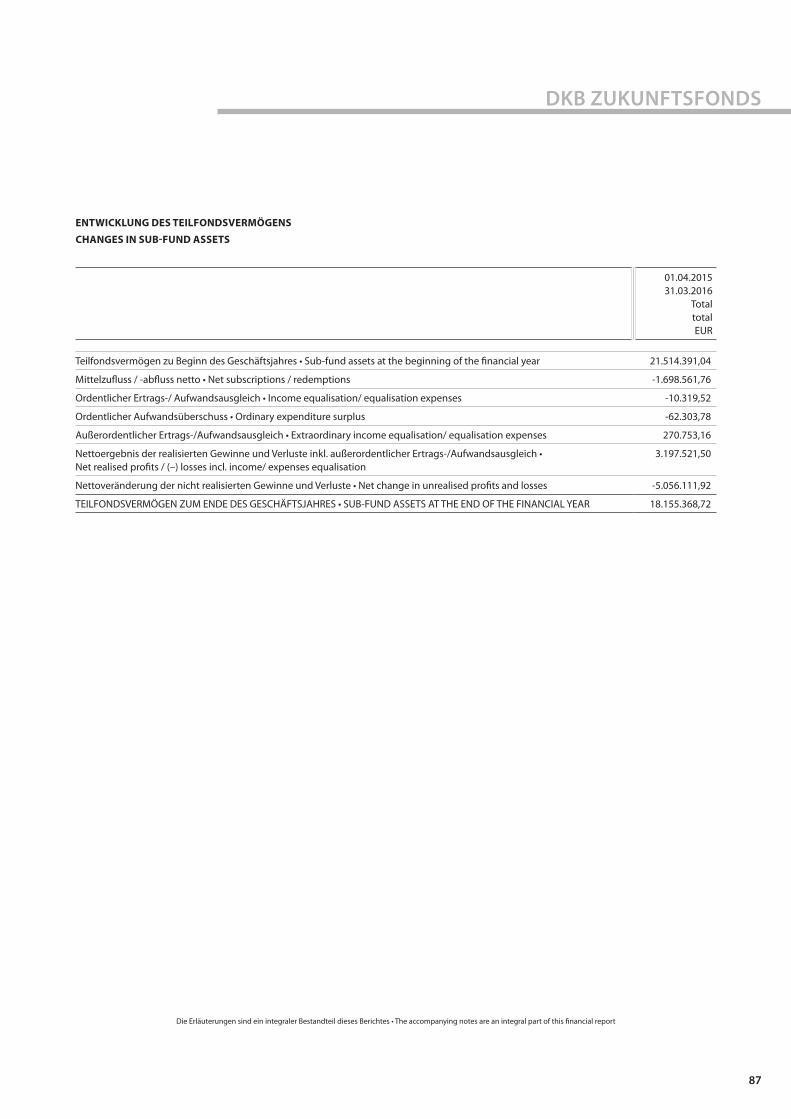
DKB ZUKUNFTSFONDS
87
ENTWICKLUNG DES TEILFONDSVERMÖGENS
CHANGES IN SUB-FUND ASSETS
01.04.201531.03.2016
Total total EUR
Teilfondsvermögen zu Beginn des Geschäftsjahres • Sub-fund assets at the beginning of the financial year 21.514.391,04
Mittelzufluss / -abfluss netto • Net subscriptions / redemptions -1.698.561,76
Ordentlicher Ertrags-/ Aufwandsausgleich • Income equalisation/ equalisation expenses -10.319,52
Ordentlicher Aufwandsüberschuss • Ordinary expenditure surplus -62.303,78
Außerordentlicher Ertrags-/Aufwandsausgleich • Extraordinary income equalisation/ equalisation expenses 270.753,16
Nettoergebnis der realisierten Gewinne und Verluste inkl. außerordentlicher Ertrags-/Aufwandsausgleich • Net realised profits / (–) losses incl. income/ expenses equalisation
3.197.521,50
Nettoveränderung der nicht realisierten Gewinne und Verluste • Net change in unrealised profits and losses -5.056.111,92
TEILFONDSVERMÖGEN ZUM ENDE DES GESCHÄFTSJAHRES • SUB-FUND ASSETS AT THE END OF THE FINANCIAL YEAR 18.155.368,72
Die Erläuterungen sind ein integraler Bestandteil dieses Berichtes • The accompanying notes are an integral part of this financial report

88
DKB ÖKOFONDS
VERMÖGENSAUFSTELLUNG ZUM 31. MÄRZ 2016 INVESTMENT PORTFOLIO AS AT MARCH 31ST, 2016
WertpapierbezeichnungSecurities
WährungCurrency
NominalNominal
MarktwertMarket value
EUR
% v. Teilfondsvermögen% of sub-fund assets
%-ában
Wertpapiervermögen • Securities holdings
Amtlich gehandelte Wertpapiere • Officially traded securities
Aktien • Shares
SunOpta Inc. Registered Shares o.N. CAD 11.000,00 44.930,14 0,35
44.930,14 0,35
ABB Ltd. Namens-Aktien SF 0,86 CHF 13.500,00 233.802,56 1,83
Geberit AG Nam.-Akt. (Dispost.) SF -,10 CHF 800,00 265.070,67 2,07
Swiss Re AG Namens-Aktien SF -,10 CHF 800,00 65.350,85 0,51
564.224,08 4,41
Coloplast AS Navne-Aktier B DK 1 DKK 900,00 60.443,29 0,47
Novozymes A/S Navne-Aktier B DK 2 DKK 6.000,00 241.451,12 1,89
Rockwool International A/S Navne-Aktier B DK 10 DKK 300,00 41.301,91 0,32
Vestas Wind Systems AS Navne-Aktier DK 1 DKK 6.700,00 422.725,98 3,31
765.922,30 5,99
Allianz SE vink.Namens-Aktien o.N. EUR 1.200,00 173.460,00 1,36
Ansaldo STS S.p.A. Azioni nom. EO -,50 EUR 26.300,00 277.465,00 2,17
Boiron S.A. Actions Port. EO 1 EUR 1.300,00 92.950,00 0,73
Capital Stage AG Inhaber-Aktien o.N. EUR 2.000,00 14.538,00 0,11
CENTROTEC Sustainable AG Inhaber-Aktien o.N. EUR 3.000,00 42.105,00 0,33
Continental AG Inhaber-Aktien o.N. EUR 500,00 100.300,00 0,78
Dassault Systèmes S.A. Actions Port. EO 0,50 EUR 1.600,00 113.120,00 0,88
EDP Renováveis S.A. Acciones Port. EO 5 EUR 51.000,00 345.780,00 2,71
Enel Green Power S.P.A. Azioni nom. EO -,20 EUR 177.000,00 343.734,00 2,69
Evonik Industries AG Namens-Aktien o.N. EUR 1.800,00 48.105,00 0,38
Gamesa Corp. Tecnologica S.A. Acciones Port. EO -,17 EUR 23.581,00 413.964,46 3,23
Henkel AG & Co. KGaA Inhaber-Stammaktien o.N. EUR 3.000,00 264.000,00 2,07
Infineon Technologies AG Namens-Aktien o.N. EUR 22.000,00 278.410,00 2,18
init innova.in traffic sys. AG Inhaber-Aktien o.N. EUR 1.497,00 23.023,86 0,18
Linde AG Inhaber-Aktien o.N. EUR 1.300,00 170.170,00 1,33
Münchener Rückvers.-Ges. AG vink.Namens-Aktien o.N. EUR 1.100,00 197.615,00 1,55
Nordex SE Inhaber-Aktien o.N. EUR 14.800,00 351.352,00 2,75
OSRAM Licht AG Namens-Aktien o.N. EUR 2.000,00 90.520,00 0,71
PNE WIND AG Namens-Aktien o.N. EUR 10.000,00 17.970,00 0,14
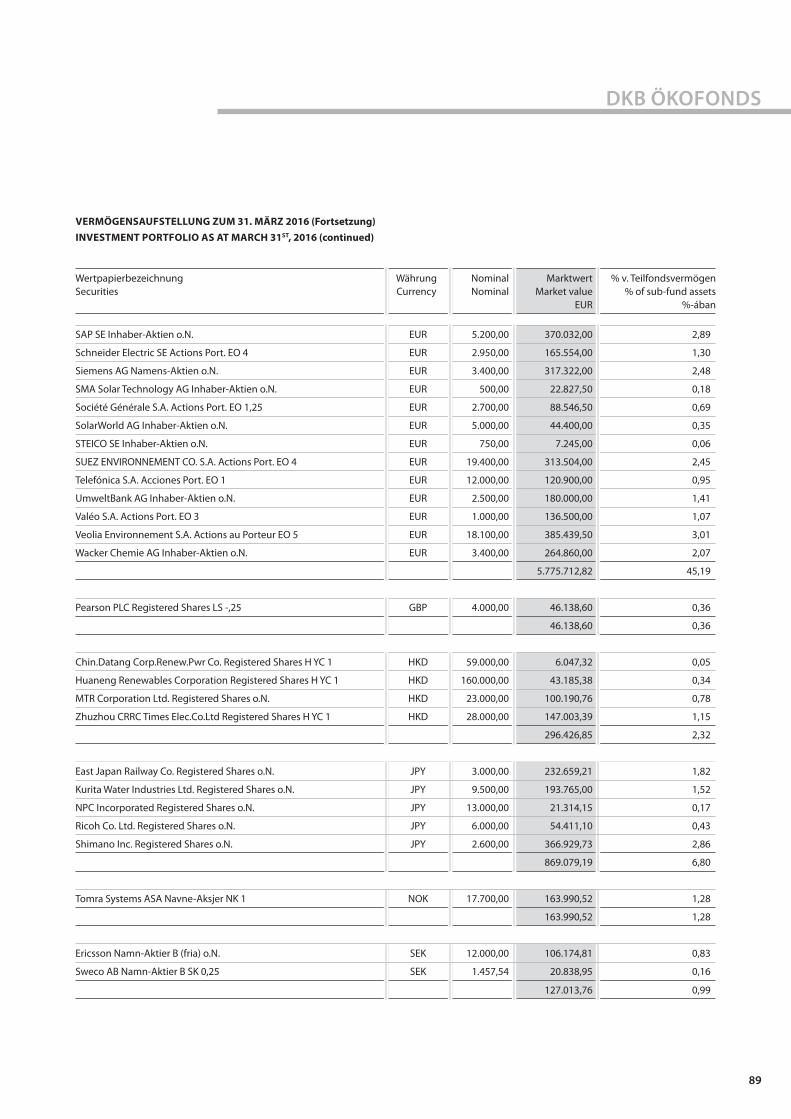
DKB ÖKOFONDS
89
WertpapierbezeichnungSecurities
WährungCurrency
NominalNominal
MarktwertMarket value
EUR
% v. Teilfondsvermögen% of sub-fund assets
%-ában
SAP SE Inhaber-Aktien o.N. EUR 5.200,00 370.032,00 2,89
Schneider Electric SE Actions Port. EO 4 EUR 2.950,00 165.554,00 1,30
Siemens AG Namens-Aktien o.N. EUR 3.400,00 317.322,00 2,48
SMA Solar Technology AG Inhaber-Aktien o.N. EUR 500,00 22.827,50 0,18
Société Générale S.A. Actions Port. EO 1,25 EUR 2.700,00 88.546,50 0,69
SolarWorld AG Inhaber-Aktien o.N. EUR 5.000,00 44.400,00 0,35
STEICO SE Inhaber-Aktien o.N. EUR 750,00 7.245,00 0,06
SUEZ ENVIRONNEMENT CO. S.A. Actions Port. EO 4 EUR 19.400,00 313.504,00 2,45
Telefónica S.A. Acciones Port. EO 1 EUR 12.000,00 120.900,00 0,95
UmweltBank AG Inhaber-Aktien o.N. EUR 2.500,00 180.000,00 1,41
Valéo S.A. Actions Port. EO 3 EUR 1.000,00 136.500,00 1,07
Veolia Environnement S.A. Actions au Porteur EO 5 EUR 18.100,00 385.439,50 3,01
Wacker Chemie AG Inhaber-Aktien o.N. EUR 3.400,00 264.860,00 2,07
5.775.712,82 45,19
Pearson PLC Registered Shares LS -,25 GBP 4.000,00 46.138,60 0,36
46.138,60 0,36
Chin.Datang Corp.Renew.Pwr Co. Registered Shares H YC 1 HKD 59.000,00 6.047,32 0,05
Huaneng Renewables Corporation Registered Shares H YC 1 HKD 160.000,00 43.185,38 0,34
MTR Corporation Ltd. Registered Shares o.N. HKD 23.000,00 100.190,76 0,78
Zhuzhou CRRC Times Elec.Co.Ltd Registered Shares H YC 1 HKD 28.000,00 147.003,39 1,15
296.426,85 2,32
East Japan Railway Co. Registered Shares o.N. JPY 3.000,00 232.659,21 1,82
Kurita Water Industries Ltd. Registered Shares o.N. JPY 9.500,00 193.765,00 1,52
NPC Incorporated Registered Shares o.N. JPY 13.000,00 21.314,15 0,17
Ricoh Co. Ltd. Registered Shares o.N. JPY 6.000,00 54.411,10 0,43
Shimano Inc. Registered Shares o.N. JPY 2.600,00 366.929,73 2,86
869.079,19 6,80
Tomra Systems ASA Navne-Aksjer NK 1 NOK 17.700,00 163.990,52 1,28
163.990,52 1,28
Ericsson Namn-Aktier B (fria) o.N. SEK 12.000,00 106.174,81 0,83
Sweco AB Namn-Aktier B SK 0,25 SEK 1.457,54 20.838,95 0,16
127.013,76 0,99
VERMÖGENSAUFSTELLUNG ZUM 31. MÄRZ 2016 (Fortsetzung) INVESTMENT PORTFOLIO AS AT MARCH 31ST, 2016 (continued)

90
DKB ÖKOFONDS
WertpapierbezeichnungSecurities
WährungCurrency
NominalNominal
MarktwertMarket value
EUR
% v. Teilfondsvermögen% of sub-fund assets
%-ában
American States Water Co. Registered Shares DL 2,50 USD 9.200,00 323.429,88 2,52
Apple Inc. Registered Shares o.N. USD 700,00 67.725,19 0,53
Canadian National Railway Co. Registered Shares o.N. USD 4.600,00 254.738,61 1,99
Canadian Solar Inc. Registered Shares o.N. USD 5.700,00 97.701,34 0,76
CECO Environmental Corp. Registered Shares DL -,01 USD 5.500,00 30.258,74 0,24
Cree Inc. Registered Shares DL-,00125 USD 5.000,00 133.080,18 1,04
CSX Corp. Registered Shares DL 1 USD 7.200,00 167.220,06 1,31
First Solar Inc. Registered Shares DL -,001 USD 6.100,00 371.526,85 2,91
Hain Celestial Group Inc.,The Registered Shares DL -,01 USD 6.000,00 217.555,63 1,70
Ingersoll-Rand PLC Registered Shares DL 1 USD 2.300,00 126.069,41 0,98
Intel Corp. Registered Shares DL -,001 USD 5.500,00 158.870,54 1,24
Itron Inc. Registered Shares o.N. USD 2.700,00 99.330,63 0,78
JA Solar Holdings Co. Ltd. Reg.Shares(Sp.ADRs) 5 DL-,0001 USD 8.000,00 61.179,80 0,48
JinkoSolar Holding Co. Ltd. Reg.Shs (Sp. ADRs)/4 DL-,00002 USD 2.600,00 47.274,81 0,37
Johnson Controls Inc. Registered Shares DL -,0139 USD 2.000,00 68.668,32 0,54
Norfolk Southern Corp. Registered Shares DL 1 USD 2.400,00 179.618,51 1,41
Ormat Technologies Inc. Registered Shares DL -,001 USD 14.000,00 504.786,29 3,95
SolarCity Corp. Registered Shares DL -,0001 USD 2.100,00 43.227,66 0,34
SunPower Corp. Registered Shs DL -,01 USD 4.600,00 91.398,80 0,72
Teradata Corp. (Del.) Registered Shares DL -,01 USD 500,00 11.528,61 0,09
Tesla Motors Inc. Registered Shares DL-,001 USD 800,00 160.289,65 1,25
Trina Solar Ltd. Reg.Shs (Sp.ADRs)/50 DL -,01 USD 14.600,00 127.253,62 1,00
Union Pacific Corp. Registered Shares DL 2,50 USD 4.000,00 284.563,76 2,23
United Natural Foods Inc. Registered Shares DL -,01 USD 3.800,00 135.704,70 1,06
Whole Foods Market Inc. Registered Shares o.N. USD 3.800,00 106.946,31 0,84
3.869.947,90 30,28
Summe Wertpapiervermögen • Total securities holdings 12.523.386,16 97,97
Derivate • Derivatives
Aktienindex-Terminkontrakte • Share index future contracts
MSCI World NTR Daily Index Future 17.06.16 EUR -66,00 -7.920,00 -0,06
Devisenterminkontrakte (Kauf/Verkauf) • Forward foreign exchange transactions purchase/sale
Devisenterminkontrakte • Currency futures contracts
EUR/USD Future 13.06.16 USD -2,00 -5.298,48 -0,04
JPY/USD Future 13.06.16 USD -3,00 -2.235,30 -0,02
Summe Derivate • Total derivatives -15.453,78 -0,12
VERMÖGENSAUFSTELLUNG ZUM 31. MÄRZ 2016 (Fortsetzung) INVESTMENT PORTFOLIO AS AT MARCH 31ST, 2016 (continued)

DKB ÖKOFONDS
91
WertpapierbezeichnungSecurities
WährungCurrency
NominalNominal
MarktwertMarket value
EUR
% v. Teilfondsvermögen% of sub-fund assets
%-ában
Bankguthaben • Cash at banks
Bankkonto M.M.Warburg & CO Luxembourg S.A. CAD 3.443,88 2.344,45 0,02
Bankkonto M.M.Warburg & CO Luxembourg S.A. CHF 45.712,92 41.910,47 0,33
Bankkonto M.M.Warburg & CO Luxembourg S.A. DKK 20.931,89 2.808,73 0,02
Bankkonto M.M.Warburg & CO Luxembourg S.A. EUR 31.880,73 31.880,73 0,25
Bankkonto M.M.Warburg & CO Luxembourg S.A. GBP 1.032,55 1.315,31 0,01
Bankkonto M.M.Warburg & CO Luxembourg S.A. HKD 3.857,06 439,26 0,00
Bankkonto M.M.Warburg & CO Luxembourg S.A. JPY 188.527,00 1.478,94 0,01
Bankkonto M.M.Warburg & CO Luxembourg S.A. NOK 9.876,71 1.048,80 0,01
Bankkonto M.M.Warburg & CO Luxembourg S.A. SEK 6.563,26 710,35 0,01
Bankkonto M.M.Warburg & CO Luxembourg S.A. USD 12.976,81 11.459,56 0,09
Forderungen aus Variation Margin M.M.Warburg & CO Luxembourg S.A. EUR 7.920,00 7.920,00 0,06
Forderungen aus Variation Margin M.M.Warburg & CO Luxembourg S.A. USD 8.531,25 7.533,78 0,06
Summe Bankguthaben • Total cash at banks 110.850,38 0,87
Sonstige Vermögensgegenstände • Other assets
Dividendenforderungen JPY 447.137,00 3.507,68 0,03
Dividendenforderungen USD 3.758,29 3.318,87 0,03
Initial Margin M.M.Warburg & CO Luxembourg S.A. EUR 177.547,36 177.547,36 1,38
Initial Margin M.M.Warburg & CO Luxembourg S.A. USD 15.200,00 13.422,82 0,11
Sonstige Forderungen M.M.Warburg & CO Luxembourg S.A. EUR 12.083,28 12.083,28 0,09
Zinsforderung Bankkonto M.M.Warburg & CO Luxembourg S.A. USD 4,94 4,36 0,00
Summe Sonstige Vermögensgegenstände • Total other assets 209.884,37 1,64
Zinsverbindlichkeiten • Interest liabilities
Zinsverbindlichkeit Bankkonto M.M.Warburg & CO Luxembourg S.A. CHF -80,21 -73,54 0,00
Zinsverbindlichkeit Bankkonto M.M.Warburg & CO Luxembourg S.A. EUR -60,65 -60,65 0,00
Summe Zinsverbindlichkeiten • Total interest liabilities -134,19 0,00
Sonstige Verbindlichkeiten • Other liabilities EUR -46.219,29 -46.219,29 -0,36
Teilfondsvermögen • Sub-fund assets 12.782.313,65 100,00 *)
Durch Rundungen bei der Berechnung können geringe Differenzen entstanden sein. • Slight deviations may have occurred as a result of rounding in the calculation.
VERMÖGENSAUFSTELLUNG ZUM 31. MÄRZ 2016 (Fortsetzung) INVESTMENT PORTFOLIO AS AT MARCH 31ST, 2016 (continued)
Die Erläuterungen sind ein integraler Bestandteil dieses Berichtes • The accompanying notes are an integral part of this financial report

92
DKB ÖKOFONDS
VERPFLICHTUNGEN AUS DERIVATEN
LIABILITIES ON DERIVATIVES
FuturesFutures
WährungCurrency
KontrakteContracts
KontraktgrößeContract size
KursPrice
Dev.Kurs **) Exchange rate
Verpflichtungen aus Derivaten
Contingent liabilities under derivatives contracts
EUR
Futures Verkauf • Futures sales
EUR/USD Future 13.06.16 USD -2,00 125.000,00 1,1360 1,1324 -250.794,77
JPY/USD Future 13.06.16 USD -3,00 12.500.000,00 0,0089 1,1324 -295.042,61
MSCI World NTR Daily Index Future 17.06.16
EUR -66,00 100,00 203,4000 1,0000 -1.342.440,00
Summe Futures Verkauf • Total futures: sales -1.888.277,38
Sämtliche Derivate wurden über die M.M.Warburg & CO Luxembourg S.A. abgewickelt. • All derivatives were handled by M.M.Warburg & CO Luxembourg S.A.
**) Berechnung mit 6 Nachkommastellen (siehe Seite 102 f.). • Calculation with 6-digits (see page 102).
Die Erläuterungen sind ein integraler Bestandteil dieses Berichtes • The accompanying notes are an integral part of this financial report
DKB ÖKOFONDS

DKB ÖKOFONDS
93
GEOGRAPHISCHE STRUKTUR DES WERTPAPIERVERMÖGENS IN PROZENT VOM TEILFONDSVERMÖGEN
STRUCTURE OF THE INVESTMENT PORTFOLIO BY GEOGRAPHICAL SECTOR IN PERCENT OF SUB-FUND ASSETS
LänderCountriesOrszágok
Kurswert in Mio. EURMarket value (millions) EUR
Piaci érték EUR
% v. Teilfondsvermögen% of sub-fund assets
Részalap vagyonának %-ában
USA • USA 3,14 24,68
Bundesrepublik Deutschland • Federal Republic of Germany 2,98 23,30
Frankreich • France 1,30 10,14
Spanien • Spain 0,88 6,89
Japan • Japan 0,87 6,80
Dänemark • Denmark 0,77 5,99
Italien • Italy 0,62 4,86
Schweiz • Switzerland 0,56 4,41
Kanada • Canada 0,40 3,11
Sonstige Länder • Other countries 1,00 7,79
Summe • Total 12,52 97,97
WIRTSCHAFTLICHE STRUKTUR DES WERTPAPIERVERMÖGENS IN PROZENT VOM TEILFONDSVERMÖGEN
STRUCTURE OF THE INVESTMENT PORTFOLIO BY ECONOMIC SECTOR IN PERCENT OF SUB-FUND ASSETS
BranchenSectorsOrszágok
Kurswert in Mio. EURMarket value (millions) EUR
Piaci érték EUR
% v. Teilfondsvermögen% of sub-fund assets
Részalap vagyonának %-ában
Industrieunternehmen • Industrial companies 3,22 25,00
Versorgungsunternehmen • Utilities 4,19 32,79
Verbrauchsgüter • Consumer goods 1,45 11,34
Technologie • Technology 1,29 10,12
Finanzdienstleistungen • Financial services 0,70 5,52
Verbraucherdienstleistungen • Consumer services 0,66 5,20
Rohstoffe • Commodities 0,48 3,78
Gesundheitswesen • Healthcare 0,39 3,09
Telekommunikation • Telecommunications 0,14 1,13
Summe • Total 12,52 97,97
Die Erläuterungen sind ein integraler Bestandteil dieses Berichtes • The accompanying notes are an integral part of this financial report

94
DKB ÖKOFONDS
STATISTISCHE INFORMATIONEN
STATISTICAL INFORMATION
01.04.201531.03.2016
01.04.201431.03.2015
01.04.201331.03.2014
Umlaufende Anteile zu Beginn des Geschäftsjahres Klasse TNL • Units outstanding at the beginning of the financial year class TNL
651.823,4303 658.579,2173 663.822,8063
Ausgegebene Anteile Klasse TNL • Units issued class TNL 10.598,8970 9.112,4010 13.411,8590
Zurückgenommene Anteile Klasse TNL • Units redeemed class TNL 4.775,7660 15.868,1880 18.655,4480
Umlaufende Anteile am Ende des Geschäftsjahres Klasse TNL • Units outstanding at the end of the financial year class TNL
657.646,5613 651.823,4303 658.579,2173
31.03.2016EUR
31.03.2015EUR
31.03.2014EUR
Teilfondsvermögen • Sub-fund assets 12.782.313,65 14.161.666,05 11.499.651,34
Nettovermögenswert pro Anteil Klasse TNL • Net asset value per unit class TNL 19,44 21,73 17,46
Ausgabepreis pro Anteil Klasse TNL • Issue price per unit class TNL 19,44 21,73 17,46
Zwischengewinn pro Anteil Klasse TNL • Interim profit per unit class TNL 0,00 0,00 0,00
ZUSAMMENSETZUNG DES TEILFONDSVERMÖGENS
STATEMENT OF SUB-FUND ASSETS
31.03.2016
Wertpapiervermögen • Securities holdings EUR 12.523.386,16
Derivate • Derivatives EUR -15.453,78
Bankguthaben • Cash at banks EUR 110.850,38
Sonstige Vermögensgegenstände • Other assets EUR 209.884,37
Zinsverbindlichkeiten • Interest liabilities EUR -134,19
Sonstige Verbindlichkeiten • Other liabilities EUR -46.219,29
Teilfondsvermögen • Sub-fund assets EUR 12.782.313,65
Das Teilfondsvermögen setzt sich zusammen aus insgesamt 657.646,56 umlaufenden Anteilen mit einem Inventarwert von EUR 19,44 (gerundet) pro Anteil.
Sub-fund assets are represented by a net asset value of EUR 19.44 (rounded) per unit on 657,646.56 units outstanding.

DKB ÖKOFONDS
95
ERTRAGS- UND AUFWANDSRECHNUNG
STATEMENT OF OPERATIONS
01.04.201531.03.2016
Total total EUR
Dividendenerträge • Dividend income 204.272,07
Quellensteuer auf Dividendenerträge • Withholding tax on dividend income -47.605,07
Zinsen aus Geldanlagen • Interest on money-market investments 5,34
Sonstige Erträge • Other income 11.076,12
Ordentlicher Ertragsausgleich • Income equalisation 1.016,76
ERTRÄGE INSGESAMT • TOTAL INCOME 168.765,22
Verwaltungsvergütung • Management fee 1) -184.435,88
Zentraladministrationsvergütung • Central administration fee -13.175,23
Depotbankvergütung • Custodian fee -8.038,31
Vertriebsprovision • Sales commission -84.008,63
Prüfungskosten • Audit fees -7.522,00
Taxe d‘abonnement • Taxe d’abonnement -6.449,61
Veröffentlichungskosten • Publication costs -8.025,93
Zinsaufwendungen • Interest expenses -1.007,85
Sonstige Aufwendungen • Other expenses -25.570,65
Ordentlicher Aufwandsausgleich • Equalisation expenses -1.705,29
AUFWENDUNGEN INSGESAMT • TOTAL EXPENSES -339.939,38
ORDENTLICHER AUFWANDSÜBERSCHUSS • ORDINARY EXPENDITURE SURPLUS -171.174,16
1) Gemäß den Vertragsbedingungen erhält die Verwaltungsgesellschaft eine Gebühr von 1,49% p.a. für die Klasse TNL des am letzten Bewertungstages eines Monats festgestellten Teilfondsvermögens. Aus diesem Betrag wird auch das Anlageberaterhonorar vergütet.
The Management Company receives in accordance with the management regulations an annual fee of 1.49% for the class TNL of the sub-fund assets as at the last valuation date of each month. The advisory fee will be paid out of this amount.

96
DKB ÖKOFONDS
Die Erläuterungen sind ein integraler Bestandteil dieses Berichtes • The accompanying notes are an integral part of this financial report
ENTWICKLUNG DES TEILFONDSVERMÖGENS
CHANGES IN SUB-FUND ASSETS
01.04.201531.03.2016
Total total EUR
Teilfondsvermögen zu Beginn des Geschäftsjahres • Sub-fund assets at the beginning of the financial year 14.161.666,05
Mittelzufluss / -abfluss netto • Net subscriptions / redemptions 118.096,98
Ordentlicher Ertrags-/ Aufwandsausgleich • Income equalisation/ equalisation expenses 688,53
Ordentlicher Aufwandsüberschuss • Ordinary expenditure surplus -171.174,16
Außerordentlicher Ertrags-/Aufwandsausgleich • Extraordinary income equalisation/ equalisation expenses -2.013,70
Nettoergebnis der realisierten Gewinne und Verluste inkl. außerordentlicher Ertrags-/Aufwandsausgleich • Net realised profits / (–) losses incl. income/ expenses equalisation
201.939,21
Nettoveränderung der nicht realisierten Gewinne und Verluste • Net change in unrealised profits and losses -1.526.889,26
TEILFONDSVERMÖGEN ZUM ENDE DES GESCHÄFTSJAHRES • SUB-FUND ASSETS AT THE END OF THE FINANCIAL YEAR 12.782.313,65

97
DKB KONSOLIDIERT • CONSOLIDATED
Die Erläuterungen sind ein integraler Bestandteil dieses Berichtes • The accompanying notes are an integral part of this financial report
ZUSAMMENSETZUNG DES FONDSVERMÖGENS STATEMENT OF FUND ASSETS
31.03.2016 EUR
Wertpapiervermögen • Securities holdings 179.354.729,16
Derivate • Derivatives -45.608,41
Bankguthaben • Cash at banks 9.296.903,89
Sonstige Vermögensgegenstände • Other assets 1.153.855,19
Bankverbindlichkeiten • Bank debt/ bank liabilities/ bank loan facilities/ financial liabilities -141.632,31
Zinsverbindlichkeiten • Interest liabilities -4.224,97
Sonstige Verbindlichkeiten • Other liabilities -594.170,53
FONDSVERMÖGEN • FUND ASSETS 189.019.852,02

98
DKB KONSOLIDIERT • CONSOLIDATED
ERTRAGS- UND AUFWANDSRECHNUNG
STATEMENT OF OPERATIONS
01.04.201531.03.2016
EUR
Zinserträge aus Wertpapieren • Interest income from securities 343.577,90
Quellensteuer auf Zinserträge • Withholding tax on interest income -1.068,82
Dividendenerträge • Dividend income 4.564.269,32
Quellensteuer auf Dividendenerträge • Withholding tax on dividend income -904.743,88
Erträge aus Investmentanteilen • Income from investment units 23.542,52
Erträge aus REITs • Income from REITs 32.207,03
Quellensteuer auf REITs-Erträge • Withholding tax on REITS income -4.710,25
Zinsen aus Geldanlagen • Interest on money-market investments 173,13
Erträge aus Bestandsprovisionen • Income from portfolio commissions 0,00
Sonstige Erträge • Other income 178.935,54
Ordentlicher Ertragsausgleich • Income equalisation -70.030,15
Erträge insgesamt • Total income 4.162.152,34
Verwaltungsvergütung • Management fee -2.513.585,36
Zentraladministrationsvergütung • Central administration fee -200.371,14
Depotbankvergütung • Custodian fee -155.054,06
Vertriebsprovision • Sales commission -1.071.092,74
Prüfungskosten • Audit fees -51.078,00
Taxe d‘abonnement • Taxe d’abonnement -97.296,89
Veröffentlichungskosten • Publication costs -77.557,43
Zinsaufwendungen • Interest expenses -11.635,80
Sonstige Aufwendungen • Other expenses -220.998,88
Ordentlicher Aufwandsausgleich • Equalisation expenses 74.619,29
AUFWENDUNGEN INSGESAMT • TOTAL EXPENSES -4.324.051,01
ORDENTLICHER AUFWANDSÜBERSCHUSS • ORDINARY EXPENDITURE SURPLUS -161.898,67
1) Gemäß den Vertragsbedingungen erhält die Verwaltungsgesellschaft eine Gebühr von 1,49% p.a. für die Klasse TNL des am letzten Bewertungstages eines Monats festgestellten Teilfondsvermögens. Aus diesem Betrag wird auch das Anlageberaterhonorar vergütet.
The Management Company receives in accordance with the management regulations an annual fee of 1.49% for the class TNL of the sub-fund assets as at the last valuation date of each month. The advisory fee will be paid out of this amount.
Die Erläuterungen sind ein integraler Bestandteil dieses Berichtes • The accompanying notes are an integral part of this financial report
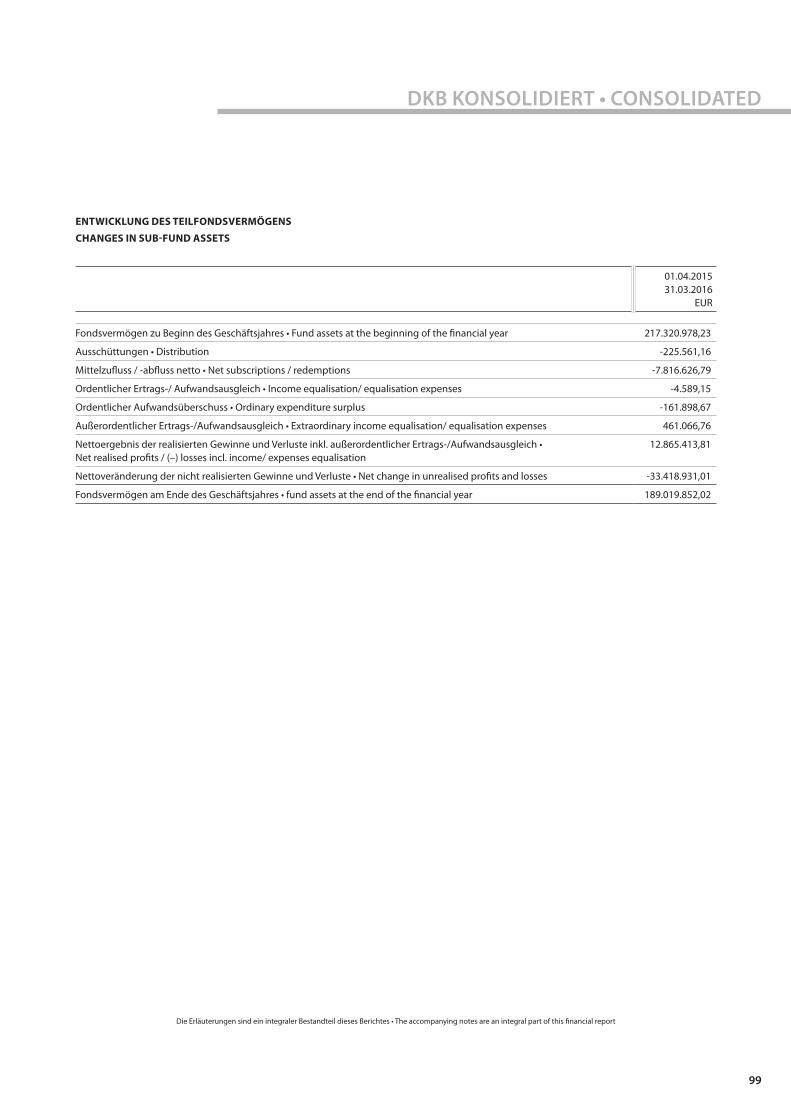
DKB KONSOLIDIERT • CONSOLIDATED
99
ENTWICKLUNG DES TEILFONDSVERMÖGENS
CHANGES IN SUB-FUND ASSETS
01.04.201531.03.2016
EUR
Fondsvermögen zu Beginn des Geschäftsjahres • Fund assets at the beginning of the financial year 217.320.978,23
Ausschüttungen • Distribution -225.561,16
Mittelzufluss / -abfluss netto • Net subscriptions / redemptions -7.816.626,79
Ordentlicher Ertrags-/ Aufwandsausgleich • Income equalisation/ equalisation expenses -4.589,15
Ordentlicher Aufwandsüberschuss • Ordinary expenditure surplus -161.898,67
Außerordentlicher Ertrags-/Aufwandsausgleich • Extraordinary income equalisation/ equalisation expenses 461.066,76
Nettoergebnis der realisierten Gewinne und Verluste inkl. außerordentlicher Ertrags-/Aufwandsausgleich • Net realised profits / (–) losses incl. income/ expenses equalisation
12.865.413,81
Nettoveränderung der nicht realisierten Gewinne und Verluste • Net change in unrealised profits and losses -33.418.931,01
Fondsvermögen am Ende des Geschäftsjahres • fund assets at the end of the financial year 189.019.852,02
Die Erläuterungen sind ein integraler Bestandteil dieses Berichtes • The accompanying notes are an integral part of this financial report

100
Anlagen in Wertpapieren Investment in securities
Realisierte Kursgewinne oder Kursverluste werden auf der Grundlage der durchschnittlichen Einstandskurse errech-net. Die Einstandskurse der Wertpapiere, deren Kaufprei-se nicht in Euro ausgedrückt sind, werden auf Basis der entsprechenden Devisenkurse am Kauftag ermittelt. Die Tageskurse dieser Wertpapiere sind zum Devisenkurs vom 30. März 2016 umgerechnet worden, im Teilfonds DKB Asien Fonds mit Devisenkursen zum 31. März 2016.
Realised gains or losses on securities trades are calcula-ted on an average cost basis. The cost prices of securiti-es acquired in currencies other than Euro are based on exchange rates ruling at the time of acquisition. The mar-ket value of such securities is converted into Euro at the exchange rates ruling at March 30th, 2016, the sub-fund DKB Asia Fund was convertes using exchanges rates as at March 31st, 2016.
Wertpapiere, die an einer offiziellen Börse notiert sind oder die an einem anderen geregelten Markt, der aner-kannt, für das Publikum offen und dessen Funktions-weise ordnungsgemäß ist, gehandelt werden, werden zum letzten verfügbaren bezahlten Kurs bewertet. Wenn ein und dasselbe Wertpapier auf verschiedenen Märk-ten gehandelt wird, wird der letzte verfügbare bezahlte Kurs auf dem Hauptmarkt für das betreffende Wertpa-pier verwendet.
Securities which are quoted on a stock exchange or which are traded on another regulated market which is recog-nised as being open to the public and whose operating methods are correct are valued at the last available rate paid. Should one and the same security be traded on dif-ferent markets, the last available price paid on the main market will be used for that security.
Nicht notierte Wertpapiere, andere gesetzlich und ver-tragsmäßig zulässige Vermögenswerte und Wertpapiere, welche zwar an einer offiziellen Börse notiert sind oder an einem geregelten Markt gehandelt werden, für wel-che aber der letzte Verkaufspreis nicht repräsentativ ist, werden zum jeweiligen Verkehrswert bewertet, wie ihn die Verwaltungsgesellschaft nach Treu und Glauben und allgemein anerkannten, von unabhängigen Wirtschafts-prüfern nachprüfbaren Bewertungsregeln festlegt.
Securities which are not quoted, other legal and con-tractually permissible assets and securities which are quoted on an official stock exchange or are traded on a regulated market but for which the last sales price is not representative are valued at the market value which the management company determines in all good faith, under rules generally recognised by independent audi-tors in accordance with guidelines on valuation which can be examined.
Der Marktwert entspricht nicht unbedingt dem Wert, der tatsächlich bei einem Verkauf erzielt werden kann; die Verkaufserlöse können über oder unter den erwähnten Marktwerten liegen.
Market values of securities do not necessarily represent the amounts which might be realised upon disposal of the investments; actual amounts realised may be more or less than the market values stated.
Mitteilungen an die Anteilinhaber Notices to shareholders
Der Ausgabe- und Rücknahmepreis pro Anteil eines jeden Portfolios wird täglich in der „Börsen-Zeitung“ veröffentlicht.
The issue and redemption price per unit in any portfolio is published daily in “Börsen-Zeitung.”
Andere Informationen für die Anteilinhaber, soweit dies das Verwaltungsreglement fordert, werden im Mémorial C, Recueil des Sociétés et Associations („Mémorial“) des Großherzogtums Luxembourg veröffentlicht. Sie wer-den auch in einer luxemburgischen Tageszeitung und in anderen von der Verwaltungsgesellschaft ausgewählten Zeitungen veröffentlicht, und zwar in solchen Ländern, in denen Fondsanteile angeboten werden.
Other information for unitholders, which is required by the regulations, is published in the Mémorial C, Recueil des Sociétés et Associations (“Mémorial“) in the Grand Duchy of Luxembourg. It is also published in a Luxem-bourg daily newspaper and in other newspapers selected by the management company in those countries where the units are offered.
ERLÄUTERUNGEN ZUM GEPRÜFTEN JAHRESBERICHT ZUM 31. MÄRZ 2016 • NOTES TO THE AUDITED ANNUAL REPORT AS AT MARCH 31ST, 2016

ERLÄUTERUNGEN ZUM GEPRÜFTEN JAHRESBERICHT ZUM 31. MÄRZ 2016 • NOTES TO THE AUDITED ANNUAL REPORT AS AT MARCH 31ST, 2016
101
Zeichnungen von Anteilen Subscription of units
Anteile eines jeden Portfolios können bei der Verwal-tungsgesellschaft, der Depotbank und über die jeweilige Zahlstelle erworben werden.
Units of each portfolio may be subscribed at the manage-ment company, the custodian bank and the respective paying agents.
Zeichnungen erfolgen aufgrund des gültigen Verkaufs-prospektes, des Verwaltungsreglements und der Wesent-lichen Anlegerinformationen (KIID), denen der letzte Jahresbericht sowie der letzte Halbjahresbericht beigelegt werden müssen, wenn der Stichtag des Jahresberichtes länger als acht Monate zurückliegt. Die Geschäftsberichte sowie der Verkaufsprospekt, das Verwaltungsreglement und das KIID sind kostenlos am Sitz der Verwaltungsge-sellschaft, der Depotbank und über die jeweiligen Zahl-stellen erhältlich.
Subscriptions are only valid if made on the basis of the current prospectus, the management regulations or Key Investor Information Documents (KIID), supplemented by the latest annual report and the latest semi-annual report if the annual report is older than eight months. The financial reports, the prospectus, the management regulations and the KIID may be obtained free of charge from the management company, the custodian bank and the respective paying agents.
Nettoinventarwert und Ausgabepreis Net asset value and issue price
Nettoinventarwerte und Ausgabepreise pro Anteil wer-den in Euro ermittelt und täglich veröffentlicht.
The net asset value and issue price per unit is being deter-mined in Euro and published daily.
Der Nettoinventarwert pro Anteil eines Portfolios errech-net sich aus der Teilung des Teilfondsvermögens durch die Anzahl der umlaufenden Anteile des Teilfonds. Der Ausgabepreis errechnet sich aus dem Nettoinventarwert pro Anteil plus Ausgabeaufschlag.
The net asset value per unit of a portfolio is calculated by dividing the sub-fund assets by the number of units out-standing. The issue price is calculated from the net asset value per share plus issue costs.
TeilfondsSub-funds
KlasseClass
AusgabeaufschlagIssue costs
AuflegungsdatumSubscription date
WährungCurrency
ErstausgabepreisOriginal issue
price
DKB Neue Bundesländer Fonds ANL 0,00% 06.03.2000 EUR 25,00
DKB Europa Fonds AL 5,00% 01.10.2010 EUR 10,00
DKB Europa Fonds InstAL2 2,00% 27.07.2015*) EUR 5.000,00
DKB Europa Fonds TNL 0,00% 21.08.2000 EUR 25,00
DKB Osteuropa Fonds TNL 0,00% 04.05.2001 EUR 25,00
DKB Nordamerika Fonds TNL 0,00% 21.08.2000 EUR 25,00
DKB Asien Fonds TNL 0,00% 04.05.2001 EUR 25,00
DKB Pharma Fonds AL 5,00% 22.11.1999 EUR 25,00
DKB Pharma Fonds TNL 0,00% 29.08.2000 EUR 32,77
DKB TeleTech Fonds AL 5,00% 06.03.2000 EUR 25,00
DKB TeleTech Fonds TNL 0,00% 29.08.2000 EUR 20,17
DKB Zukunftsfonds TNL 0,00% 27.08.2007 EUR 25,00
DKB Ökofonds TNL 0,00% 01.04.2008 EUR 25,00
*) Aktivierungsdatum 5. August 2015. • Activation date August, 5th, 2015.

102
ERLÄUTERUNGEN ZUM GEPRÜFTEN JAHRESBERICHT ZUM 31. MÄRZ 2016 • NOTES TO THE AUDITED ANNUAL REPORT AS AT MARCH 31ST, 2016
Ausschüttungen Dividend payments
Nachstehende Teilfonds zahlten per 18. Mai 2016 für das am 31. März 2016 endende Geschäftsjahr folgende Beträ-ge aus:
The below mentioned sub-funds paid a dividend with value date May 18th, 2016 for the financial year ending March 31st, 2016:
TeilfondsSub-funds
KlasseClass
WährungCurrency
Ausschüttung pro AnteilDividend per unit
DKB Europa Fonds AL EUR 0,4513
DKB Europa Fonds InstAL2 EUR 44,9931
DKB Pharma Fonds AL EUR 0,8189
DKB TeleTech Fonds AL EUR 0,0804
DKB Neue Bundesländer Fonds ANL EUR 0,1562
Hinweis Comment
Die Bekanntmachung der steuerlichen Erträge zum 31. März 2016 gemäß § 5 Abs. 1 InvStG wurde im Inter-net unter www.bayerninvest.lu (DKB – Steuerliche Daten) und im „Bundesanzeiger“ (www.bundesanzeiger.de) veröffentlicht.
The notice of taxable income as at March 31st, 2016 under § 5 section 1 of the German investment tax act (InvStG, Investmentsteuergesetz) has been published on the inter-net site www.bayerninvest.lu (DKB – Steuerliche Daten) and in the German Federal Gazette “Bundesanzeiger” (www.bundesanzeiger.de).
Besteuerung Taxation
Gemäß den in Luxemburg geltenden Bestimmungen haben die Teilfonds eine vierteljährlich zu zahlende „Taxe d’abonnement“ in Höhe von 0,05% p.a. des Teilfondsver-mögens zu entrichten. Für die Klasse InstAL2 beträgt diese Steuer abweichend 0,01% p.a. des Teilfondsvermögens.
Under legislation and regulations currently prevailing in Luxembourg, the sub-funds are subject to a “Taxe d’abonnement” at an annual rate of 0.05% of the sub-fund assets calculated and payable quarterly. For the class InstAL2 this tax rate amounts to 0.01% p.a. of the sub-fund assets.
Quellensteuern der Ursprungsländer auf eingenomme-ne Zinsen und Dividenden der Anlagen werden nicht rückvergütet.
Withholding taxes in the country of origin on interest and dividends collected are not repaid.
Bestandsveränderungen Portfolio changes
Die Aufstellung der Wertpapierbestandsveränderungen in der Zeit vom 1. April 2015 bis zum 31. März 2016 ist kostenlos am Sitz der Verwaltungsgesellschaft, der Depot-bank und über die jeweilige Zahlstelle erhältlich.
The list of the portfolio changes for the period from April 1st, 2015 up to March 31st, 2016 may be obtained free of charge from the respective agents, from the cus-todian bank as well as from the Luxembourg manage-ment company.
Devisenkurse Exchange rates
Vermögenswerte in fremder Währung wurden zu den nachstehenden Devisenkursen zum 30. März 2016 in Euro umgerechnet. Der Teilfonds DKB Asien Fonds wurde mit Devisenkursen zum 31. März 2016 umgerechnet.
Assets in foreign currencies have been translated into Euro at the following exchange rates prevailing at March 30th, 2016. The sub-fund DKB Asien Fonds was converted with exchanges rates as at March 31st, 2016.

ERLÄUTERUNGEN ZUM GEPRÜFTEN JAHRESBERICHT ZUM 31. MÄRZ 2016 • NOTES TO THE AUDITED ANNUAL REPORT AS AT MARCH 31ST, 2016
103
Kanadischer Dollar • Canada Dollar CAD 1 1,468947
Schweizer Franken • Swiss Franc CHF 1 1,090728
Tschechische Krone • Czech Koruna CZK 1 27,084900
Dänische Krone • Danish Crown DKK 1 7,452440
Britisches Pfund • Pound Sterling GBP 1 0,785026
Hongkong Dollar • Hong Kong Dollar HKD 1 8,780750
Ungarischer Forint • Hungarian Forint HUF 1 314,343000
Japanischer Yen • Japanese Yen JPY 1 127,474000
Norwegische Krone • Norwegian Crown NOK 1 9,417160
Polnischer Zloty • Polish zloty PLN 1 4,261560
Schwedische Krone • Swedish Crown SEK 1 9,239480
Türkische Lira • Turkish Lira TRY 1 3,213560
Amerikanischer Dollar • US Dollar USD 1 1,132400
Devisenkurse für den Teilfonds DKB Asien Fonds
Exchange rates for the sub-fund DKB Asien Fonds
Australischer Dollar • Australian Dollar AUD 1 1,483774
Hongkong Dollar • Hong Kong Dollar HKD 1 8,792750
Japanischer Yen • Japanese Yen JPY 1 127,518000
Singapur Dollar • Singapore Dollar SGD 1 1,530540
Hebelwirkung Leverage
Die berechnete durchschnittliche Hebelwirkung betrug während des Berichtszeitraums:
The calculated average leverage during the period under review is:
TeilfondsSub-fund
Durchschnittlicher HebelAverage leverage
(Sum of the Notionals Approach)
DKB Neue Bundesländer Fonds 0,47
DKB Europa Fonds 0,11
DKB Osteuropa Fonds 0,01
DKB Nordamerika Fonds 0,02
DKB Asien Fonds 0,00
DKB Pharma Fonds 0,27
DKB TeleTech Fonds 0,24
DKB Zukunftsfonds 0,01
DKB Ökofonds 0,16
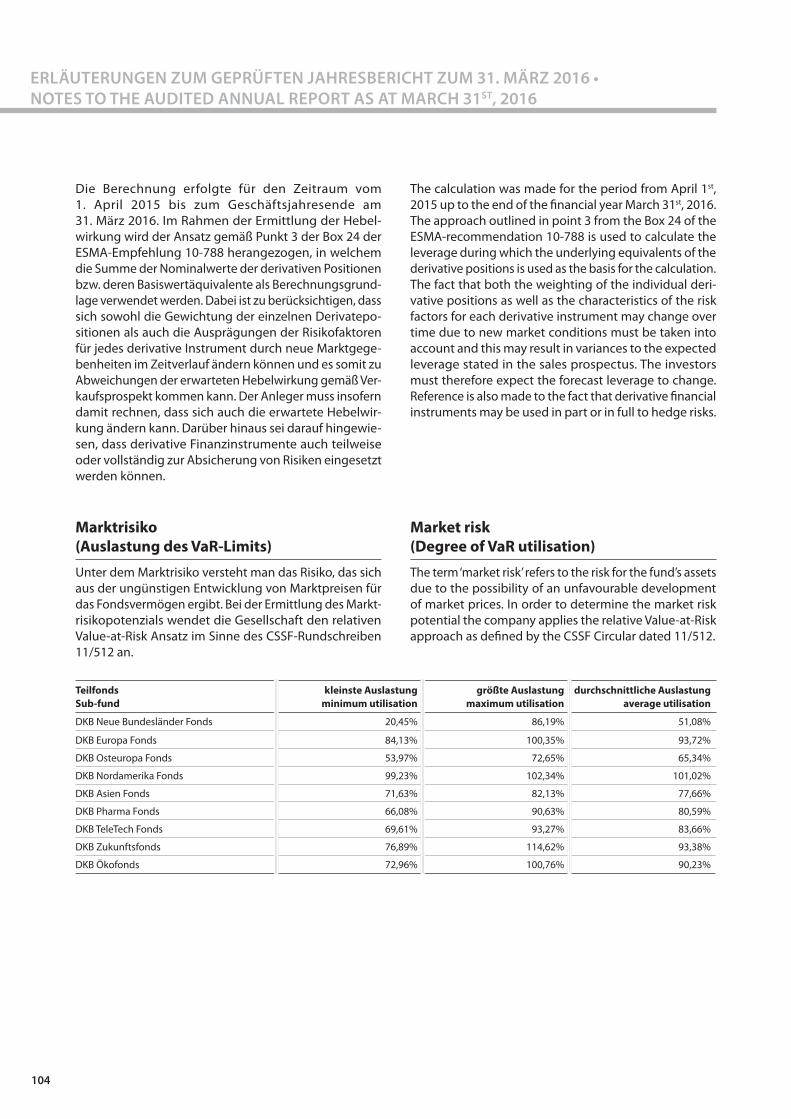
104
ERLÄUTERUNGEN ZUM GEPRÜFTEN JAHRESBERICHT ZUM 31. MÄRZ 2016 • NOTES TO THE AUDITED ANNUAL REPORT AS AT MARCH 31ST, 2016
Die Berechnung erfolgte für den Zeitraum vom 1. April 2015 bis zum Geschäftsjahresende am 31. März 2016. Im Rahmen der Ermittlung der Hebel-wirkung wird der Ansatz gemäß Punkt 3 der Box 24 der ESMA-Empfehlung 10-788 herangezogen, in welchem die Summe der Nominalwerte der derivativen Positionen bzw. deren Basiswertäquivalente als Berechnungsgrund-lage verwendet werden. Dabei ist zu berücksichtigen, dass sich sowohl die Gewichtung der einzelnen Derivatepo-sitionen als auch die Ausprägungen der Risikofaktoren für jedes derivative Instrument durch neue Marktgege-benheiten im Zeitverlauf ändern können und es somit zu Abweichungen der erwarteten Hebelwirkung gemäß Ver-kaufsprospekt kommen kann. Der Anleger muss insofern damit rechnen, dass sich auch die erwartete Hebelwir-kung ändern kann. Darüber hinaus sei darauf hingewie-sen, dass derivative Finanzinstrumente auch teilweise oder vollständig zur Absicherung von Risiken eingesetzt werden können.
The calculation was made for the period from April 1st, 2015 up to the end of the financial year March 31st, 2016. The approach outlined in point 3 from the Box 24 of the ESMA-recommendation 10-788 is used to calculate the leverage during which the underlying equivalents of the derivative positions is used as the basis for the calculation. The fact that both the weighting of the individual deri-vative positions as well as the characteristics of the risk factors for each derivative instrument may change over time due to new market conditions must be taken into account and this may result in variances to the expected leverage stated in the sales prospectus. The investors must therefore expect the forecast leverage to change. Reference is also made to the fact that derivative financial instruments may be used in part or in full to hedge risks.
Marktrisiko (Auslastung des VaR-Limits)
Market risk (Degree of VaR utilisation)
Unter dem Marktrisiko versteht man das Risiko, das sich aus der ungünstigen Entwicklung von Marktpreisen für das Fondsvermögen ergibt. Bei der Ermittlung des Markt-risikopotenzials wendet die Gesellschaft den relativen Value-at-Risk Ansatz im Sinne des CSSF-Rundschreiben 11/512 an.
The term ‘market risk’ refers to the risk for the fund’s assets due to the possibility of an unfavourable development of market prices. In order to determine the market risk potential the company applies the relative Value-at-Risk approach as defined by the CSSF Circular dated 11/512.
TeilfondsSub-fund
kleinste Auslastungminimum utilisation
größte Auslastungmaximum utilisation
durchschnittliche Auslastungaverage utilisation
DKB Neue Bundesländer Fonds 20,45% 86,19% 51,08%
DKB Europa Fonds 84,13% 100,35% 93,72%
DKB Osteuropa Fonds 53,97% 72,65% 65,34%
DKB Nordamerika Fonds 99,23% 102,34% 101,02%
DKB Asien Fonds 71,63% 82,13% 77,66%
DKB Pharma Fonds 66,08% 90,63% 80,59%
DKB TeleTech Fonds 69,61% 93,27% 83,66%
DKB Zukunftsfonds 76,89% 114,62% 93,38%
DKB Ökofonds 72,96% 100,76% 90,23%

ERLÄUTERUNGEN ZUM GEPRÜFTEN JAHRESBERICHT ZUM 31. MÄRZ 2016 • NOTES TO THE AUDITED ANNUAL REPORT AS AT MARCH 31ST, 2016
105
Zusammensetzung des Referenzportfolios • Composition of referending portfolios
Teilfonds • Sub-fund Referenzportfolio • Reference portfolio
DKB Asien Fonds 100% Nikkei 225 Index
DKB Europa Fonds 100% Stoxx Europe 50
DKB Neue Bundesländer Fonds 45% DAX + 55% iBoxx EUR Sovereigns
DKB Nordamerika Fonds 100% S&P 500 Index
DKB Ökofonds 100% Stoxx Global 1800
DKB Osteuropa Fonds 100% Stoxx Eastern Europe 50
DKB Pharma Fonds 50% Stoxx Global Pharma + 50% S&P 500
DKB TeleTech Fonds 100% Stoxx Global Technologie
DKB Zukunftsfonds 100% Stoxx Europe 600
Die Risikokennzahlen wurden für den Zeitraum vom 1. April 2015 bis zum 31. März 2016 auf Basis des Verfah-rens der parametrischen Simulation mit den Parametern 99% Konfidenzniveau, 20 Tage Haltedauer unter Verwen-dung eines effektiven, historischen Beobachtungszeitrau-mes von einem Jahr berechnet.
The risk indicators were calculated for the period from April 1st, 2015 to the end of the financial year at March 31st, 2016 under review on the basis of the parametrical simulation method with the parameters of 99% confi-dence level and 20 day holding period, using an effecti-ve, historical observation period of one year.
Als Bewertungsmaßstab wird das Risiko eines derivate-freien Vergleichsvermögens herangezogen. Die Auslas-tung darf 200% nicht überschreiten.
The risk of a derivative-free benchmark asset is used as a reference for the valuation. The use to capacity may not cross 200%.
Transaktionskosten Transaction fees
Die Transaktionskosten berücksichtigen sämtliche Kosten, die im Geschäftsjahr separat ausgewiesen bzw. abgerech-net wurden und in direktem Zusammenhang mit einem Kauf oder Verkauf von Vermögensgegenständen stehen.
The transaction costs include all costs that were listed or invoiced separately in the financial year and directly rela-ted to the purchase or sale of assets.
Die Berechnung erfolgte für den Zeitraum vom 1. April 2015 bis zum Geschäftsjahresende am 31. März 2016. Für das Geschäftsjahr betrugen die Trans-aktionskosten wie folgt:
The calculation was made for the period from April 01st, 2015 to the end of the financial year at March 31st, 2016. For the financial year the transaction costs amounted as follows:

106
ERLÄUTERUNGEN ZUM GEPRÜFTEN JAHRESBERICHT ZUM 31. MÄRZ 2016 • NOTES TO THE AUDITED ANNUAL REPORT AS AT MARCH 31ST, 2016
TeilfondsSub-fund
Transaktionskosten gesamtTotal transaction fees
DKB Neue Bundesländer Fonds 41.420,90 EUR
DKB Europa Fonds 104.811,15 EUR
DKB Osteuropa Fonds 57.186,27 EUR
DKB Nordamerika Fonds 8.859,27 EUR
DKB Asien Fonds 48.900,62 EUR
DKB Pharma Fonds 72.885,81 EUR
DKB TeleTech Fonds 32.038,07 EUR
DKB Zukunftsfonds 69.225,18 EUR
DKB Ökofonds 18.539,07 EUR
Gesamtkostenquote (TER) Total Expense Ratio (TER)
TeilfondsSub-fund
KlasseClass
TER in %01.04.2015-31.03.2016
DKB Neue Bundesländer Fonds ANL 2,06
DKB Europa Fonds AL 1,62
DKB Europa Fonds InstAL2¹) 1,00
DKB Europa Fonds TNL 2,26
DKB Osteuropa Fonds TNL 2,72
DKB Nordamerika Fonds TNL 0,97
DKB Asien Fonds TNL 2,48
DKB Pharma Fonds AL 1,70
DKB Pharma Fonds TNL 2,33
DKB TeleTech Fonds AL 1,75
DKB TeleTech Fonds TNL 2,39
DKB Zukunftsfonds TNL 2,41
DKB Ökofonds TNL 2,56
¹) Für Anteilklassen mit verkürztem Geschäftsjahr han-delt es sich bei Angabe der TER um einen annualisier-ten Wert.
¹) For unit classes a with a short fiscal year, the TER is based on annualized figures.

ERLÄUTERUNGEN ZUM GEPRÜFTEN JAHRESBERICHT ZUM 31. MÄRZ 2016 • NOTES TO THE AUDITED ANNUAL REPORT AS AT MARCH 31ST, 2016
107
Gesamtkostenquote (TER) Total Expense Ratio (TER)Für die Berechnung der Total Expense Ratio (TER) wurde die folgende Berechnungsmethode, die dem BVI-Stan-dard entspricht, angewandt:
To calculate the Total Expense Ratio (TER), the following method, corresponding to the German Investment Fund Association (BVI) standard, was used:
TER =GKn
• 100FV
TER =GKn
• 100FV
TER: Gesamtkostenquote in Prozent
GKn: Tatsächlich belastete Kosten (nominal, sämtliche Kos-ten ohne Transaktionskosten) in Teilfondswährung
FV: Durchschnittliches Teilfondsvolumen im Berichts-zeitraum in Fondswährung
TER: Total ratio of costs in percentage
GKn: Actual costs incurred (nominal amount of all costs excluding transaction costs) in sub-fund currency
FV: Average fund volume during the financial year in sub-fund currency
Die TER gibt an, wie stark das Teilfondsvermögen mit Kosten belastet wurde. Berücksichtigt werden neben der Verwaltungs- und Depotbankvergütung sowie der Taxe d’abonnement alle übrigen Kosten mit Ausnahme der im Teilfonds angefallenen Transaktionskosten. Sie weist den Gesamtbetrag dieser Kosten als Prozentsatz des durchschnittlichen Teilfondsvolumens innerhalb eines Geschäftsjahres aus. Etwaige performanceabhängige Ver-gütungen werden in direktem Zusammenhang mit der TER gesondert ausgewiesen.
The TER indicates the degree to which costs were char-ged to the sub-fund’s assets. In addition to administrative costs, custody charges and the ‘taxe d’abonnement’, the TER also takes into account all other costs except for any costs incurred due to transactions in the sub-fund. The TER shows the total amount of these costs as a percenta-ge of the average sub-fund volume within one financial year. Any performance-related fees are shown separately in direct relation to the TER.

108
BERICHT DES RÉVISEUR D’ENTREPRISES AGRÉÉ • REPORT OF THE RÉVISEUR D’ENTREPRISES AGRÉÉ
An die Anteilinhaber des DKB und seiner Teilfonds
6B, rue Gabriel Lippmann
L-5365 Munsbach
To the unitholders of DKB and its sub-funds
6B, rue Gabriel Lippmann
L-5365 Munsbach
Wir haben den beigefügten Jahresabschluss des DKB und seiner jeweiligen Teilfonds geprüft, der aus der Auf-stellung des Vermögens, des Wertpapierbestands und der sonstigen Vermögenswerte zum 31. März 2016, der Ertrags- und Aufwandsrechnung und der Entwicklung des Vermögens für das an diesem Datum endende Geschäfts-jahr sowie aus einer Zusammenfassung bedeutsamer Rechnungslegungsmethoden und anderen erläuternden Informationen besteht.
We have audited the accompanying financial statements of DKB and each of its sub-funds, which comprise the statement of net assets and the statement of invest-ments and other net assets as at March 31st, 2016 and the statement of operations and the statement of chan-ges in net assets for the year then ended, and a summary of significant accounting policies and other explanatory information.
Verantwortung des Verwaltungs-rats der Verwaltungsgesell-schaft für den Jahresabschluss
Board of Directors of the Man-agement Company responsibil-ity for the financial statements
Der Verwaltungsrat der Verwaltungsgesellschaft ist ver-antwortlich für die Aufstellung und sachgerechte Gesamt-darstellung des Jahresabschlusses in Übereinstimmung mit den in Luxemburg geltenden gesetzlichen Bestim-mungen und Verordnungen zur Aufstellung des Jahres-abschlusses und für die internen Kontrollen, die er als notwendig erachtet, um die Aufstellung des Jahresab-schlusses zu ermöglichen, der frei von wesentlichen unzu-treffenden Angaben ist, unabhängig davon, ob diese aus Unrichtigkeiten oder Verstössen resultieren.
The Board of Directors of the Management Company is responsible for the preparation and fair presentation of these financial statements in accordance with Luxem-bourg legal and regulatory requirements relating to the preparation of the financial statements, and for such inter-nal control as the Board of Directors of the Management Company determines is necessary to enable the prepa-ration of financial statements that are free from material misstatement, whether due to fraud or error.
Verantwortung des Réviseur d’Entreprises agréé
Responsibility of the Réviseur d’Entreprises agréé
In unserer Verantwortung liegt es, auf der Grundlage unse-rer Abschlussprüfung über diesen Jahresabschluss ein Prüfungsurteil zu erteilen. Wir führten unsere Abschluss-prüfung nach den für Luxemburg von der Commission de Surveillance du Secteur Financier angenommenen inter-nationalen Prüfungsstandards (International Standards on Auditing) durch. Diese Standards verlangen, dass wir die beruflichen Verhaltensanforderungen einhalten und die Prüfung dahingehend planen und durchführen, dass mit hinreichender Sicherheit erkannt werden kann, ob der Jahresabschluss frei von wesentlichen unzutreffen-den Angaben ist.
Our responsibility is to express an opinion on these finan-cial statements based on our audit. We conducted our audit in accordance with International Standards on Audi-ting as adopted for Luxembourg by the Commission de Surveillance du Secteur Financier. Those standards require that we comply with ethical requirements and plan and perform the audit to obtain reasonable assurance about whether the financial statements are free from material misstatement.

109
BERICHT DES RÉVISEUR D’ENTREPRISES AGRÉÉ • REPORT OF THE RÉVISEUR D’ENTREPRISES AGRÉÉ
Eine Abschlussprüfung beinhaltet die Durchführung von Prüfungshandlungen zum Erhalt von Prüfungsnachwei-sen für die im Jahresabschluss enthaltenen Wertansätze und Informationen. Die Auswahl der Prüfungshandlun-gen obliegt der Beurteilung des Réviseur d’Entreprises agréé ebenso wie die Bewertung des Risikos, dass der Jahresabschluss wesentliche unzutreffende Angaben aufgrund von Unrichtigkeiten oder Ver-stössen enthält. Im Rahmen dieser Risikoeinschätzung berücksichtigt der Réviseur d’Entreprises agréé das für die Aufstellung und sachgerechte Gesamtdarstellung des Jahresabschlusses eingerichtete interne Kontrollsystem, um die unter diesen Umständen angemessenen Prüfungshandlungen festzu-legen, nicht jedoch, um eine Beurteilung der Wirksamkeit des internen Kontrollsystems abzugeben.
An audit involves performing procedures to obtain audit evidence about the amounts and disclosures in the finan-cial statements. The procedures selected depend on the judgement of the Réviseur d’Entreprises agréé, inclu-ding the assessment of the risks of material misstate-ment of the financial statements, whether due to fraud or error. In making those risk assessments, the Réviseur d’Entreprises agréé considers internal control relevant to the entity’s preparation and fair presentation of the financial statements in order to design audit procedures that are appropriate in the circumstances, but not for the purpose of expressing an opinion on the effectiveness of the entity’s internal control.
Eine Abschlussprüfung umfasst auch die Beurteilung der Angemessenheit der angewandten Rechnungsle-gungsgrundsätze und -methoden und der Vertretbar-keit der vom Verwaltungsrat der Verwaltungsgesellschaft ermittelten geschätzten Werte in der Rechnungsle-gung sowie die Beurteilung der Gesamtdarstellung des Jahresabschlusses.
An audit also includes evaluating the appropriateness of accounting policies used and the reasonableness of accounting estimates made by the Board of Directors of the Management Company, as well as evaluating the overall presentation of the financial statements.
Wir sind der Auffassung, dass die von uns erlangten Prü-fungsnachweise ausreichend und geeignet sind, um als Grundlage für unser Prüfungsurteil zu dienen.
We believe that the audit evidence we have obtained is sufficient and appropriate to provide a basis for our audit opinion.
Wir sind der Auffassung, dass die von uns erlangten Prü-fungsnachweise ausreichend und geeignet sind, um als Grundlage für unser Prüfungsurteil zu dienen.
We believe that the audit evidence we have obtained is sufficient and appropriate to provide a basis for our audit opinion.
Prüfungsurteil Opinion
Nach unserer Beurteilung vermittelt der Jahresabschluss in Übereinstimmung mit den in Luxemburg geltenden gesetzlichen Bestimmungen und Verordnungen betref-fend die Aufstellung des Jahresabschlusses ein den tatsächlichen Verhältnissen entsprechendes Bild der Ver-mögens- und Finanzlage des DKB und seiner Teilfonds zum 31. März 2016 sowie der Ertragslage und der Entwick-lung des Vermögens für das an diesem Datum endende Geschäftsjahr.
In our opinion, the financial statements give a true and fair view of the financial position of DKB and each of its sub-funds as of March 31st, 2016, and of the results of their operations and changes in their net assets for the year then ended in accordance with Luxembourg legal and regulatory requirements relating to the preparation of the financial statements.
BERfCHT DES RtVISEUR D'ENTREPRtSES AGREE· REPORT OF THE REV!SEUR D'ENTREPRISES ,!\GREE
110
Sonstiges
Die im Jahresbericht enthaltenen erganzenden Angaben wurden von uns im Rahmen unseres Auftrages durchgesehen, waren aber nicht Gegenstand besonderer Prufungshandlungen nach den oben beschriebenen Standards. Unser Prufungsurteil bezieht sich daher nicht auf diese Angaben. Im Rahmen der Gesamtdarstellung des Jahresabschlusses haben uns diese Angaben keinen Anlass zu Anmerkungen gegeben.
Die deutsche Fassung ist rechtlich bindend.
Luxemburg, den 28. Juli 2016
KPMG Luxembourg Societe cooperative Cabinet de revision agree
J. Roth
Other matter
Supplementary information included in the annual report has been reviewed in the context of our mandate but has not been subject to specific audit procedures carried out in accordance with the standards described above. Consequently, we express no opinion on such informat ion. However, we have no observation to make concerning such information in the context of t he financial statements taken as a whole.
The German version is legally binding.
Luxembourg, July 28th, 2016
KPMG Luxembourg Societe cooperative Cabinet de revision agree
J. Roth

VerwaltungsgesellschaftManagement Company
BayernInvest Luxembourg S.A.6B, rue Gabriel Lippmann
L -5365 MunsbachTel +352 28 26 24 0
Fax +352 28 26 24 [email protected]
www.bayerninvest.lu
Impressum:Inhalt: BayernInvest Luxembourg S.A.
Grafische Gestaltung und Druck: Imprimerie Centrale S.A.

BayernInvest Luxembourg S.A.6B, rue Gabriel LippmannL -5365 Munsbach
Tel +352 28 26 24 0Fax +352 28 26 24 [email protected]
www.bayerninvest.lu