gfk nop social research - westminster city council
TRANSCRIPT
GfK NOP Social Research
Westminster Noise Attitudes Survey 2008
A report for:
Prepared by: Your contacts:
GfK NOP Social Research Tim Buchanan
Phone: +44 (0)20 7890 9786 Email: [email protected]
GfK. Growth from Knowledge
GfK NOP Social Research
Contents
1 Executive Summary...............................................................................1
2 Technical Details ...................................................................................4
2.1 Data collection method .................................................................... 4
2.2 Data accuracy ................................................................................. 4
2.3 Comparisons with previous surveys................................................... 5
3 Environmental problems in the area .....................................................7
3.1 Environmental problems that affect residents .................................... 7
3.2 Which environmental problems most affect residents?...................... 11
4 Residents’ attitudes to their area and home.......................................13
4.1 Attitudes to living in the area.......................................................... 13
4.2 What do residents like about living in the area? ............................... 15
4.3 What do residents dislike about living in the area? ........................... 15
4.4 Noise in the area........................................................................... 17
4.5 The effect on residents of noise in the area ..................................... 19
4.6 What do residents like about living in their home?............................ 21
4.7 What do residents dislike about living in their home?........................ 21
5 The effect of noise in people’s homes .................................................23
5.1 Which sources of noise most bother residents in Westminster? ......... 29
5.2 What is it about the different noise sources that particularly bothers residents?
................................................................................................... 31
5.3 Nature of the noise problem from sources that involve people coming and
going ........................................................................................... 32
5.4 Does noise interfere with residents’ home lives?............................... 33
GfK NOP Social Research
5.5 Times when noise is a problem during the week .............................. 37
5.6 Times when noise is a problem during the weekend......................... 41
5.7 What effect does residents’ most annoying noise have on their home life? 44
5.8 What effect does noise in general have on home lives? .................... 48
5.9 What effect does noise have on bed times? ..................................... 49
5.10 Is noise becoming more of a problem for residents in Westminster? .. 54
5.11 Do vibrations from noise sources bother residents? .......................... 56
5.12 What measures have residents taken to reduce the amount of noise? 58
5.13 How effective were the measures taken to reduce noise? ................. 61
5.14 Formal complaints about noise ....................................................... 62
6 Conclusions .........................................................................................68
Appendix A - Profile of Sample
Appendix B – Social Grade Definitions
Appendix C - Questionnaire
GfK NOP Social Research
1 Executive Summary
As part of Westminster City Council’s development of a noise strategy, GfK NOP Social
Research was commissioned to undertake a survey of residents of the City to gain an
understanding of how bothered residents are by noise and by what particular noises.
The research involved a telephone survey of a representative sample of 2009 people across
Westminster. The survey explored various aspects of residents’ experiences of noise both in
their local area and specifically in their home. The key findings of the research follow.
� When asked about environmental problems that affect residents, 19% of residents
mentioned ‘noisy neighbours or loud parties’ and 14% mentioned ‘noise from pubs,
clubs and restaurants’ – in total, 29% of residents said that they were affected by at
least one of these noise sources
� More than three quarters (78%) of Westminster residents indicated that they like the
area they live in by giving a score between 1 and 3 out of 7 (where 1 meant
‘definitely like’ and 7 meant ‘definitely don’t like’).
� When asked to rate how noisy it is in their area, the sample was divided. Just over
half (53%) indicated that it was quiet while 47% indicated that it was noisy. A small
proportion of residents fell at either end of the scale; 13% felt it was ‘very quiet’ and
6% felt it was ‘very noisy’.
� Residents who felt that it was noisy in their local area were asked to what extent they
were bothered by this noise; 62% of this group were bothered by the noise (this
equates to 29% of the total sample), with 10% saying they were ‘extremely
bothered’.
� A series of questions were asked in order to determine the different noises that affect
people and to ascertain which noise was the most bothersome. The most frequently
mentioned sources of noise that had bothered people at home in the last 12 months
were road traffic noise (37%), noise from building and construction work(36%), road
works (30%), neighbour’s activities either inside or outside their home (25%) and
aircraft noise including helicopters (21%).

GfK NOP Social Research
� When respondents were asked to specify which noise bothered them the most road
traffic noise was considered the most bothersome noise by 22%. One in five (19%)
felt that building and construction was the most bothersome, 14% felt it was
neighbours’ activities, 11% felt it was road works and 8% felt it was aircraft.
� Residents who said that their most bothersome noise was one that involves people
coming or going were asked whether the problem was from the noise source itself or
because of people coming and going. The majority (59%) said it was the noise
source itself, 30% said the problem was mainly from people coming and going and
10% said the problem was caused by both
� Two thirds (67%) of residents who had been bothered by a noise at home in the last
12 months felt that the noise interfered with having the windows and doors open.
Fifty eight per cent felt it interfered with sleeping, 56% felt it interfered with resting
and 53% felt it interfered with concentrating.
� Residents who said that a noise had bothered them while at home in the last 12
months were asked at which times during the week it had bothered them. Half
(50%) were affected by the most bothersome noise source during the day between
7am and 7pm, 40% had been bothered by it during the evening (7pm to 11pm) and
37% had been bothered during the night (11pm to 7am).
� Residents were also asked whether the noise had bothered them during the
weekend; 43% said their most bothersome noise had bothered them during the
day, while 35% said it had bothered them in the evening and at night.
� Around half (47%) of those who had been bothered by a noise while at home in the
last 12 months felt that it spoiled their home life – 8% felt that it ‘very seriously’
spoiled their home life.
� Slightly fewer than one in five said that their worst noise source had an effect on
what time they go to bed. One in eight said that if it were not for the noise keeping
them awake, they would go to bed earlier and six per cent said they would go to bed
later.
� Thinking about their worst noise source over the past five years, residents were more
likely to say it had got worse than better during that time.

GfK NOP Social Research
� Forty three per cent of those bothered by noise in the last 12 months had taken
action to reduce the amount of noise they heard in their home; 20% had talked to
the person/people/organisation making the noise, slightly fewer (18%) had done
something to help them sleep, 16% had installed double-glazing and a much smaller
proportion of four per cent had taken legal advice or action. Three quarters felt that
the actions they had taken to reduce noise had been effective
� Twenty one per cent of those bothered by noise in the last 12 months had made a
complaint about it; amongst this group Westminster Council’s 24 Hour Noise Team
was most frequently cited (13%, or 10% of the total sample had complained to the
Noise Team).
� Those that had complained to the Noise Team were split over its effectiveness; 49%
felt it had been effective (31% said ‘somewhat’ effective and 18% said ‘very’) and
50% felt it had not been effective.
� More than four in five (84%) felt that all the types of noise heard at home spoiled
their home life to some extent - for one in five (20%) it was spoilt either a lot or
totally.
GfK NOP Social Research
2 Technical Details
2.1 Data collection method
GfK NOP Social Research carried out a quota telephone survey of 2009 Westminster residents
between 21 April and 11 May 2008 on behalf of Westminster City Council. The questionnaire,
20 minutes in length (a copy can be found in the appendix), explored attitudes towards noise
in the borough and the extent to which noise causes problems for residents. This
questionnaire was piloted with 18 respondents from 14 April. Slight amendments were made
as piloting progressed but they were small enough to include pilot interviews in the main
stage survey. For the mainstage quotas were set for ward and within ward by age, gender,
working status and ethnicity. All interviewing was carried out by GfK NOP’s Telephone
Interviewing Service (TIS). The data used in this report are weighted to ensure the 2009
interviews are representative of Westminster as a whole1. A full sample breakdown can be
found in the appendices.
2.2 Data accuracy
In total, 2009 Westminster residents were interviewed as part of this research. As this is a
sample, rather than a census, of residents the data is subject to confidence intervals. The
following table shows the confidence interval for the total sample size and for sub-groups
within the data. Note that, strictly speaking, analysis of sampling error in this way should
only be applied to true random probability surveys. However it is generally accepted that it
can be applied to other types of sampling as a rough guide to the reliability of the data,
rather than being interpreted literally.
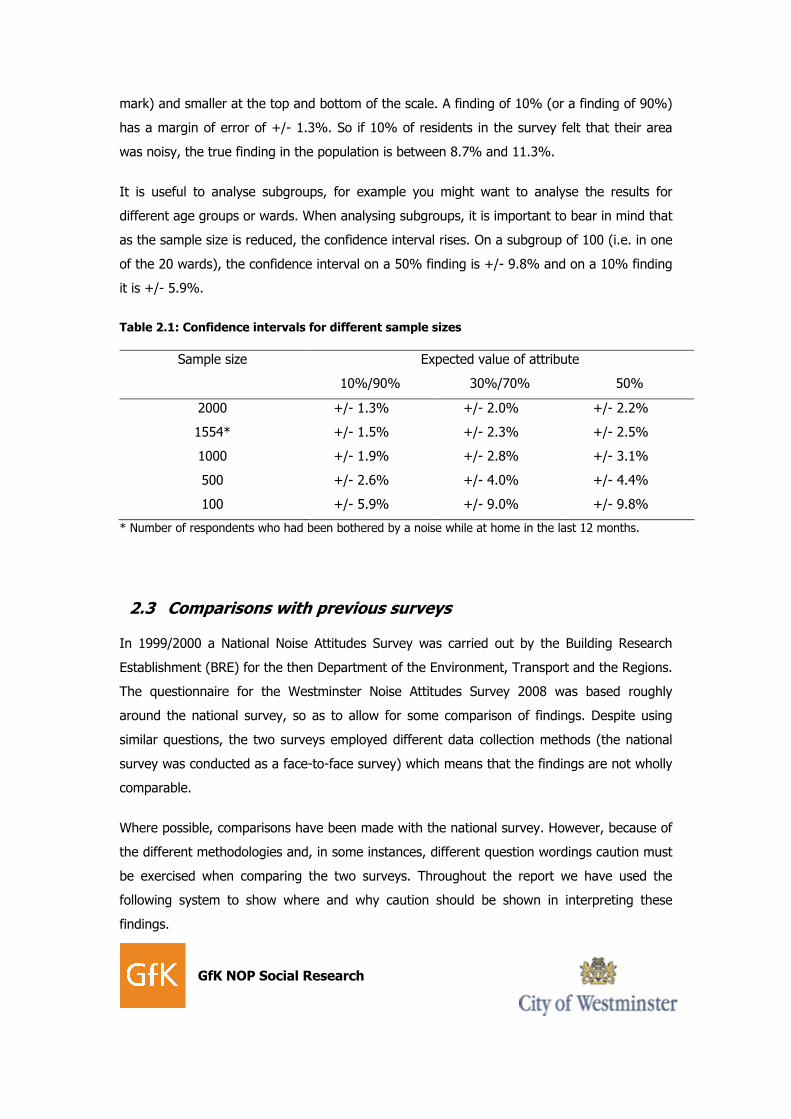
The table shows that for an overall sample of 2009 respondents the maximum confidence
interval we would expect is up to +/- 2.2% at the 95% level. This means that if the survey
found that 50% of residents held a certain view, we could be 95% sure that the true
proportion of residents who hold that view is between 47.8% and 52.2%. As the table shows,
confidence intervals are larger in the middle of the scale (i.e. for results around the 50%
1 Quotas for age were based upon the Office of National Statistics’ (ONS) Mid Year 2005 population estimates. Quotas for ethnicity and working status were based upon Census 2001 data with numbers scaled to the 2005 population.
GfK NOP Social Research
mark) and smaller at the top and bottom of the scale. A finding of 10% (or a finding of 90%)
has a margin of error of +/- 1.3%. So if 10% of residents in the survey felt that their area
was noisy, the true finding in the population is between 8.7% and 11.3%.
It is useful to analyse subgroups, for example you might want to analyse the results for
different age groups or wards. When analysing subgroups, it is important to bear in mind that
as the sample size is reduced, the confidence interval rises. On a subgroup of 100 (i.e. in one
of the 20 wards), the confidence interval on a 50% finding is +/- 9.8% and on a 10% finding
it is +/- 5.9%.
Table 2.1: Confidence intervals for different sample sizes
Sample size Expected value of attribute
10%/90% 30%/70% 50%
2000 +/- 1.3% +/- 2.0% +/- 2.2%
1554* +/- 1.5% +/- 2.3% +/- 2.5%
1000 +/- 1.9% +/- 2.8% +/- 3.1%
500 +/- 2.6% +/- 4.0% +/- 4.4%
100 +/- 5.9% +/- 9.0% +/- 9.8%
* Number of respondents who had been bothered by a noise while at home in the last 12 months.
2.3 Comparisons with previous surveys
In 1999/2000 a National Noise Attitudes Survey was carried out by the Building Research
Establishment (BRE) for the then Department of the Environment, Transport and the Regions.
The questionnaire for the Westminster Noise Attitudes Survey 2008 was based roughly
around the national survey, so as to allow for some comparison of findings. Despite using
similar questions, the two surveys employed different data collection methods (the national
survey was conducted as a face-to-face survey) which means that the findings are not wholly
comparable.
Where possible, comparisons have been made with the national survey. However, because of
the different methodologies and, in some instances, different question wordings caution must
be exercised when comparing the two surveys. Throughout the report we have used the
following system to show where and why caution should be shown in interpreting these
findings.
GfK NOP Social Research
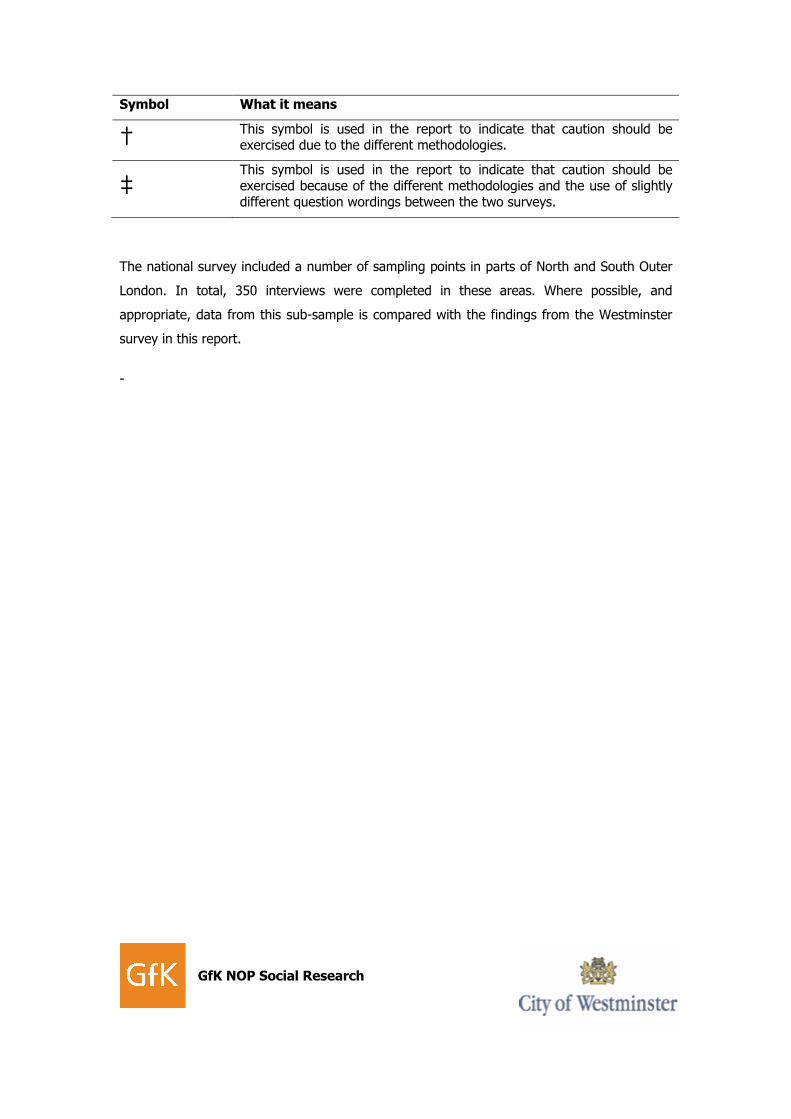
Symbol What it means
† This symbol is used in the report to indicate that caution should be exercised due to the different methodologies.
‡ This symbol is used in the report to indicate that caution should be exercised because of the different methodologies and the use of slightly different question wordings between the two surveys.
The national survey included a number of sampling points in parts of North and South Outer
London. In total, 350 interviews were completed in these areas. Where possible, and
appropriate, data from this sub-sample is compared with the findings from the Westminster
survey in this report.
-
GfK NOP Social Research
3 Environmental problems in the area
3.1 Environmental problems that affect residents
Residents were asked whether they are personally affected by a number of different
environmental problems in the area. For each of the different problems the majority of
residents said they were not personally affected.
Around a third of Westminster residents said that they were personally affected by poor air
quality (35%) and rubbish and litter lying around (33%). A similar proportion (31%)
mentioned dog fouling, while one in four (27%) said that they are affected by rats, mice and
pests. Fewer than one in five cited noisy neighbours or loud parties (19%), not enough
green or open spaces (18%), vandalism, graffiti and other deliberate damage (17%), noise
from pubs, clubs and restaurants (14%) and a lack of street lighting (12%). Just three per
cent of residents said that abandoned or burnt out cars are a problem.
Clearly, two of these environmental problems relate to noise in Westminster and by
combining the responses for those who were affected by noisy neighbours or loud parties and
noise from pubs, clubs and restaurants, in total, 29% of residents felt that they were affected
by at least one of these noise problems.

GfK NOP Social Research
Chart 3.1: I am going to read out a list of environmental problems. As I read them out please tell me whether you are personally affected by each.
3%
12%
14%
17%
18%
19%
27%
29%
31%
33%
35%
97%
88%
86%
83%
81%
80%
73%
71%
69%
67%
63%
Abandoned or burnt out cars
Lack of street lighting
Noise from pubs, clubs and restaurants
Vandalism, graffiti and other deliberate
damage
Not enough green or open spaces
Noisy neighbours or loud parties
Rats, mice and pests
Noise *
Dog fouling
Rubbish and litter lying around
Poor air quality
Yes No
Base: All respondents (2009)
* The ‘Noise’ category combines all who mentioned at least one of either ‘noisy neighbours or loud parties’ or ‘noise from pubs, clubs or restaurants’
‘Don’t know’ responses are not shown on this chart.

GfK NOP Social Research
Given the scope of this research, it is important to look at who these noise problems affected
and where they occurred more frequently.
Young people aged 16-34 were significantly more likely than those aged 55+ to say they
were affected by noisy neighbours or loud parties (21% compared with 16%). Perhaps not
surprisingly, people who said that they are sensitive to noise were more likely than those who
are not sensitive to say that they were affected by noisy neighbours and parties (22%
compared with 16%). As the table on the following page shows, there were also clear
differences by area with the residents of Harrow Road being most likely to say they were
affected by noisy neighbours or loud parties (35% compared with 19% overall).
Black and Minority Ethnic (BME) residents were more likely than white residents to mention
noise from pubs, clubs and restaurants (17% compared with 13%). Those who felt that the
area they live in was noisy were more likely than those who felt that they lived in quieter
areas to mention this environmental problem (22% compared with just 7%). Analysis of the
data by ward indicates that there are two particular wards in which noise from pubs, clubs
and restaurants was a problem; St. James’s and the West End (43% and 40% respectively).
By combining both of these noise sources together as ‘noise’ in general we can see that a
third (34%) of young people aged 16 – 34 felt that they were personally affected by noise,
this was significantly higher than amongst those aged 55+ (25%). Two in five (42%) of those
who considered their area to be noisy were personally affected by noise, while just 18% of
those who did not consider their area to be noisy said the same. Similarly, those who
considered themselves sensitive to noise were more likely than those who were not as
sensitive to say that they were affected by noise (31% compared with 26%).
Analysis of the ward data indicates that around half of those living in the West End and St
James’s were affected by noise (52% and 48% respectively), while just 16% of Abbey Road
residents said the same.

GfK NOP Social Research
Table 3.1: Proportion affected by noisy neighbours or loud parties and noise from pubs, clubs and restaurants (by Ward)
Base: All respondents (unweighted)
Affected by noisy
neighbours or
loud parties
Affected by
noise from pubs, clubs
and restaurants
Affected by noise *
Total % 2009 19 14 29
Ward
Abbey Road % 102 10 6 16
Bayswater % 101 27 11 33
Bryanston & Dorset Square
% 101 20 15 30
Church Street % 73 15 10 24
Churchill % 99 17 16 28
Harrow Road % 101 35 9 40
Hyde Park % 103 16 9 24
Knightsbridge & Belgravia
% 75 8 18 25
Lancaster Gate % 105 27 15 32
Little Venice % 135 26 12 31
Maida Vale % 100 19 5 20
Marylebone High Street
% 101 13 22 30
Queen’s Park % 102 26 2 28
Regent’s Park % 97 18 7 23
St James’s % 99 14 43 48
Tachbrook % 101 14 6 20
Vincent Square % 100 16 9 22
Warwick % 101 25 3 27
West End % 106 25 40 52
Westbourne % 107 21 13 29
* The ‘Noise’ category combines all who mentioned at least one of either ‘noisy neighbours or loud
parties’ or ‘noise from pubs, clubs or restaurants’
Respondents in the national survey were also asked about environmental problems. As well
as using different wordings for the environmental problems, respondents were also restricted
to specifying a maximum of five environmental problems that they were personally affected
by.‡ Despite this, there are some notable comparisons between the two surveys.
GfK NOP Social Research
In both surveys two of the most frequently cited environmental problems were ‘rubbish and
litter lying around’ (‘Litter & rubbish’ in the national survey) and ‘Dog fouling’ (‘Fouling by
dogs’ in the national survey). However, both of these were more problematic in the national
survey than the survey of Westminster residents (48% compared with 33% and 50%
compared with 31%).
The national survey also found that 18% of respondents were personally affected by ‘noise’.
As this section has already shown, the two different noise categories in the Westminster
survey can be combined to give us the proportion of residents who felt that noise affected
them. The combined figure for ‘noise’ in the Westminster survey indicates that this is one
environmental problem that affects people in Westminster more than in other areas (29%
compared with 18%).
Analysis of the Outer London sub-group within the national survey indicates that noise is
more of a problem in Westminster than in the Outer London boroughs that were sampled
(29% compared with 21%).
3.2 Which environmental problems most affect residents?
The initial question enabled residents to mention all of the environmental problems that
affected them. In order to get an idea of which problems are worst those residents who said
they were affected by four or more environmental problems were asked which three they
were most affected by. These responses were combined with those from residents who
mentioned three problems or fewer at the previous question.
‘Poor air quality’ affected the highest proportion of residents personally (29%), this was
followed by ‘rubbish and littler lying around’ (mentioned by 27%), ‘dog fouling’ (25%) and
‘rats, mice and pests’ (22%).
As has already been mentioned, two of the environmental problems relate directly to noise.
Responses to this question show that 17% of Westminster residents considered ‘noisy
neighbours or loud parties’ to be amongst the three problems that affect them most, while
11% felt this way about ‘noise from pubs, clubs and restaurants’. Overall, 26% mentioned
one of these noise sources amongst the three environmental problems that affect them.

GfK NOP Social Research
As the chart below shows, other environmental problems – ‘not enough green spaces’,
‘vandalism, graffiti and other deliberate damage’, ‘lack of street lighting’ and ‘abandoned or
burnt out cars’ – affect residents to a lesser extent.
Chart 3.2: Which environmental problems would you say you are personally
most affected by?
29%
27%
26%
25%
22%
17%
13%
12%
11%
9%
2%
20%
Poor air quality
Rubbish and litter lying around
Noise *
Dog fouling
Rats, mice and pests
Noisy neighbours or loud parties
Not enough green or open spaces
Vandalism, graffiti and deliberate damage
Noise from pubs, clubs and restaurants
Lack of street lighting
Abandoned or burnt our cars
None
Base: All (2009)
* The ‘Noise’ category combines all who mentioned at least one of either ‘noisy neighbours or loud parties’ or ‘noise from pubs, clubs or restaurants’ amongst the three noises they were most affected by personally.

GfK NOP Social Research
4 Residents’ attitudes to their area and home
4.1 Attitudes to living in the area
Residents were asked to rate the area they live in on a scale of 1 to 7, where 1 was ‘definitely
like’ and 7 was ‘definitely don’t like’.
Just under four in five Westminster residents (78%) indicated that they feel positive about
their area by awarding a score between 1 and 3 on this question. In fact, around half (46%)
said that they ‘definitely like’ living in the area. The converse of this is that 16% of residents
gave a negative response between 5 and 7, with 4% saying that they ‘definitely don’t like’
living in their area.
Chart 4.1: Using a scale of 1 to 7 where 1 is Definitely like and 7 is Definitely
don’t like, on the whole, how much do you like living in this area?
Base: All respondents (2009) ‘Don’t know’ responses are not shown on this chart.
The mean score for this question was 2.36, which indicates that residents like living in
Westminster, on the whole.
When comparing the mean scores across the demographic groups, it is clear that older
residents aged 55 and over were more positive about their area than younger residents aged
16-34 (2.18 compared with 2.45). Around six in ten (57%) older residents said that they
‘definitely like’ the area in which they live, while the proportion of 16–34 year olds saying the
same was significantly lower (39%).
Residents from the DE social class grouping were significantly more likely than those in the
AB and C1 social classes to express dissatisfaction with their area (2.54 compared with 2.27
10% 6% 7% 5%46% 23% 4%
1 Definitely like 2 3 4 5 6 7 - Definitely don't like
GfK NOP Social Research
and 2.28 respectively). It is also interesting to note that residents who described their local
area as noisy were significantly more negative about their area compared with those who
described it as quiet (2.71 compared with 2.05), which may indicate that noise levels have an
effect upon satisfaction.
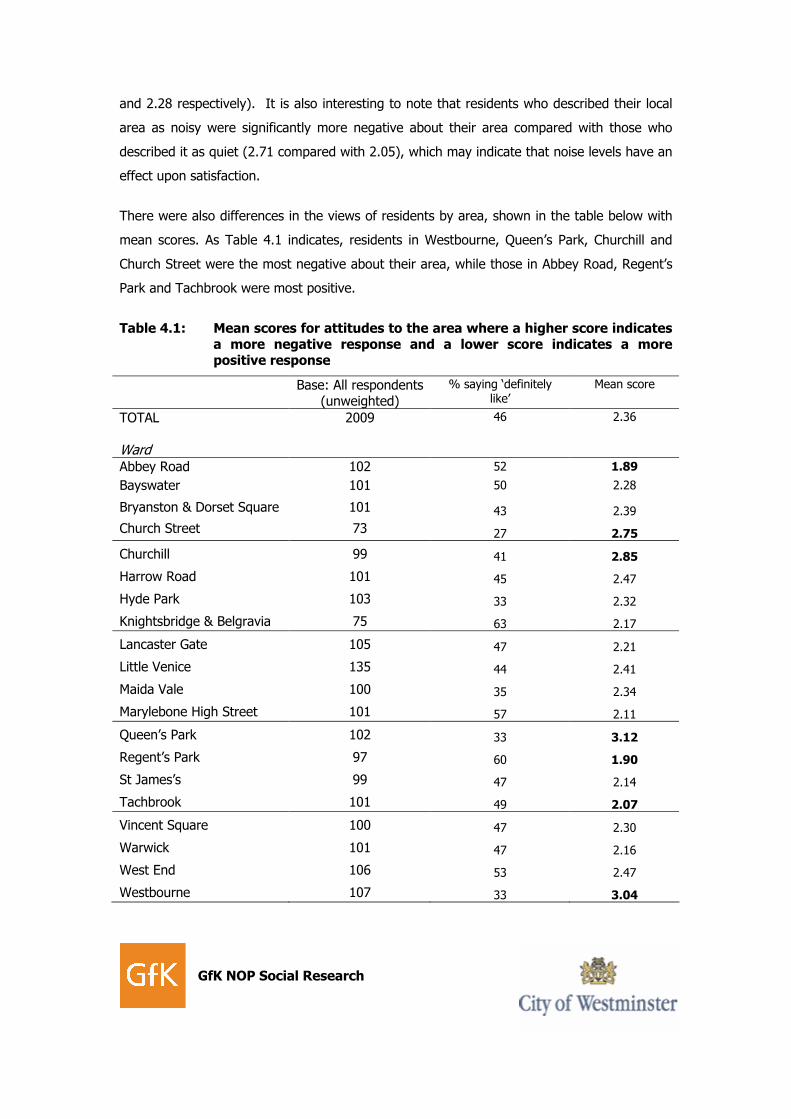
There were also differences in the views of residents by area, shown in the table below with
mean scores. As Table 4.1 indicates, residents in Westbourne, Queen’s Park, Churchill and
Church Street were the most negative about their area, while those in Abbey Road, Regent’s
Park and Tachbrook were most positive.
Table 4.1: Mean scores for attitudes to the area where a higher score indicates a more negative response and a lower score indicates a more positive response
Base: All respondents (unweighted)
% saying ‘definitely like’
Mean score
TOTAL 2009 46 2.36
Ward
Abbey Road 102 52 1.89
Bayswater 101 50 2.28
Bryanston & Dorset Square 101 43 2.39
Church Street 73 27 2.75
Churchill 99 41 2.85
Harrow Road 101 45 2.47
Hyde Park 103 33 2.32
Knightsbridge & Belgravia 75 63 2.17
Lancaster Gate 105 47 2.21
Little Venice 135 44 2.41
Maida Vale 100 35 2.34
Marylebone High Street 101 57 2.11
Queen’s Park 102 33 3.12
Regent’s Park 97 60 1.90
St James’s 99 47 2.14
Tachbrook 101 49 2.07
Vincent Square 100 47 2.30
Warwick 101 47 2.16
West End 106 53 2.47
Westbourne 107 33 3.04
GfK NOP Social Research
4.2 What do residents like about living in the area?
Residents were asked if there was anything they particularly liked about living in the area
within a 5-minute walk of their home. The intention of the question was to gauge
unprompted mentions of noise in the area.
Only 7% mentioned ‘quietness, freedom from noise or sources of noise or peacefulness’ and
a further 1% mentioned sounds or noises they like. The remainder mostly mentioned
something that was not noise related (81%) or said that they did not like anything in their
area (11%).
There are very few notable differences on this question, but one that does stand out is that
residents in the DE social class grouping were significantly more likely than residents in other
groups to say that they do not like anything in their local area (15% compared with 9% of
ABs, 10% of C1s, and 5% of C2s). Residents of Abbey Road were particularly likely to say
that they like the ‘quietness, freedom from noise or sources of noise or peacefulness’ (19%
compared with 7% overall).
These findings are in contrast to the 1999/2000 National Survey of Attitudes to Environmental
Noise, when 35% of respondents mentioned quietness, freedom from noise or sources of
noise/ peacefulness, although it must be remembered that this was a national survey which
used a different methodology and included both urban and rural areas in the sample.†
4.3 What do residents dislike about living in the area?
Residents were also asked whether there was anything they particularly disliked about the
area they live in, again using the definition of their area as being ‘within a 5 minute walk of
(their) home’.
Around half (46%) said that they do not dislike anything about their area. On the other hand,
8% mentioned a ‘noise, noise effects or a lack of peace and quiet’ as something that they
dislike. A small number of residents mentioned sources of noise that they do not like such as
traffic noise (2%) and anti-social behaviour (1%). In addition, 2% mentioned that they did
not like the ‘quietness or freedom from noise’ in the area. A further 41% cited something
they did not like which was not noise related.
GfK NOP Social Research
Residents in certain wards were more likely than others to mention noise as something they
dislike. For example, 15% of residents in Churchill, 12% of residents in both the West End
and Harrow Road mentioned a noise or noise effects, they do not like or a lack of peace and
quiet.
Residents who said that they dislike one or more sources of noise, were asked whether or not
this was because of noise. It is important to note that only 58 people (or, 3% of the sample)
fell into this group, so the following findings should be read as indicative rather than
definitive.
Eighty two per cent of this group said that the reason for disliking the sources of noise was
because of noise itself. Eight per cent said that this was the case for some of the sources of
noise mentioned and 4% said it was because of noise in all cases. Just 6% said that the
reason they dislike the sources of noise mentioned has nothing to do with actual noise.
When comparing these findings to the 1999/2000 National Survey of Attitudes to
Environmental Noise, it is interesting that a similar proportion said that they do not like
anything about their area (51%). Overall 12% of respondents in the national survey said
that they do not like the noise in their area which is once again similar to the situation in
Westminster (12%).†
GfK NOP Social Research
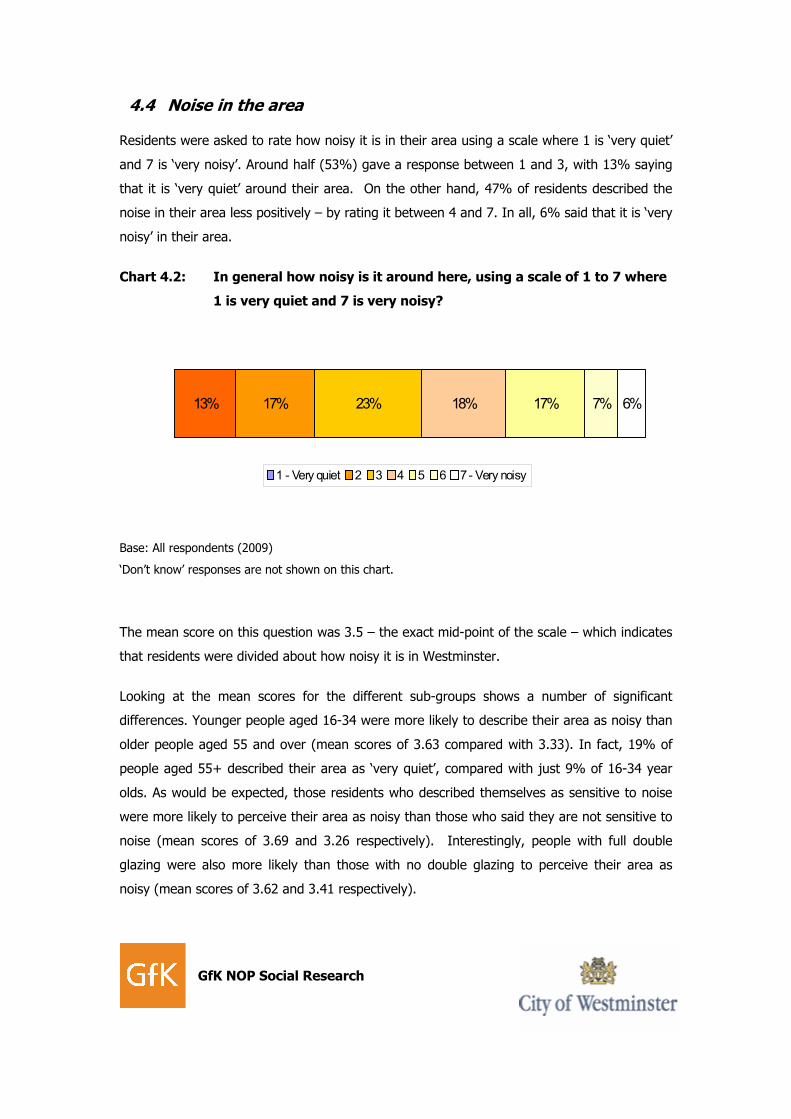
4.4 Noise in the area
Residents were asked to rate how noisy it is in their area using a scale where 1 is ‘very quiet’
and 7 is ‘very noisy’. Around half (53%) gave a response between 1 and 3, with 13% saying
that it is ‘very quiet’ around their area. On the other hand, 47% of residents described the
noise in their area less positively – by rating it between 4 and 7. In all, 6% said that it is ‘very
noisy’ in their area.
Chart 4.2: In general how noisy is it around here, using a scale of 1 to 7 where
1 is very quiet and 7 is very noisy?
Base: All respondents (2009)
‘Don’t know’ responses are not shown on this chart.
The mean score on this question was 3.5 – the exact mid-point of the scale – which indicates
that residents were divided about how noisy it is in Westminster.
Looking at the mean scores for the different sub-groups shows a number of significant
differences. Younger people aged 16-34 were more likely to describe their area as noisy than
older people aged 55 and over (mean scores of 3.63 compared with 3.33). In fact, 19% of
people aged 55+ described their area as ‘very quiet’, compared with just 9% of 16-34 year
olds. As would be expected, those residents who described themselves as sensitive to noise
were more likely to perceive their area as noisy than those who said they are not sensitive to
noise (mean scores of 3.69 and 3.26 respectively). Interestingly, people with full double
glazing were also more likely than those with no double glazing to perceive their area as
noisy (mean scores of 3.62 and 3.41 respectively).
13% 17% 23% 18% 17% 7% 6%
1 - Very quiet 2 3 4 5 6 7 - Very noisy

GfK NOP Social Research
There were also differences in residents’ perceptions of noise by area, these are shown in full
in the table below. According to residents in St James’s and the West End those wards are
the noisiest in Westminster (mean scores of 4.23 and 4.16 respectively), in fact 19% of St
James’s residents described the area as ‘very noisy’. In comparison, Abbey road and Maida
Vale appear to be the least noisy wards in Westminster (mean scores of 2.89 and 2.93
respectively).
Table 4.2: In general, how noisy is it around here? (mean scores by ward) *
Base: All respondents (unweighted)
Mean score
TOTAL 2009 3.50
Ward
Abbey Road 102 2.89
Bayswater 101 3.41
Bryanston & Dorset Square 101 3.45
Church Street 73 3.66
Churchill 99 3.74
Harrow Road 101 3.70
Hyde Park 103 3.73
Knightsbridge & Belgravia 75 3.05
Lancaster Gate 105 3.52
Little Venice 135 3.36
Maida Vale 100 2.93
Marylebone High Street 101 3.44
Queen’s Park 102 3.27
Regent’s Park 97 3.56
St James’s 99 4.23
Tachbrook 101 3.05
Vincent Square 100 3.44
Warwick 101 3.19
West End 106 4.16
Westbourne 107 3.96
* This table shows the mean scores for residents’ perceptions of noise in their area. A higher score
indicates higher noise levels, while a lower score indicates lower noise levels.
GfK NOP Social Research
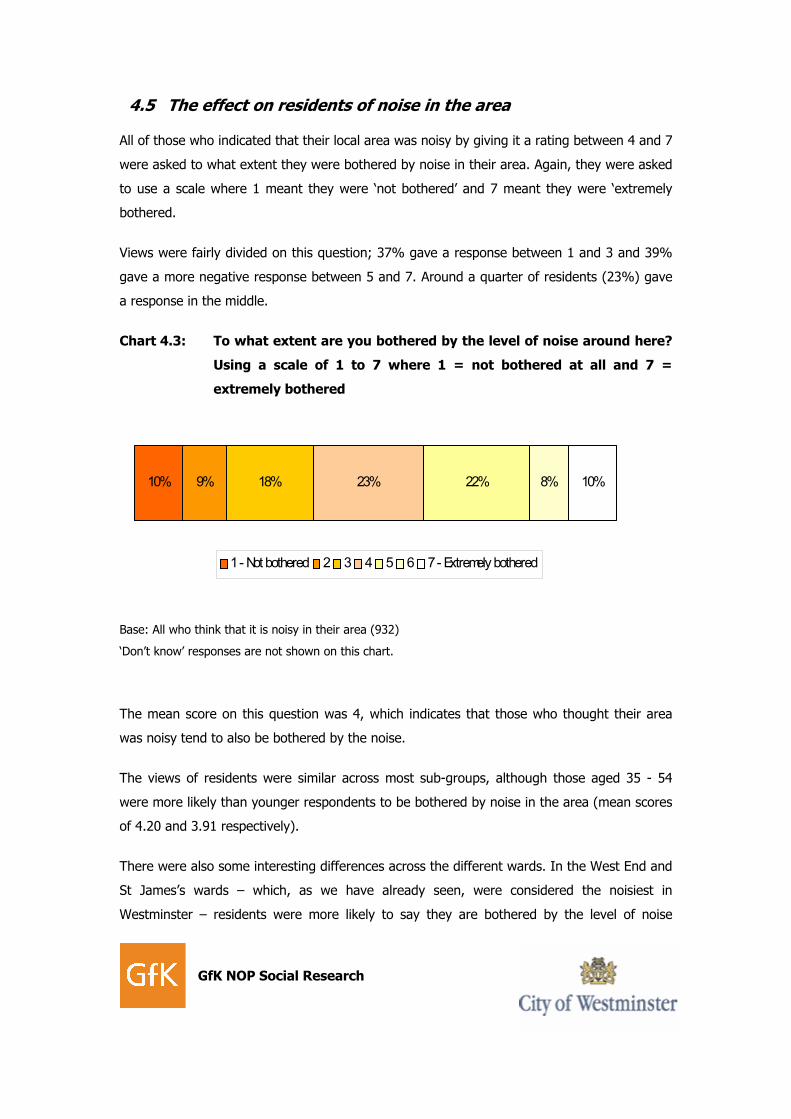
4.5 The effect on residents of noise in the area
All of those who indicated that their local area was noisy by giving it a rating between 4 and 7
were asked to what extent they were bothered by noise in their area. Again, they were asked
to use a scale where 1 meant they were ‘not bothered’ and 7 meant they were ‘extremely
bothered.
Views were fairly divided on this question; 37% gave a response between 1 and 3 and 39%
gave a more negative response between 5 and 7. Around a quarter of residents (23%) gave
a response in the middle.
Chart 4.3: To what extent are you bothered by the level of noise around here?
Using a scale of 1 to 7 where 1 = not bothered at all and 7 =
extremely bothered
Base: All who think that it is noisy in their area (932)
‘Don’t know’ responses are not shown on this chart.
The mean score on this question was 4, which indicates that those who thought their area
was noisy tend to also be bothered by the noise.
The views of residents were similar across most sub-groups, although those aged 35 - 54
were more likely than younger respondents to be bothered by noise in the area (mean scores
of 4.20 and 3.91 respectively).
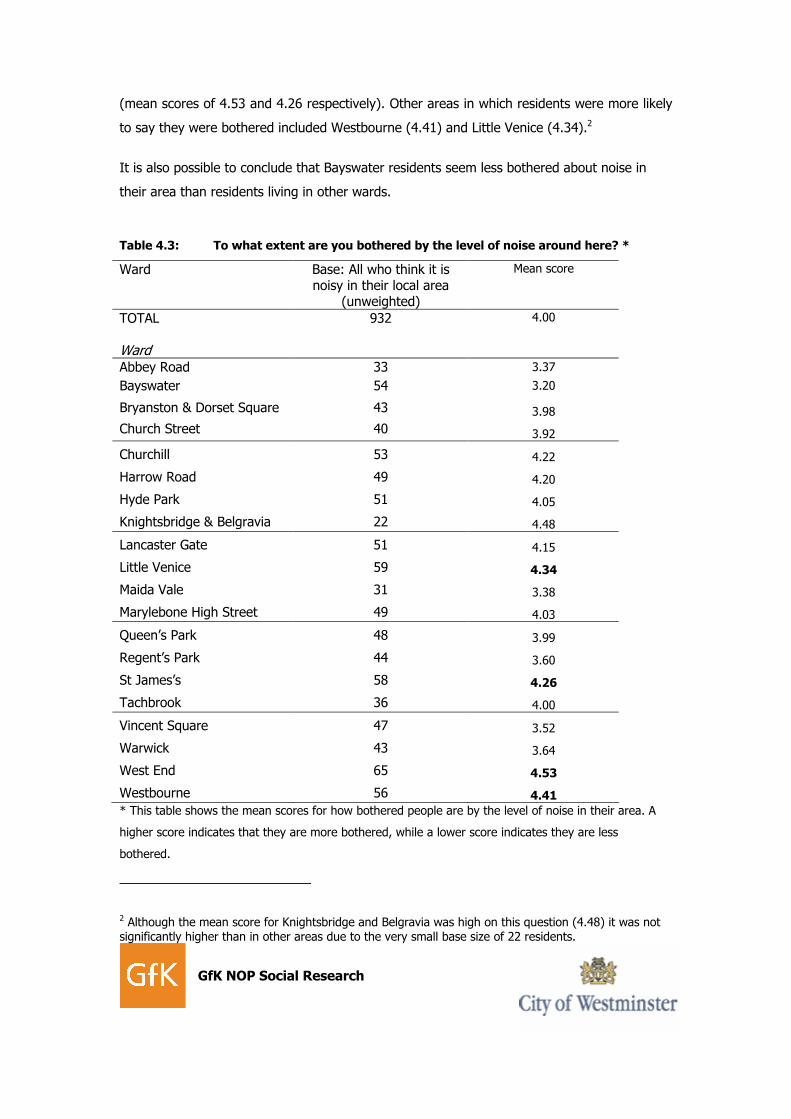
There were also some interesting differences across the different wards. In the West End and
St James’s wards – which, as we have already seen, were considered the noisiest in
Westminster – residents were more likely to say they are bothered by the level of noise
10% 9% 18% 23% 22% 8% 10%
1 - Not bothered 2 3 4 5 6 7 - Extremely bothered
GfK NOP Social Research
(mean scores of 4.53 and 4.26 respectively). Other areas in which residents were more likely
to say they were bothered included Westbourne (4.41) and Little Venice (4.34).2
It is also possible to conclude that Bayswater residents seem less bothered about noise in
their area than residents living in other wards.
Table 4.3: To what extent are you bothered by the level of noise around here? *
Ward Base: All who think it is noisy in their local area
(unweighted)
Mean score
TOTAL 932 4.00
Ward
Abbey Road 33 3.37
Bayswater 54 3.20
Bryanston & Dorset Square 43 3.98
Church Street 40 3.92
Churchill 53 4.22
Harrow Road 49 4.20
Hyde Park 51 4.05
Knightsbridge & Belgravia 22 4.48
Lancaster Gate 51 4.15
Little Venice 59 4.34
Maida Vale 31 3.38
Marylebone High Street 49 4.03
Queen’s Park 48 3.99
Regent’s Park 44 3.60
St James’s 58 4.26
Tachbrook 36 4.00
Vincent Square 47 3.52
Warwick 43 3.64
West End 65 4.53
Westbourne 56 4.41
* This table shows the mean scores for how bothered people are by the level of noise in their area. A
higher score indicates that they are more bothered, while a lower score indicates they are less
bothered.
2 Although the mean score for Knightsbridge and Belgravia was high on this question (4.48) it was not significantly higher than in other areas due to the very small base size of 22 residents.
GfK NOP Social Research
4.6 What do residents like about living in their home?
As well as asking about the area in which they live residents were asked about the things
they liked about living in their home in particular. Again, for the purposes of this survey, the
responses of particular interest were those that related to noise or quietness.
Apart from the one in ten (10%) who mentioned that they liked the peace and quiet of their
home the majority mentioned something unrelated to noise (71%), while 16% said they do
not like anything about their home in particular.
As so few people mentioned peace and quiet as a reason why they like their home there were
very few differences to note when looking at the sub-group data. White residents were more
likely than those from BME groups to say they like the peace and quiet of their home (11%
compared with 7%) and respondents from social groups AB were more likely than those from
social group DE to say they liked the general quietness of their home (12% compared with
7%).
These findings are in contrast to the 1999/2000 National Survey of Attitudes to Environmental
Noise when 20% said that they like the quietness/ freedom from noise/ peaceful, but once
again it is important to remember that the national survey employed a different data
collection method and included rural areas as well as urban.†
4.7 What do residents dislike about living in their home?
Residents were also asked if there was anything they disliked about living in their home.
Again, although the survey was looking for spontaneous responses the focus for this survey
was noise related.
Seven per cent of Westminster residents mentioned noises they did not like or a lack of peace
and quiet, 2% mentioned sources of noises that they did not like and a further 1%
mentioned quietness or freedom from noise not liked.
These findings are similar to the 1999/2000 National Survey of Attitudes to Environmental
Noise when 7% of respondents said that they did not like the noise/ noise effects/ lack of
peace and quiet.†
GfK NOP Social Research
Analysis by individual wards indicates that residents in the following wards were more likely
to mention disliking noises, noise effects or the lack of peace and quiet; St James (13%),
Hyde Park (10%), West End (10%) and Westbourne (10%). In comparison, no residents in
the Church Street ward mentioned this as a reason for disliking living in their home.
The group of 53 residents who said that one of the things they disliked about living in their
home was related to a source of noise were then asked a subsequent question which asked if
the dislike they had mentioned was specifically because of noise associated with it. Three
quarters (75%) said it was, and a further 6% said it was for some of the sources they had
mentioned but not all. One in eight (12%) said that although they had mentioned a source
of noise as something they dislike about living in their home, the noise itself was not the
reason for the dislike.
GfK NOP Social Research
5 The effect of noise in people’s homes
After assessing spontaneous mentions of noise and perceptions of how noisy it is in each area
residents were asked whether they had been bothered by a number of different noises while
at home in the last 12 months.3 The list of noises was as follows:
� Railways or the underground
� Recycling or waste collection
� Outdoor events in parks
� Other outdoor events (not in parks)
� Pubs, bars, night clubs or restaurants
� Schools, health or Community buildings
� Other businesses (shops, offices or workspaces)
� Neighbours’ activities inside or outside their homes
� Building and construction
� Road works
� Road traffic noise
� Aircraft, including helicopters
� Other noises
As this was a multicoded question residents were able to mention all of the noises that had
bothered them from this list.
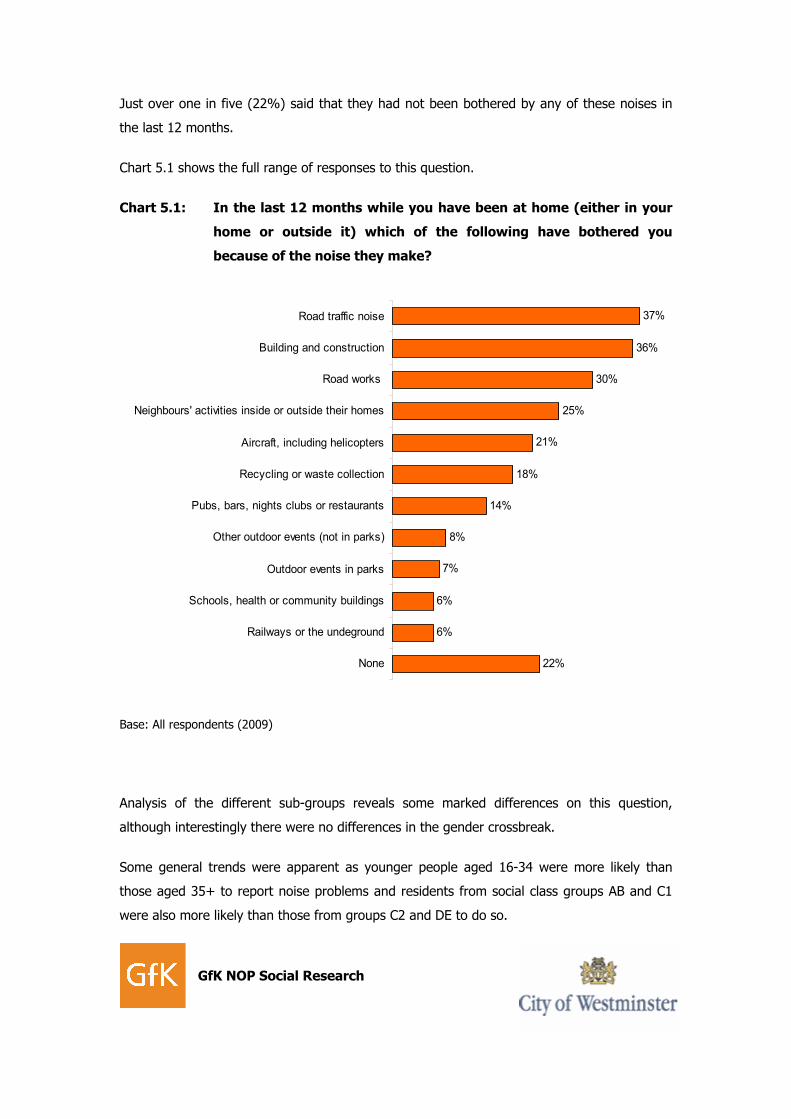
The most frequently cited noises were road traffic noise (37%), building and construction
work (36%) and road works (30%). In addition, a quarter (25%) mentioned neighbour’s
activities either inside or outside their home, 21% mentioned aircraft noise including
helicopters, 18% said that the noise associated with recycling or waste collection had been a
problem for them in the last year and 14% said that noise from pubs, bars, nightclubs or
restaurants had bothered them over the previous 12 months. None of the other noise
sources were mentioned by more than one in ten Westminster residents.
3 In the interview it was made clear that respondents should include in their response not just noises that had bothered them while they had been in their home but also whilst in their garden or on their balcony if applicable.
GfK NOP Social Research
Just over one in five (22%) said that they had not been bothered by any of these noises in
the last 12 months.
Chart 5.1 shows the full range of responses to this question.
Chart 5.1: In the last 12 months while you have been at home (either in your
home or outside it) which of the following have bothered you
because of the noise they make?
37%
36%
30%
25%
21%
18%
14%
8%
7%
6%
6%
22%
Road traffic noise
Building and construction
Road works
Neighbours' activities inside or outside their homes
Aircraft, including helicopters
Recycling or waste collection
Pubs, bars, nights clubs or restaurants
Other outdoor events (not in parks)
Outdoor events in parks
Schools, health or community buildings
Railways or the undeground
None
Base: All respondents (2009)
Analysis of the different sub-groups reveals some marked differences on this question,
although interestingly there were no differences in the gender crossbreak.
Some general trends were apparent as younger people aged 16-34 were more likely than
those aged 35+ to report noise problems and residents from social class groups AB and C1
were also more likely than those from groups C2 and DE to do so.
GfK NOP Social Research
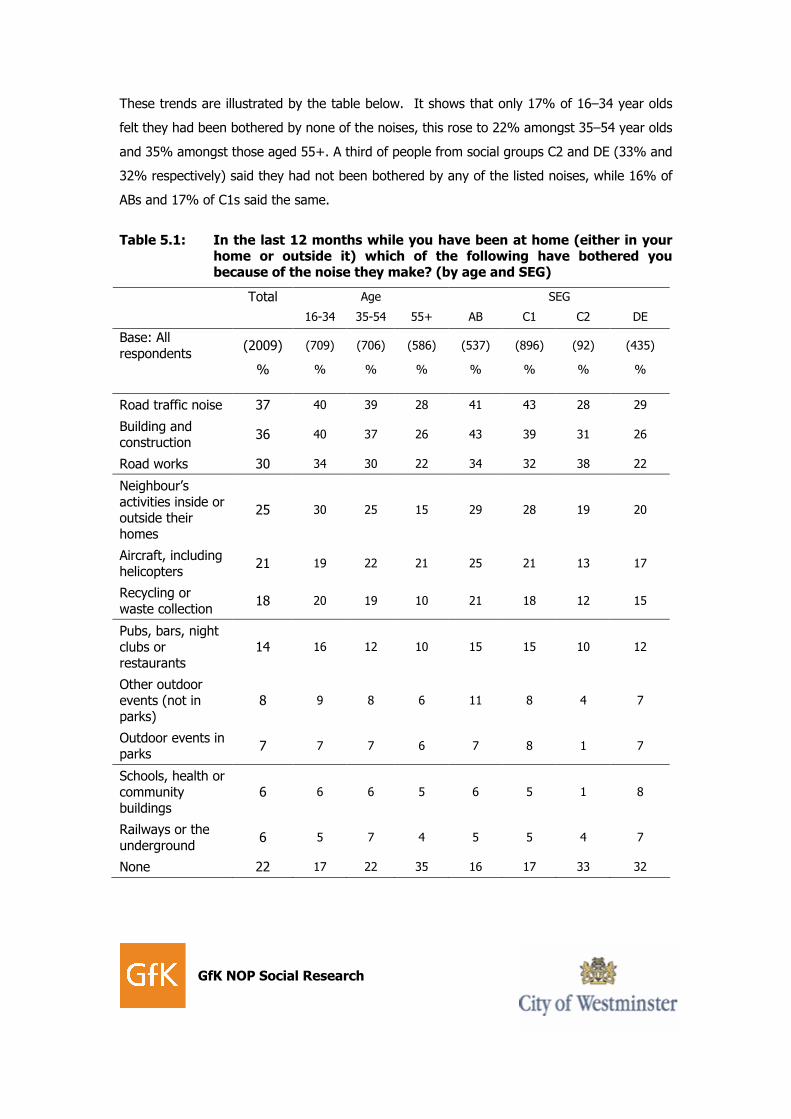
These trends are illustrated by the table below. It shows that only 17% of 16–34 year olds
felt they had been bothered by none of the noises, this rose to 22% amongst 35–54 year olds
and 35% amongst those aged 55+. A third of people from social groups C2 and DE (33% and
32% respectively) said they had not been bothered by any of the listed noises, while 16% of
ABs and 17% of C1s said the same.
Table 5.1: In the last 12 months while you have been at home (either in your home or outside it) which of the following have bothered you because of the noise they make? (by age and SEG)
Age SEG
Total
16-34 35-54 55+ AB C1 C2 DE
Base: All respondents
(2009) (709) (706) (586) (537) (896) (92) (435)
% % % % % % % %
Road traffic noise 37 40 39 28 41 43 28 29
Building and construction
36 40 37 26 43 39 31 26
Road works 30 34 30 22 34 32 38 22
Neighbour’s activities inside or outside their homes
25 30 25 15 29 28 19 20
Aircraft, including helicopters
21 19 22 21 25 21 13 17
Recycling or waste collection
18 20 19 10 21 18 12 15
Pubs, bars, night clubs or restaurants
14 16 12 10 15 15 10 12
Other outdoor events (not in parks)
8 9 8 6 11 8 4 7
Outdoor events in parks
7 7 7 6 7 8 1 7
Schools, health or community buildings
6 6 6 5 6 5 1 8
Railways or the underground
6 5 7 4 5 5 4 7
None 22 17 22 35 16 17 33 32
GfK NOP Social Research
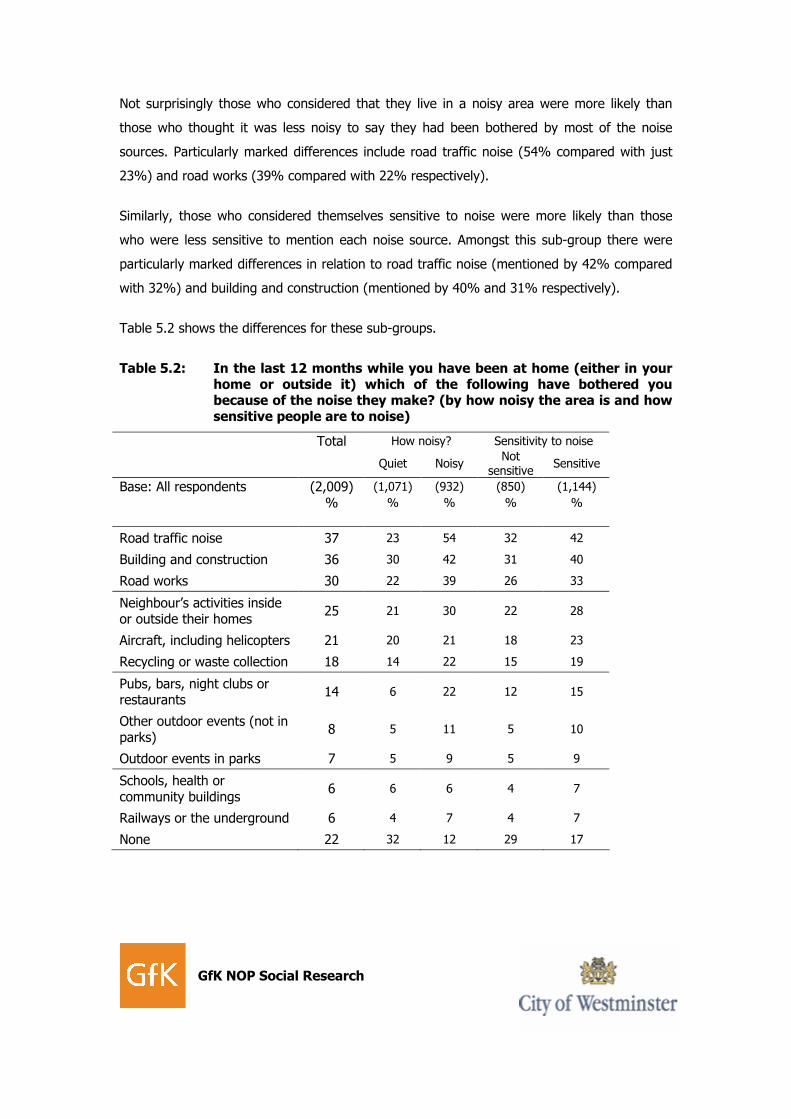
Not surprisingly those who considered that they live in a noisy area were more likely than
those who thought it was less noisy to say they had been bothered by most of the noise
sources. Particularly marked differences include road traffic noise (54% compared with just
23%) and road works (39% compared with 22% respectively).
Similarly, those who considered themselves sensitive to noise were more likely than those
who were less sensitive to mention each noise source. Amongst this sub-group there were
particularly marked differences in relation to road traffic noise (mentioned by 42% compared
with 32%) and building and construction (mentioned by 40% and 31% respectively).
Table 5.2 shows the differences for these sub-groups.
Table 5.2: In the last 12 months while you have been at home (either in your home or outside it) which of the following have bothered you because of the noise they make? (by how noisy the area is and how sensitive people are to noise)
Total How noisy? Sensitivity to noise
Quiet Noisy Not
sensitive Sensitive
Base: All respondents (2,009) (1,071) (932) (850) (1,144)
% % % % %
Road traffic noise 37 23 54 32 42
Building and construction 36 30 42 31 40
Road works 30 22 39 26 33
Neighbour’s activities inside or outside their homes
25 21 30 22 28
Aircraft, including helicopters 21 20 21 18 23
Recycling or waste collection 18 14 22 15 19
Pubs, bars, night clubs or restaurants
14 6 22 12 15
Other outdoor events (not in parks)
8 5 11 5 10
Outdoor events in parks 7 5 9 5 9
Schools, health or community buildings
6 6 6 4 7
Railways or the underground 6 4 7 4 7
None 22 32 12 29 17
GfK NOP Social Research
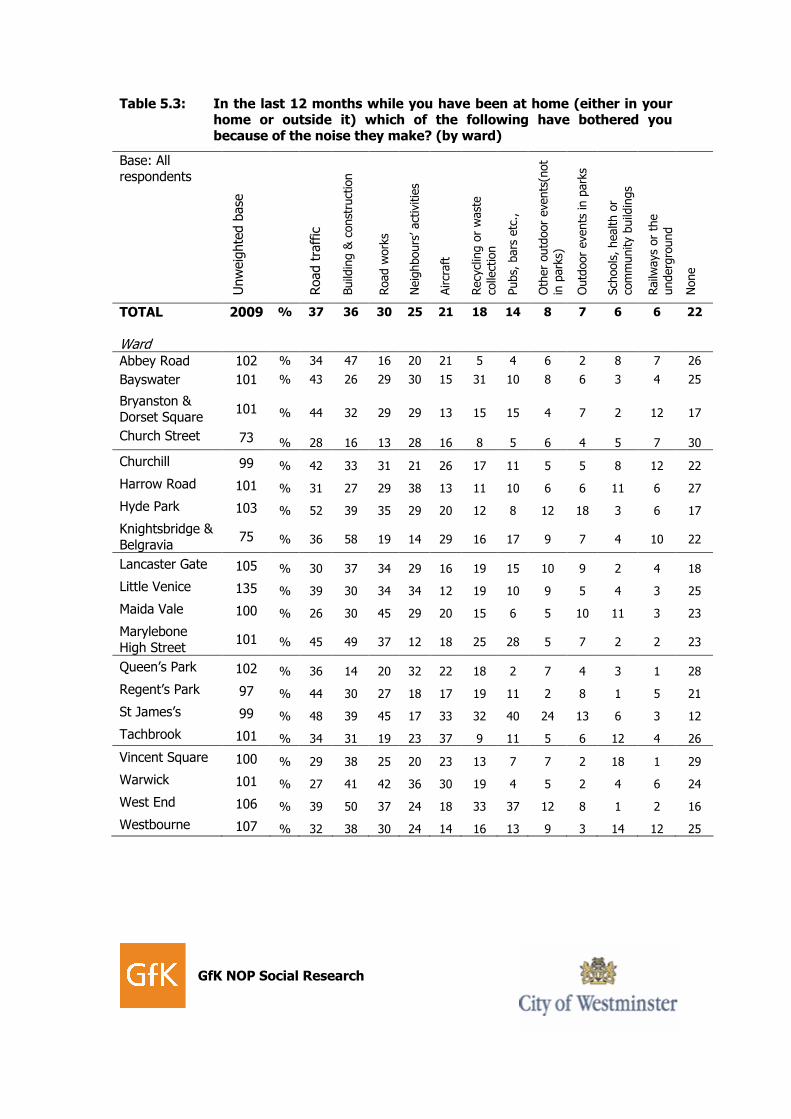
Analysis by ward data is particularly interesting as it indicates that certain noises are more
prevalent in certain areas.
� Road traffic noise – more than half (52%) of residents in Hyde Park had been
bothered by this noise source in the last 12 months, in comparison just 26% of
Maida Vale residents mentioned this
� Building and construction – in Knightsbridge and Belgravia 58% mentioned this
noise source, in the West End a similarly high proportion (50%) had been affected
by this in the last year. Building and construction appears to be much less of a
problem in Queen’s Park (14%) and Church Street (16%)
� Road works – Just under half of those living in St James’s and Maida Vale had been
affected by the noise from road works (both 45%), the residents of Church Street
were least likely to mention this (just 13%)
� Neighbours’ activities – Around two in five residents in Harrow Road (38%) and
Warwick (36%) had been bothered by their neighbours’ activities inside or outside
their homes in the last 12 months
� Aircraft – 37% of residents in Tachbrook and 33% of residents in St James’s
mentioned this noise source, while aircraft were least likely to affect residents in
Little Venice (just 12%)
� Recycling or waste collection – this noise source was mentioned by around a
third of residents in the West End (33%), St James’s (32%) and Bayswater (31%).
In comparison, less than one in ten mentioned it in Abbey Road (5%), Church Street
(8%) and Tachbrook (9%)
� Pubs, bars, nightclubs or restaurants – noise from these kind of venues was
most likely to affect people living in St James’s or the West End (40% and 37%
respectively)
� Other outdoor events (not in parks) – although this was only mentioned by 8%
of residents overall it is worth noting that in St James’s a quarter (24%) of residents
said they had been affected by this in the last year
GfK NOP Social Research
Table 5.3: In the last 12 months while you have been at home (either in your home or outside it) which of the following have bothered you because of the noise they make? (by ward)
Base: All respondents
Unweig
hte
d b
ase
Road tra
ffic
Build
ing &
const
ruct
ion
Road w
ork
s
Neig
hbours
’ act
ivities
Aircr
aft
Recy
clin
g o
r wast
e
colle
ctio
n
Pubs, b
ars
etc
.,
Oth
er outd
oor events
(not
in p
ark
s)
Outd
oor events
in p
ark
s
Sch
ools, health o
r
com
munity b
uild
ings
Railw
ays or th
e
underg
round
None
TOTAL 2009 % 37 36 30 25 21 18 14 8 7 6 6 22
Ward
Abbey Road 102 % 34 47 16 20 21 5 4 6 2 8 7 26
Bayswater 101 % 43 26 29 30 15 31 10 8 6 3 4 25
Bryanston & Dorset Square
101 % 44 32 29 29 13 15 15 4 7 2 12 17
Church Street 73 % 28 16 13 28 16 8 5 6 4 5 7 30
Churchill 99 % 42 33 31 21 26 17 11 5 5 8 12 22
Harrow Road 101 % 31 27 29 38 13 11 10 6 6 11 6 27
Hyde Park 103 % 52 39 35 29 20 12 8 12 18 3 6 17
Knightsbridge & Belgravia
75 % 36 58 19 14 29 16 17 9 7 4 10 22
Lancaster Gate 105 % 30 37 34 29 16 19 15 10 9 2 4 18
Little Venice 135 % 39 30 34 34 12 19 10 9 5 4 3 25
Maida Vale 100 % 26 30 45 29 20 15 6 5 10 11 3 23
Marylebone High Street
101 % 45 49 37 12 18 25 28 5 7 2 2 23
Queen’s Park 102 % 36 14 20 32 22 18 2 7 4 3 1 28
Regent’s Park 97 % 44 30 27 18 17 19 11 2 8 1 5 21
St James’s 99 % 48 39 45 17 33 32 40 24 13 6 3 12
Tachbrook 101 % 34 31 19 23 37 9 11 5 6 12 4 26
Vincent Square 100 % 29 38 25 20 23 13 7 7 2 18 1 29
Warwick 101 % 27 41 42 36 30 19 4 5 2 4 6 24
West End 106 % 39 50 37 24 18 33 37 12 8 1 2 16
Westbourne 107 % 32 38 30 24 14 16 13 9 3 14 12 25

GfK NOP Social Research
5.1 Which sources of noise most bother residents in Westminster?
In the initial question, detailed above, residents were able to specify every source of noise
that had bothered them in the last year. The questionnaire then went on to establish which
noise source bothered each respondent the most. By asking about the extent to which each
respondent was bothered by the noises that they mentioned we are able to establish the
noise that bothers residents the most.
As Table 5.4 shows, road traffic noise was considered the most annoying noise for 22% of
residents. One in five (19%) felt that building and construction was the most annoying noise
for them, 14% felt that neighbours’ activities inside or outside their home was the most
annoying noise and 11% felt that road works were the most annoying noise source.
Table 5.4: The most annoying noises for Westminster residents
Total
Base: All respondents who have been bothered by a noise in the last year
(1,554)
%
Road traffic noise 22
Building and construction 19
Neighbour’s activities inside or outside their homes 14
Road works 11
Aircraft, including helicopters 8
Recycling or waste collection 6
Pubs, bars, night clubs or restaurants 6
Other 4
Schools, health or Community buildings 3
Railways or the underground 2
Other outdoor events (not in parks) 2
Outdoor events in parks 2
Other businesses (shops, offices or workspaces) 1
Respondents in the national survey were also asked to rank the noise sources that bothered,
annoyed or disturbed them personally when they were at home. Some of the noise sources
that were used are comparable with the Westminster Noise Attitudes survey, although again
it is important to highlight the methodological differences between the two surveys and, in
this case, the different question wording that was used.‡
GfK NOP Social Research
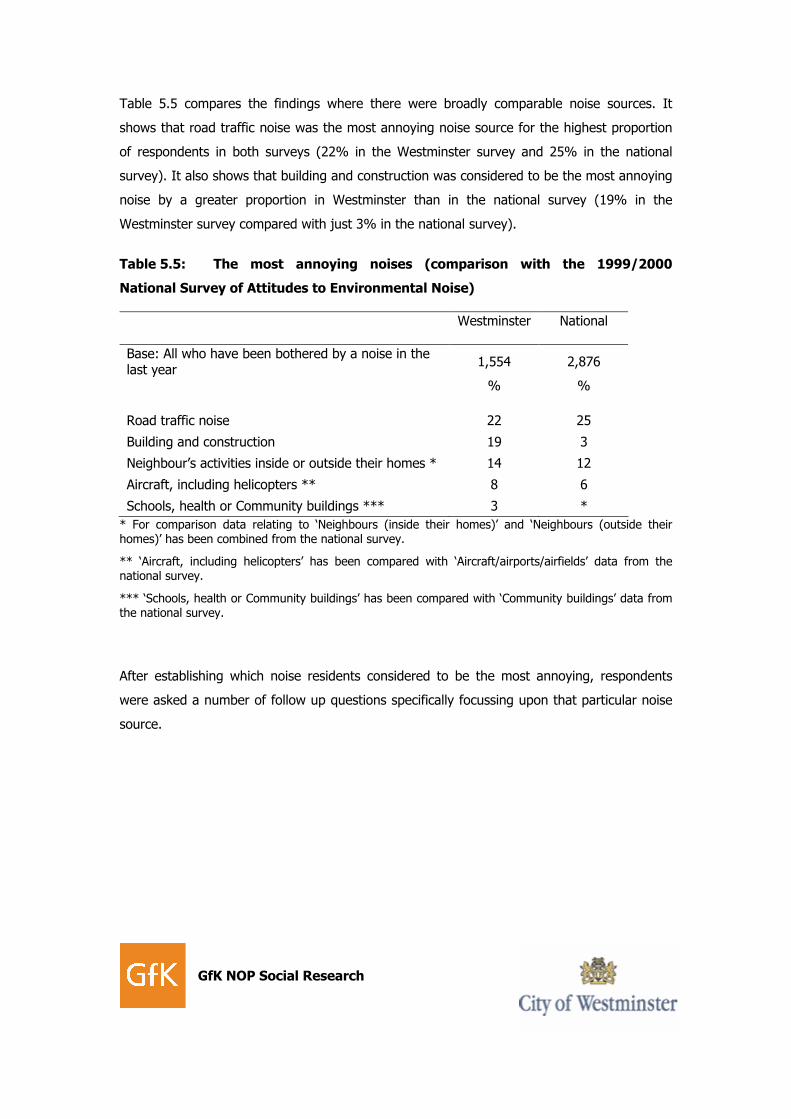
Table 5.5 compares the findings where there were broadly comparable noise sources. It
shows that road traffic noise was the most annoying noise source for the highest proportion
of respondents in both surveys (22% in the Westminster survey and 25% in the national
survey). It also shows that building and construction was considered to be the most annoying
noise by a greater proportion in Westminster than in the national survey (19% in the
Westminster survey compared with just 3% in the national survey).
Table 5.5: The most annoying noises (comparison with the 1999/2000
National Survey of Attitudes to Environmental Noise)
Westminster National
Base: All who have been bothered by a noise in the last year
1,554 2,876
% %
Road traffic noise 22 25
Building and construction 19 3
Neighbour’s activities inside or outside their homes * 14 12
Aircraft, including helicopters ** 8 6
Schools, health or Community buildings *** 3 *
* For comparison data relating to ‘Neighbours (inside their homes)’ and ‘Neighbours (outside their homes)’ has been combined from the national survey.
** ‘Aircraft, including helicopters’ has been compared with ‘Aircraft/airports/airfields’ data from the national survey.
*** ‘Schools, health or Community buildings’ has been compared with ‘Community buildings’ data from the national survey.
After establishing which noise residents considered to be the most annoying, respondents
were asked a number of follow up questions specifically focussing upon that particular noise
source.
GfK NOP Social Research
5.2 What is it about the different noise sources that particularly
bothers residents?
Residents were asked an open question to determine whether there was a particular noise
from their most annoying noise source that they were personally bothered by the most.
This section of the report analyses this question by the noise source that residents felt was
the most annoying.
� Road Traffic – Amongst those who considered this to be the most annoying source
of noise there was no consensus of opinion about a particular noise that annoyed
residents. The highest proportion (17%) mentioned ‘buses and coaches’, 9%
mentioned both ‘cars’ and ‘police cars and sirens’, 8% mentioned ‘motorbikes and
loud scooters’ and ‘lorries and trucks’ while 7% mentioned ‘sirens’
� Building and construction – The main reason why this noise source annoyed
residents was ‘drilling and loud machinery’ (51%). In addition, 12% mentioned
‘hammering’, 9% mentioned ‘machinery’ in general and 6% mentioned ‘banging,
stomping and thumping’
� Neighbours’ activities – A third (32%) of residents who felt that their neighbours’
activities were the most annoying noise source said that ‘loud music’ was what they
were most bothered by. Eighteen per cent were bothered by their neighbours’
‘arguments, screaming and shouting’ and 8% mentioned both ‘loud talking and street
conversations’ and ‘banging, stomping and thumping’
� Road works - 44% of those who felt that this was the most annoying source of
noise where they live said that the particular noise they felt bothered by was ‘drilling
and loud machinery’. No other reason was mentioned by more than one in ten of this
group, but other responses included ‘machinery’ in general (7%), ‘noise from digging
or demolishing’ (7%)
� Aircraft / including helicopters – Just over a quarter (27%) of those who
selected this as their most annoying noise source said that it was ‘helicopters, police
helicopters and hovering noises’ that most bothered them, while 21% felt it was
‘aeroplanes landing and taking off’ that they were most bothered by
GfK NOP Social Research
� Pubs, bars, nightclubs or restaurants – A third (33%) of those who selected this
as the most annoying source of noise were personally bothered by ‘drunks, pub
closing time and people drinking outside of pubs’. One in five (20%) were bothered
by ‘arguments, screaming and people shouting’, 17% by ‘loud talking and street
conversations’ and 11% were bothered by ‘loud music’
� Recycling or waste collection –20% of the residents who selected this as their
most annoying source of noise were particularly bothered by the ‘noise from
emptying or collection of glass’, 18% were bothered by ‘waste collecting noises (such
as tipping containers)’ and 15% were bothered by the ‘lorries and trucks’
Analysis by the following noise sources is not possible due to the small base sizes (shown in
brackets); ‘Other’ (69), ‘Schools, health or community buildings’ (43), ‘Railways or the
underground’ (29), ‘Other outdoor events’ (29), ‘Outdoor events in parks’ (24) and ‘Other
businesses’ (14).
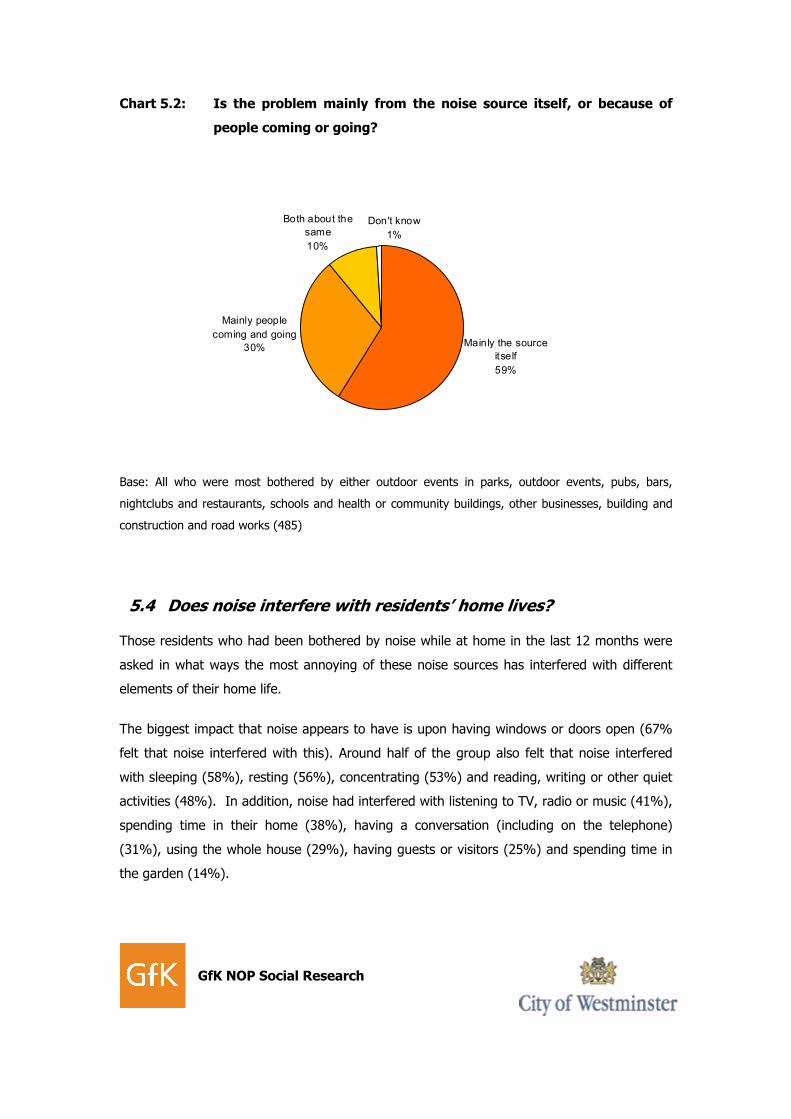
5.3 Nature of the noise problem from sources that involve people
coming and going
Residents who said that the noise source that bothers them most was one that involves
people coming and going (i.e. outdoor events in parks, outdoor events, pubs/bars/nightclubs
or restaurants, schools/health or community buildings, other businesses and building and
construction) were asked whether the noise problem was from the noise source itself or
because of people coming and going.
In six out of ten cases (59%), residents said that it was the noise from the sources
themselves that are the problem, while 30% said the problem was people coming and going
and 10% said both.
GfK NOP Social Research
Chart 5.2: Is the problem mainly from the noise source itself, or because of
people coming or going?
Base: All who were most bothered by either outdoor events in parks, outdoor events, pubs, bars,
nightclubs and restaurants, schools and health or community buildings, other businesses, building and
construction and road works (485)
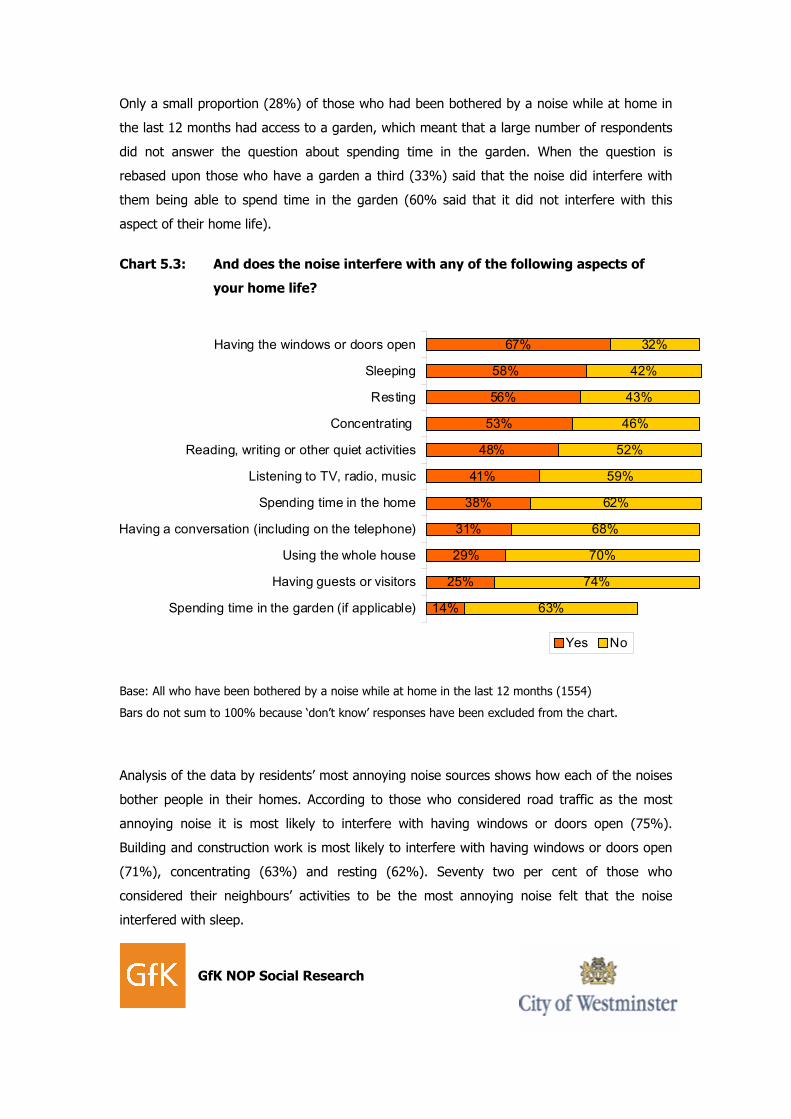
5.4 Does noise interfere with residents’ home lives?
Those residents who had been bothered by noise while at home in the last 12 months were
asked in what ways the most annoying of these noise sources has interfered with different
elements of their home life.
The biggest impact that noise appears to have is upon having windows or doors open (67%
felt that noise interfered with this). Around half of the group also felt that noise interfered
with sleeping (58%), resting (56%), concentrating (53%) and reading, writing or other quiet
activities (48%). In addition, noise had interfered with listening to TV, radio or music (41%),
spending time in their home (38%), having a conversation (including on the telephone)
(31%), using the whole house (29%), having guests or visitors (25%) and spending time in
the garden (14%).
Mainly the source
itself
59%
Mainly people
coming and going
30%
Don't know
1%
Both about the
same
10%
GfK NOP Social Research
Only a small proportion (28%) of those who had been bothered by a noise while at home in
the last 12 months had access to a garden, which meant that a large number of respondents
did not answer the question about spending time in the garden. When the question is
rebased upon those who have a garden a third (33%) said that the noise did interfere with
them being able to spend time in the garden (60% said that it did not interfere with this
aspect of their home life).
Chart 5.3: And does the noise interfere with any of the following aspects of
your home life?
Base: All who have been bothered by a noise while at home in the last 12 months (1554)
Bars do not sum to 100% because ‘don’t know’ responses have been excluded from the chart.
Analysis of the data by residents’ most annoying noise sources shows how each of the noises
bother people in their homes. According to those who considered road traffic as the most
annoying noise it is most likely to interfere with having windows or doors open (75%).
Building and construction work is most likely to interfere with having windows or doors open
(71%), concentrating (63%) and resting (62%). Seventy two per cent of those who
considered their neighbours’ activities to be the most annoying noise felt that the noise
interfered with sleep.
14%
25%
29%
31%
38%
41%
48%
53%
56%
58%
67%
63%
74%
70%
68%
62%
59%
52%
46%
43%
42%
32%
Spending time in the garden (if applicable)
Having guests or visitors
Using the whole house
Having a conversation (including on the telephone)
Spending time in the home
Listening to TV, radio, music
Reading, writing or other quiet activities
Concentrating
Resting
Sleeping
Having the windows or doors open
Yes No
GfK NOP Social Research
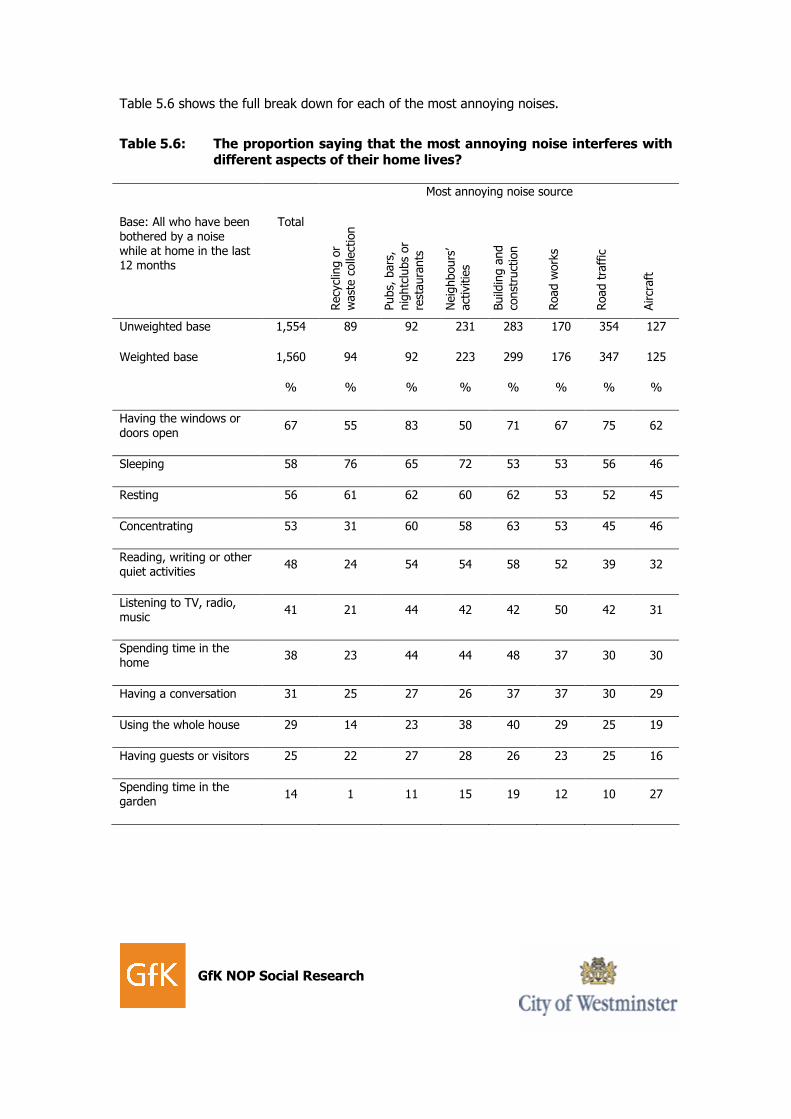
Table 5.6 shows the full break down for each of the most annoying noises.
Table 5.6: The proportion saying that the most annoying noise interferes with different aspects of their home lives?
Most annoying noise source
Base: All who have been
bothered by a noise while at home in the last 12 months
Total
Recy
clin
g o
r
wast
e c
olle
ctio
n
Pubs, b
ars
,
nig
htc
lubs or
rest
aura
nts
Neig
hbours
’
act
ivities
Build
ing a
nd
const
ruct
ion
Road w
ork
s
Road tra
ffic
Aircr
aft
Unweighted base 1,554 89 92 231 283 170 354 127
Weighted base 1,560 94 92 223 299 176 347 125
% % % % % % % %
Having the windows or
doors open 67 55 83 50 71 67 75 62
Sleeping 58 76 65 72 53 53 56 46
Resting 56 61 62 60 62 53 52 45
Concentrating 53 31 60 58 63 53 45 46
Reading, writing or other quiet activities
48 24 54 54 58 52 39 32
Listening to TV, radio, music
41 21 44 42 42 50 42 31
Spending time in the home
38 23 44 44 48 37 30 30
Having a conversation 31 25 27 26 37 37 30 29
Using the whole house 29 14 23 38 40 29 25 19
Having guests or visitors 25 22 27 28 26 23 25 16
Spending time in the garden
14 1 11 15 19 12 10 27
GfK NOP Social Research
Analysis of other sub-group shows a number of differences that are worth noting.
For example, younger residents aged under 55 were often more likely than those aged 55
and over to say that noise interferes with their home life, in particular, reading, writing or
other quiet activities, concentrating, sleeping and resting. In addition, those who admitted to
being sensitive to noise were not surprisingly most likely to say that their home life is
interfered with, in particular in terms of reading, writing or other quiet activities,
concentrating, resting, using the whole house and having the doors and windows open. Other
differences which vary according to each aspect of home life are discussed below.
Interference with listening to TV, radio and music would seem to be more of a problem for
black and minority ethnic residents (47%), C2s and DEs (55% and 48% respectively) plus
those living in Queen’s Park and Westbourne (58% and 54% respectively). On the other
hand, residents of Abbey Road, Bayswater and Regent’s Park were most likely to say that
they do not experience interference with listening to TV, radio or music (79%, 70% and 70%
respectively).
Interference with having a conversation appears to be a particular problem in Westbourne
(50%) while once again a significantly lower proportion of residents in Abbey Road and
Bayswater said that this was a problem (20% and 18% respectively).
Interference with sleeping is seen as a particular problem for black and minority ethnic
residents (65%), as well as those living in the West End (70%). Once again, Abbey Road
residents were significantly more likely than those in other wards to say that they do not
experience interference with sleeping (56%).
Comparing the findings for interference with sleep with the 1999/2000 National Survey of
Attitudes to Environmental Noise shows similar proportions saying that their sleep is
interfered with by entertainment or leisure (67%) and building construction and road works
(54% - 53% and 52% respectively in the Westminster survey). However, it is worth noting
that larger proportions of respondents in Westminster said that aircraft noise interfered with
their sleep (46% compared with 23% for the whole of England in 1999).†
Interference with using the whole house occurred particularly in the West End (45%),
Westbourne (44%) and Church Street (43%) and is very likely to be caused by neighbours
activities and building & construction (38% and 40% respectively). Similarly, residents in the
GfK NOP Social Research
West End were particularly likely to find that noise interferes with them spending time in the
home (50%).
People aged between 35 and 54 or 55 and over were significantly more likely than people
aged between 16 and 34 to say that noise interfered with them spending time in the garden
(16% and 18% compared with 12% respectively). . In contrast to some other activities at
home, residents of Abbey Road were particularly likely to say that noise interferes with their
time in the garden (27%). Residents living in Queen’s Park were also more likely to say that
noise interferes with them spending time in the garden (24%).
Four in five (82%) of Vincent Square residents who had been bothered by a noise in the last
year said that it had interfered with them having their windows or doors open.
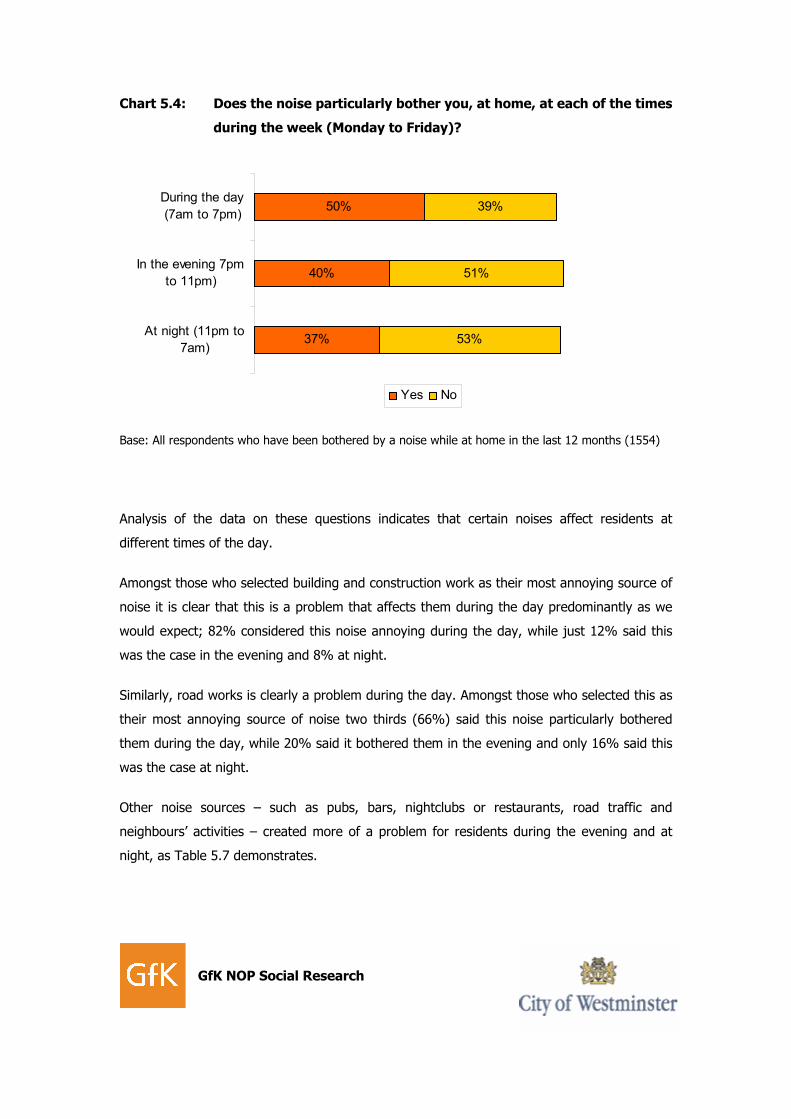
5.5 Times when noise is a problem during the week
Those respondents who said that a noise had bothered them while at home in the last 12
months were asked whether the noise source that they selected as the most annoying had
affected them at different times during the week.
Half (50%) said that the noise had affected them during the day between 7am and 7pm, two
in five (40%) had been bothered during the evening (7pm to 11pm) and a similar proportion
(37%) had been bothered during the night (11pm to 7am).
GfK NOP Social Research
Chart 5.4: Does the noise particularly bother you, at home, at each of the times
during the week (Monday to Friday)?
37%
40%
50%
53%
51%
39%
At night (11pm to
7am)
In the evening 7pm
to 11pm)
During the day
(7am to 7pm)
Yes No
Base: All respondents who have been bothered by a noise while at home in the last 12 months (1554)
Analysis of the data on these questions indicates that certain noises affect residents at
different times of the day.
Amongst those who selected building and construction work as their most annoying source of
noise it is clear that this is a problem that affects them during the day predominantly as we
would expect; 82% considered this noise annoying during the day, while just 12% said this
was the case in the evening and 8% at night.
Similarly, road works is clearly a problem during the day. Amongst those who selected this as
their most annoying source of noise two thirds (66%) said this noise particularly bothered
them during the day, while 20% said it bothered them in the evening and only 16% said this
was the case at night.
Other noise sources – such as pubs, bars, nightclubs or restaurants, road traffic and
neighbours’ activities – created more of a problem for residents during the evening and at
night, as Table 5.7 demonstrates.
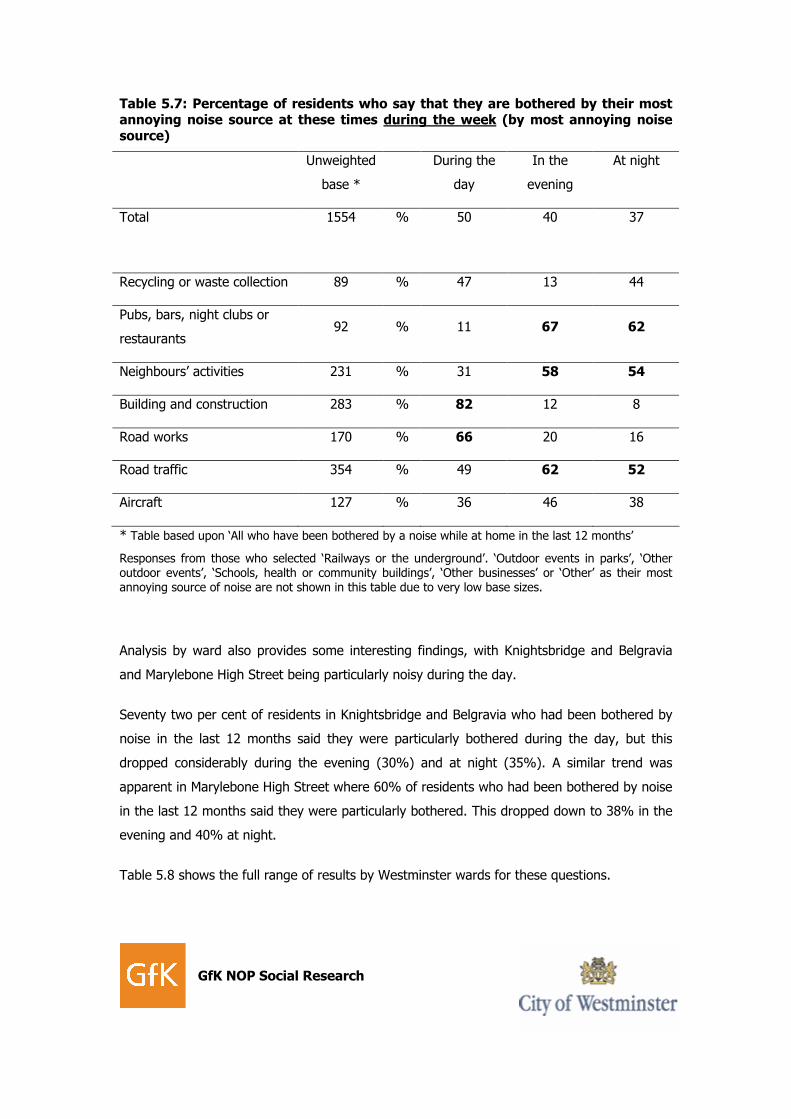
GfK NOP Social Research
Table 5.7: Percentage of residents who say that they are bothered by their most annoying noise source at these times during the week (by most annoying noise source)
Unweighted
base *
During the
day
In the
evening
At night
Total 1554 % 50 40 37
Recycling or waste collection 89 % 47 13 44
Pubs, bars, night clubs or
restaurants 92 % 11 67 62
Neighbours’ activities 231 % 31 58 54
Building and construction 283 % 82 12 8
Road works 170 % 66 20 16
Road traffic 354 % 49 62 52
Aircraft 127 % 36 46 38
* Table based upon ‘All who have been bothered by a noise while at home in the last 12 months’
Responses from those who selected ‘Railways or the underground’. ‘Outdoor events in parks’, ‘Other outdoor events’, ‘Schools, health or community buildings’, ‘Other businesses’ or ‘Other’ as their most annoying source of noise are not shown in this table due to very low base sizes.
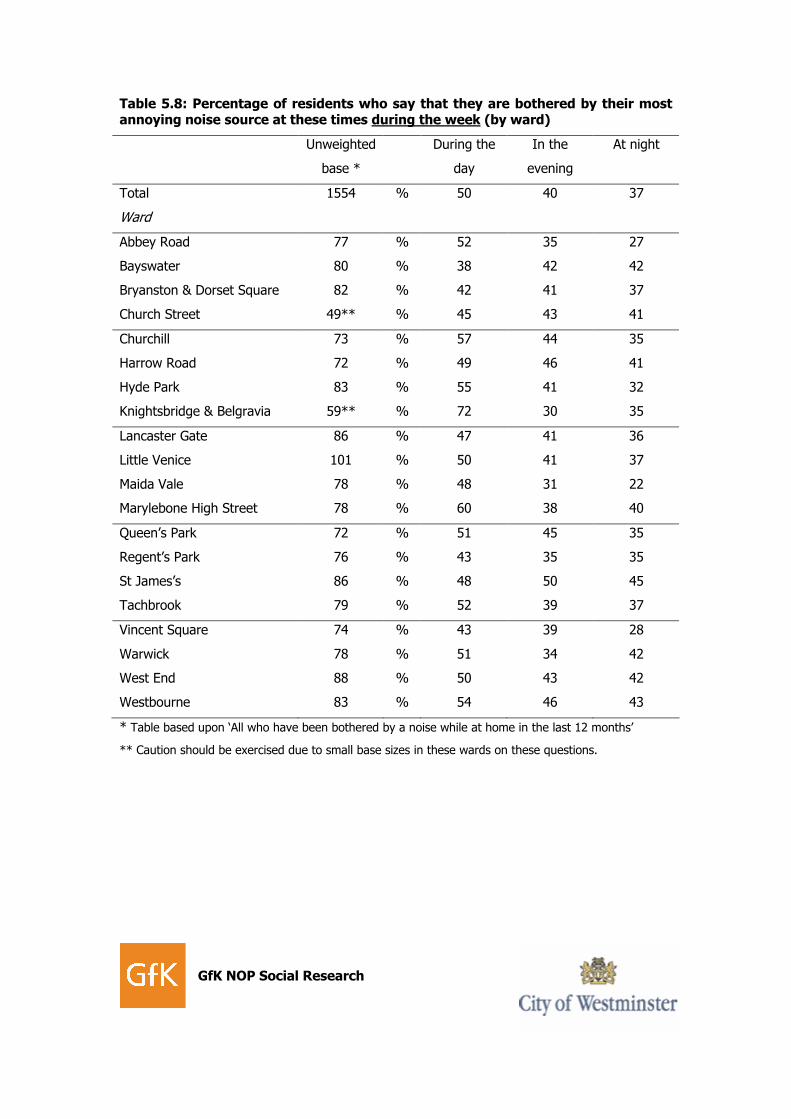
Analysis by ward also provides some interesting findings, with Knightsbridge and Belgravia
and Marylebone High Street being particularly noisy during the day.
Seventy two per cent of residents in Knightsbridge and Belgravia who had been bothered by
noise in the last 12 months said they were particularly bothered during the day, but this
dropped considerably during the evening (30%) and at night (35%). A similar trend was
apparent in Marylebone High Street where 60% of residents who had been bothered by noise
in the last 12 months said they were particularly bothered. This dropped down to 38% in the
evening and 40% at night.
Table 5.8 shows the full range of results by Westminster wards for these questions.
GfK NOP Social Research
Table 5.8: Percentage of residents who say that they are bothered by their most annoying noise source at these times during the week (by ward)
Unweighted
base *
During the
day
In the
evening
At night
Total 1554 % 50 40 37
Ward
Abbey Road 77 % 52 35 27
Bayswater 80 % 38 42 42
Bryanston & Dorset Square 82 % 42 41 37
Church Street 49** % 45 43 41
Churchill 73 % 57 44 35
Harrow Road 72 % 49 46 41
Hyde Park 83 % 55 41 32
Knightsbridge & Belgravia 59** % 72 30 35
Lancaster Gate 86 % 47 41 36
Little Venice 101 % 50 41 37
Maida Vale 78 % 48 31 22
Marylebone High Street 78 % 60 38 40
Queen’s Park 72 % 51 45 35
Regent’s Park 76 % 43 35 35
St James’s 86 % 48 50 45
Tachbrook 79 % 52 39 37
Vincent Square 74 % 43 39 28
Warwick 78 % 51 34 42
West End 88 % 50 43 42
Westbourne 83 % 54 46 43
* Table based upon ‘All who have been bothered by a noise while at home in the last 12 months’
** Caution should be exercised due to small base sizes in these wards on these questions.
GfK NOP Social Research
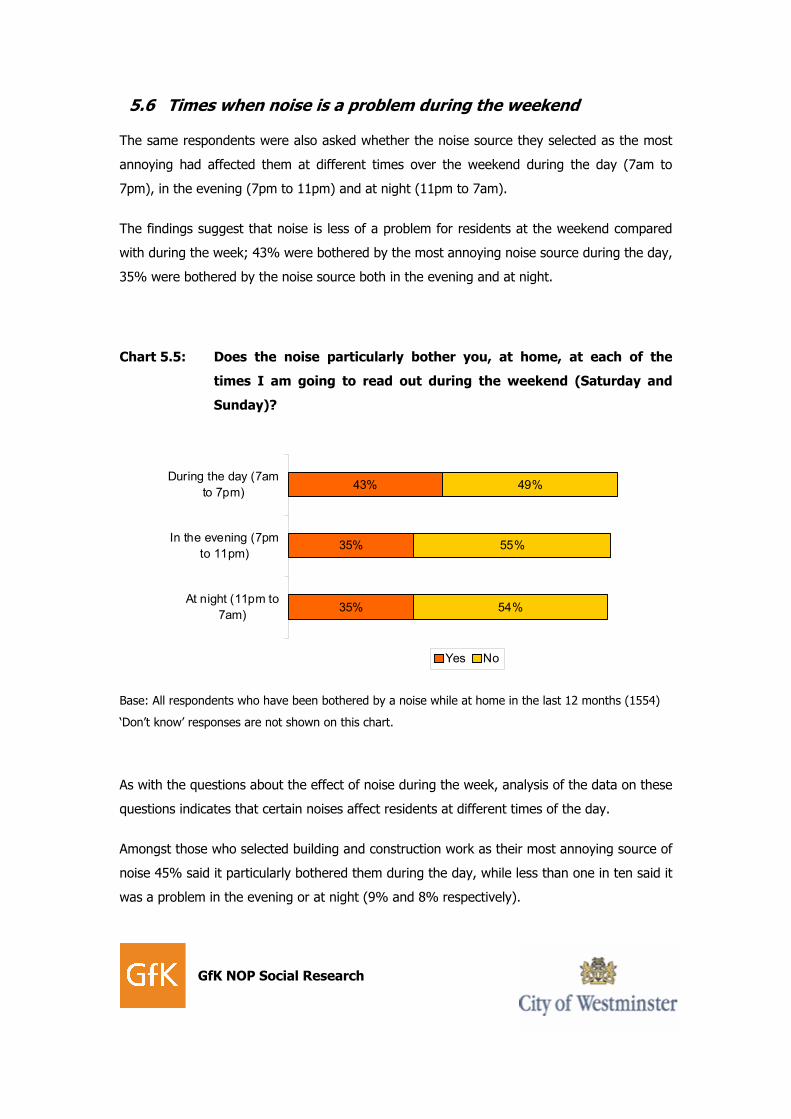
5.6 Times when noise is a problem during the weekend
The same respondents were also asked whether the noise source they selected as the most
annoying had affected them at different times over the weekend during the day (7am to
7pm), in the evening (7pm to 11pm) and at night (11pm to 7am).
The findings suggest that noise is less of a problem for residents at the weekend compared
with during the week; 43% were bothered by the most annoying noise source during the day,
35% were bothered by the noise source both in the evening and at night.
Chart 5.5: Does the noise particularly bother you, at home, at each of the
times I am going to read out during the weekend (Saturday and
Sunday)?
Base: All respondents who have been bothered by a noise while at home in the last 12 months (1554)
‘Don’t know’ responses are not shown on this chart.
As with the questions about the effect of noise during the week, analysis of the data on these
questions indicates that certain noises affect residents at different times of the day.
Amongst those who selected building and construction work as their most annoying source of
noise 45% said it particularly bothered them during the day, while less than one in ten said it
was a problem in the evening or at night (9% and 8% respectively).
35%
35%
43%
54%
55%
49%
At night (11pm to
7am)
In the evening (7pm
to 11pm)
During the day (7am
to 7pm)
Yes No
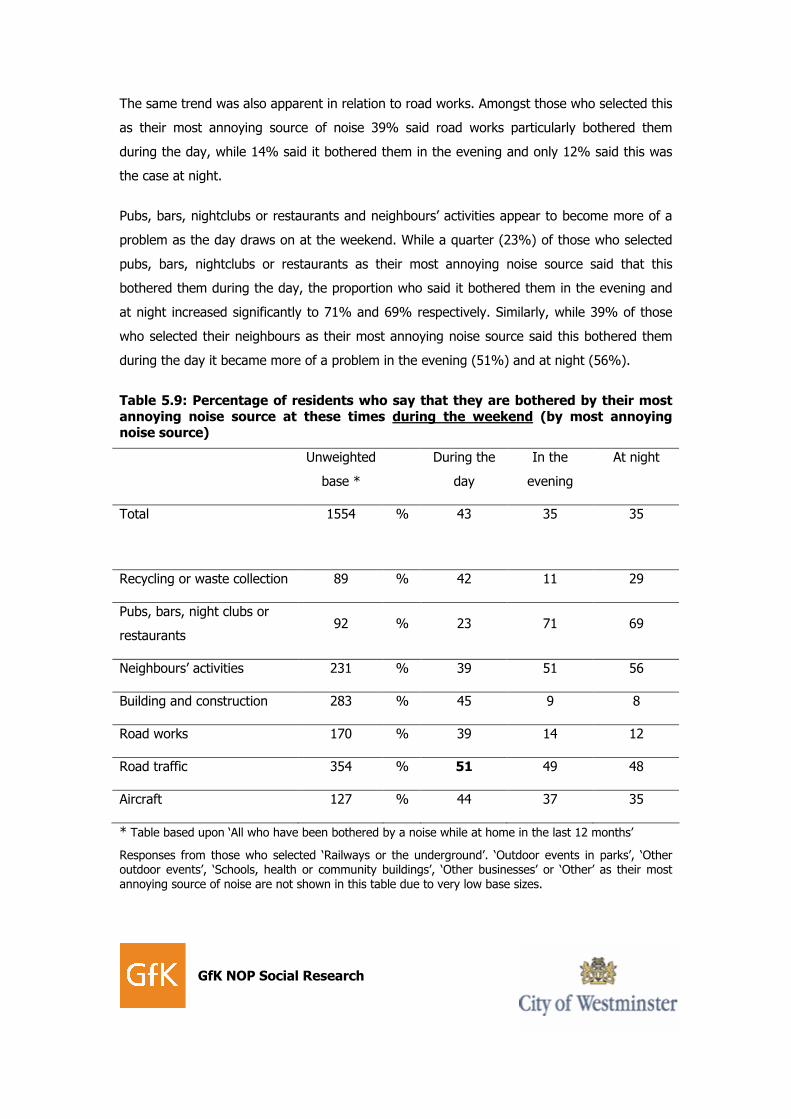
GfK NOP Social Research
The same trend was also apparent in relation to road works. Amongst those who selected this
as their most annoying source of noise 39% said road works particularly bothered them
during the day, while 14% said it bothered them in the evening and only 12% said this was
the case at night.
Pubs, bars, nightclubs or restaurants and neighbours’ activities appear to become more of a
problem as the day draws on at the weekend. While a quarter (23%) of those who selected
pubs, bars, nightclubs or restaurants as their most annoying noise source said that this
bothered them during the day, the proportion who said it bothered them in the evening and
at night increased significantly to 71% and 69% respectively. Similarly, while 39% of those
who selected their neighbours as their most annoying noise source said this bothered them
during the day it became more of a problem in the evening (51%) and at night (56%).
Table 5.9: Percentage of residents who say that they are bothered by their most annoying noise source at these times during the weekend (by most annoying noise source)
Unweighted
base *
During the
day
In the
evening
At night
Total 1554 % 43 35 35
Recycling or waste collection 89 % 42 11 29
Pubs, bars, night clubs or
restaurants 92 % 23 71 69
Neighbours’ activities 231 % 39 51 56
Building and construction 283 % 45 9 8
Road works 170 % 39 14 12
Road traffic 354 % 51 49 48
Aircraft 127 % 44 37 35
* Table based upon ‘All who have been bothered by a noise while at home in the last 12 months’
Responses from those who selected ‘Railways or the underground’. ‘Outdoor events in parks’, ‘Other outdoor events’, ‘Schools, health or community buildings’, ‘Other businesses’ or ‘Other’ as their most
annoying source of noise are not shown in this table due to very low base sizes.

GfK NOP Social Research
Analysis of the data by ward suggests that Regent’s Park was particularly noisy during the
day as 54% were bothered by their most annoying noise during this time (compared with
43% overall). St James’s was particularly noisy at night, with 45% saying they were
particularly bothered by their most annoying noise at this time (compared with 35% overall).
Table 5.10 shows the full range of findings for these questions, by ward.
Table 5.10: Percentage of residents who say that they are bothered by their most annoying noise source at these times during the week (by ward)
Unweighted
base *
During the
day
In the
evening
At night
Total 1554 % 43 35 35
Ward
Abbey Road 77 % 37 24 24
Bayswater 80 % 45 42 42
Bryanston & Dorset Square 82 % 45 35 34
Church Street 49** % 41 26 25
Churchill 73 % 46 43 35
Harrow Road 72 % 33 37 41
Hyde Park 83 % 49 37 34
Knightsbridge & Belgravia 59** % 31 26 36
Lancaster Gate 86 % 42 38 39
Little Venice 101 % 43 33 37
Maida Vale 78 % 42 39 28
Marylebone High Street 78 % 45 39 31
Queen’s Park 72 % 46 41 32
Regent’s Park 76 % 54 31 38
St James’s 86 % 40 43 45
Tachbrook 79 % 39 32 32
Vincent Square 74 % 39 30 30
Warwick 78 % 43 21 35
West End 88 % 40 33 40
Westbourne 83 % 43 42 44
* Table based upon ‘All who have been bothered by a noise while at home in the last 12 months’
** Caution should be exercised due to small base sizes in these wards on these questions.
GfK NOP Social Research
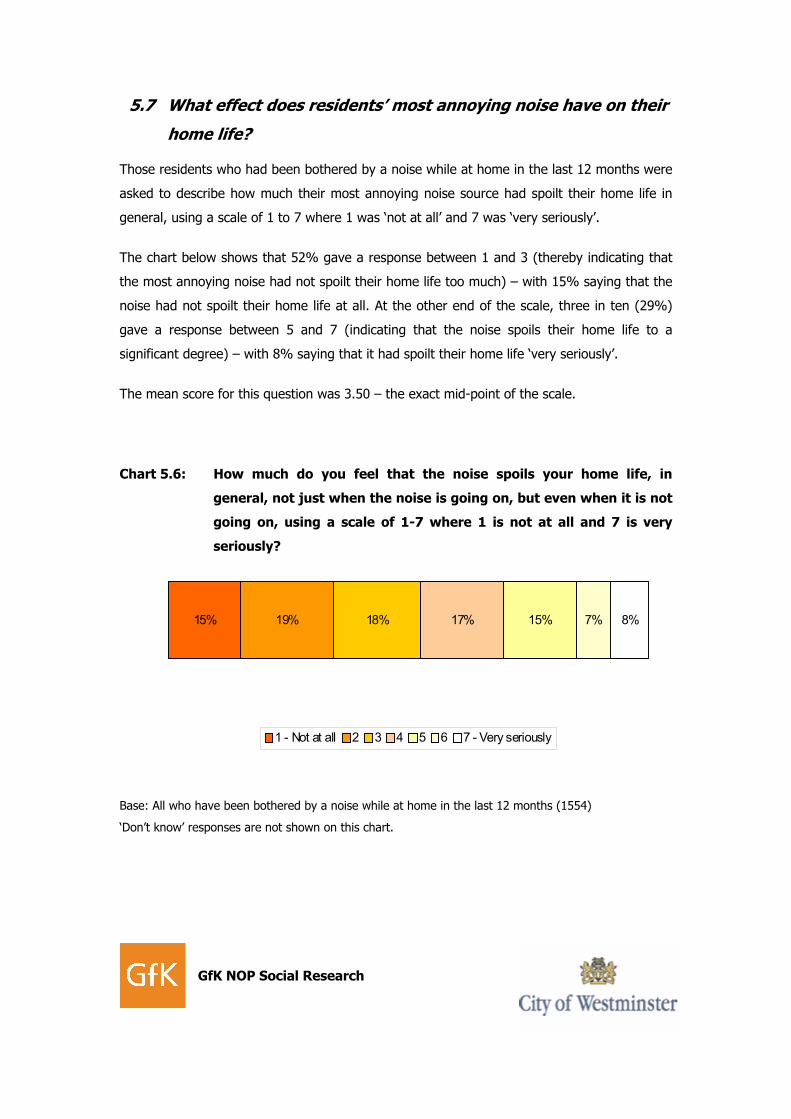
5.7 What effect does residents’ most annoying noise have on their
home life?
Those residents who had been bothered by a noise while at home in the last 12 months were
asked to describe how much their most annoying noise source had spoilt their home life in
general, using a scale of 1 to 7 where 1 was ‘not at all’ and 7 was ‘very seriously’.
The chart below shows that 52% gave a response between 1 and 3 (thereby indicating that
the most annoying noise had not spoilt their home life too much) – with 15% saying that the
noise had not spoilt their home life at all. At the other end of the scale, three in ten (29%)
gave a response between 5 and 7 (indicating that the noise spoils their home life to a
significant degree) – with 8% saying that it had spoilt their home life ‘very seriously’.
The mean score for this question was 3.50 – the exact mid-point of the scale.
Chart 5.6: How much do you feel that the noise spoils your home life, in
general, not just when the noise is going on, but even when it is not
going on, using a scale of 1-7 where 1 is not at all and 7 is very
seriously?
Base: All who have been bothered by a noise while at home in the last 12 months (1554)
‘Don’t know’ responses are not shown on this chart.
15% 19% 18% 17% 15% 7% 8%
1 - Not at all 2 3 4 5 6 7 - Very seriously
GfK NOP Social Research
The mean scores provide an overall measure of how much residents’ home lives have been
spoilt and can be used to make comparisons between sub-groups. People aged between 35
and 54 appeared to feel that their home life was spoilt to a greater degree than both younger
and older residents: the mean score for those aged 35-54 was 3.73 compared with 3.40 for
16-34 year olds and 3.41 for those aged 55+. Noise was also more of an issue for BME
residents than white residents (3.75 compared with 3.42) and DEs (3.85 compared with 3.39
amongst ABs and 3.38 amongst C1s).
Once again, it was people who considered themselves sensitive to noise who were
particularly likely to say that their home life was spoilt by noise (mean score of 3.77
compared with 3.11 amongst those who did not consider themselves sensitive to noise).
In addition, as the table below shows, there were also some differences by ward. Noise spoils
the home lives of more residents in the West End and Westbourne where of the mean scores
were 4.29 and 4.16 respectively – in both of these wards one in five residents (19%) felt that
the noise had ‘very seriously’ spoilt their home life. Other wards with significantly higher than
average mean scores were Churchill (3.98) and Little Venice (3.86).
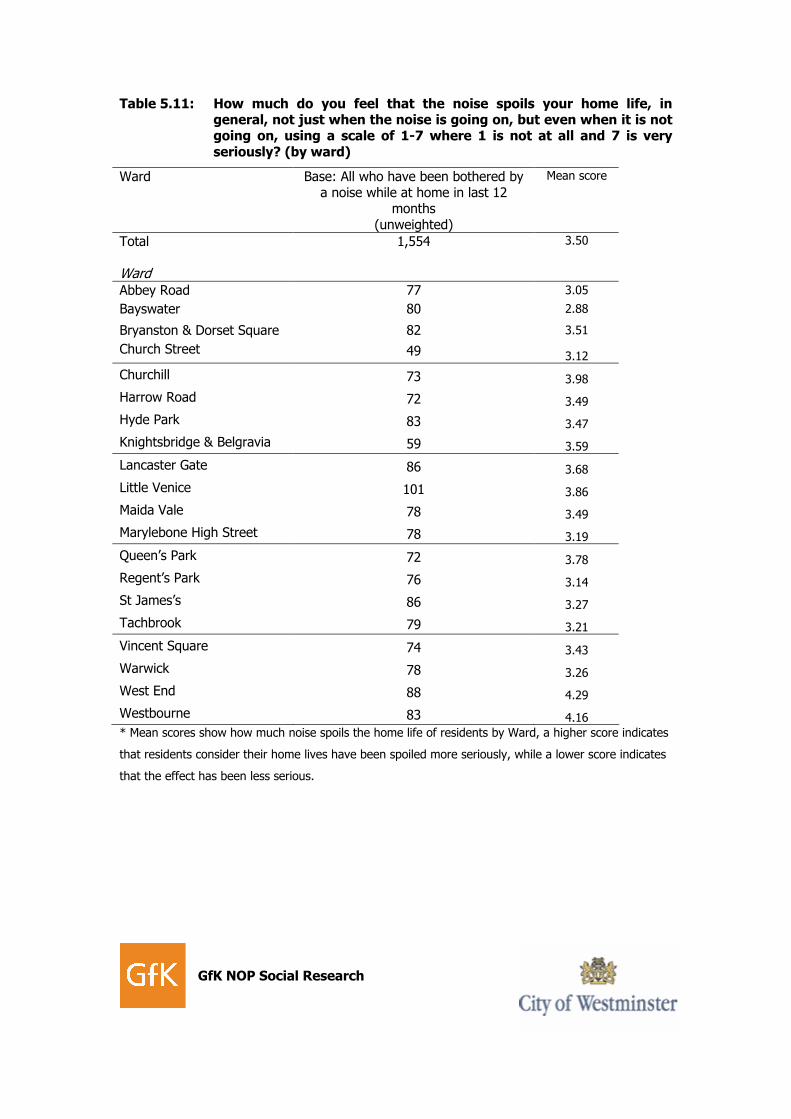
GfK NOP Social Research
Table 5.11: How much do you feel that the noise spoils your home life, in general, not just when the noise is going on, but even when it is not going on, using a scale of 1-7 where 1 is not at all and 7 is very seriously? (by ward)
Ward Base: All who have been bothered by a noise while at home in last 12
months (unweighted)
Mean score
Total 1,554 3.50
Ward
Abbey Road 77 3.05
Bayswater 80 2.88
Bryanston & Dorset Square 82 3.51
Church Street 49 3.12
Churchill 73 3.98
Harrow Road 72 3.49
Hyde Park 83 3.47
Knightsbridge & Belgravia 59 3.59
Lancaster Gate 86 3.68
Little Venice 101 3.86
Maida Vale 78 3.49
Marylebone High Street 78 3.19
Queen’s Park 72 3.78
Regent’s Park 76 3.14
St James’s 86 3.27
Tachbrook 79 3.21
Vincent Square 74 3.43
Warwick 78 3.26
West End 88 4.29
Westbourne 83 4.16
* Mean scores show how much noise spoils the home life of residents by Ward, a higher score indicates
that residents consider their home lives have been spoiled more seriously, while a lower score indicates
that the effect has been less serious.
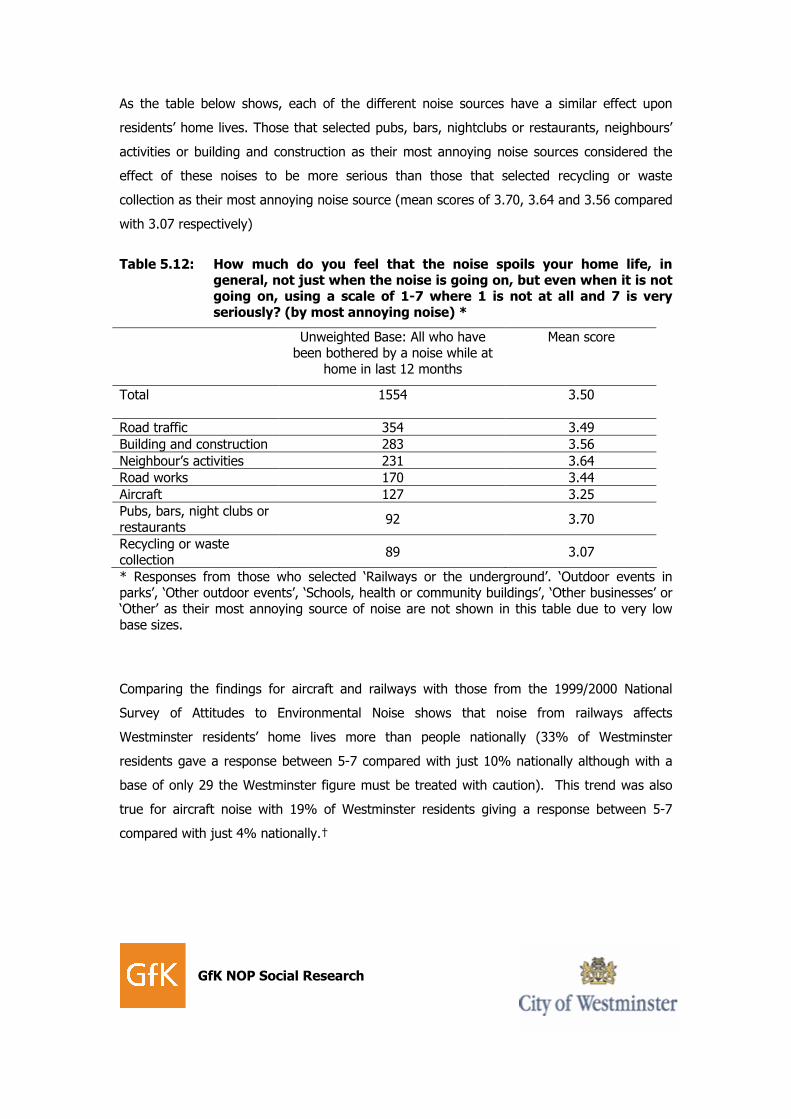
GfK NOP Social Research
As the table below shows, each of the different noise sources have a similar effect upon
residents’ home lives. Those that selected pubs, bars, nightclubs or restaurants, neighbours’
activities or building and construction as their most annoying noise sources considered the
effect of these noises to be more serious than those that selected recycling or waste
collection as their most annoying noise source (mean scores of 3.70, 3.64 and 3.56 compared
with 3.07 respectively)
Table 5.12: How much do you feel that the noise spoils your home life, in general, not just when the noise is going on, but even when it is not going on, using a scale of 1-7 where 1 is not at all and 7 is very seriously? (by most annoying noise) *
Unweighted Base: All who have been bothered by a noise while at
home in last 12 months
Mean score
Total 1554 3.50
Road traffic 354 3.49
Building and construction 283 3.56
Neighbour’s activities 231 3.64
Road works 170 3.44
Aircraft 127 3.25
Pubs, bars, night clubs or restaurants
92 3.70
Recycling or waste collection
89 3.07
* Responses from those who selected ‘Railways or the underground’. ‘Outdoor events in parks’, ‘Other outdoor events’, ‘Schools, health or community buildings’, ‘Other businesses’ or ‘Other’ as their most annoying source of noise are not shown in this table due to very low base sizes.
Comparing the findings for aircraft and railways with those from the 1999/2000 National
Survey of Attitudes to Environmental Noise shows that noise from railways affects
Westminster residents’ home lives more than people nationally (33% of Westminster
residents gave a response between 5-7 compared with just 10% nationally although with a
base of only 29 the Westminster figure must be treated with caution). This trend was also
true for aircraft noise with 19% of Westminster residents giving a response between 5-7
compared with just 4% nationally.†
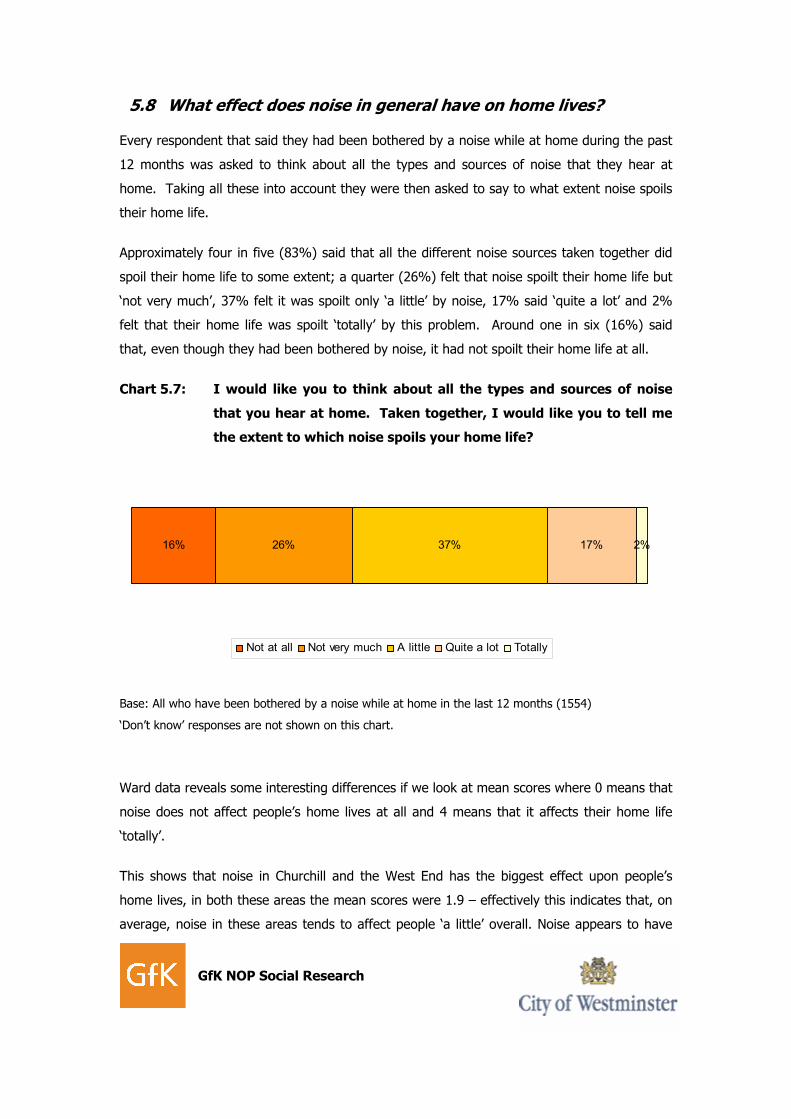
GfK NOP Social Research
5.8 What effect does noise in general have on home lives?
Every respondent that said they had been bothered by a noise while at home during the past
12 months was asked to think about all the types and sources of noise that they hear at
home. Taking all these into account they were then asked to say to what extent noise spoils
their home life.
Approximately four in five (83%) said that all the different noise sources taken together did
spoil their home life to some extent; a quarter (26%) felt that noise spoilt their home life but
‘not very much’, 37% felt it was spoilt only ‘a little’ by noise, 17% said ‘quite a lot’ and 2%
felt that their home life was spoilt ‘totally’ by this problem. Around one in six (16%) said
that, even though they had been bothered by noise, it had not spoilt their home life at all.
Chart 5.7: I would like you to think about all the types and sources of noise
that you hear at home. Taken together, I would like you to tell me
the extent to which noise spoils your home life?
16% 26% 37% 17% 2%
Not at all Not very much A little Quite a lot Totally
Base: All who have been bothered by a noise while at home in the last 12 months (1554)
‘Don’t know’ responses are not shown on this chart.
Ward data reveals some interesting differences if we look at mean scores where 0 means that
noise does not affect people’s home lives at all and 4 means that it affects their home life
‘totally’.
This shows that noise in Churchill and the West End has the biggest effect upon people’s
home lives, in both these areas the mean scores were 1.9 – effectively this indicates that, on
average, noise in these areas tends to affect people ‘a little’ overall. Noise appears to have
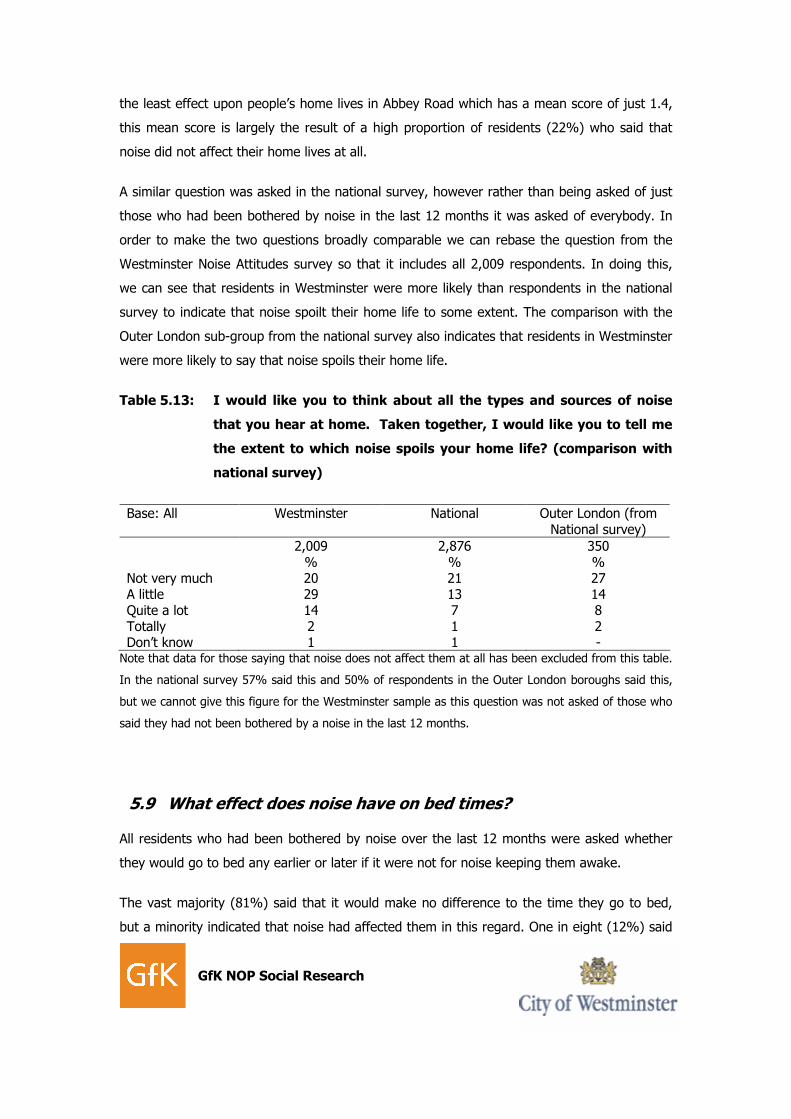
GfK NOP Social Research
the least effect upon people’s home lives in Abbey Road which has a mean score of just 1.4,
this mean score is largely the result of a high proportion of residents (22%) who said that
noise did not affect their home lives at all.
A similar question was asked in the national survey, however rather than being asked of just
those who had been bothered by noise in the last 12 months it was asked of everybody. In
order to make the two questions broadly comparable we can rebase the question from the
Westminster Noise Attitudes survey so that it includes all 2,009 respondents. In doing this,
we can see that residents in Westminster were more likely than respondents in the national
survey to indicate that noise spoilt their home life to some extent. The comparison with the
Outer London sub-group from the national survey also indicates that residents in Westminster
were more likely to say that noise spoils their home life.
Table 5.13: I would like you to think about all the types and sources of noise
that you hear at home. Taken together, I would like you to tell me
the extent to which noise spoils your home life? (comparison with
national survey)
Base: All Westminster National Outer London (from National survey)
2,009 2,876 350 % % % Not very much 20 21 27 A little 29 13 14 Quite a lot 14 7 8 Totally 2 1 2 Don’t know 1 1 -
Note that data for those saying that noise does not affect them at all has been excluded from this table.
In the national survey 57% said this and 50% of respondents in the Outer London boroughs said this,
but we cannot give this figure for the Westminster sample as this question was not asked of those who
said they had not been bothered by a noise in the last 12 months.
5.9 What effect does noise have on bed times?
All residents who had been bothered by noise over the last 12 months were asked whether
they would go to bed any earlier or later if it were not for noise keeping them awake.
The vast majority (81%) said that it would make no difference to the time they go to bed,
but a minority indicated that noise had affected them in this regard. One in eight (12%) said
GfK NOP Social Research
that if it were not for the noise keeping them awake, they would go to bed earlier and 6%
said they would go to bed later.
Chart 5.8: Would you go to bed any earlier or later if it were not for problems
with noise keeping you awake?
Base: All respondents who have been bothered by a noise in the last 12 months (1554)
Residents aged 16-34 and 35-54 were more likely than those aged 55 and over to be affected
by noise in this regard; 21% of 16-34 year olds and 19% of 35-54 year olds said that their
bed times have been affected compared with 11% of those aged 55 and over. In addition,
residents in the social grouping DE were particularly likely to have changed the time they go
to bed because of noise (24% compared with just 16% of ABs, 18% of C1s and 16% of C2s).
As would be expected, people who considered themselves sensitive to noise were more likely
to say that they had made changes to their bed times because of noise (21%) than those
who are not sensitive to noise (15%).
The table below shows differences by ward. It shows that residents of Queen’s Park were
most likely to have their bed times affected by noise (34%) with 22% saying that they would
Don't know
1% Would go to bed earlier
12%
Would go to bed later
6%
No earlier or later
makes no difference/
doesn’t apply (not
affected by noise),
81%
GfK NOP Social Research
go to bed earlier and 12% saying they would go to bed later if there were not problems with
noise keeping them awake. Three in ten (28%) Vincent Square residents had changed their
bed times because of noise, as had 27% of Harrow Road residents and a quarter (24%) of
West End residents.
The findings indicate that residents in St James’s and Knightsbridge and Belgravia were least
likely to say their bedtime would be different if it were not for noise (10% in both wards).
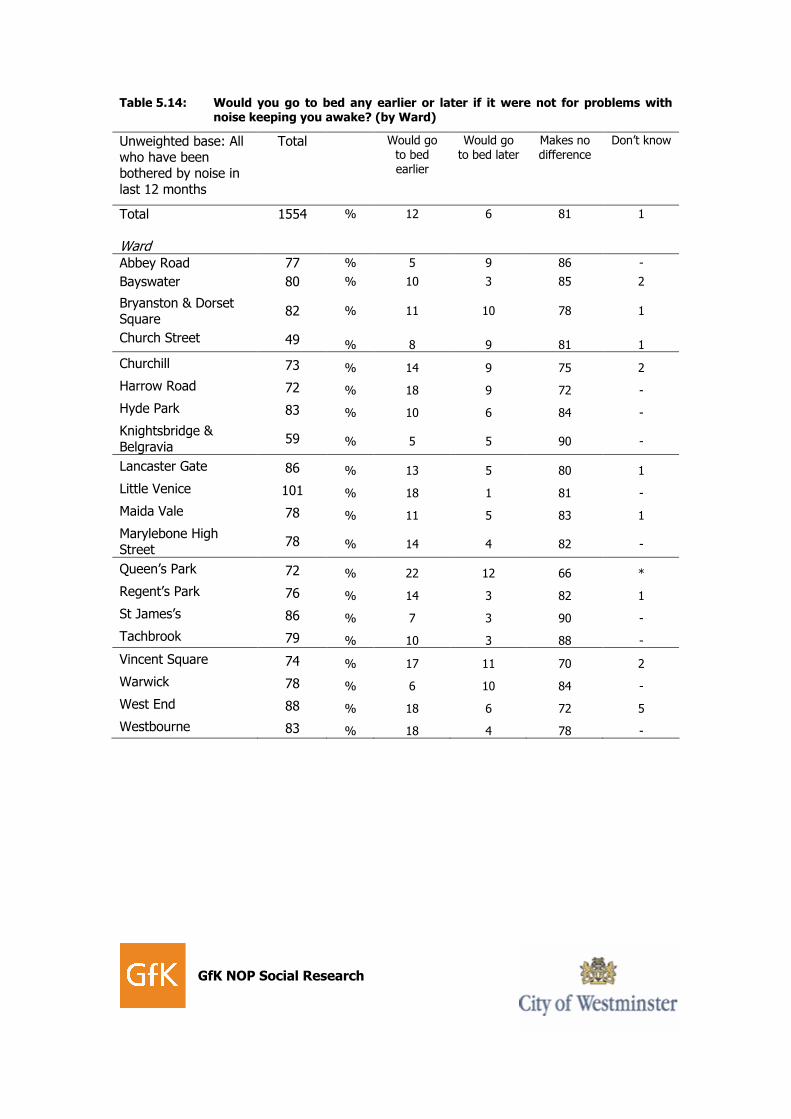
GfK NOP Social Research
Table 5.14: Would you go to bed any earlier or later if it were not for problems with noise keeping you awake? (by Ward)
Unweighted base: All who have been bothered by noise in last 12 months
Total Would go to bed earlier
Would go to bed later
Makes no difference
Don’t know
Total 1554 % 12 6 81 1
Ward
Abbey Road 77 % 5 9 86 -
Bayswater 80 % 10 3 85 2
Bryanston & Dorset Square
82 % 11 10 78 1
Church Street 49 % 8 9 81 1
Churchill 73 % 14 9 75 2
Harrow Road 72 % 18 9 72 -
Hyde Park 83 % 10 6 84 -
Knightsbridge & Belgravia
59 % 5 5 90 -
Lancaster Gate 86 % 13 5 80 1
Little Venice 101 % 18 1 81 -
Maida Vale 78 % 11 5 83 1
Marylebone High Street
78 % 14 4 82 -
Queen’s Park 72 % 22 12 66 *
Regent’s Park 76 % 14 3 82 1
St James’s 86 % 7 3 90 -
Tachbrook 79 % 10 3 88 -
Vincent Square 74 % 17 11 70 2
Warwick 78 % 6 10 84 -
West End 88 % 18 6 72 5
Westbourne 83 % 18 4 78 -
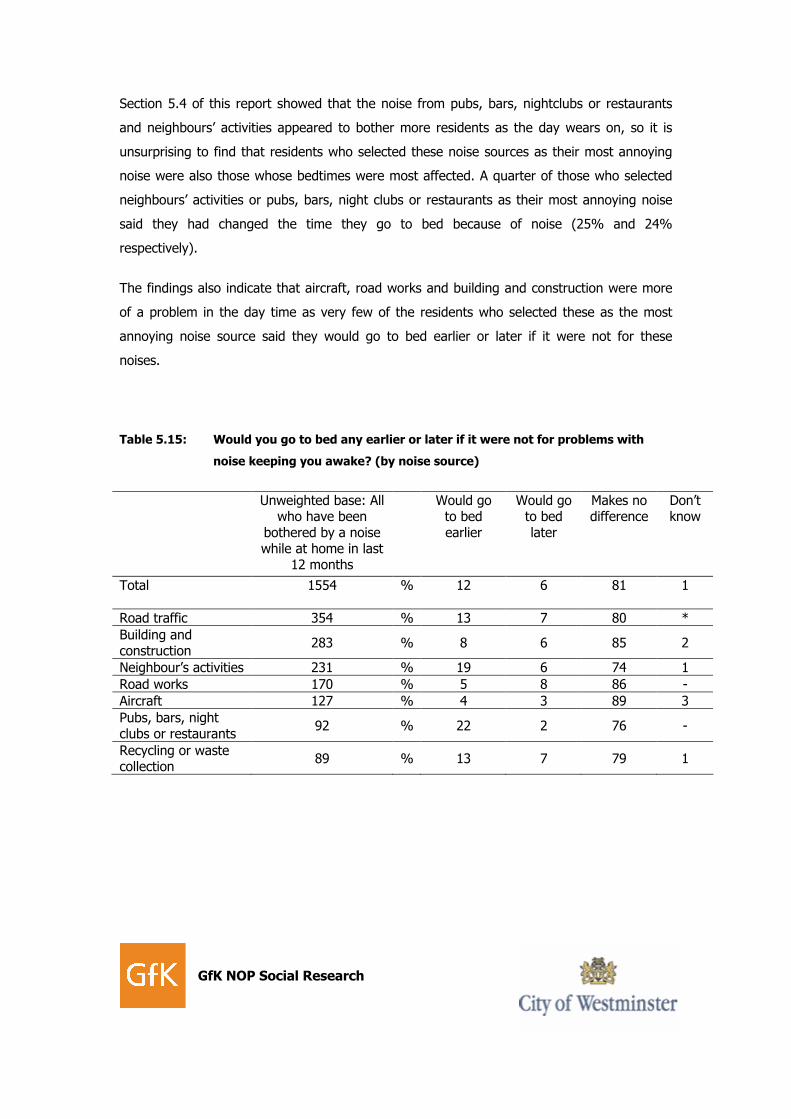
GfK NOP Social Research
Section 5.4 of this report showed that the noise from pubs, bars, nightclubs or restaurants
and neighbours’ activities appeared to bother more residents as the day wears on, so it is
unsurprising to find that residents who selected these noise sources as their most annoying
noise were also those whose bedtimes were most affected. A quarter of those who selected
neighbours’ activities or pubs, bars, night clubs or restaurants as their most annoying noise
said they had changed the time they go to bed because of noise (25% and 24%
respectively).
The findings also indicate that aircraft, road works and building and construction were more
of a problem in the day time as very few of the residents who selected these as the most
annoying noise source said they would go to bed earlier or later if it were not for these
noises.
Table 5.15: Would you go to bed any earlier or later if it were not for problems with
noise keeping you awake? (by noise source)
Unweighted base: All who have been
bothered by a noise while at home in last
12 months
Would go to bed earlier
Would go to bed later
Makes no difference
Don’t know
Total 1554 % 12 6 81 1
Road traffic 354 % 13 7 80 *
Building and construction
283 % 8 6 85 2
Neighbour’s activities 231 % 19 6 74 1
Road works 170 % 5 8 86 -
Aircraft 127 % 4 3 89 3
Pubs, bars, night clubs or restaurants
92 % 22 2 76 -
Recycling or waste collection
89 % 13 7 79 1
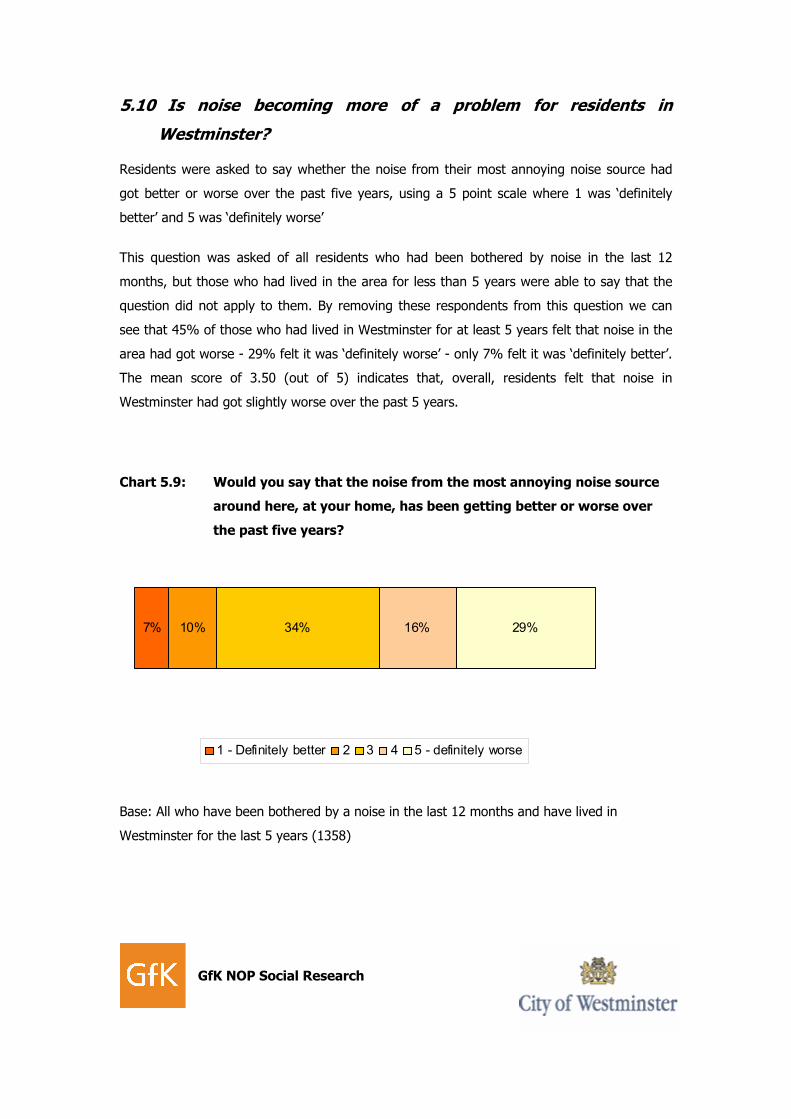
GfK NOP Social Research
5.10 Is noise becoming more of a problem for residents in
Westminster?
Residents were asked to say whether the noise from their most annoying noise source had
got better or worse over the past five years, using a 5 point scale where 1 was ‘definitely
better’ and 5 was ‘definitely worse’
This question was asked of all residents who had been bothered by noise in the last 12
months, but those who had lived in the area for less than 5 years were able to say that the
question did not apply to them. By removing these respondents from this question we can
see that 45% of those who had lived in Westminster for at least 5 years felt that noise in the
area had got worse - 29% felt it was ‘definitely worse’ - only 7% felt it was ‘definitely better’.
The mean score of 3.50 (out of 5) indicates that, overall, residents felt that noise in
Westminster had got slightly worse over the past 5 years.
Chart 5.9: Would you say that the noise from the most annoying noise source
around here, at your home, has been getting better or worse over
the past five years?
7% 10% 34% 16% 29%
1 - Definitely better 2 3 4 5 - definitely worse
Base: All who have been bothered by a noise in the last 12 months and have lived in
Westminster for the last 5 years (1358)
GfK NOP Social Research
Once again, looking at the mean scores to see the overall picture, it was residents aged 35
and over who were most negative. Amongst those aged 55+ the mean score was 3.64,
amongst those aged 35 – 54 it was 3.61 - significantly higher than the mean score of 3.36
amongst 16 – 34 year olds. There were few significant differences by ward, although Little
Venice and West End residents were particularly likely to believe that the noise has got worse
in their area (3.86 in both wards).
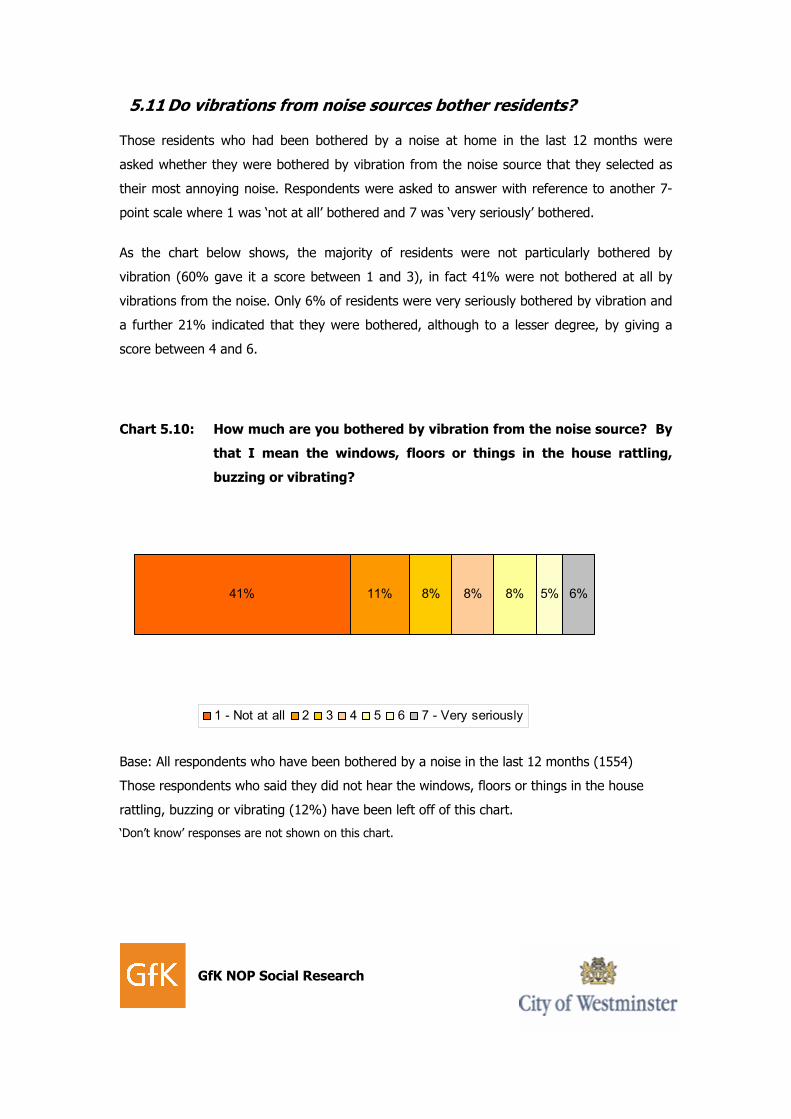
GfK NOP Social Research
5.11 Do vibrations from noise sources bother residents?
Those residents who had been bothered by a noise at home in the last 12 months were
asked whether they were bothered by vibration from the noise source that they selected as
their most annoying noise. Respondents were asked to answer with reference to another 7-
point scale where 1 was ‘not at all’ bothered and 7 was ‘very seriously’ bothered.
As the chart below shows, the majority of residents were not particularly bothered by
vibration (60% gave it a score between 1 and 3), in fact 41% were not bothered at all by
vibrations from the noise. Only 6% of residents were very seriously bothered by vibration and
a further 21% indicated that they were bothered, although to a lesser degree, by giving a
score between 4 and 6.
Chart 5.10: How much are you bothered by vibration from the noise source? By
that I mean the windows, floors or things in the house rattling,
buzzing or vibrating?
41% 11% 8% 8% 8% 5% 6%
1 - Not at all 2 3 4 5 6 7 - Very seriously
Base: All respondents who have been bothered by a noise in the last 12 months (1554)
Those respondents who said they did not hear the windows, floors or things in the house
rattling, buzzing or vibrating (12%) have been left off of this chart.
‘Don’t know’ responses are not shown on this chart.
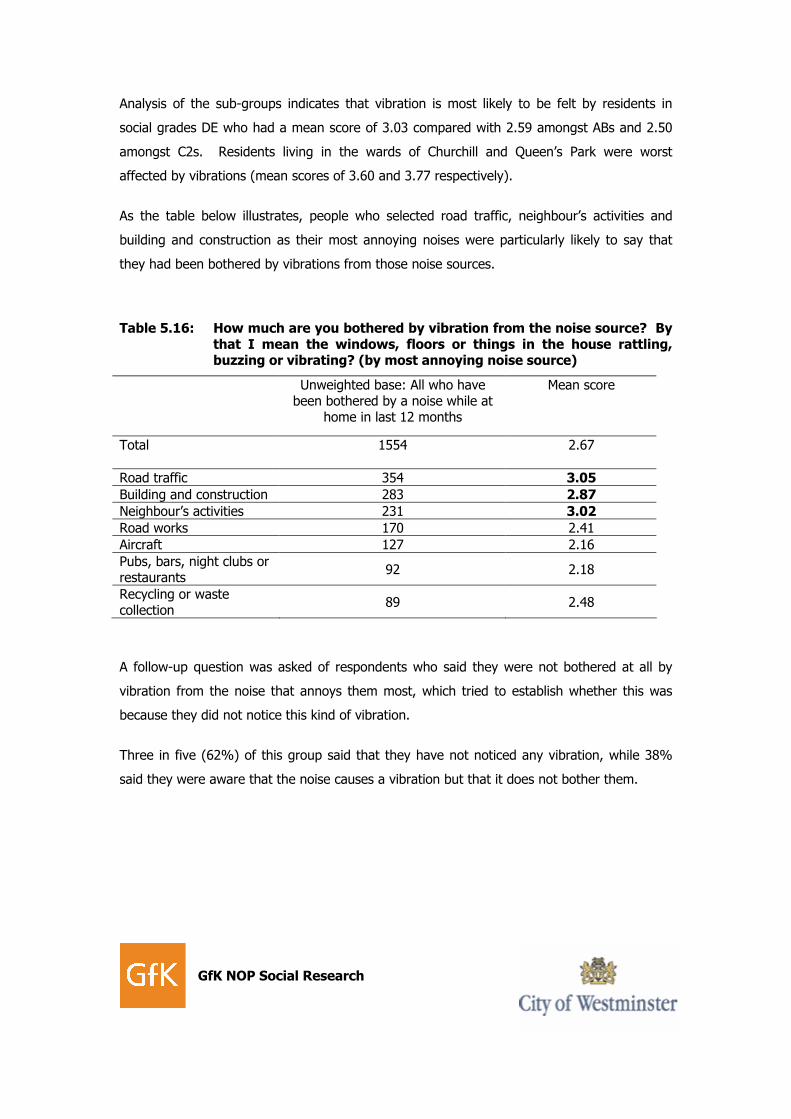
GfK NOP Social Research
Analysis of the sub-groups indicates that vibration is most likely to be felt by residents in
social grades DE who had a mean score of 3.03 compared with 2.59 amongst ABs and 2.50
amongst C2s. Residents living in the wards of Churchill and Queen’s Park were worst
affected by vibrations (mean scores of 3.60 and 3.77 respectively).
As the table below illustrates, people who selected road traffic, neighbour’s activities and
building and construction as their most annoying noises were particularly likely to say that
they had been bothered by vibrations from those noise sources.
Table 5.16: How much are you bothered by vibration from the noise source? By that I mean the windows, floors or things in the house rattling, buzzing or vibrating? (by most annoying noise source)
Unweighted base: All who have been bothered by a noise while at
home in last 12 months
Mean score
Total 1554 2.67
Road traffic 354 3.05
Building and construction 283 2.87
Neighbour’s activities 231 3.02
Road works 170 2.41
Aircraft 127 2.16
Pubs, bars, night clubs or restaurants
92 2.18
Recycling or waste collection
89 2.48
A follow-up question was asked of respondents who said they were not bothered at all by
vibration from the noise that annoys them most, which tried to establish whether this was
because they did not notice this kind of vibration.
Three in five (62%) of this group said that they have not noticed any vibration, while 38%
said they were aware that the noise causes a vibration but that it does not bother them.
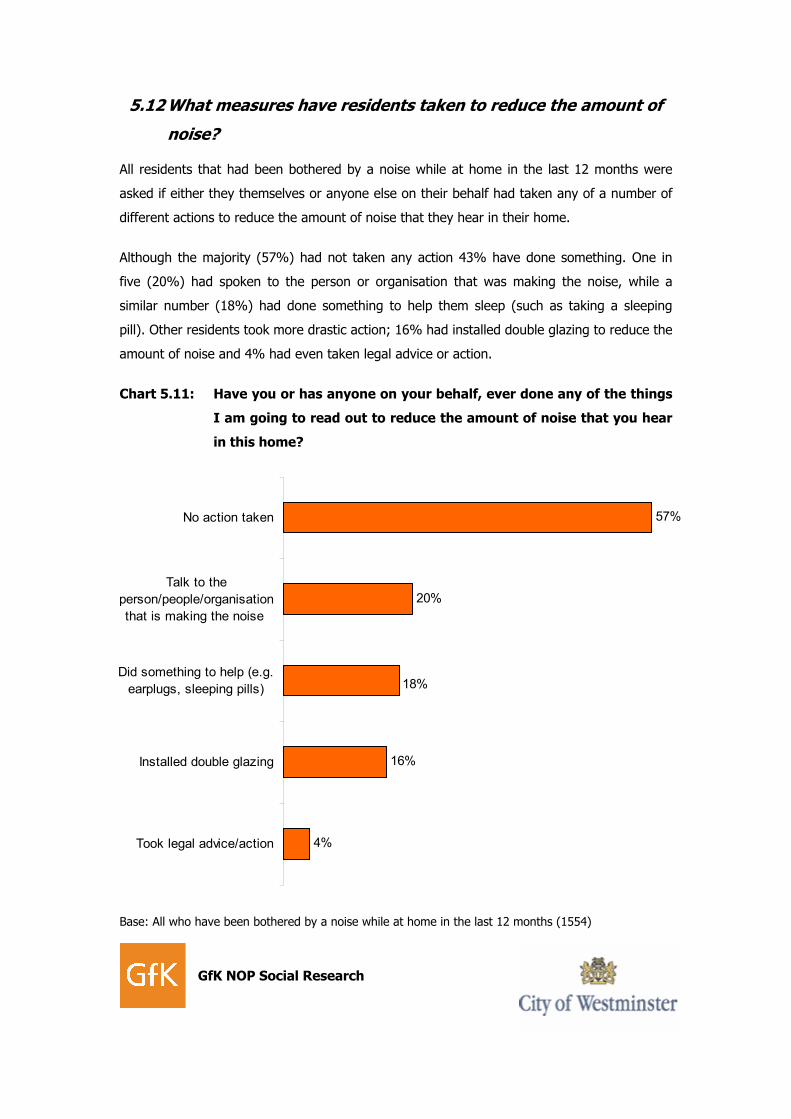
GfK NOP Social Research
5.12 What measures have residents taken to reduce the amount of
noise?
All residents that had been bothered by a noise while at home in the last 12 months were
asked if either they themselves or anyone else on their behalf had taken any of a number of
different actions to reduce the amount of noise that they hear in their home.
Although the majority (57%) had not taken any action 43% have done something. One in
five (20%) had spoken to the person or organisation that was making the noise, while a
similar number (18%) had done something to help them sleep (such as taking a sleeping
pill). Other residents took more drastic action; 16% had installed double glazing to reduce the
amount of noise and 4% had even taken legal advice or action.
Chart 5.11: Have you or has anyone on your behalf, ever done any of the things
I am going to read out to reduce the amount of noise that you hear
in this home?
Base: All who have been bothered by a noise while at home in the last 12 months (1554)
57%
20%
16%
4%
18%
No action taken
Talk to the
person/people/organisation
that is making the noise
Did something to help (e.g.
earplugs, sleeping pills)
Installed double glazing
Took legal advice/action
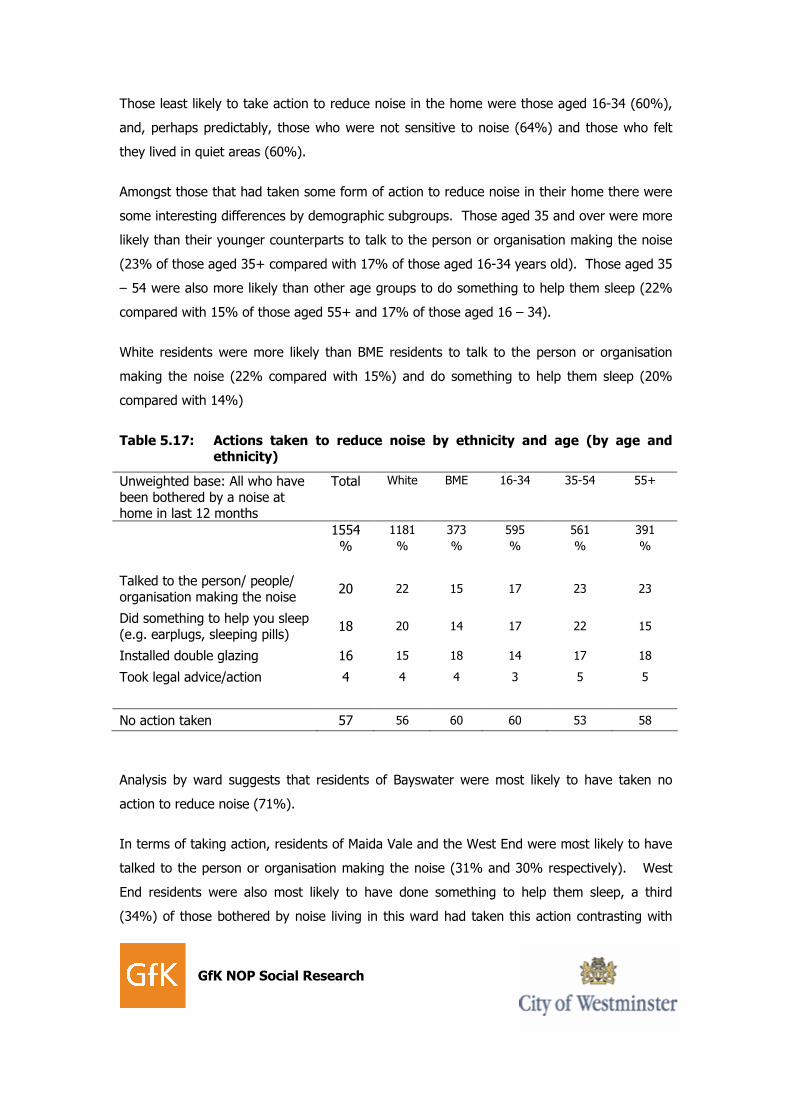
GfK NOP Social Research
Those least likely to take action to reduce noise in the home were those aged 16-34 (60%),
and, perhaps predictably, those who were not sensitive to noise (64%) and those who felt
they lived in quiet areas (60%).
Amongst those that had taken some form of action to reduce noise in their home there were
some interesting differences by demographic subgroups. Those aged 35 and over were more
likely than their younger counterparts to talk to the person or organisation making the noise
(23% of those aged 35+ compared with 17% of those aged 16-34 years old). Those aged 35
– 54 were also more likely than other age groups to do something to help them sleep (22%
compared with 15% of those aged 55+ and 17% of those aged 16 – 34).
White residents were more likely than BME residents to talk to the person or organisation
making the noise (22% compared with 15%) and do something to help them sleep (20%
compared with 14%)
Table 5.17: Actions taken to reduce noise by ethnicity and age (by age and ethnicity)
Unweighted base: All who have been bothered by a noise at home in last 12 months
Total White BME 16-34 35-54 55+
1554 1181 373 595 561 391
% % % % % %
Talked to the person/ people/ organisation making the noise
20 22 15 17 23 23
Did something to help you sleep (e.g. earplugs, sleeping pills)
18 20 14 17 22 15
Installed double glazing 16 15 18 14 17 18
Took legal advice/action 4 4 4 3 5 5
No action taken 57 56 60 60 53 58
Analysis by ward suggests that residents of Bayswater were most likely to have taken no
action to reduce noise (71%).
In terms of taking action, residents of Maida Vale and the West End were most likely to have
talked to the person or organisation making the noise (31% and 30% respectively). West
End residents were also most likely to have done something to help them sleep, a third
(34%) of those bothered by noise living in this ward had taken this action contrasting with
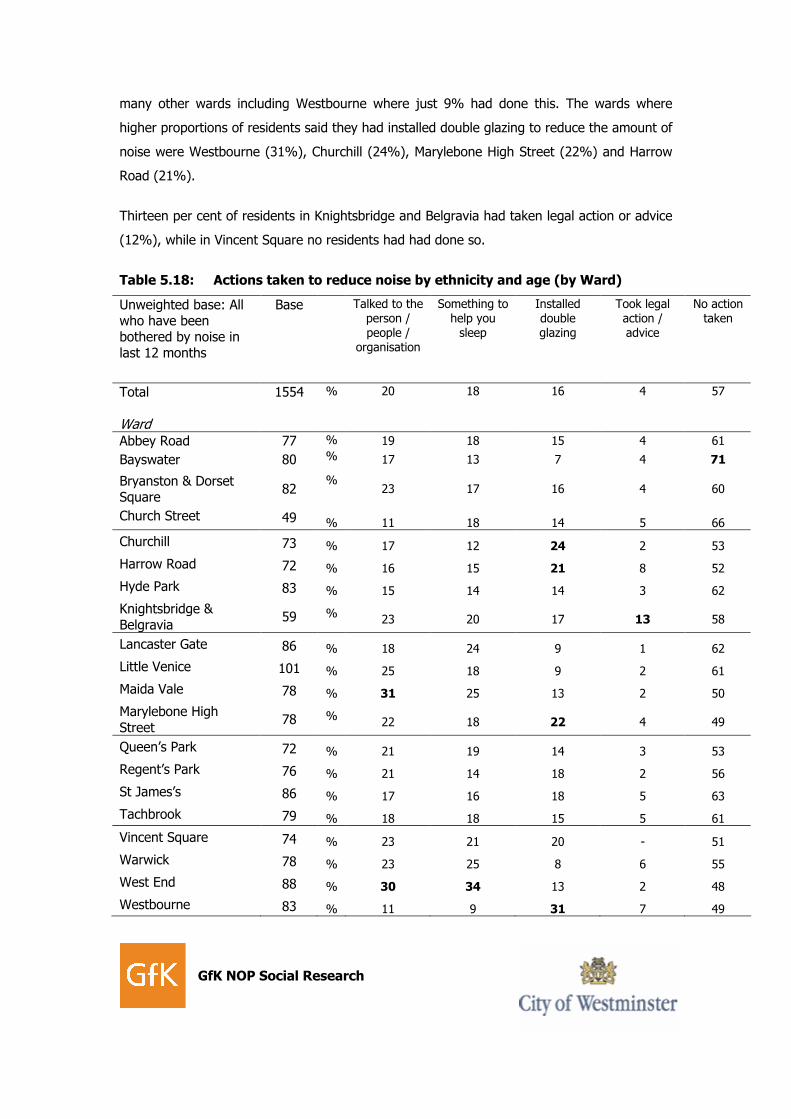
GfK NOP Social Research
many other wards including Westbourne where just 9% had done this. The wards where
higher proportions of residents said they had installed double glazing to reduce the amount of
noise were Westbourne (31%), Churchill (24%), Marylebone High Street (22%) and Harrow
Road (21%).
Thirteen per cent of residents in Knightsbridge and Belgravia had taken legal action or advice
(12%), while in Vincent Square no residents had had done so.
Table 5.18: Actions taken to reduce noise by ethnicity and age (by Ward)
Unweighted base: All who have been bothered by noise in last 12 months
Base Talked to the person / people /
organisation
Something to help you sleep
Installed double glazing
Took legal action / advice
No action taken
Total 1554 % 20 18 16 4 57
Ward
Abbey Road 77 % 19 18 15 4 61
Bayswater 80 % 17 13 7 4 71
Bryanston & Dorset Square
82 %
23 17 16 4 60
Church Street 49 % 11 18 14 5 66
Churchill 73 % 17 12 24 2 53
Harrow Road 72 % 16 15 21 8 52
Hyde Park 83 % 15 14 14 3 62
Knightsbridge & Belgravia
59 % 23 20 17 13 58
Lancaster Gate 86 % 18 24 9 1 62
Little Venice 101 % 25 18 9 2 61
Maida Vale 78 % 31 25 13 2 50
Marylebone High Street
78 % 22 18 22 4 49
Queen’s Park 72 % 21 19 14 3 53
Regent’s Park 76 % 21 14 18 2 56
St James’s 86 % 17 16 18 5 63
Tachbrook 79 % 18 18 15 5 61
Vincent Square 74 % 23 21 20 - 51
Warwick 78 % 23 25 8 6 55
West End 88 % 30 34 13 2 48
Westbourne 83 % 11 9 31 7 49

GfK NOP Social Research
5.13 How effective were the measures taken to reduce noise?
Those respondents that had been bothered by a noise while at home in the last 12 months
and had taken action to reduce the amount of noise they hear in their home were asked how
effective those actions had been.
Three quarters (73%) had enjoyed some success as a result of their actions. A half (50%)
said their actions had been ‘somewhat effective’ and a quarter (24%) said that the actions
they had taken had been ‘very effective’. However, just over a quarter (27%) said that their
actions to reduce noise heard in their home had been ineffective.
Chart 5.12: And how effective were the actions?
Not effective ,
27%
Somewhat
effective, 50%
Very effective ,
24%
Base: All who have taken action to reduce the amount of noise they hear in their home (672)
It is interesting to look at how effective each of the actions that were taken were. As the
table below indicates that actions involving relating the problem to another party, either by
talking to the person or organisation responsible or in terms of legal help were not as
effective as measures that the individual on their own could effect such as taking a sleeping
pill or installing double glazing.
For instance, 32% of those who had installed double glazing felt this action had been ‘very
effective’ and a further 51% felt it had been ‘somewhat effective’. Similarly, 26% of those
who had done something to help them sleep felt this course of action had been ‘very
effective’ and 51% felt it was ‘somewhat effective’.

GfK NOP Social Research
In comparison, just 16% of those who had actually spoken to the person or organisation
making the noise felt that it was ‘very effective’ and 44% felt it was ‘somewhat effective’. The
base size for those who took legal action or advice was small (62) so the findings from this
group should only be taken as indicative. However, they do suggest that this was the least
effective course of action as only 11% felt that this was ‘very effective’.
Table 5.19: Effectiveness of actions by type of action taken
Total Action taken
Base: All who have taken action to reduce the amount of noise they hear in their home
Talked to person/org
Something to help sleep
Installed double glazing
Legal advice/ action
672 328 288 249 62
Not effective 27 40 22 17 37
Somewhat effective 50 44 51 51 52
Very effective 24 16 26 32 11
5.14 Formal complaints about noise
As well as asking residents whether they had taken any actions to reduce the amount of
noise they hear the survey also asked if they, or anyone on their behalf, had complained to
any of a list of various bodies about the amount of noise that they hear in their home.
The majority (78%) of this group said that they had not made any complaints at all.
Amongst the 22% that had complained, the most frequently mentioned channel via which to
complain was Westminster Council’s 24 hour Noise Team. Approximately one in eight (13%)
of those that had been bothered by noise in their home during the last year had used this
service and a further 1% had complained via another Department within the Council. Six per
cent had gone so far as to complain to the police, 5% had complained to City West Homes or
another housing association landlord and 2% had complained to an MP or councillor.
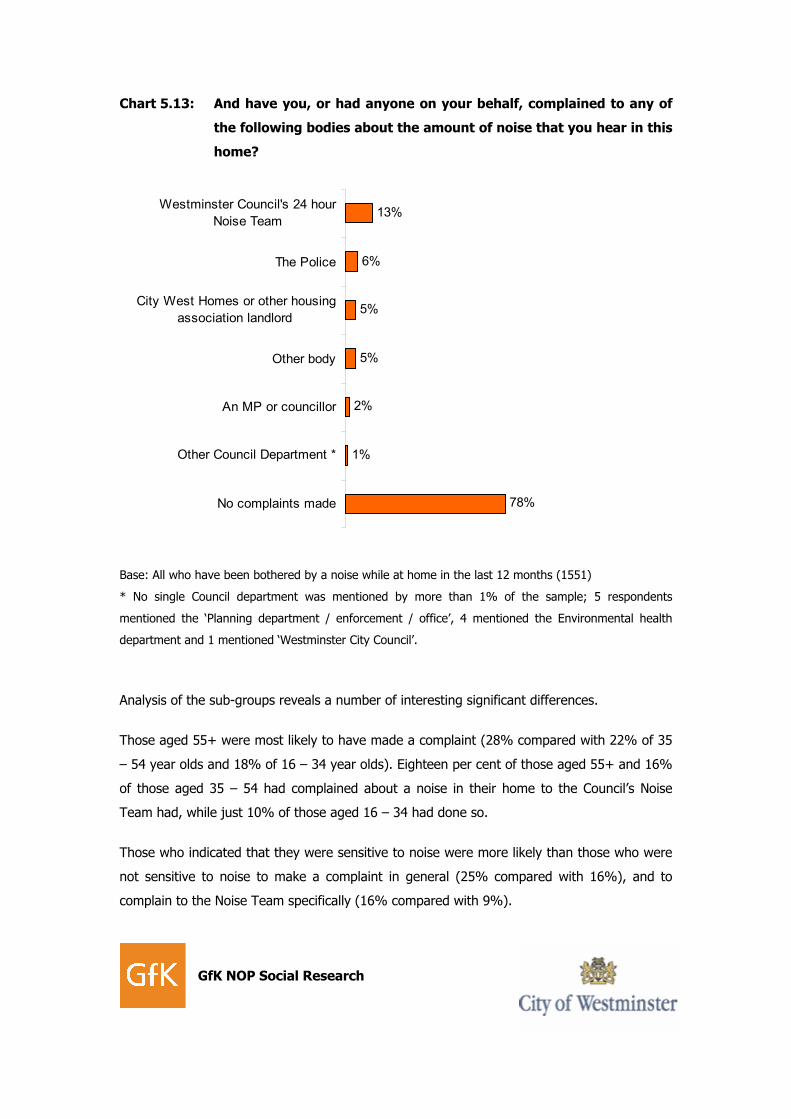
GfK NOP Social Research
Chart 5.13: And have you, or had anyone on your behalf, complained to any of
the following bodies about the amount of noise that you hear in this
home?
13%
6%
5%
5%
2%
1%
78%
Westminster Council's 24 hour
Noise Team
The Police
City West Homes or other housing
association landlord
Other body
An MP or councillor
Other Council Department *
No complaints made
Base: All who have been bothered by a noise while at home in the last 12 months (1551)
* No single Council department was mentioned by more than 1% of the sample; 5 respondents
mentioned the ‘Planning department / enforcement / office’, 4 mentioned the Environmental health
department and 1 mentioned ‘Westminster City Council’.
Analysis of the sub-groups reveals a number of interesting significant differences.
Those aged 55+ were most likely to have made a complaint (28% compared with 22% of 35
– 54 year olds and 18% of 16 – 34 year olds). Eighteen per cent of those aged 55+ and 16%
of those aged 35 – 54 had complained about a noise in their home to the Council’s Noise
Team had, while just 10% of those aged 16 – 34 had done so.
Those who indicated that they were sensitive to noise were more likely than those who were
not sensitive to noise to make a complaint in general (25% compared with 16%), and to
complain to the Noise Team specifically (16% compared with 9%).

GfK NOP Social Research
Table 5.20: Complaints to bodies about noise heard in the home (by age and
sensitivity to noise)
Total Age Sensitivity to noise
Base: All who have been bothered by a noise while at home in the last 12 months
16-34 35-54 55+ Sensitive Not sensitive
1554 595 561 391 940 604
% % % % % %
Westminster Council’s 24 hour Noise Team
13 10 16 18 16 9
The Police 6 5 6 6 7 4
City West Homes or other housing association landlord
5 3 7 5 5 3
An MP or councillor 2 1 3 3 3 1
Other Council Department 1 1 1 * 1 1
Other body 5 4 5 1 6 4
No complaints made 78 82 77 71 74 84
Analysis of the data by ward indicates that residents in St James’s and the West End (both
23%) were most likely to complain to the Council’s Noise Team, this contrasts with Queen’s
Park (6%), Bayswater (6%), Abbey Road (7%), Hyde Park (10%), Regent’s Park (10%) and
Lancaster Gate (11%) where residents were less likely to contact the Noise Team.
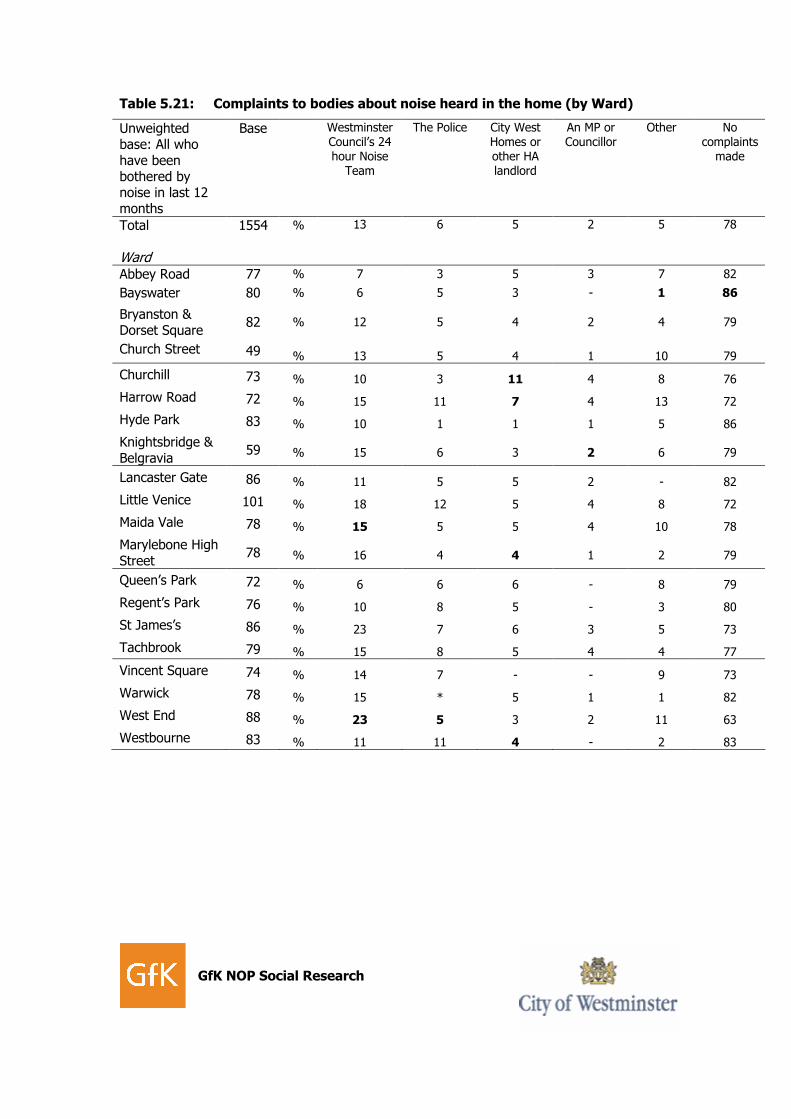
GfK NOP Social Research
Table 5.21: Complaints to bodies about noise heard in the home (by Ward)
Unweighted base: All who have been bothered by noise in last 12 months
Base Westminster Council’s 24 hour Noise
Team
The Police City West Homes or other HA landlord
An MP or Councillor
Other No complaints
made
Total 1554 % 13 6 5 2 5 78
Ward
Abbey Road 77 % 7 3 5 3 7 82
Bayswater 80 % 6 5 3 - 1 86
Bryanston & Dorset Square
82 % 12 5 4 2 4 79
Church Street 49 % 13 5 4 1 10 79
Churchill 73 % 10 3 11 4 8 76
Harrow Road 72 % 15 11 7 4 13 72
Hyde Park 83 % 10 1 1 1 5 86
Knightsbridge & Belgravia
59 % 15 6 3 2 6 79
Lancaster Gate 86 % 11 5 5 2 - 82
Little Venice 101 % 18 12 5 4 8 72
Maida Vale 78 % 15 5 5 4 10 78
Marylebone High Street
78 % 16 4 4 1 2 79
Queen’s Park 72 % 6 6 6 - 8 79
Regent’s Park 76 % 10 8 5 - 3 80
St James’s 86 % 23 7 6 3 5 73
Tachbrook 79 % 15 8 5 4 4 77
Vincent Square 74 % 14 7 - - 9 73
Warwick 78 % 15 * 5 1 1 82
West End 88 % 23 5 3 2 11 63
Westbourne 83 % 11 11 4 - 2 83
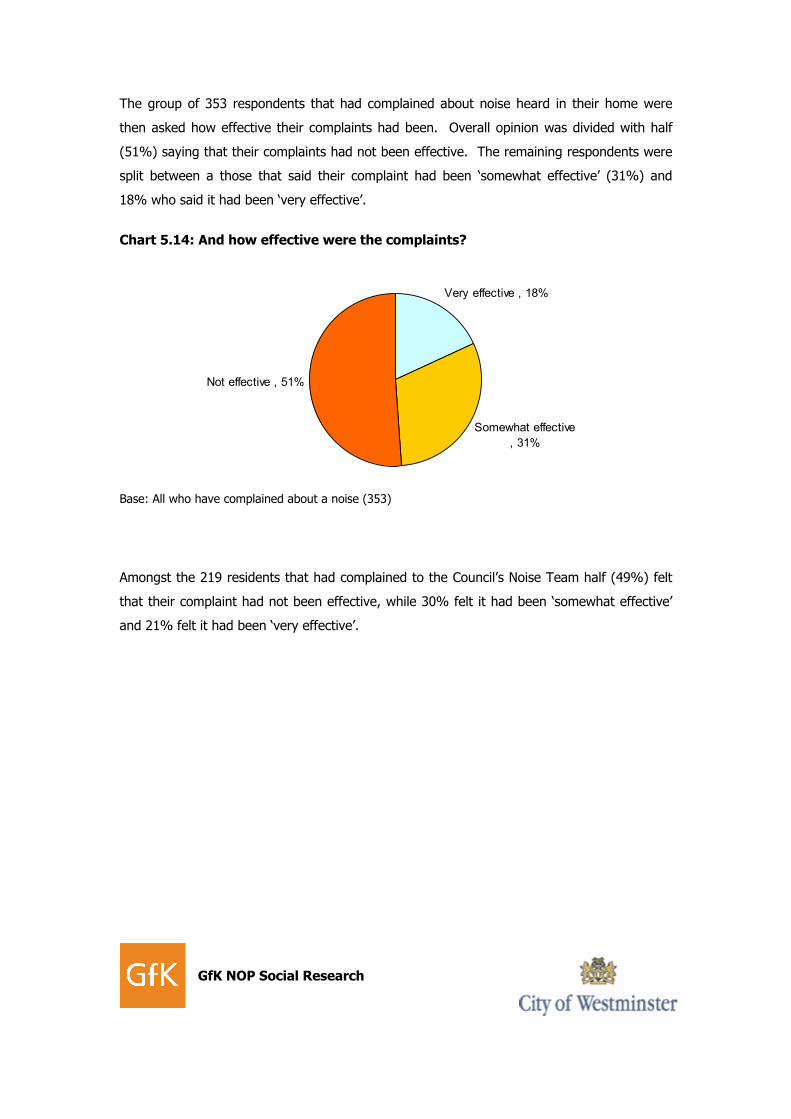
GfK NOP Social Research
The group of 353 respondents that had complained about noise heard in their home were
then asked how effective their complaints had been. Overall opinion was divided with half
(51%) saying that their complaints had not been effective. The remaining respondents were
split between a those that said their complaint had been ‘somewhat effective’ (31%) and
18% who said it had been ‘very effective’.
Chart 5.14: And how effective were the complaints?
Somewhat effective
, 31%
Very effective , 18%
Not effective , 51%
Base: All who have complained about a noise (353)
Amongst the 219 residents that had complained to the Council’s Noise Team half (49%) felt
that their complaint had not been effective, while 30% felt it had been ‘somewhat effective’
and 21% felt it had been ‘very effective’.
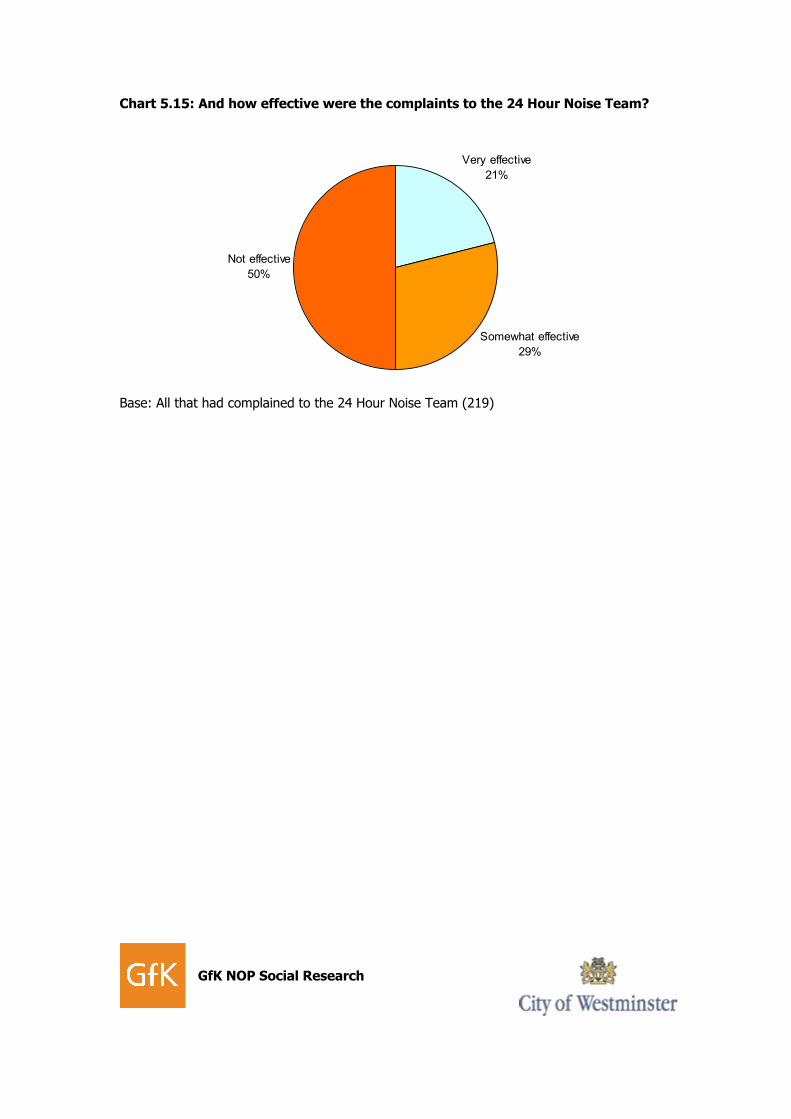
GfK NOP Social Research
Chart 5.15: And how effective were the complaints to the 24 Hour Noise Team?
Very effective
21%
Somewhat effective
29%
Not effective
50%
Base: All that had complained to the 24 Hour Noise Team (219)
GfK NOP Social Research
6 Conclusions
The research suggests that the majority of people living in Westminster were generally happy
with the area they were living in and greater numbers said their area was quiet rather than
noisy. However, noise does appear to be a growing concern for a substantial number of
residents and it is telling that when asked to think about their worst noise source over the
past five years, residents were more likely to say it had got worse than better during that
time.
One of the key issues to be addressed then, where possible, is the effect that noise has on
the home lives of residents in Westminster. A high majority of residents had been bothered
by noise at home in the past 12 months and a significant majority of this group said that
noise heard at home spoiled their home life to some extent. For around one in five their
home life was spoilt either a lot or, indeed, totally by noise. These people reported various
interferences with their everyday lives and activities that had been changed as a result of the
noise they had experienced in their homes. Noise at home had, for a substantial proportion,
interfered with how often they opened windows and doors, their patterns of sleeping and
resting, concentrating and reading, and a whole range of other home activities that were
mentioned.
The degree to which the noise affects residents is to some extent dependant on the time of
day when that noise occurs and the time of the week also. Noise in the daytime and evening
appears to be a greater problem on weekdays than at weekends but it is worth noting that
noises during the night are viewed as being equally affecting for both weekdays and
weekends.
The most frequently mentioned sources of noise that had bothered people at home in the last
12 months were: road traffic noise, noise from building and construction work, road works,
neighbour’s activities either inside or outside their home and aircraft noise (including that
from helicopters). Clearly some of these noise sources are more easily addressed than others
in terms of reducing the impact of them.
What is clear from the research however, is that where individuals had been proactive in
attempting to take action to reduce the level of noise that had bothered them in their home
the result was frequently positive. Three out of four residents that took action themselves to
reduce noise heard in their home said their actions had been effective to some degree.

GfK NOP Social Research
The research does indicate however that where the impact of the noise had resulted in those
affected going forward to make a complaint the outcome of that process is not always a
positive one. Half of those that had complained about noise heard in their home said that
their complaints had not been effective, while a third said that their complaint had been
somewhat effective and only seventeen per cent that said it had been very effective. It is
worth noting however that the most frequently mentioned destination for complaints about
noise was Westminster Council’s 24 Hour Noise Team and that, according to residents views,
this Team appears to be significantly more effective at positively dealing with complaints than
other departments within the Council.
The research results when analysed by wards within Westminster indicate that some noise is
perceived as a much greater problem in some wards than others. For example the wards of
Westbourne, West End, St James and Churchill repeatedly appear to be worse affected by
some of the aspects of noise problems than other wards. The challenge for Westminster as a
whole is how to address these localised problems in a borough with such a diverse mix of
housing types, demographic make up and commercial use.
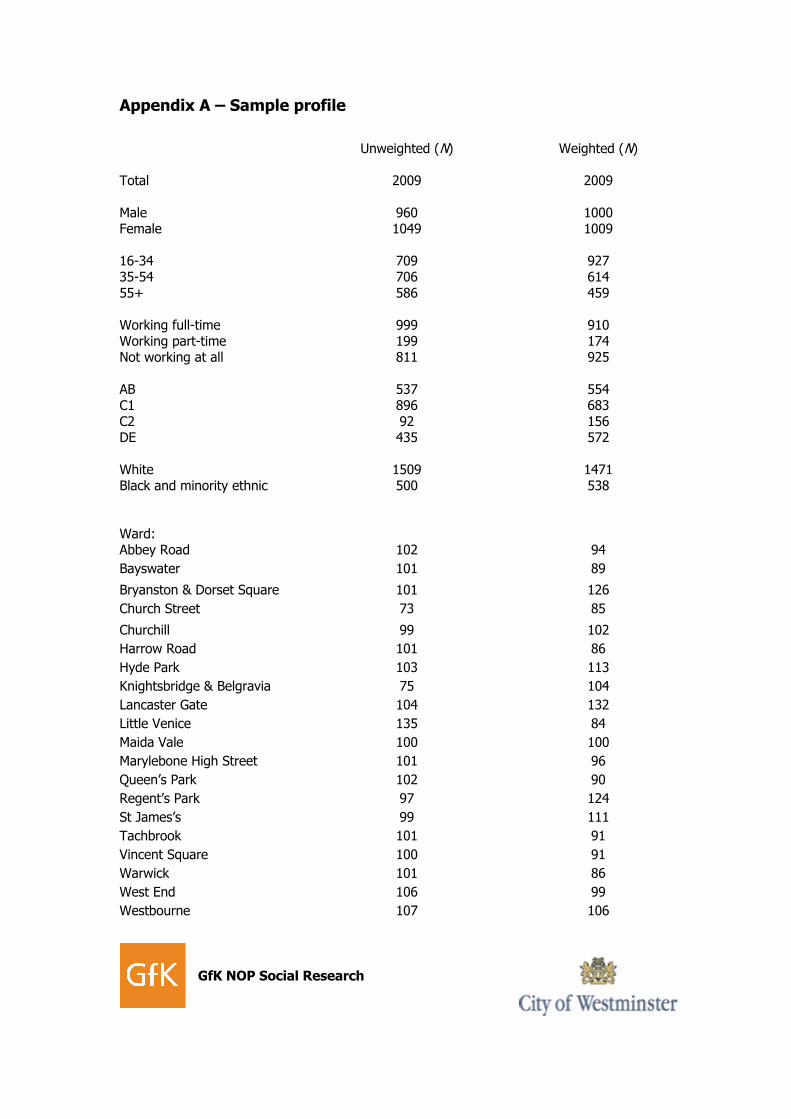
GfK NOP Social Research
Appendix A – Sample profile
Unweighted (N) Weighted (N) Total 2009 2009 Male 960 1000 Female 1049 1009 16-34 709 927 35-54 706 614 55+ 586 459 Working full-time 999 910 Working part-time 199 174 Not working at all 811 925 AB 537 554 C1 896 683 C2 92 156 DE 435 572 White 1509 1471 Black and minority ethnic 500 538 Ward: Abbey Road 102 94
Bayswater 101 89
Bryanston & Dorset Square 101 126
Church Street 73 85
Churchill 99 102
Harrow Road 101 86
Hyde Park 103 113
Knightsbridge & Belgravia 75 104
Lancaster Gate 104 132
Little Venice 135 84
Maida Vale 100 100
Marylebone High Street 101 96
Queen’s Park 102 90
Regent’s Park 97 124
St James’s 99 111
Tachbrook 101 91
Vincent Square 100 91
Warwick 101 86
West End 106 99
Westbourne 107 106
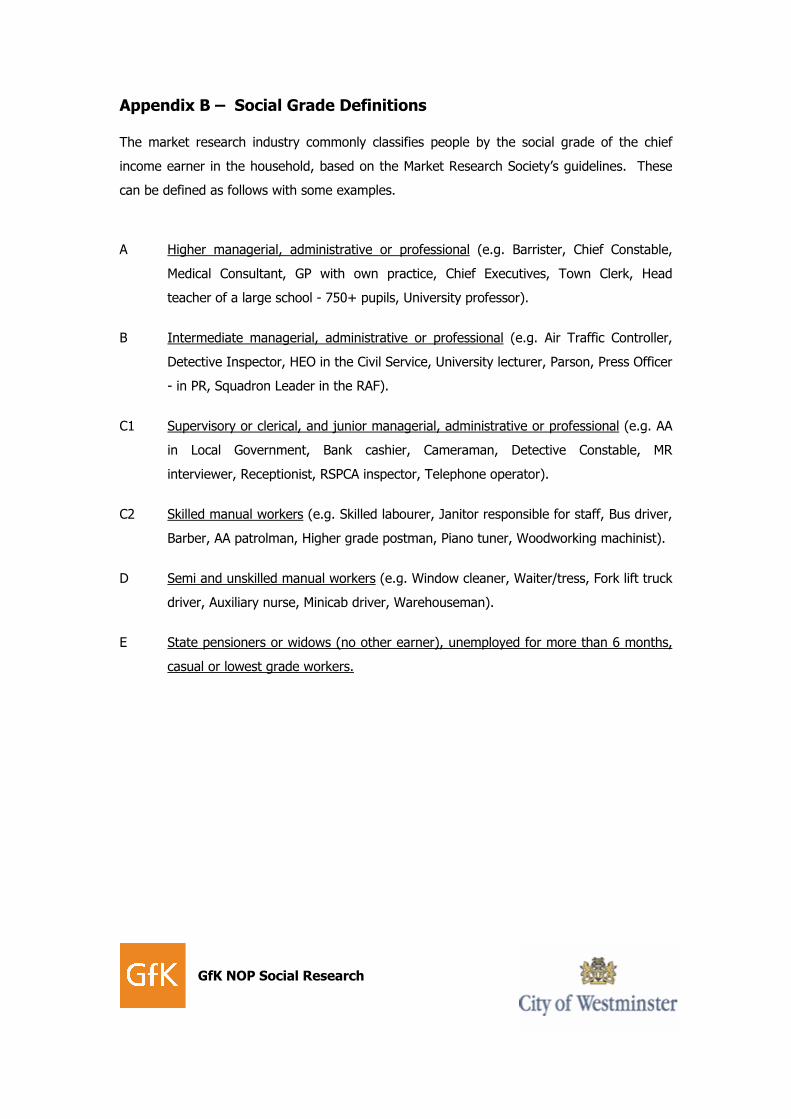
GfK NOP Social Research
Appendix B – Social Grade Definitions The market research industry commonly classifies people by the social grade of the chief
income earner in the household, based on the Market Research Society’s guidelines. These
can be defined as follows with some examples.
A Higher managerial, administrative or professional (e.g. Barrister, Chief Constable,
Medical Consultant, GP with own practice, Chief Executives, Town Clerk, Head
teacher of a large school - 750+ pupils, University professor).
B Intermediate managerial, administrative or professional (e.g. Air Traffic Controller,
Detective Inspector, HEO in the Civil Service, University lecturer, Parson, Press Officer
- in PR, Squadron Leader in the RAF).
C1 Supervisory or clerical, and junior managerial, administrative or professional (e.g. AA
in Local Government, Bank cashier, Cameraman, Detective Constable, MR
interviewer, Receptionist, RSPCA inspector, Telephone operator).
C2 Skilled manual workers (e.g. Skilled labourer, Janitor responsible for staff, Bus driver,
Barber, AA patrolman, Higher grade postman, Piano tuner, Woodworking machinist).
D Semi and unskilled manual workers (e.g. Window cleaner, Waiter/tress, Fork lift truck
driver, Auxiliary nurse, Minicab driver, Warehouseman).
E State pensioners or widows (no other earner), unemployed for more than 6 months,
casual or lowest grade workers.
GfK NOP Social Research
Appendix C – Questionnaire
Westminster Noise Attitude Survey
Good morning/afternoon/evening. My name is … from GfK NOP Ltd the independent research agency. We are carrying out an important survey on behalf of Westminster City Council amongst its residents about the areas people live in. Everything you say will be held by GfK NOP in confidence and no other party, including Westminster City Council will know that we spoke to you. QA Firstly to check which Ward of Westminster you live in, can I have you full postcode? REPEAT WITH PHONETIC ALPHABET TO ENSURE ACCURACY. IF NOT IN THE DATABASE THANK AND CLOSE Q1. I’d like to start by asking a few questions about yourself so that we can classify the results of this survey. Firstly, what was your age at your last birthday? ENTER REF IF REFUSED Q1b. Which of the following age categories do you fit into? 16-18 19-24 25-34 35-44 45-54 55-64 Over 65 REF Q2. INTERVIEWER CODE GENDER Male Female Q3a. And how would you describe your ethnic background? Would you say you are …READ OUT. CODE ONE ONLY. White GO TO Q3b Asian or Asian British GO TO Q3c Black or Black British GO TO Q3d Mixed GO TO Q3e Other Ethnic Group GO TO Q3f

GfK NOP Social Research
IF WHITE Q3b Are you.. READ OUT CODE 1 ONLY English Scottish Welsh Northern Irish Irish Eastern European (Specify) Western European (Specify Any other white background (Specify) IF ASIAN OR ASIAN BRITISH Q3c Are you.. READ OUT CODE 1 ONLY Indian Pakistani Bangladeshi Any other Asian background (Specify) IF BLACK OR BLACK BRITISH Q3d Are you… READ OUT AND CODE 1 ONLY Black British Caribbean African Any other Black background (Specify) IF MIXED Q3e Are you… READ OUT CODE 1 ONLY White and Black Caribbean White and Black African White and Asian Black & Asian Black & Chinese Chinese & White Any other mixed background (Specify) IF OTHER Q3f Are you… READ OUT CODE 1 ONLY Arab Chinese Any other background (Specify) ASK ALL Q4. Are you working full or part-time or not working? Full-time Part-time Not working
GfK NOP Social Research
Q5. Using a scale of 1 to 7 where 1 is Definitely like and 7 is Definitely don’t like, on the whole, how much do you like living in this area? 1 Definitely like 2 3 4 5 6 7 Definitely don’t like DK Q6. Is there anything you particularly like about this area, that is within a 5 minute walk of your home? Any mention of quietness/freedom from noise or sources of noise/peacefulness Any mention of sounds/noises that are liked Other Nothing DK Q7. Is there anything you particularly dislike about this area, that is within a 5 minute walk of your home? Any mention of noise not liked/noise effects/lack of peace and quiet Any mention of sources of noises not liked (specify) Any mention of quietness/freedom from noise not liked Other Nothing DK IF 2 CODED AT Q7. OTHERS GO TO Q9. Q8. You mentioned that you dislike (specified answer at code 2 above). Is that because of noise? Yes Yes to some sources if more than one mentioned Yes to all sources if more than one mentioned No to all sources DK Q9. And your home in particular, what are the things you like about living in this home? Any mention of quietness/freedom from noise or sources of noise/peacefulness Any mention of sounds/noises that are liked Other Nothing DK
GfK NOP Social Research
Q10. Is there anything you dislike about living in this particular home? Any mention of noise not liked/noise effects/lack of peace and quiet Any mention of sources of noises not liked (specify) Any mention of quietness/freedom from noise not liked Other Nothing DK IF 2 CODED AT Q10. OTHERS GO TO Q12. Q11. You mentioned that you dislike (specified answer at code 2 above). Is that because of noise? Yes Yes to some sources if more than one mentioned Yes to all sources if more than one mentioned No to all sources DK Q12. I am going to read out a list of environmental problems. As I read them out please tell me whether you are personally affected by each READ OUT ROTATE Yes/No/DK Noisy neighbours or loud parties Rubbish and litter lying around Abandoned or burnt out cars Vandalism, graffiti and other deliberate damage Dog fouling Lack of street lighting Poor air quality Not enough green or open spaces Noise from pubs, clubs and restaurants Rats, mice and pests DO NOT READ None DO NOT READ DK IF MORE THAN 3 CHOSEN AT Q12. OTHERS GO TO Q14. Q13. You said (RESPONSES TO Q12). Which 3 would you say you are personally most affected by? ONLY SHOW THOSE CHOSEN AT Q12. Q14. In general how noisy is it around here, using a scale of 1 to 7 where 1 is very quiet and 7 is very noisy? 1 Very quiet 2 3 4 5 6 7 Very noisy DK

GfK NOP Social Research
IF 4-7 AT Q14. OTHERS GO TO Q16. Q15. To what extent are you bothered by the level of noise around here, using a scale of 1 to 7 where 1 = Not bothered, annoyed or disturbed at all and 7 = extremely bothered, annoyed or disturbed? 1 Not bothered 2 3 4 5 6 7 Extremely bothered DK Q16. How sensitive would you say you are to noise, again using a scale of 1 to 7, this time where 1 = Not at all sensitive and 7 = Very sensitive? 1 Not at all sensitive 2 3 4 5 6 7 Very sensitive DK Q17. In the last 12 months while you have been at home (either in your home or outside it in the garden or on the balcony if you have one) which of the following have bothered you because of the noise they make? READ OUT ROTATE BUT ALWAYS KEEP 3 & 4 TOGETHER AND ALWAYS KEEP 5 – 7 TOGETHER. Yes/No/DK 1. Railways or the underground? 2. Recycling or waste collection? 3. Outdoor events in parks? 4. Other outdoor events (not in parks)? 5. Pubs, bars, night clubs or restaurants? 6. Schools, health or Community buidings? 7. Other businesses (shops, offices or workspaces)? 8. Neighbours’ activities inside or outside their homes? 9. Building and construction? 10. Road works? 11. Road traffic noise? 12. Aircraft, including helicopters? ALWAYS READ LAST. 13. Other noises that we have not already mentioned? (SPECIFY) IF NONE CODED GO TO INTRO BEFORE Q36. IF 1 TO 3 MENTIONS CODED GO TO Q19. IF 4-14 MENTIONS CODED ASK Q18.
GfK NOP Social Research
ALL WITH 4 OR MORE MENTIONS CODED AT Q17. Q18. And which three of these MOST bothers you personally when you are at home because of the noise they make? IF NECESSARY READ OUT LIST BELOW. LIST OF ALL TYPES OF NOISES CODED AT Q17. CODE 3 MAX. ASK ALL EXCEPT ‘NONE’ AT Q17 Q19. (IF 2 OR MORE MENTIONED AT Q17: For each of the sources of noise you have mentioned) to what extent are you are bothered by the noise. READ OUT NOISE SOURCE AND CODE FOR EACH ONE
Noise source 1 Noise source 2 Noise source 3 Extremely Very Moderately A little IF TWO OR THREE HAVE THE SAME CODES ASK Q20. OTHERS GO TO Q21. Q20. You said (NOISE SOURCES) were (ANSWER TO Q18 annoying or disturbing). Which of them bothers you the most? IF NECESSARY And which is the next most annoying or disturbing? Noise source 1 Noise source 2 Noise source 3 ISOLATE MOST ANNOYING NOISE SOURCE EITHER FROM Q19 OR Q20 (THE MOST ANNOYING). Q21 You said noise from (NOISE SOURCE) bothered you personally when you are at home, the most. Is there any particular noise from (NOISE SOURCE) that you personally feel bothered by. OPEN. PROBE FULLY FOR DETAILED NOISE SOURCE IF APPLICABLE. RECORD UP TO 3 SPECIFIC SOURCES OF NOISE. ALLOW NULL. ASK FOR MOST ANNOYING NOISE SOURCES 3, 4, 5, 6, 7, 9 AND 10. ALL OTHERS GO TO Q23. Q22. You have said (NOISE SOURCE) is the noise that most bothers you the most. Is the problem mainly from (NOISE SOURCE) itself, or because of people coming or going from (NOISE SOURCE) Mainly the source itself Mainly people coming & going Both about the same DK/NA
GfK NOP Social Research
Q23. And does the noise from (NOISE SOURCE) interfere with any of the following aspects of your home life (READ OUT EACH). ROTATE. Yes/No/DK Listening to TV, radio, music Having a conversation (including on the telephone) Reading, writing or other quiet activities Concentrating Sleeping Resting Using the whole house Spending time in the garden (If applicable) Having the windows or doors open Having guests or visitors Spending time in the home Q24. And does the noise from (NOISE SOURCE) particularly bother you, at home at each of the times I am going to read out during the week (Monday to Friday)? Yes/No/Not at home at that time/DK During the day (7am to 7pm) In the evening (7pm to 11pm) At night (11pm to 7am) DO NOT READ No particular time DO NOT READ Varies DO NOT READ Don’t know Q25. And does the noise from (NOISE SOURCE) particularly bother you at home at each of the times I am going to read out during the weekend (Saturday and Sunday)? Yes/No/Not at home at that time/DK During the day (7am to 7pm) In the evening (7pm to 11pm) At night (11pm to 7am) DO NOT READ No particular time DO NOT READ Varies DO NOT READ Don’t know Q26. How much do you feel that noise from (NOISE SOURCE) spoils your home life, in general, not just when the noise is going on, but even when it is not going on, using a scale of 1-7 where 1 is not at all and 7 is very seriously. 1 Not at all 2 3 4 5 6 7 Very seriously Don’t hear DK
GfK NOP Social Research
Q27. Would you say that the noise from (NOISE SOURCE) around here, at your home, has been getting better or worse over the past five years? Please use a scale of 1-5 where 1 = definitely better and 5 = definitely worse. 1 definitely better 2 3 4 5 definitely worse N/A have not lived here for five years DK Q28. How much are you bothered by vibration from (NOISE SOURCE)? By that I mean the windows, floors or things in the house rattling, buzzing or vibrating? Please use a scale of 1-7 where 1= not at all and 7 = very seriously. 1 Not at all 2 3 4 5 6 7 Very seriously Don’t hear DK IF NOT AT ALL (CODE 1 AT Q28) Q28b Is that because you do not notice this kind of vibration? Yes, don’t notice No, I do notice but not bothered at all by the vibration Q29. Have you, or has anyone on your behalf, ever done any of the things I am going to read out to reduce the amount of noise from (NOISE SOURCE) that you hear in this home? CODE ALL THAT APPLY Talked to the person / people / organisation that is making the noise Installed double glazing Did something to help you sleep (e.g. earplugs, sleeping pills) Took legal advice/action DO NOT READ No action taken SKIP TO Q31 IF ONE OR MORE CODED AT Q29 Q30 And how effective was this action/ were these action(s): (ACTION TAKEN AT Q29)? Not effective Somewhat effective Very effective
GfK NOP Social Research
Q31. And have you, or has anyone on your behalf, complained to any of the following bodies about the amount of noise from (NOISE SOURCE) that you hear in this home? CODE ALL THAT APPLY The police Westminster Council’s 24 hour Noise Team Other Council Department (specify) City West Homes or other housing association landlord An MP or councillor Other body (specify) No complaints made SKIP TO Q33 IF ONE OR MORE CODED AT Q31 Q32. And how effective was this/were these complaint(s): (ACTION TAKEN AT Q31)? Not effective Somewhat effective Very effective Q33. Would you go to bed any earlier or later if it were not for problems with noise keeping you awake? Would go to bed earlier Would go to bed later No earlier or later/makes not difference/doesn’t apply (not affected by noise) DK Q34. And can I ask you at what time you normally go to bed the night before.. ENTER TIME AND A.M. OR P.M. FOR EACH, WITH N/A OPTIONS FOR WORKING DAYS AND NIGHT SHIFTS Days off work or if not working Working days Night shift (if applicable) Q35. I would like you to think about all the types and sources of noise that you hear at home. Taken together, I would like you to tell me the extent to which noise spoils your home life. PROMPT TO PRECODE Not at all Not very much A little Quite a lot Totally DK Thank you. We are nearing the end of the survey. I just need to ask a few questions about your accomodation type and your economic status so we can classify the results. Just to reiterate, everything you say will be held by GfK NOP in confidence and no other party, including Westminster City Council will know that we spoke to you

GfK NOP Social Research
Q36. Which of the following best describes how you currently occupy your accommodation? READ OUT Being bought on a mortgage Owned outright Rented privately Rented from Westminster City Council Or something else Q37. And how long have you lived in this home? DO NOT PROMPT Less than 6 months 6 months up to 1 year Over 1 year up to 2 years Over 2 years up to 5 years Over 5 years DK Q38. Does your home have any double glazing? IF YES PROMPT FOR CODE Yes all windows double glazed Yes partially double glazed No DK Q39. Which of the following describes your home? PROMPT Purpose built flat/maisonette Conversion flat/maisonette Semi-detached/end of terrace house Town house (that is, terraced but on more than 3 levels) Centre terraced house Detached house Bungalow Other IF 1 OR 2 ABOVE ASK Q40. OTHERS GO TO Q42. Q40. On which floor (where street level is ground, next floor is first floor and so on) is the entrance to your home? Basement Ground First floor Second floor Third floor Fourth floor Fifth floor Sixth floor Seventh floor or higher
GfK NOP Social Research
IF 2 AT Q39. OTHERS GO TO Q42. Q41. When was your conversion flat/maisonette converted? Before 1991 1991-1993 After 1993 DK ASK ALL Q42. Do you have the use of a garden or balcony in this home? IF YES PROMPT FOR WHICH Yes, garden Yes, balcony Yes, both No Q43. In what year was your home originally built? PROMPT IF NECESSARY Before 1919 1919-1940 1941-1960 1961-1970 1971-1980 1981-1990 1991-2000 Since 2000 (specify exactly) DK Q44. SEG AB C1 C2 DE THANK AND CLOSE