gis arcmap - ncdot training...gis arcmap (arcmap version 9.2) by priya nimbole ... a shapefile is an...
TRANSCRIPT

FAQ (Frequently Asked Questions)
GIS ArcMap (ArcMap Version 9.2)
By
Priya Nimbole
Model Research and Development Unit
Transportation Planning Branch
July 2009

2
TABLE OF CONTENTS
1 SHAPEFILES ...........................................................................................................................4
1.1 How To Create Shapefile ...............................................................................................4 1.2 How To Edit Layer ........................................................................................................6 1.3 How To Add/Delete Attributes ......................................................................................7
1.4 How To Clip ..................................................................................................................7 1.5 How To Populate New Field In The Attribute Table ..................................................11 1.6 Definition Query ..........................................................................................................11
2 SYMBOLOGY .......................................................................................................................12
2.1 Using Categories – Unique Values ..............................................................................12
2.2 Using Quantities – Graduated Symbols .......................................................................13
3 LABELING ............................................................................................................................14
3.1 Different Ways .............................................................................................................15 3.2 How To Set Reference Scale .......................................................................................16
3.3 How To Add Symbols .................................................................................................17 3.4 How To Use Annotations – In The Map ......................................................................17
3.5 How To Use Annotations – In A Database ..................................................................18 3.6 Labeling Crash and Bridge Locations..........................................................................20 3.7 Labeling Volume/Capacity Maps for Base and Future Years .....................................21
4 TABLES ..................................................................................................................................22
4.1 How To Search For Queries ........................................................................................22
4.2 How To Sort Table.......................................................................................................22 4.3 How To Join Tables .....................................................................................................22
5 MAPS ......................................................................................................................................23
5.1 How To Create Insets...................................................................................................23
5.2 How To Insert & Edit Title Blocks and Map Legend ..................................................23 5.3 How to Plot a Map .......................................................................................................24 5.4 How To Save Map to PDF File....................................................................................25
6 MODEL OUTPUT .................................................................................................................30
6.1 How To Export Model Output From TransCAD .........................................................30 6.2 How To View Model Output In CTP Maps.................................................................31
7 MISCELLANOUES ..............................................................................................................32
7.1 How To Organize Data ................................................................................................32 7.2 Where To Find CTP Map Templates ...........................................................................32 7.3 Where To Obtain Latest Shapefiles .............................................................................32 7.4 Where To Find ArcMap In-House Tools .....................................................................32

3

4
1 SHAPEFILES
A shapefile is an ArcGIS file format for storing the geometric location and attribute information
of geographic features. Geographic features in a shapefile can be represented by points,
polylines, or polygons (areas).
Generally, it would not be required to create shapefiles since most of the shapefiles can be found
on the ‘S:’ drive. Exception would be when creating temporary boundary shapefiles to be used
for clipping purposes.
1.1 How To Create Shapefile
A shapefile to represent either point, polyline, or polygon can be created using Arc Catalog.
Creating Polygon Shapefile
The following procedure is similar for creating point and line shapefile as well.
1. Open ArcMap.
2. Open ArcCatalog by clicking on in the ArcMap toolbar.
3. Click on Connect to Folder in the ArcCatalog toolbar if the upper level folder is
not listed in the catalog tree and navigate to the folder you want to save your shapefile in.
4. Choose File-New-Shapefile.
5. Click Edit button to specify the coordinate system.
Enter name of shapefile
Choose the feature type of shapefile

5
6. Choose Select button from the above window, and select the coordinate system.
The coordinate system for North Carolina would be:
Geographic Coordinate System- North America-North American Datum 1983.prj
7. Click OK.

6
8. Click OK. The ‘Study Area Boundary’ shapefile should now be created in your folder.
The shapefile created above does not have any features. Using the Editor Toolbar, features
(polygons) can be added to the shapefile.
Adding Features To Shapefile
1. Add the shapefile to an ArcMap document using the Add Data tool .
2. Click on in the Editor Toolbar. If not visible, choose Tools-Editor Toolbar.
3. Click on Start Editing.
4. Navigate to your shapefile and click Start Editing.
5. Select Create New Feature under Task on the Editor Toolbar.
6. Pick the Sketch tool and draw the boundary by clicking for vertices. The image
below consists of the sketched boundary on the left and the finished polygon feature on
the right.
7. Choose Editor-Save Edits.
8. Choose Editor-Stop Editing.
1.2 How To Edit Layer
Editing is performed on shapefiles when:
New features need to be added
An attribute needs to be added to or deleted from the attribute table
Attribute data needs to be modified
The following procedure is the same for editing any type of shapefile.
Editing Line Layer
Click on in the Editor Toolbar. If not visible, choose Tools-Editor Toolbar.
Click on Start Editing.
Navigate to your shapefile and click Start Editing.
Select Create New Feature under Task on the Editor Toolbar.
Pick the Sketch tool and draw a new line feature by clicking for vertices.
Choose Editor-Save Edits.
Choose Editor-Stop Editing.

7
1.3 How To Add/Delete Attributes
Adding Attribute
1. Right-click on the layer in the Table of Contents.
2. Choose Open Attribute Table.
3. Click on Options on the bottom right hand corner of the attribute table.
4. Choose Add Field.
5. Click OK.
Deleting Attribute
1. Click on in the Editor Toolbar. If not visible, choose Tools-Editor Toolbar.
2. Click on Start Editing.
3. Navigate to your shapefile and click Start Editing.
4. Right-click on the layer in the Table of Contents.
5. Choose Open Attribute Table.
6. Highlight the column of the attribute you want to delete.
7. Right-click on the column and choose Delete Field.
8. Click Yes.
1.4 How To Clip
There are three different ways of clipping your area of interest from a shapefile.
Using the ArcMap inbuilt ‘Clip’ tool
Using NCDOT GIS Unit’s ArcMap tool
Using the ArcMap ‘Select Features’ tool
Enter attribute name
Choose the type

8
It is suggested to use the NCDOT GIS Unit’s ArcMap tool for clipping whenever possible.
Clipping By Area Using ArcMap
To clip by area, you will need a layer that needs to be clipped (either a point or a line layer) and a
cookie cutter layer (polygon) to clip with.
Unless you have a shapefile with the exact area you need to use for clipping, to get the polygon
layer ready, you can use the Query Builder to make your own cookie cutter. For example, you
can pick one particular county from the ‘County’ shapefile to use for clipping roads in that
county. The first four steps of the following procedure explain how to use the query builder.
1. Right-click on the polygon layer in the Table of Contents and choose Properties.
2. Navigate and click on the Definition Query tab and then click on the Query Builder
button.
3. Using the operations provided, construct your query to obtain your desired polygon area
(cookie cutter boundary). For example, the query below will select just ‘Wake’ county
from the ‘County’ shapefile and disable the other county features.
4. Click OK. Click OK.
5. Click on to open the Show/Hide Arctoolbox Window.
6. Choose Analysis Tools-Extract-Clip.
7. Double Click on Clip.
Choose attribute
Click to display a list of
attribue values to select
from
Form query by clicking and
picking attributes and
operations provided

9
8. Click OK.
The clipped features are now stored in a separate shapefile at the location provided.
Clipping Using NCDOT GIS Unit Clipping Tool
The advantage of using this tool is that you can clip multiple layers at one time with one clipping
layer instead of doing it individually. For example, you can clip AADT, airports, bridges and
roads for Wake county in a single operation.
1. Open an ArcMap document. Add the shapefiles that need to be clipped as well as the
shapefile to be used for clipping, which should be a polygon shapefile.
2. Click on in the DOT Tools menu bar to open the Clip and Overlay Analysis Tool.
Choose the layer that needs to
be clipped
Choose the layer to clip with
(cookie cutter layer)
Specify location of the new
shapefile and name it

10
For more information on the GIS ArcMap Tool, please refer to the documents here:
S:\ARCGIS\GISunitTools\GIS ArcMap Tool
Clipping by Exporting Selection
1. Choose Selection-Set Selectable Layers from the Toolbar.
2. Click Clear All.
3. Select the layer you want to clip features from by checking against it.
4. Click Close.
5. Zoom in to the area you want to clip.
6. Click on to choose Select Features tool from the Toolbar.
7. Using the Select Features tool, click and drag to draw a square over the area you want to
clip.
8. Once the features have been selected, Right-click on the layer and choose Data-Export
Data.
Choose the layer to clip with
(cookie cutter layer)
Check the layers that need to be
clipped. You can select all the
layers or a few
Click for clipping
Click for clip and analysis
Specify location and name
Select if you want to clip the
layers using all the features in
the “clip layer” or only
selected features

11
9. Click OK.
The clipped features are now stored in a separate shapefile.
1.5 How To Populate New Field In The Attribute Table
1. Use Selection Methods (Select By Location, Definition Query, etc) to obtain your
selection set.
2. Open attribute table – go to Selected tab – right click and highlight the column of the
new field – field calculator - fill with the value. This updates all the selected records at
one go.
3. Do Options – Clear Selection and repeat above steps until the new field is populated for
all the required records.
1.6 Definition Query
Definition query is used when only certain features of a shapefile (layer) need to be displayed on
the map while the rest of the features need to be hidden. For example, if you want to show just
the Interstate routes and hide rest of the roads or show only a particular project and hide the rest
of the road links. This is done by specifying a query in the Definition Query box such that only
the features that you want to show on the map get selected. Even the attribute table will show
records for only the selected features.
You need to construct your own query depending on the desired result using the functions
provided in the query builder tool.
1. Right-click on the layer and select Properties.
2. Navigate to the Definition Query tab.
3. Click on Query Builder at the bottom of the window that pops up.
4. Using the list of attributes and functions provided, construct the query that needs to be
executed. For example, if you want to just show the Interstates on the map and hide other
roads, the query should be “RTTYPTXT1= ‘I’ ”.
Choose ‘Selected Features’
Specify location of the new
shapefile and name it

12
5. Click inside the lower box, and then double click on RTTYPTXT1 from the list above to
include it in the query box.
6. Click on “=” button.
7. Click on Get Unique Values button to get a list of values fro attribute field
RTTYPTXT1.
8. Double click and select the value required from the list of unique values, thus completing
the query.
9. Similarly the other buttons such as And, Or, <> (which means ‘not equal to’ as opposed
to ‘=’) can be used to form various queries which help you show only what you want to
show on the map and hide the rest.
2 SYMBOLOGY
You can use the Symbology feature of ArcMap to easily display attribute data of features for
various map purposes.
2.1 Using Categories – Unique Values
To show unique values of an attribute using different symbology on a map, use Categories-
Unique Values from Symbology. For example, you can use it to show different types of routes

13
(Interstate, NC, US, and SR) in different colors while selecting them all from one single attribute
in the attribute table.
10. Right-click on the layer and select Properties.
11. Click the Symbology tab.
12. Click on Categories on left and select Unique values.
13. Select your attribute field using the Value field drop-down menu.
14. Click on Add All Values button at the bottom to show them in the box.
15. Select a Color Ramp from the drop down menu on right, to select the symbology colors or
right-click on each value to select a color.
16. Uncheck the box for <all other values> if you do not want to show them. If you want to
display them, it is suggested to use a light grey color to show all other values.
17. Click OK.
2.2 Using Quantities – Graduated Symbols
This feature of Symbology can be used to display quantities with graduated symbols.
For example, high/low values of AADT can be displayed with corresponding big/small symbols.
1. Right-click on the layer and click Properties.
2. Click the Symbology tab.
3. Click Quantities-Graduated symbols.

14
4. Click the Value drop-down and select the field that contains the quantitative value you
want to map.
5. Type the minimum and maximum symbol sizes and click Classify.
6. Click the Method drop-down and click the classification method you want to use.
7. Click the Classes drop-down and click the number of classes you want to display.
8. Click OK on the Classification dialog box.
9. Click OK on the Layer Properties dialog box.
3 LABELING
ArcMap allows features to be labeled in two different ways. Automatic labeling and Manual
labeling. Automatic labeling will label all the features in the layer according to the placement
properties that you provide. Manual labeling will label only the features which you pick to be
labeled. The NCDOT GIS Unit’s Shield tool can be used for labeling as well.
Note: Labeling should be performed in the Data View window and not Layout View window so
as to avoid resizing issues.
15
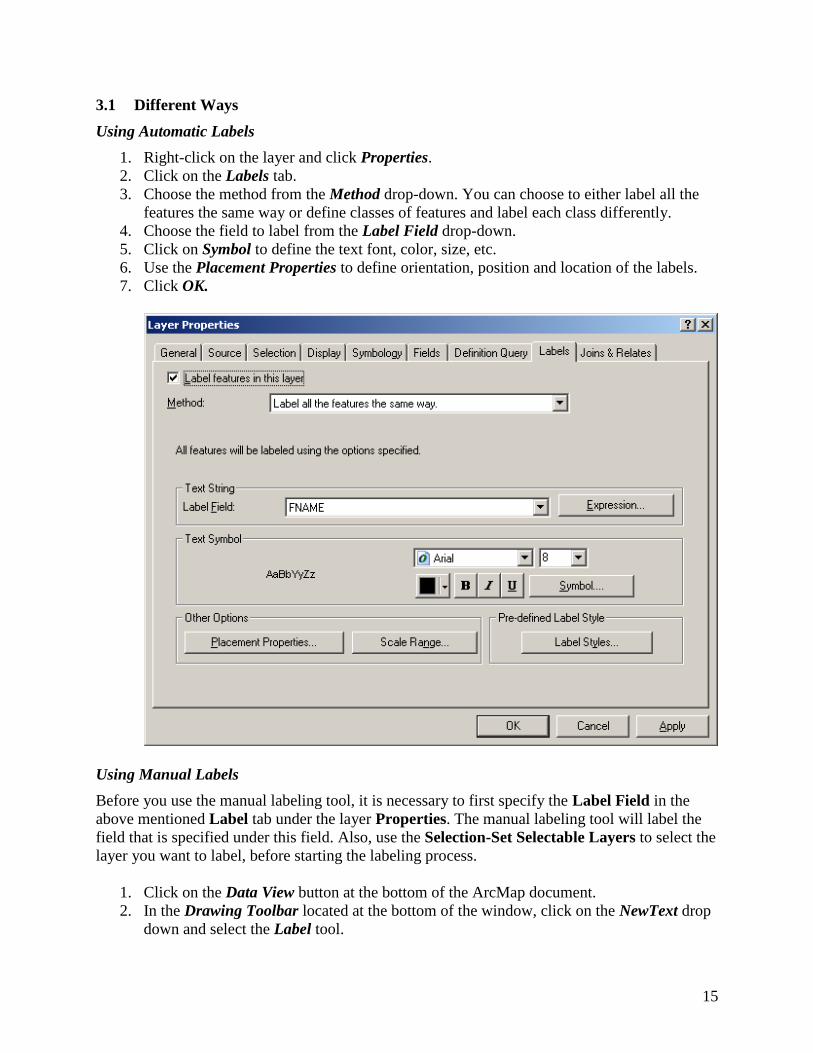
3.1 Different Ways
Using Automatic Labels
1. Right-click on the layer and click Properties.
2. Click on the Labels tab.
3. Choose the method from the Method drop-down. You can choose to either label all the
features the same way or define classes of features and label each class differently.
4. Choose the field to label from the Label Field drop-down.
5. Click on Symbol to define the text font, color, size, etc.
6. Use the Placement Properties to define orientation, position and location of the labels.
7. Click OK.
Using Manual Labels
Before you use the manual labeling tool, it is necessary to first specify the Label Field in the
above mentioned Label tab under the layer Properties. The manual labeling tool will label the
field that is specified under this field. Also, use the Selection-Set Selectable Layers to select the
layer you want to label, before starting the labeling process.
1. Click on the Data View button at the bottom of the ArcMap document.
2. In the Drawing Toolbar located at the bottom of the window, click on the NewText drop
down and select the Label tool.

16
3. Once the Label tool is selected, the following window will come up. Make selections
about Placement and Label Style and close the window.
4. Now you should be able to click anywhere on the map and the label tool will label the
feature accordingly.
Using NCDOT GIS Unit Labeling Tool
The Shields Tool is used for labeling highway shields as well as roads. For more information on
the Shields Tool, please refer to the documents located here:
S:\ARCGIS\GISunitTools\ShieldsTool
3.2 How To Set Reference Scale
You need to set the reference scale, so that resizing the map will resize the labels as well
(Automatic as well as Manual).
1. Highlight Layers by clicking on , located in the Table of Contents on the top
left hand side of the map document.
2. Right-click and choose Reference Scale-Set Reference Scale.
3. Now add the automatic/manual labels.
Select the Label tool
Select the Placement
style.
Select the Label style. You can either
select the properties already set under
the Label tab for the layer or choose
to specify the style here by clicking
the ‘Choose a style’ button.

17
Setting the Reference Scale will make the labels resize appropriately when you resize the map.
3.3 How To Add Symbols
It is suggested that any shield symbols you need for your map, like the Interstate, US Highway
and NC Route shield symbols, should be copied from one map by everybody to standardize the
symbols. The map can be accessed from the internal Model Research and Development Unit
website located at: S:\WEB\mrdWeb\mrd\welcome.htm
Once on the website, click on Project & Map Template on the left. Under Comprehensive
Transportation Plan Report Figure Templates, click on Planning Area, TAZ and Screen Line
Map. From this map, you can copy the shield symbols and paste them into your map.
For your knowledge, the procedure used in ArcMap to create shield symbols is described below.
Adding Highway Shield Symbol
1. In the Drawing Toolbar located at the bottom of the window, click on the New Text drop
down and select the New Text tool.
2. Click on the map at the location the label is needed.
3. Select the text.
4. Right click and select Properties-Change Symbol-More symbols -Add
5. Go to S:\Comprehensive Transportation Plan\Comprehensive Transportation
Plan.styles. Click Open.
6. Click OK.
7. Click on Change Symbol and scroll down to click and select the required highway shield
symbol.
8. Click OK.
3.4 How To Use Annotations – In The Map
Annotations are used to convert automatic labels to manual labels so that they become easy to
manipulate for different placement options. After converting labels into annotations, it becomes
easy to delete unwanted labels and move labels to desired locations.
Creating Annotations
After you label features using the Automatic Labeling procedure, right-click on the layer and
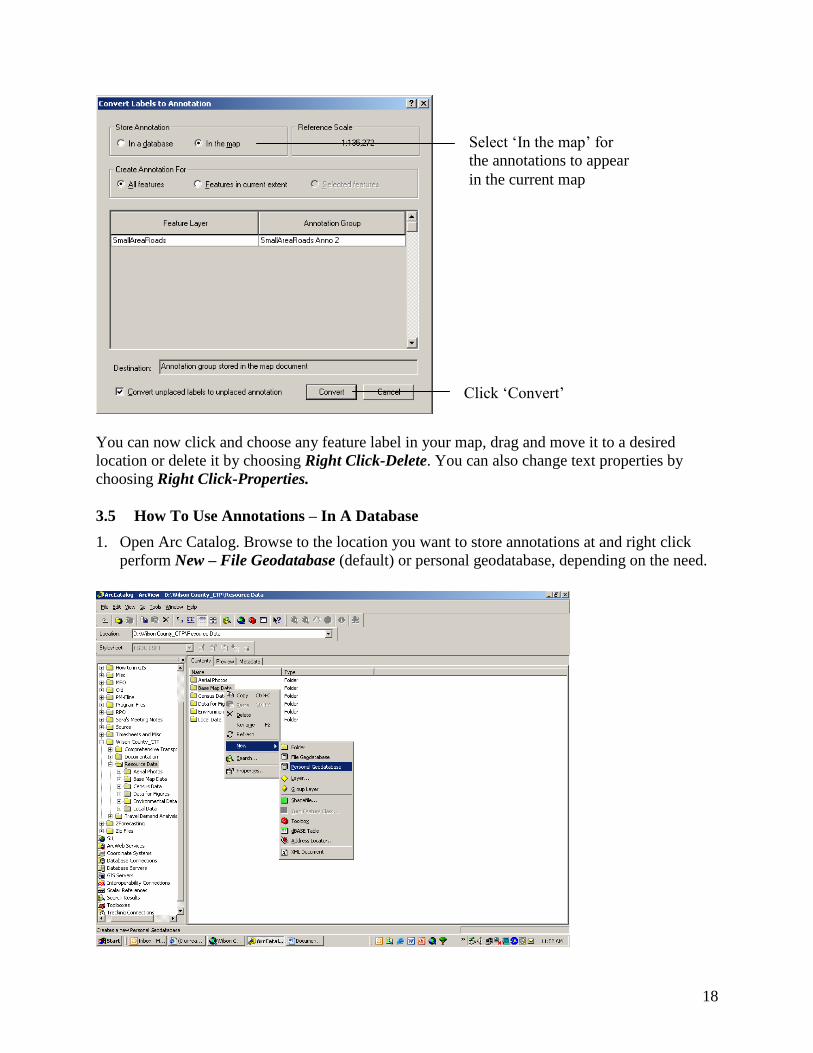
choose Convert Labels to Annotation. The following window will come up on the screen:
Select the ‘New Text’ tool
18
You can now click and choose any feature label in your map, drag and move it to a desired
location or delete it by choosing Right Click-Delete. You can also change text properties by
choosing Right Click-Properties.
3.5 How To Use Annotations – In A Database
1. Open Arc Catalog. Browse to the location you want to store annotations at and right click
perform New – File Geodatabase (default) or personal geodatabase, depending on the need.
Select ‘In the map’ for
the annotations to appear
in the current map
Click ‘Convert’

19
2. Give a suitable name to the file geodatabase. This is the geodatabase that will store your
annotations in the form of a feature class. The geodatabse can store a number of such feature
classes. 3. Open your shapefile in ArcMap and after performing labeling, right-click on the layer and
choose Convert Labels to Annotation- In a Database. Make sure you choose ‘In a database’.
4. Click on the browse to folder button , and browse to the geodatabase location. 5. Double click on the geodatabase and store the annotations as a feature class by giving it a
suitable name.

20
6. Click Save. Click Convert.
7. You should now see your annotations as a layer in your map. The layer will show on top in
the Table Of Contents on left.
This new annotations layer can be edited using the Editor Toolbar. Using Start Editing you can
now delete, add, move labels, etc. After doing edits, click on Save Edits and the edits will be
saved to the annotations layer (feature class in the geodatabse). Just like any other
shapefile/layer, this annotations layer can be added to another map using Add Data button.
3.6 Labeling Crash and Bridge Locations
Label the crash locations with Unique ID.
1. Go To Layer- Properties – Label tab.
2. Under the label field, use the drop down to select the field with the unique ID in it.
3. Click on ‘Symbol’ and ‘Add More’.
4. Add the latest CTP Style file from the S drive. (S/TPB Reference/Comprehensive
Transportation Plan/ look for the latest “.style” file)
5. Once the ‘CTP’ style file is added, it should show up in the symbol selector drop-down
menu.
6. Select the ‘crash location’ symbol (red with a white # sign inside)
7. Click ‘Placement Properties’ and select the ‘Place label on top of the point’
8. Click Ok, Ok.
9. Remember to check the box next to ‘Label features in this layer.’
10. Click Ok.
Cleanup to make only the symbol visible.
1. Go To Layer- Properties- Symbology.
2. Double click on the symbol

21
3. Make the size=0; color=no color
4. In the same window, click on Properties.
5. Uncheck the ‘Use Outline’ box.
6. Click Ok, Ok.
To label bridge locations with Bridge ID number, the procedure is the same as above, except the
symbol is green in color with a white # sign inside instead of red. Under the ‘label field’, the
attribute with the bridge ID should be selected.
3.7 Labeling Volume/Capacity Maps for Base and Future Years
How to label Volume/Capacity maps using Annotations; perform label editing for base year, and
then be able to substitute base year volumes (ex: 2010) with future year volumes (ex: 2040) and
have the labels display at the same locations.
I. Base Year Volume/Capacity Map
1. Open the shapefile that contains your base and future year volumes and capacities in
Arcmap.
2. Label features in the shapefile layer using the expression:
[2010 Volume] & vbNewLine & "<CLR red='255'>" & [2010 Capacity] & "</CLR>"
3. This will label the Volume and Capacity in two separate lines, with Capacity in red color.
Do Horizontal placement of labels and place one label per feature part.
4. Convert labels to annotations and store them in a file geodatabase as feature class
“VOC_Base Year”. You can edit this annotation layer to complete Base Year
Volume/Capacity Map (delete labels, move to correct location, etc.)
II. Future Year Volume/Capacity Map
1. Open ArcCatalogue. Browse to the file geodatabse and make a copy of the annotation
feature class “VOC_Base Year” made in the previous step, for labeling future year
volumes. Save this copy of annotation feature class as “VOC_Future Year”.
2. Add “VOC_Future Year” annotation feature class to the working map.
3. Right click on the above feature class layer and perform ‘Join’ with the shapefile (the
same shapefile that was used in step 1 for the Base Year map) that contains all your base
and future year volumes and capacities. The attributes that need to be joined are
“FeatureID” from the annotation feature class and “FID” from the shapefile.
4. Once all the attributes are joined to the future year annotation feature class, the future
year volumes can be labeled by recalculating the “TextString” attribute in the attribute
table.
5. Open the attribute table of the “VOC_Future Year” annotation feature class.
Browse to and right click on “TextString” attribute and perform field calculator. Fill it
with the following expression: [2040 Volume] & vbNewLine & "<CLR red='255'>" &
[2010 Capacity] & "</CLR>"

22
6. Make sure you replace the volume and capacity fields with appropriate future year fields
from this new joined attribute table.
7. Now the labels should come in at the same locations as the base year labels but should
show future year volumes.
4 TABLES
Every shapefile has a .dbf file associated with it. If you modify this .dbf file, the shapefile gets
modified accordingly and the changes are reflected in the map documents containing this
shapefile.
You can join a .dbf file to the attribute table of a shapefile. Both files need to share one common
attribute, which is necessary for a join. Once joined, the new data from the .dbf file can be used
for map purposes.
4.1 How To Search For Queries
You can use Select by Attributes or Select by Location to search for queries from a map layer
table.
1. Choose Selection- Select by Attributes or Selection-Select by Location and select the
required features.
2. Right-click on a layer and click on Open Attribute Table.
3. Choose Selected button at the bottom of the attribute table. The records of only the
selected features should now be visible in the attribute table. You can also edit the
selected features using the Editor Toolbar.
4. After work is done, choose Selection-Clear Selected Features.
4.2 How To Sort Table
1. Right-click on a layer and click on Open Attribute Table.
2. Highlight an entire column and Right-click on it.
3. You can now choose Sort Ascending or Sort Descending. This will sort the entire table
according to the ascending or descending order of that particular column.
4.3 How To Join Tables
You can join the attribute table of a layer to another layer’s table based on a common attribute
that can be found in both the tables. The name of the field does not have to be the same, but the
data type has to be the same; you join numbers to numbers, strings to strings, and so on.
For example, a ‘Counties’ shapefile with new data can be joined to the old shapefile using the
common attribute which they share and maps can be updated using the data from this new
shapefile.
1. Right-click on a layer and click on Open Attribute Table.
2. Choose Joins and Relates-Join.

23
3. Click OK.
5 MAPS
Some features which enhance any map are map legend, title block, north arrow, and scale bar.
Insets (data frames) are used to display an area of interest in greater detail which cannot be
achieved in the main display frame.
5.1 How To Create Insets
1. Choose Insert-Data Frame from the Toolbar.
2. Activate the New Data Frame by highlighting it.
3. Click and choose the Layout View from the bottom of the map document. You can now
highlight the New Data Frame and reshape it by dragging the vertices.
You can add shapefiles to this new data frame and create the inset as you want it.
5.2 How To Insert & Edit Title Blocks and Map Legend
1. To add legend to a map, choose Insert-Legend from the Toolbar menu and follow the
steps by clicking Next until done.
2. To add title block to a map, choose Insert-Title from the Toolbar menu.
Using the drop-down menu
choose the field to be used
for the join
Choose the table to be
joined to the above
mentioned layer
Choose the field in the table
from step 2 to be used for
the join (should contain the
same values as in the field
from step 1)

24
3. To edit either, double-click on them to open Properties box. You can make changes
here.
5.3 How to Plot a Map
If you select the feature “Scale Map to Fit Printer Paper” no matter what paper size your map
was setup in ArcMap, your map should be plotted properly. This means that you don’t need to
save your map in different paper sizes. You can apply the same method for printing from a from
a PDF file. When printing a map, just make sure that you always select “Scale Map to Fit Printer
Paper” in the “Print” window as shown here:
If the selection for “Scale Map to Fit Printer Paper” is grayed out, try to uncheck the “Use Printer Paper Settings” in the “Page and Print Setup” window as shown here:

25
5.4 How To Save Map to PDF File
To save your ArcGIS map in a PDF file, you need to use deskPDF by following these steps in
ArcMap.
1. Select “Print” from the “File” dropdown menu as shown here:

26
2. Click on “Setup” button in the “Print” window as shown here:

27
3. Select “deskPDF” in the “Page and Print Setup” window as shown here (if you don't see
the "deskPDF" in the list, please contact IT to install it on your PC):

28
4. Click on “OK” to close the “Page and Print Setup” window, and click on “OK” to close
the “Print” window. Then save your map as a PDF file as shown here:

29
5. Your map should be displayed correctly in PDF format when you save it this way.
Otherwise, you may have problems with your PDF file if the map was saved some other
ways.
Note: To Export Map as PDF and not lose any of the graphics – fonts, etc:
Click on Export Map – Format – Check “Embed all Document fonts” box

30
6 MODEL OUTPUT
Travel demand models are frequently used for traffic forecasting. The output files of these model
runs need to be converted to a format which is compatible with ArcMap so that the data can be
used for map purposes.
6.1 How To Export Model Output From TransCAD
The way to transfer data from TransCAD to ArcMap is to export the geographic data as
shapefiles and save other output data as ‘.dbf’ files.
To Export Geographic Data As Shapefile
1. Select the geographic layer you want to export to ArcMap from the main drop-down
menu in the TransCAD Toolbar.
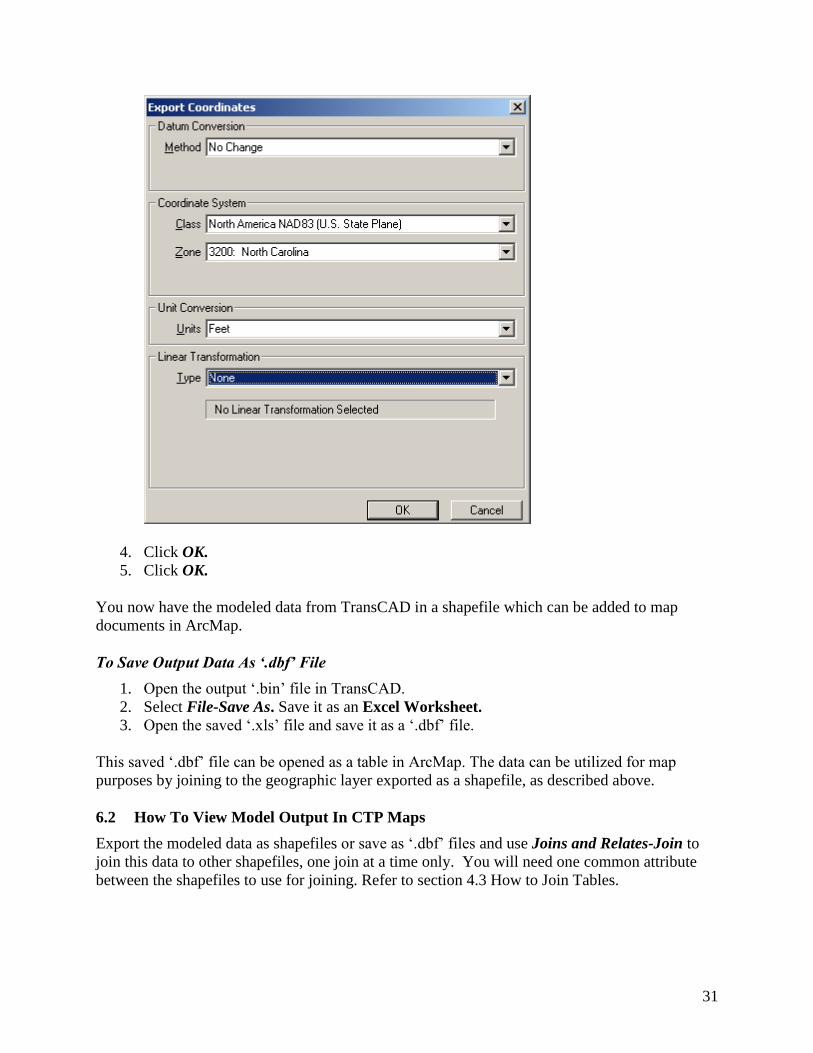
2. Select Tools-Export from the Toolbar.
3. Specify Coordinates. For North Carolina, it is usually what is specified in the image
below.
Select All Features from
the drop-down
Select ESRI Shape from
the drop-down
Click to specify coordinates
for the shapefile (Note: No
need to specify coordinates
unless there is a problem after
exporting, because it may
mess up the system
sometimes)
31
4. Click OK.
5. Click OK.
You now have the modeled data from TransCAD in a shapefile which can be added to map
documents in ArcMap.
To Save Output Data As ‘.dbf’ File
1. Open the output ‘.bin’ file in TransCAD.
2. Select File-Save As. Save it as an Excel Worksheet.
3. Open the saved ‘.xls’ file and save it as a ‘.dbf’ file.
This saved ‘.dbf’ file can be opened as a table in ArcMap. The data can be utilized for map
purposes by joining to the geographic layer exported as a shapefile, as described above.
6.2 How To View Model Output In CTP Maps
Export the modeled data as shapefiles or save as ‘.dbf’ files and use Joins and Relates-Join to
join this data to other shapefiles, one join at a time only. You will need one common attribute
between the shapefiles to use for joining. Refer to section 4.3 How to Join Tables.

32
7 MISCELLANOUES
7.1 How To Organize Data
In order to organize shape files, layers files and files copied from S: drive so maps can be viewed
by others without losing the data source, copy the map document and concerned shapefiles into a
single folder and copy this folder over to the S: drive, for example. (Note: When making a copy,
the folder structure should be maintained.) If source in the shapefiles is missing, it can be easily
reconnected since the location is not deeply buried.
7.2 Where To Find CTP Map Templates
Templates are saved as “ESRI ArcMap Document” using a “.mxt” extension.
Location: S:\Shared\TPB Reference\Comprehensive Transportation Plan
7.3 Where To Obtain Latest Shapefiles
Location: S:\Shared\GIS Data\NC GIS Statewide Data\Latest GIS Data
7.4 Where To Find ArcMap In-House Tools
There are two in-house GIS tools that are very useful for TPB.
The ArcMap tool
The Shields tool.
The ArcMap tool consists of the multi layer clipping tool as one of its five tools.
Please refer to the following locations to obtain documents related to the in-house tools including
instructions on how to install and use.
ArcMapTool Location: S:\ARCGIS\GISunitTools\GIS ArcMap Tool
Shields Tool Location: S:\ARCGIS\GISunitTools\ShieldsTool