gis as a tool for assessing volcanic hazards ... · remer, angela. 2011. gis as a tool for...
TRANSCRIPT

________________________________________________________________________ Remer, Angela. 2011. GIS as a Tool for Assessing Volcanic Hazards, Vulnerability, and at Risk Areas of the
Three Sisters Volcanic Region, Oregon. Volume 13, Papers in Resource Analysis. 18 pp. Saint Mary’s
University of Minnesota University Central Services Press. Winona, MN. Retrieved (date)
http://www.gis.smumn.edu
GIS as a Tool for Assessing Volcanic Hazards, Vulnerability, and at Risk Areas of the
Three Sisters Volcanic Region, Oregon
Angela Remer
Department of Resource Analysis, Saint Mary’s University of Minnesota, Minneapolis, MN
55402
Keywords: Volcanic Risk, Volcanic Hazards, Vulnerability Assessment, Three Sisters,
Geographic Information Systems, GIS, Natural Hazards
Abstract
Active volcanoes give significant threats to the populations that live in their proximity. The
Three Sisters Volcanic region is one of 9 threatening volcanoes within the Cascades volcanic
arc. Eruptions are probable which makes it essential to complete hazard, vulnerability, and
risk assessments so that proper planning, education and mitigation procedures can be
implemented prior to the threat occurring. GIS provides a tool for extending hazard and
vulnerability mapping to assist in the analysis of risk. Creating a procedure using GIS as an
aid helps in automating the very complicated and lengthy processes of establishing a risk
assessment. Responses to volcanic events can be better handled with an understanding of
how communities will be affected.
Introduction
According to the global volcanism
database of the Smithsonian Institution,
the United States has 169 geologically
active volcanoes (Ewert, Guffanti, and
Murray, 2005). In a 2005 report by the
National Volcano Early Warning System
(NVEWS) the United States has 5 erupting
volcanoes and 13 very high threat
volcanoes (Ewert et al.). Ewert et al.
explains United States volcanoes have
produced many kinds of dangerous
phenomena:
Lava flows have buried communities
Explosive eruptions have destroyed
forests and killed people
Debris avalanches and mudflows
have clogged major river ways,
damaged bridges, and swept
bystanders to their deaths
Noxious gas emissions have caused
lung ailments
Ash clouds have caused damage to
aircraft and disrupted the lives of
thousands of people
The potential for such threats to the
nation’s population, property, and
infrastructure is significant and there is a
need to study volcanic eruptive behaviors
to help mitigate effects of these forces of
nature (Ewert et al.).
On May 18, 1980 the United States
experienced firsthand the damage that a
volcanic eruption can cause. The eruption
of Mount Saint Helens caused the death of
57 people. The Washington State
Department of Game estimated that nearly
7,000 big game animals perished. Tens of
thousands of acres of prime forest were
destroyed. Furthermore, nearly 4 billion
board feet of salable timber was destroyed

2
by the Mt. St. Helen’s lateral blast. The
eruption caused over 2 million cubic yards
of ash to fall onto Washington state
highways and airports. In fact, ash
removal costs reached $2.2 million and
took over 100 weeks to complete in
Yakima County. The ash also caused air
transportation disruptions for up to two
weeks as well as the closing of many
highways and roads. It is also important to
note more than 185 miles of highways, 15
miles of rails, and 200 homes were
destroyed by the eruption (Tilling,
Topinka, and Swanson, 1990).
Site Location
The Three Sisters volcanic center consists
of three composite volcanoes including:
North Sister, South Sister, and Broken
Top. Throughout this region there are also
mafic volcanoes that range from small
cinder cones to large shield volcanoes
(Scott, Iverson, Schilling, and Fischer,
2001).
Three Sisters is one of 9
threatening volcanoes within the Cascades
volcanic arc (Ewert et al., 2005). The
Cascades volcanic arc stretches from
northern California, USA to British
Columbia, Canada (Dzurisin, Lisowski,
Wicks, Poland, and Endo, 2006).
As seen in Figure 1, the study area
is defined as the area within 15 miles of
one of the Three Sister volcanic centers.
The area that will be reviewed includes
portions of the following Oregon counties:
Deschutes, Lane, and Linn.
Volcanic Events
Volcanism in the Three Sisters region has
produced five large cones: North Sister,
Middle Sister, South Sister, Broken Top,
and Mount Bachelor (Dzurisin et al.,
2006). The volcanic history of the Three
Sisters region has been difficult to study
because the last eruptions in the area
occurred before written records. Thus, the
eruptive history was derived from the
study of geologic deposits and mapping in
the area (Scott et al., 2001). Glacial
erosion has also made detailed dating of
the explosive history in the region difficult
(Scott et al.).
Figure 1. Site location with ESRI terrain
background, summit locations and county
boundaries.
Geologic mapping in the region
suggests that during the past 700,000
years, there have been at least four
explosive eruptions that produced
significant pyroclastic flows that expanded
to Bend, Oregon (Scott et al., 2001).
Preliminary studies suggest there was an
onset of volcanic periods between 12,000
and 30,000 years ago (Dzurisin et al.,
2006). It is unlikely the volcanic center is
capable of producing such a catastrophic
explosion in the near future. This is due to
the fact there is no evidence that there is
enough magma present to drive such an
eruption (Scott et al.).

3
The Three Sisters volcanic centers
most recent eruption occurred nearly 2,000
years ago. These eruptions on South Sister
produced small pyroclastic flows and
tephra fallout. In the most significant
expansions the tephra deposits extended
25 miles. These eruptions also produced
lava flows, lava domes and small lahars
(Scott et al., 2001; Dzurisin et al., 2006).
According to an Information
Statement given by the USGS on April 11,
2007, the Three Sisters region is still being
monitored. In 2001, satellite radar data
revealed a 10 mile diameter area had risen
about 4 inches. This uplift continued at an
average of about 1 inch per year through
2004.
Field surveys and GPS receivers
have confirmed the rate has slowed within
the past two years to an average of about
½ inch. The uplift is most likely driven by
intrusion of magma. The report explains
the outcome or duration of the current
intrusion is impossible to forecast.
Intrusions require close monitoring
because some lead to eruptions, but often
only after weeks or months of intensifying
unrest. The report concluded that scientists
will work with the U.S. Forest Service to
enhance monitoring networks as well as
work with local agencies to develop a plan
for responding to future volcanic events
(USGS, 2007).
In the contents of this paper the
term hazard will be defined as the
probability for a point being affected by
natural volcanic phenomena (Felpeto,
Martí, and Ortiz, 2007). The term
vulnerability will be discussed as Ewert et
al. (2005) referred to it as those people and
property threatened in regions of
hazardous events. For the constraints of
this project, risk will consider the
possibility for loss of life and economic
resources (Felpeto et al.). Thus, here risk
will be used as the summation of hazards
and vulnerability.
Methods
When faced with an environmental hazard,
government officials, operation managers,
scientists, environmental groups and
landowners use formal or informal models
to assess the possible outcomes. Given
limited resources, time, and or expertise,
pragmatic choices will be made so there
are results with which to work. Therefore,
it is important to use the most accessible
and accurate data that is available
(Renschler, 2005).
Hazard Discussion
Understanding hazards and their
associated risk is important scientifically,
economically and politically. The Three
Sisters area presents a wide range of
potential volcanic eruptions, styles, and
hazards (Scott et al., 2001). The majority
of the hazards are driven by the eruption
of magma but debris avalanches and lahars
can exist without eruptive activity (Scott et
al.).
Tephra
Ash and rock fragments that are propelled
into the atmosphere from a rush of
expanding hot gas are called tephra. Large
particle pieces (fist-sized up to 1 meter or
more in diameter) will fall closest to vent
while smaller ash particles can rise more
than 30,000 feet and be carried tens to
hundreds of miles away. Tephra can cause
direct threats to life if deposit thicknesses
are large enough to collapse structures.
More often tephra causes hazards by
decreasing visibility, irritating eyes and
causing respiratory issues. Tephra clouds
pose significant threats to aircraft because
4
they interfere with the airplanes engines
and filters (Scott et al., 2001).
Pyroclastic Flow
Pyroclastic flows are significant volcanic
hazard. A pyroclastic flow is the mixture
of hot rock fragments, ash and gas that
flows down the sides of a volcano rather
than rising into the atmosphere to produce
tephra. If the mixture has a high density,
made mostly of rock, the flow is
controlled by topography. If the mixture
has a lower density, fewer rocks and
mostly gas, topography has little influence
on the surge (Walder, Gardner, Conrey,
Fisher, and Schilling, 1999). Most
pyroclastic flows remain in valleys and
travel no more than 6 miles (Scott et al.,
2001). Pyroclastic events are dangerous
because they travel at speeds of 30 to 90
miles per hour with temperatures greater
than 570 degrees Fahrenheit (Walder et
al.). These pyroclastic flows often will kill
any living thing in its path as well as
destroying all structures (Scott et al.).
Lahar
Lahars, like pyroclastic flows, contain
volcanic rocks and mud. Lahars contain
more water (Scott et al., 2001). Lahars
move at speeds of nearly 10 miles per hour
burying everything in their paths. Lahars
can cause problems long after the original
event. Lahars can inundate stream
channels with sediment causing unstable
paths and flooding (Walder et al., 1999).
Debris Avalanche
The steep sides of volcanoes can collapse
causing landslides referred to as debris
avalanches. Composite volcanoes are most
susceptible to debris avalanches from
volcanic unrest such as earthquakes or
steam explosions (Scott et al., 2001).
Avalanches can travel at speeds of 100
miles per hours up to 10 miles from
collapse. Avalanche paths are greatly
influenced by topography (Walder et al.,
1999). Structures and objects in the path
are often destroyed (Scott et al.). Deposits
of debris avalanches can block tributary
valleys causing unstable stream valleys
and forming lakes (Walder et al.).
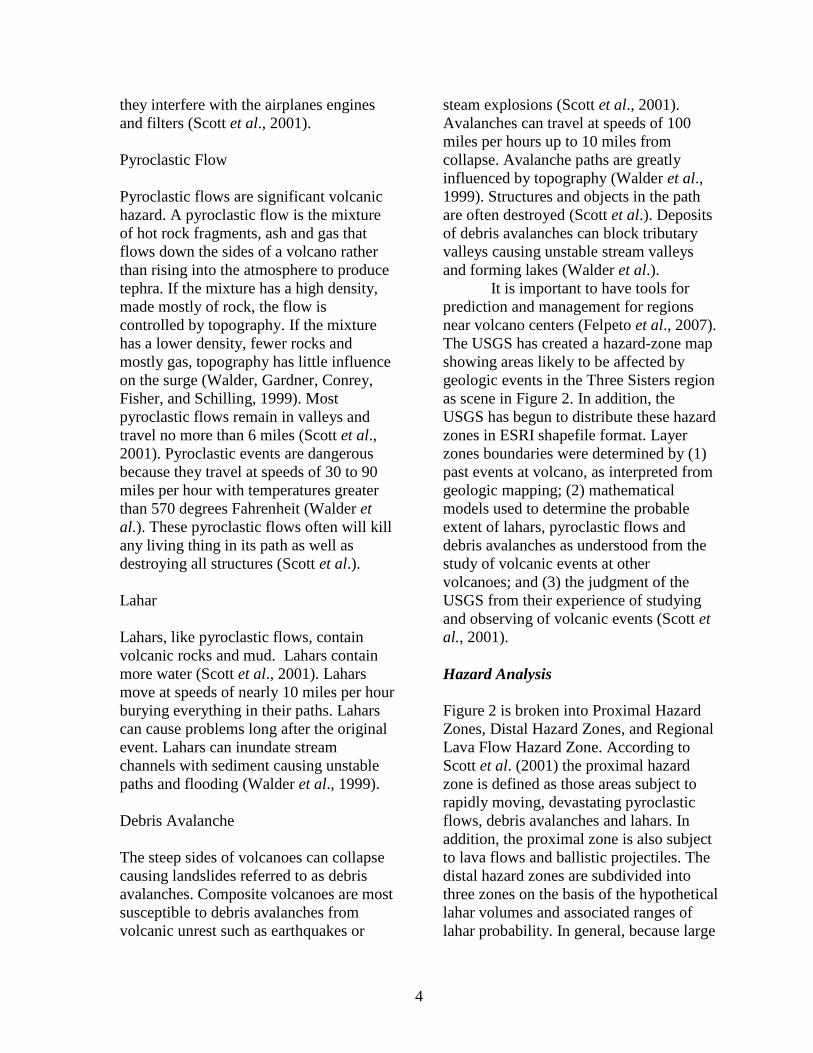
It is important to have tools for
prediction and management for regions
near volcano centers (Felpeto et al., 2007).
The USGS has created a hazard-zone map
showing areas likely to be affected by
geologic events in the Three Sisters region
as scene in Figure 2. In addition, the
USGS has begun to distribute these hazard
zones in ESRI shapefile format. Layer
zones boundaries were determined by (1)
past events at volcano, as interpreted from
geologic mapping; (2) mathematical
models used to determine the probable
extent of lahars, pyroclastic flows and
debris avalanches as understood from the
study of volcanic events at other
volcanoes; and (3) the judgment of the
USGS from their experience of studying
and observing of volcanic events (Scott et
al., 2001).
Hazard Analysis
Figure 2 is broken into Proximal Hazard
Zones, Distal Hazard Zones, and Regional
Lava Flow Hazard Zone. According to
Scott et al. (2001) the proximal hazard
zone is defined as those areas subject to
rapidly moving, devastating pyroclastic
flows, debris avalanches and lahars. In
addition, the proximal zone is also subject
to lava flows and ballistic projectiles. The
distal hazard zones are subdivided into
three zones on the basis of the hypothetical
lahar volumes and associated ranges of
lahar probability. In general, because large
5
lahars are less likely to occur than are
small lahars, the distal hazard zones show
the likelihood of lahar inundation
decreases as distances from volcanoes and
elevations above valley floors increase.
For the purpose of the USGS created
layers used in this analysis the small,
medium, and large lahars were divided as
20 million, 100 million, and 500 million
cubic meter hypothetical volumes
respectively (Scott et al., 2001). The last
zone included in the USGS hazard layer is
the regional lava flow hazard zone. Scott
et al. defines this as the area that could be
affected by eruptions of mafic volcanoes.
In this region hazards included: localized
thick tephra fall, ballistic projectiles,
pyroclastic flows near vents and lava
flows that typically travel less than 15
kilometers.
Figure 2. Hazard event probability map (no tephra
hazard included) created by the USGS symbolized
and defined by assigned hazard zones. See Figure 1
for site location details with site boundary in bold
black outline.
When faced with an environmental
hazard, government officials, operation
managers, scientists, environmental groups
and landowners use formal or informal
models to assess the possible outcomes.
Given limited resources, time, and/or
expertise, pragmatic choices are made so
that there are results to work with. Models
are developed with a particular problem in
mind (Renschler, 2005). This exact
problem may or may not be the same
reason that the program is being used in
the future. Furthermore, models are often
developed and tested using the best data
that can be collected. However, often
times when a model is being used it is
based on the best data that can be obtained
easily or at the moment. Thus, models
should be used with critical mindsets or
scaling (Renschler). Therefore, the
volcanic hazard layer created by the USGS
will be used for this study along with
digitized layers based from the USGS’s
already created tephra hazard maps.
All geology and volcano related
layers were gathered from the USGS.
Figure 3 is a representation of the regional
tephra-hazard maps created by the USGS.
In Figure 3, the map on the left shows
annual probability of deposition of 1
centimeter or more of tephra from any of
the major Cascade Volcanoes. Also in
Figure 3, the map on the right shows
annual probability of deposition of a more
major eruption causing 10 centimeters or
more of tephra from any of the major
Cascade Volcanoes. The darker the shade
of pink in Figure 3, the higher the
probability and higher hazard ranking. The
USGS has already assigned numeric levels
to each of the volcanic hazard layers but
for the sake of consistency and statistical
analysis for this study, these layers will be
reassigned values as shown in Table 1.
Hazard regions are not exact locations that
can change from one side of the road to
the other. For this reason, raster layers are
going to be used. The USGS volcanic
hazard event and tephra layers were
converted to raster layers using ArcGIS

6
Desktop version 10.0. The inputs used for
the conversion included cell sizes of 50
feet by 50 feet and cell values were
determined by the value that covered the
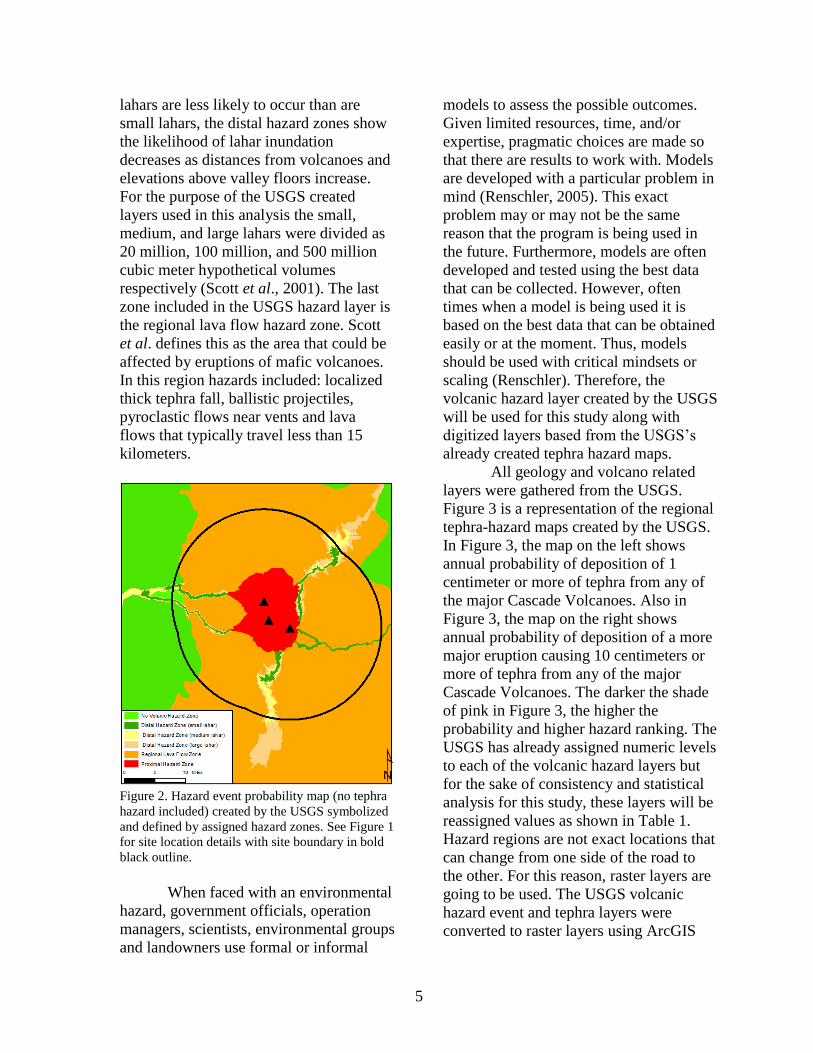
maximum area of each cell. The final step
in creating the hazard raster layer in Figure
4 was used with the spatial analyst
extension to add the tephra and the lahar
raster layers together. Note, it is important
in this analysis to make sure cells with no
data are populated with a value of zero
rather than having no data because the
default of spatial analyst is to only show
the sum of the cells with assigned values.
Figure 3. Tephra hazard map represented by layers
by the USGS showing the annual probability of
deposition of tephra from any major Cascade
Volcanoes.
Vulnerability Discussion
For this paper, vulnerability is defined as
the susceptibility of life, property or
environment damage if a hazard were to
occur (USGS, 2007). For this study, the
NOAA Vulnerability Assessment
Technique as described in their tool
created for the North Carolina, New
Hanover County Case Study was used.
According to NOAA, vulnerability
assessments describe the potential
exposure of people and the built
environment. The concept of vulnerability
needs to incorporate the differential
susceptibility and aspects of impacts to aid
in risk mitigation (Hill and Cutter, 2001).
Table 1. Table showing attribute values assigned to
vector data for GRID Code value classification in
raster dataset.
Layer Raster Value
No Volcanic Hazard Zone 0
Distal Hazard Zone (small lahar) 10
Distal Hazard Zone (medium lahar) 6
Distal Hazard Zone (large lahar) 4
Regional Lava Flow Zone 10
Proximal Hazard Zone 14
Tephra fallout 1 centimeter (1 in 500) 8
Tephra fallout 1 centimeter (1 in 1,00) 6
Tephra fallout 1 centimeter (1 in 5,000) 4
Tephra fallout 1 centimeter (1 in 10,000) 2
Tephra fallout 1 centimeter (<1 in 10,000) 0
Tephra fallout 10 centimeter (1 in 500) 7
Tephra fallout 10 centimeter (1 in 1,000) 5
Tephra fallout 10 centimeter (1 in 5,000) 3
Tephra fallout 10 centimeter (1 in 10,000) 1
Tephra fallout 10 centimeter (<1 in 10,000) 0
For this analysis, data layers were
gathered for each of the vulnerability
classes: critical facilities, environmental,
economic and societal combined to create
raster layers used for mitigation and risk
analysis (Appendix A).
Each vulnerability vector layer was
converted into a raster dataset by assigning
attribute values to each feature. Next, the
vector layers were converted to raster
layers using ArcGIS Desktop version 10.0.
The inputs used for the conversion
included cell sizes of 50 feet by 50 feet
and cell values were determined by the
value that covered the maximum area of
each cell. The final step in creating the
individual vulnerability layers required use
7
of the spatial analyst extension to add each
individual defined feature raster layers
together.
Figure 4. Volcanic hazard layer map created by the
addition of USGS volcanic events and tephra
deposition rasters. See Figure 1 for site location
details.
As in the hazard raster layer
creation, it was important in the
vulnerability analysis to make sure no data
cells were populated with zero rather than
a no data input because the default of
spatial analyst is to only show the sum of
the cells only with values; any no data
input values integrated with other values
would result in no data output values.
Critical Facilities Analysis
This analysis focuses on determining the
vulnerability of key individual facilities or
resources. Focusing on critical facilities
and structures allows for a more feasible
study of important areas in a community
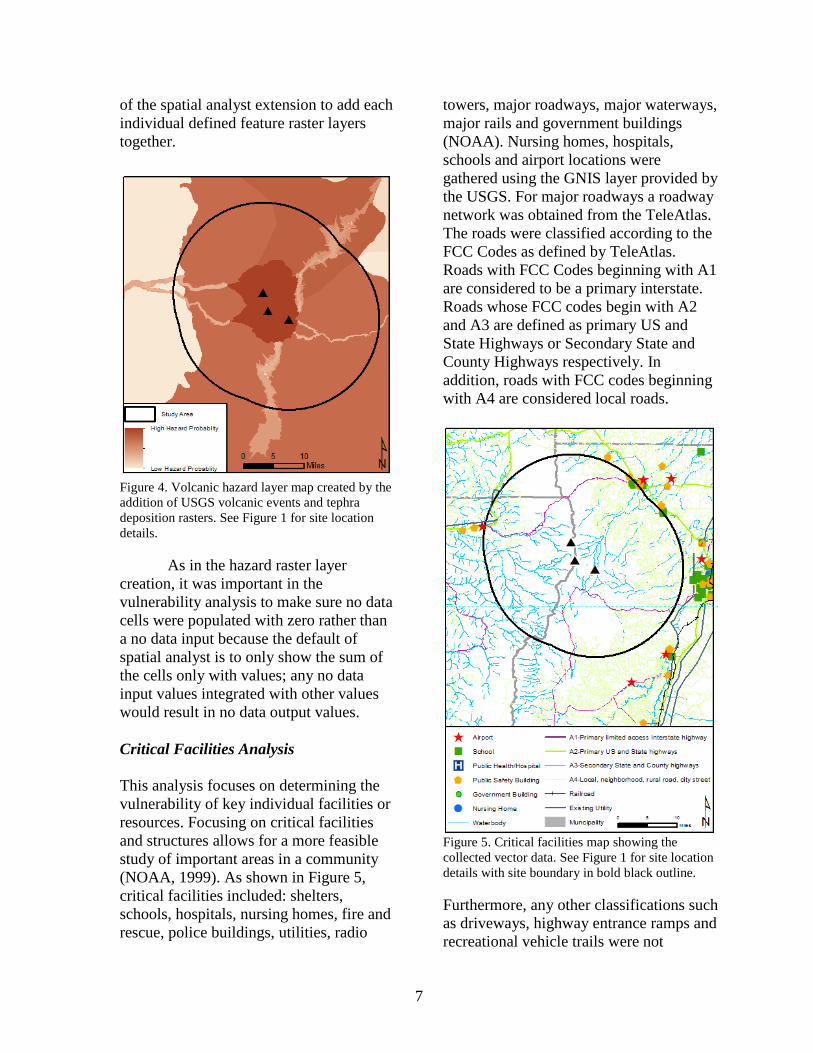
(NOAA, 1999). As shown in Figure 5,
critical facilities included: shelters,
schools, hospitals, nursing homes, fire and
rescue, police buildings, utilities, radio
towers, major roadways, major waterways,
major rails and government buildings
(NOAA). Nursing homes, hospitals,
schools and airport locations were
gathered using the GNIS layer provided by
the USGS. For major roadways a roadway
network was obtained from the TeleAtlas.
The roads were classified according to the
FCC Codes as defined by TeleAtlas.
Roads with FCC Codes beginning with A1
are considered to be a primary interstate.
Roads whose FCC codes begin with A2
and A3 are defined as primary US and
State Highways or Secondary State and
County Highways respectively. In
addition, roads with FCC codes beginning
with A4 are considered local roads.
Figure 5. Critical facilities map showing the
collected vector data. See Figure 1 for site location
details with site boundary in bold black outline.
Furthermore, any other classifications such
as driveways, highway entrance ramps and
recreational vehicle trails were not

8
considered for this analysis. Waterways
were defined by the Oregon Department of
Natural Resources waterbody layer and all
features were considered. Railways were
defined by the ESRI Streetmap layers.
City boundaries were gathered from the
Oregon Department of Transportation.
Existing major utility lines were collected
from the Digital Chart of the World Data
that was originally created for the Defense
Mapping Agency but is now incorporated
as an ESRI product.
The first step in converting the
vector data of the critical infrastructures
into a raster dataset was to assign values to
each attribute as shown in Table 2. Similar
to the volcanic hazard regions, critical
infrastructure vulnerability goes beyond
the exact location of the building; for this
reason, each vector layer was buffered by
the values in Table 2 before being
converted to raster. As described
previously, the next step included
converting each vector layer to raster
layers. The sum of each of these layers
depicts the final critical infrastructure
vulnerability layer (Figure 6).
Environmental Analysis
This analysis has two parts: first, to
identify potential for secondary
environmental impacts and second, to
identify critical natural resources (NOAA,
1999). Secondary impacts occur when
natural hazard events create new hazards
such as toxic releases or hazardous spills.
Therefore, it was necessary to locate key
sites where hazardous and/or toxic
materials exist (NOAA). In this region
critical environmental resources included
areas marked off as wildlife refuges, old
growth forests, and surface water intakes.
The original format of this data can
be seen in Figure 7. Data was collected for
forested areas by the OregonGAP analysis
program.
Table 2. Table showing attribute values assigned to
vector data for GRID Code value classification in
raster dataset as well as buffer distance given to
each facility for the creation of the raster layer.
Layer Raster Value
Buffer Distance
(ft.)
Airport 5 50
Public Health Building/Hospital 5 50
Public Safety Building 5 50
Government Building 5 50
Schools 5 50
Nursing Homes 5 50
Primary Interstate (Streets FCC Codes A1*) 5 50
Primary US and State Highway (Streets FCC Codes A2*) 4 50
Secondary State and County Highway (Streets FCC Codes A3*) 3 50
Local road (Streets FCC Codes A4*) 2 50
Railroad 5 50
Waterbody 5 20
Utilities 5 50
Municipality 10 0
Figure 6. Critical infrastructure vulnerability raster
layer map created by the addition of various critical
infrastructure locations. See Figure 1 for site
location details.

9
A national dataset of public lands was
obtained from the Conversation Biology
Institute (CBI) and was used to determine
federal lands. These lands are owned by
the Federal government and may include
wildlife refuges, national parks and
national forests. Toxic release/hazard spill
sites were obtained from the Oregon
Department of Environmental Quality’s
Environmental Cleanup Site Information
(ECSI) database. The ECSI data was
imported based on coordinate values for
each site in ArcGIS Desktop to create a
shapefile.
Figure 7. Environmental concern map showing the
collected vector data. See Figure 1 for site location
details.
The first step in converting the
vector data of the environmental layers
into a raster dataset was similar to the
other vulnerability assessments. To begin
it was necessary to assign values to each
attribute as shown in Table 3. The toxic
release/hazard spill sites are point
locations; therefore, each point was given
a 50 foot buffer similar to those point
locations in the critical infrastructure
analysis. Vector layers were then
converted to raster layers and finally
added together to create the environmental
vulnerability layer in Figure 8.
Table 3. Table showing attribute values assigned to
vector data for GRID Code value classification in
raster dataset.
Layer Raster Value
Toxic Release/Hazard Spill Site 5
Drinking Water Surface Area 5
Federal Land 5
Forested Land 5
Figure 8. Environmental vulnerability raster layer
map created by the addition of various environment
layers. See Figure 1 for site location details.
Economic Analysis
The purpose of this section focuses on
identifying major economic centers that
could have impacts on the local
community (NOAA, 1999). In this study
economic vulnerabilities were limited to:
natural resource and mining locations,
agricultural land, industrial centers and
any Fortune500 companies (NOAA).
According to CNNMoney Fortune
(2011) there are only two Fortune500

10
companies in Oregon: Nike and Precision
Castparts. The addresses of these two
companies were gathered and
georeferenced to create a shapefile.
Mining locations were gathered using the
GNIS layer provided by the USGS. For
land of value in particular: agricultural and
industrial land, a zoning layer was
collected from the Department of Land
Conservation. Areas zoned as agricultural,
industrial, natural resource and
commercial were considered to be of
economic vulnerability and land of
significant value for the constraints of this
paper. As discussed above, these were the
layers gathered to determine areas of
economic vulnerability and can be seen in
Figure 9.
Figure 9. Economic areas of concern map showing
the collected vector data. See Figure 1 for site
location details.
The first step in converting vector
data of the economic analysis into a raster
dataset was to assign values to each
attribute as shown in Table 4. Similar to
the critical infrastructure analysis, many of
the economic vulnerabilities go beyond the
exact location. For this reason, both the
Fortune500 companies and mine locations
were buffered by 50 feet before being
converted to raster. The vector layers were
then converted to raster layers. The final
step taken to create the economic
vulnerability layer in Figure 10 was to use
the spatial analyst extension to add the
individual raster layers together.
Table 4. Table showing attribute values assigned to
vector data for GRID Code value classification in
raster dataset as well as buffer distance given to
each facility for the creation of the raster layer.
Layer Raster Value
Land Use of Significant Value (Zoning codes as: Agricultural, Natural Resource, Commercial, and Industrial) 10
Land Use of Other Value (Zoning code as: Coastal, Forestry, Public Lands, Non Resource, Residential, Urban, and Water) 0
Fortune 500 Business Location 5
Mines 5
Figure 10. Economic vulnerability raster layer map
created by the addition of raster classification
layers. See Figure 1 for site location details.
Societal Analysis
This section helps to identify special
considerations where individual resources

11
are minimal and personal resources for
dealing with hazards can be extremely
limited (NOAA, 1999). In this study
special consideration areas were defined as
follows:
Minority populations may indicate
possibility of language or cultural
barriers.
Senior citizen population (over age
65) indicates possible mobility or
cultural considerations.
Single parent households may
indicate special child care
considerations.
Rental areas indicate areas where
households that may not have
insurance for possessions (NOAA).
For the societal vulnerability analysis,
2000 Census data was used. Demographic
data was summarized on the tract level.
Although the 2010 census data has been
completed, the summarized demographics
were not yet available on the ESRI
download site. ESRI had both the block
geospatial shapefiles and the summary
files that could be joined with shapefile for
analysis.
The percentages for the senior
citizen and minority vulnerabilities were
found for each tract group by taking the
total count of persons in consideration,
dividing it by the total population and then
multiplying the result by 100. Note, all
considerations that were considered non-
white were incorporated into the minority
populations. The percentages for rental
households and single parent household
vulnerabilities were found for each tract
group by taking the count of households in
the considerations, dividing it by the total
number of households and then
multiplying the result by 100. For each
societal factor the percentages were
divided into 5 equal interval classes based
on an interval that would include the
highest percentage of each vulnerability.
This analysis included census tract data for
the four counties of: Lane, Linn,
Deschutes, and Jefferson. Therefore, each
vulnerability was divided into unique
classes (Figure 11) that are relative to its
maximum and minimum values in the
region.
Figure 11. Societal areas of concern maps showing
the collected census vector data. See Figure 1 for
site location details. Study Area is in thick black
outline on each map.
The census vector data were then
converted into a raster dataset with the
assigned values from Table 5. The final
step in creating the societal vulnerability

12
layer in Figure 12 included using the
spatial analyst extension to add each
individual societal raster layers together,
as was done for the creation of every other
vulnerability layer.
Table 5. Table showing attribute values assigned to
vector data for GRID Code value classification in
raster dataset.
Layer Raster Value
Minority: Class Break 5 (Percent 80-100%) 5
Minority: Class Break 4 (Percent 60-80%) 4
Minority: Class Break 3 (Percent 40-60%) 3
Minority: Class Break 2 (Percent 20-40%) 2
Minority: Class Break 1 (Percent 0-20%) 1
Senior Citizen Age 65 and Up: Class Break 5 (Percent 0-8%) 5
Senior Citizen Age 65 and Up: Class Break 4 (Percent 8-16%) 4
Senior Citizen Age 65 and Up: Class Break 3 (Percent 16-24%) 3
Senior Citizen Age 65 and Up: Class Break 2 (Percent 24-32%) 2
Senior Citizen Age 65 and Up: Class Break 1 (Percent 32-40%) 1
Single Parent Household: Class Break 5 (Percent 0-6%) 5
Single Parent Household: Class Break 4 (Percent 6-12%) 4
Single Parent Household: Class Break 3 (Percent 12-18%) 3
Single Parent Household: Class Break 2 (Percent 18-24%) 2
Single Parent Household: Class Break 1 (Percent 24-30%) 1
Renter Household: Class Break 5 (0-10%) 5
Renter Household: Class Break 4 (10-20%) 4
Renter Household: Class Break 5 (20-30%) 3
Renter Household: Class Break 5 (30-40%) 2
Renter Household: Class Break 5 (40-50%) 1
Risk Discussion
The final stage of analysis in this study
was the creation of the risk layer (Figure
13). The sum of the comprehensive
vulnerability and hazard layers created a
raster that depicted inherent risk. Some
data manipulation was needed before
combining all layers. First, all layers had
to be in raster format. All layers had to
have the same extent as well as same cell
size. In addition, as in the creation of the
hazard and vulnerability layers it was
necessary to make sure no data cells were
populated with zero rather than a no data
value.
Figure 12. Societal vulnerability raster layer map
created by the addition of various census raster
classification layers. See Figure 1 for site location
details.
This risk layer is beneficial to city
planners. It shows areas with the least risk
that would be best suited for future
development. Furthermore, this layer
would also be useful to emergency
response teams so that they know where to
focus resources in the case of a volcanic
event. This layer could also be used to
educate the community so that residents
can better understand the risks associated
to their surroundings.
Analysis
Although the risk layer created during this analysis is beneficial as a macro overview of
areas at risk for the Three Sister Volcanic
13
region, it was still necessary for more
analysis to be done to point out specific
areas of concern for mitigation purposes.
According to NOAA (1999), mitigation is
the effort to lessen the effect that natural
hazards have on surrounding populations
and property. The first stage of this
analysis was to identify the areas that had
higher probability of volcanic hazards to
occur. The second stage was to identify
those considerations that were considered
to be vulnerable to those hazards.
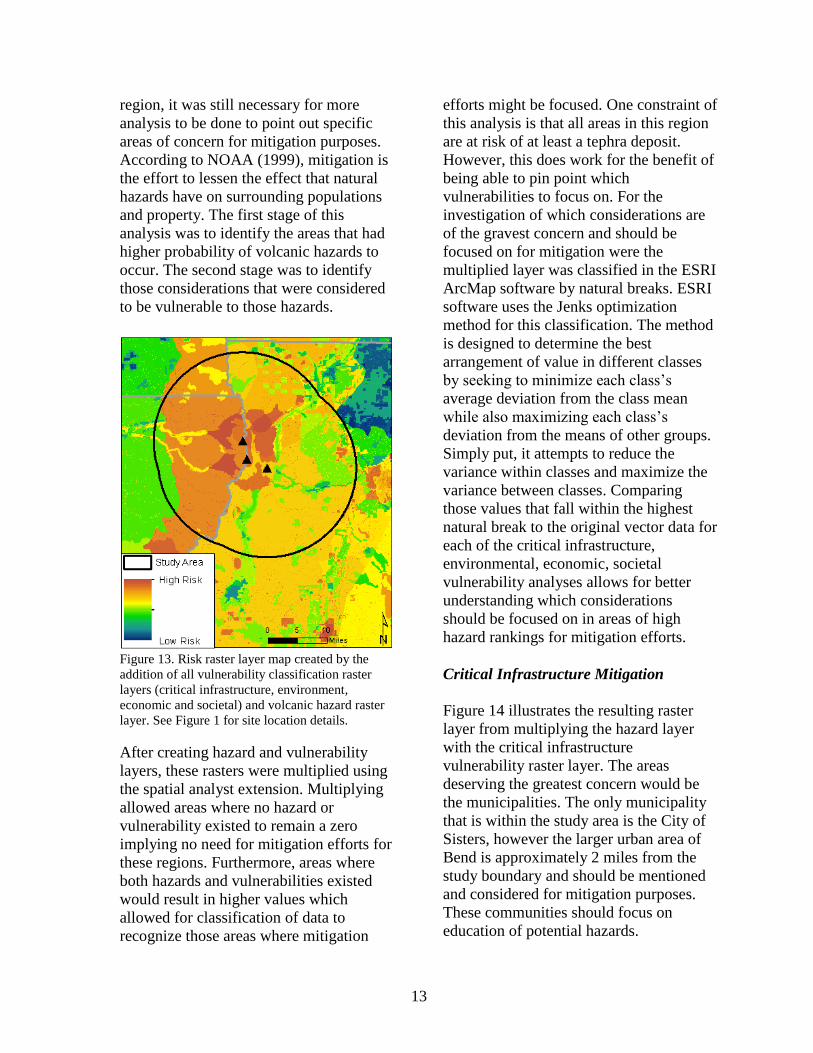
Figure 13. Risk raster layer map created by the
addition of all vulnerability classification raster
layers (critical infrastructure, environment,
economic and societal) and volcanic hazard raster
layer. See Figure 1 for site location details.
After creating hazard and vulnerability
layers, these rasters were multiplied using
the spatial analyst extension. Multiplying
allowed areas where no hazard or
vulnerability existed to remain a zero
implying no need for mitigation efforts for
these regions. Furthermore, areas where
both hazards and vulnerabilities existed
would result in higher values which
allowed for classification of data to
recognize those areas where mitigation
efforts might be focused. One constraint of
this analysis is that all areas in this region
are at risk of at least a tephra deposit.
However, this does work for the benefit of
being able to pin point which
vulnerabilities to focus on. For the
investigation of which considerations are
of the gravest concern and should be
focused on for mitigation were the
multiplied layer was classified in the ESRI
ArcMap software by natural breaks. ESRI
software uses the Jenks optimization
method for this classification. The method
is designed to determine the best
arrangement of value in different classes
by seeking to minimize each class’s
average deviation from the class mean
while also maximizing each class’s
deviation from the means of other groups.
Simply put, it attempts to reduce the
variance within classes and maximize the
variance between classes. Comparing
those values that fall within the highest
natural break to the original vector data for
each of the critical infrastructure,
environmental, economic, societal
vulnerability analyses allows for better
understanding which considerations
should be focused on in areas of high
hazard rankings for mitigation efforts.
Critical Infrastructure Mitigation
Figure 14 illustrates the resulting raster
layer from multiplying the hazard layer
with the critical infrastructure
vulnerability raster layer. The areas
deserving the greatest concern would be
the municipalities. The only municipality
that is within the study area is the City of
Sisters, however the larger urban area of
Bend is approximately 2 miles from the
study boundary and should be mentioned
and considered for mitigation purposes.
These communities should focus on
education of potential hazards.

14
In addition, within the study area,
other areas of concern would be major
roadways. Where major commute routes
fall within lahar flood zones, alternative
routing should be preplanned. Finally, this
information provides an overview of the
potential for future development in areas
that are not at risk. In addition, it can show
where emergency response facilities
should be built in relation to high risk
areas.
Environmental Mitigation
The multiplication of the environmental
vulnerability raster layer and the hazard
layer is represented in Figure 15. When
comparing this layer to the original vector
data the areas of greatest concern are those
areas that are mapped as drinking water
surface intake areas. One method of
mitigation for this region would be to
make sure there would be bottled water or
filtered water options for citizens that
receive water from wells within those
areas.
Although not present in the
immediate study area, one other area of
concern would be the secondary
environmental hazards that are present if a
disaster were to happen near an already
environmental sensitive area such as toxic
release and hazard spill areas. These sites
should have education trainings and
assessments done to identify methods of
mitigation in a volcanic event.
Economic Mitigation
Figure 16 illustrates the resulting raster
layer from multiplying the hazard layer
with the economic vulnerability raster
layer. The areas deserving greatest
concern would be areas that were zoned to
have economic value.
Areas of most concern are zoned as
Figure 14. Critical infrastructure mitigation raster
layer map. Areas with higher values require the
most consideration for mitigation efforts. See
Figure 1 for site location details.
Figure 15. Environmental mitigation raster layer
map. Areas with higher values require the most
consideration for mitigation efforts. See Figure 1
for site location details.
areas of natural resources by the
Department of Land Conservation. This
information provides an overview of the
potential for future development in areas
that are not at risk. This is mainly due to
City of Sisters

15
the fact there are no Fortune500
companies or mines in the region.
Figure 16. Economic mitigation raster layer map.
Areas with higher values require the most
consideration for mitigation efforts. See Figure 1
for site location details.
Societal Mitigation
The multiplication of the societal
vulnerability raster layer and the hazard
layer is represented in Figure 17. When
comparing this layer to the original Census
vector data, the vulnerabilities of greatest
concern are the regions are senior citizen
populations and single parent households.
Although the Census data shows
population at risk, it still leaves wide
geographical areas of these vulnerabilities.
One could suggest a further study
of the Census blocks rather than the tracts,
to get a clearer picture of population
concerns. Once these areas are identified,
the communities should offer special
hazard mitigation education. Information
could be delivered through schools,
community centers and business centers.
Special evacuation plans need to be in
place for the senior citizen populations
with mobility needs. In addition, efforts
should be made to help single parents that
will have limited resources for child care
needs.
Figure 17. Societal mitigation raster layer map.
Areas with higher values require the most
consideration for mitigation efforts. See Figure 1
for site location details.
Results
The analysis of risks, hazards, and
vulnerabilities in the Three Sisters Region
using GIS helped identify where future
hazard mitigation projects should be
focused. In reviewing the volcanic hazard
analysis, it is import to focus on
minimizing impacts from the hazards in
the following order: pyroclastic flow
areas, debris avalanches, tephra fallout
areas and lahars. Furthermore, it should go
without saying that mitigation efforts
should be prioritized according to
proximity to high-risk areas. In addition,
considerations of high vulnerability should
also warrant mitigation efforts.
In the Three Sister region, the
urban areas of Bend and the City of Sisters
16
should have emergency response
procedures in place in the event of a
volcanic eruption. In association with this,
the municipalities and critical
infrastructure of major commuter routes
should have planned detours and reroutes
in place before an emergency. Another
vulnerability that should be mitigated is
drinking water in the area. This includes
the number of waterways in the area and
the amount they contribute to the drinking
water in the west side of the study area.
Consideration for land that is zoned as
natural resource should be incorporated
into city planning and facility emergent
management plans should be required in
these areas. Finally, the study of the
societal vulnerabilities in the region
identified that single parent households
and senior citizens are at risk in the Three
Sisters Volcanic Area. In conclusion,
communities in high hazard areas or areas
with significant vulnerabilities should be
offered special hazard mitigation
education.
Conclusions
The Three Sisters Volcanic region is one
of 9 threatening volcanoes within the
Cascades volcanic arc. With planning,
education and mitigation done before an
eruption, hazards, vulnerabilities and risks
can be assessed before an event occurs.
The creation of a procedure using GIS
helps in automating the very complicated
and lengthy processes of creating a risk
assessment. Responses to volcanic events
can be better handled with an
understanding of how communities will be
affected.
Suggestions for Future Analysis
The study area for this project was focused
on the proximity surrounding the volcanic
center, future studies might focus on
communities such as the City of Sisters or
Bend that are near volcanic regions to
better anticipate what the denser
population areas will need to know to
respond to volcanic events. The data
incorporated in this study included data
that was easily accessible and free. County
data or field verified data in the region
would more accurately portray the
hazards, vulnerabilities and risks in the
region.
Acknowledgements
I would like to acknowledge and thank
Saint Mary’s University faculty and staff:
John Ebert and Dr. David McConville. My
appreciation is also extended to my fellow
graduate students and GIS colleagues for
their support throughout my graduate
studies. In particular: Brooke Roecker,
Randy McGregor, John Boentje and Jesse
Bernhardt. Most importantly I would like
to extend a special thanks to family
(Mama, Papa, Shannon and Darlene) and
friends for their support throughout this
process.
References
For all geospatial data see Appendix A.
CNNMoney Fortune. 2011. “Fortune 500:
Our annual ranking of America’s largest
corporations.” Retrieved February 8,
2011 from http://money.cnn.com/
magazines/fortune/fortune500/2010/state
s/OR.html.
Dzurisin, D., Lisowski M., Wicks, C. W.,
Poland, M. P., and Endo, E. T. 2006.
Geodetic observations and modeling of
magmatic inflation at the Three Sisters
volcanic center, central Oregon Cascade
Range, USA. Journal of Volcanology
and Geothermal Research 150, 35-54.

17
Retrieved January 16, 2008:
ScienceDirect database.
Ewert, J. W., Guffanti, M. and Murray, T.
L. 2005. An assessment of volcanic
threat and monitoring capabilities in the
United States: Framework for a National
Volcano Early Warning System: U.S.
Geological Survey Open-File Report
2005-1164. Retrieved February 8, 2008:
http://pubs.usgs.gov /of
/2005/1164/.html.
Felpeto, A., Martí J., and Ortiz, R. 2007.
Automatic GIS-based system for
volcanic hazard assessment. Journal of
Volcanology and Geothermal Research
166, 106-116. Retrieved January 22,
2008 from the ScienceDirect database.
Hill, Arleen A., and Susan L. Cutter. 2001.
"Methods for Determining Disaster
Proneness." Chapter 2, in American
Hazardscapes: The Regionalization of
Hazards and Disasters, Susan L. Cutter
(ed.). Washington, DC: Joseph Henry
Press. Retrieved February 23, 2011
from the ScienceDirect database.
NOAA Coastal Service Center 1999.
“Community Vulnerability Assessment
Tool.” Retrieved February 8, 2011 from
http://www.csc.noaa.gov/ products/nchaz/tut.htm.
Renschler, C. S. 2005. Scales and
uncertainties in using models and GIS
for volcano hazard prediction. Journal of
Volcanology and Geothermal Research
139, 73-87. Retrieved January 16, 2008
from the Science Direct database.
Scott, W. E., Iverson R. M., Schilling S.
P., and Fischer, B. J. 2001. Volcano
hazards in the Three Sisters Region,
Oregon: U.S. Geological Survey Open-
File Report 99-437. Retrieved January
16, 2008 from http://geopubs.wr.
usgs.gov/open-file/of99-437/.
Tilling, R. I., Topinka, L., and Swanson,
D. A. 1990. Eruptions of Mount St.
Helens: Past Present, and Future. U.S.
Geological Survey Special Interest
Publication, 56. Retrieved January 16,
2008 from the ScienceDirect database.
USGS. 2007. Three Sisters Vicinity -
Information Statement, April 11, 2007.
Retrieved February 8, 2008 from
http://vulcan.wr.usgs.gov/Volcanoes/Sist
ers/WesternUplift/information_statement
_04-11-07.html.
Walder, J. S., Gardner, C. A., Conrey, R.
M., Fisher, B. J., and Schilling, S. P.
1999. Volcano hazards in the Mount
Jefferson Region, Oregon: U.S.
Geological Survey Open-File Report 99-
24. Retrieved January 16, 2008 from
http://geopubs.wr. usgs.gov/open-
file/of99-24/.

18
Appendix A. Geospatial Data.
Source Date Published
Website Date Collected
Base
Oregon/Washington Bureau of Land Management 1/1/2001
http://oregon.gov/DAS/EISPD/GEO/alphalist.shtml 3/9/2011
Oregon/Washington Bureau of Land Management 9/1/2007
http://oregon.gov/DAS/EISPD/GEO/alphalist.shtml 3/9/2011
Oregon Department of Transportation 10/8/2009
http://oregon.gov/DAS/EISPD/GEO/alphalist.shtml 3/9/2011
USGS Geographic Names Information System 5/1/2009
http://gis.oregon.gov/DAS/EISPD/GEO/alphalist.shtml 3/13/2011
Hazard
USGS Cascade Volcano Observatory 1/1/1986
http://geopubs.wr.usgs.gov/open-file/of99-437/of99-437map.pdf 2/24/2011
USGS Cascade Volcano Observatory 1/1/1986
http://geopubs.wr.usgs.gov/open-file/of99-437/of99-437map.pdf 2/24/2011
Societal Vulnerability
US Census 1/1/2000
http://arcdata.esri.com/data/tiger2000/tiger_statelayer.cfm?sfips=41 3/29/2011
Critical Facilities Vulnerability
USGS Geographic Names Information System 5/1/2009
http://gis.oregon.gov/DAS/EISPD/GEO/alphalist.shtml 3/13/2011
USGS Geographic Names Information System 5/1/2009
http://gis.oregon.gov/DAS/EISPD/GEO/alphalist.shtml 3/13/2011
USGS Geographic Names Information System 5/1/2009
http://gis.oregon.gov/DAS/EISPD/GEO/alphalist.shtml 3/13/2011
Homeland Security Infrastructure Program TechniGraphics Inc 2/2/2008
http://gis.oregon.gov/DAS/EISPD/GEO/alphalist.shtml 3/13/2011
Homeland Security Infrastructure Program TechniGraphics Inc 9/19/2008
http://gis.oregon.gov/DAS/EISPD/GEO/alphalist.shtml 3/13/2011
Homeland Security Infrastructure Program TechniGraphics Inc 12/30/2009
http://gis.oregon.gov/DAS/EISPD/GEO/alphalist.shtml 3/13/2011
ESRI Streetmap 1/1/2003
ESRI Basedata CDs 3/9/2011
ESRI Streetmap 1/1/2007
ESRI Basedata CDs 3/9/2011
Defense Mapping Agency 1/1/2000
http://data.geocomm.com/ 3/27/2011
ESRI Streetmap 1/1/2007
ESRI Basedata CDs 3/9/2011
Economic Vulnerability
USGS Geographic Names Information System 5/1/2009
http://gis.oregon.gov/DAS/EISPD/GEO/alphalist.shtml 3/13/2011
Department of Land Conservation and Development 5/1/1986
http://gis.oregon.gov/DAS/EISPD/GEO/alphalist.shtml 3/29/2011
CNN Fortune 500 5/3/2010
http://money.cnn.com/magazines/fortune/fortune500/2010/states/OR.html 3/29/2011
Environmental Vulnerability
Conservation Biology Institute 1/20/2001
http://databasin.org/protected-center/features/PAD-US-CBI 1/1/2011
Oregon GAP Analysis Program 3/13/2011
http://gis.oregon.gov/DAS/EISPD/GEO/alphalist.shtml 1/1/1993
Oregon Department of Environmental Quality 3/20/2011
http://www.deq.state.or.us/lq/ECSI/ecsi.htm 2/28/2011
Oregon Department of Environmental Quality 3/13/2011
http://gis.oregon.gov/DAS/EISPD/GEO/alphalist.shtml 9/15/2003
Oregon Zoning
Mines
Wildlife Public Land
Major waterways
Major rails
County Boundaries
Drinking Water Intake Sites
Fortune 500 companies
Utilities
Data Name
State Boundary
Fire Buildings
Forested Land
Known Hazard/Toxic Sites
Police Buildings
Major roadways
Schools
Airports
Government Buildings
Municipality Boundaries
Three Sister Summits
USGS hazard shapefile for Three Sisters
Tephra
Census data
Hospitals