glennb/mm/designdocpipeline.doc · web viewan arrow will point from the cpu chip to the memory chip...
TRANSCRIPT

Joshua HanningsJoseph RummelAndrew Pobuda
Design Document
Overall User Interface
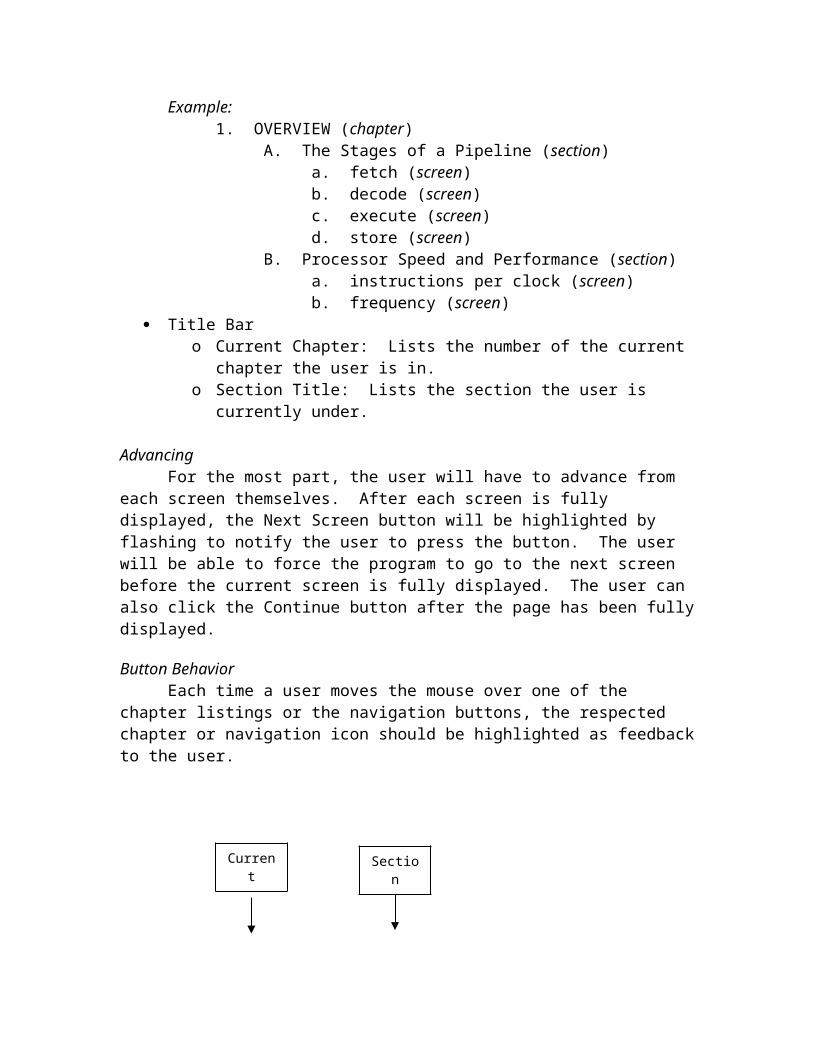
Interface LayoutAn example of our genaral interface is pictured on the next page. Navigation is
implemented on the left and bottom portions of the screen. The main goal of our interface is to keep it as simple as possible so that the user should have a very easy time navigating our software. To simplify the interface, we made sure to limit the number of buttons which we feel are straightforward and self-explanatory.
Interface Funtions Chapter Listing (see below for chapter examples)
o The various chapters are listed on the left side of the screen. This listing allows the user to jump from one particular chapter to another.
o Each jump to a chapter should go the first page in each chapter. Navigation Buttons (see below for section and screen examples)
o Previous Section: Jump to the previous section under the current chapter.o Previous Screen: Move to the previous screen under the current section.o Next Screen: Move to the next screen under the current section.o Next Section: Jump to the previous section under the current chapter.o Continue: Continue on to the next page in the chapter.o Help: Gives user help with navigating through the software.
Example:1. OVERVIEW (chapter)
A. The Stages of a Pipeline (section)a. fetch (screen)b. decode (screen)c. execute (screen)d. store (screen)
B. Processor Speed and Performance (section)a. instructions per clock (screen)b. frequency (screen)
Title Baro Current Chapter: Lists the number of the current chapter the user is in.o Section Title: Lists the section the user is currently under.
AdvancingFor the most part, the user will have to advance from each screen themselves.
After each screen is fully displayed, the Next Screen button will be highlighted by flashing to notify the user to press the button. The user will be able to force the program
to go to the next screen before the current screen is fully displayed. The user can also click the Continue button after the page has been fully displayed.
Button BehaviorEach time a user moves the mouse over one of the chapter listings or the
navigation buttons, the respected chapter or navigation icon should be highlighted as feedback to the user.
Previous Section
Previous Screen
Next Screen
Next Section
Exit Program
Jump to chapter:1, 2, 3, 4
Jump to beginning
Current Chapter
Section Title
Help
Continue
Text Styles
Font TypeFor our program we will use the Arial and Arial Black fonts. These fonts match
the ones used in the interface which is Arial Black. Arial will be used more widely for some of the lengthier text sections. Arial Black, since it is a heavier font will be used mainly for emphasis and titles of sections.
VoicesSince there is basically only one voice used in this software, there will generally
only be one associated style. This text is intended to be simple and of a relative medium size with a darker color which is meant to stand out clearly from the light background of the presentation’s body. At certain points we will use a different color font to highlight important key words or phrases that are important
Font Styles Standard
o This font is used as the main font throughout the multimedia. Used for all descriptions and explanations for the different sections.
o Arial, size: 12-14pt, color: black or dark-gray (should be clearly legible against the light-gray background)
Standard Redo This font is used to highlight words or phrases that we deem important in
the main body of text for each page.o Arial, size: 12-14pt, bold, color: red
Screen Titleo This text is used as the title for each individual screen. This font is
normally only used at the top of the screen.o Arial Black, size: 16-18pt, color: red
Example Descriptiono This font is used to explain the examples and illustrations used on each
screen. This font should be similar in size to Standard but noticeably different.
o Arial, size: 12-14pt, color: medium blue (should be clearly legible against the light-gray background)
Emphasized Standardo This font is used whenever emphasis is needed which is not provided by
any of the other above fonts. It will be of the same style as Standard, but a different color.
o Arial, size: 12-14pt, color: medium blue

AudioWe do not plan on actually recording and producing any of our own sound effects
because we do not plan on using voice-overs in our multimedia. We feel that narrating the lessons in the software, limits the user to follow the pace of set by the designer.
For the most part we will use freely available sound effects to add further interactivity to the user interface and buttons. The buttons on the bottom of the user interface will make a clicking sound when they are clicked by the mouse. The chapter buttons to the left of the interface will have a different sound. Additionally, if we are able to locate the proper sounds, we will use sound effects to add to the actual content of the presentation (i.e. Factory sound effects for the assembly line example and washing machine sounds for the laundry portion of our presentation).
The audio format will be wav files because of their universality. Wav files are also easy to edit and recognized by all multimedia-authoring tools. The size of wav files should not prove to be an issue as the sound effects in the software will be very sort in length which will limit the sounds effect’s size.
GraphicsThe main standardized graphics used in the multimedia will be the buttons in the
interface. Obviously, these graphics need to be used throughout the presentation. Additionally, the other standardized graphics will consist of the few items used more than once. These items consist of the various representations of the memory, CPU, and the stages of the pipeline. Other graphics we find that we need to use more than once will be then standardized by putting them in our media library.
For all pictures we will use the JPEG image format because of its standard in most every multimedia application. For animation, Flash will be used because of its relative ease of use and small file size.
Media ArchivingJoshua Hannings will archive all of the various media. The multimedia content
will be kept in a separate directory from that of all the Authorware content.
Introduction:
The words “Pipelined Processor” will appear in bold, large font, centered on the screen. Below “Pipelined Processor”, also centered, will be “Joshua Hannings”. Below that will be “Andrew Pobuda”. Below that will be “Joseph Rummel”. In the background, there will be three broken lined, unfilled, circles spinning.

Design for Chapter 1
Bold words in the text section of each screen means this word should be in the emphasized standard font. Otherwise, use standard font for text.Section 1: The Stages of a Pipeline
Screen 1:Graphics: A memory chip image and a CPU image will be positioned
horizontally from each other on the top of the screen. An arrow will point from the memory chip to the CPU image. The word “instruction” will appear below the memory chip and move from the memory chip to the CPU image. Then it will disappear and repeat the cycle.
Title: The First Stage: Fetch Text: The first step in pipelining is to fetch an instruction. The instruction is
stored in the memory and is moved to the CPU where it will be used in the next stage.
Screen 2:Graphics: The CPU image will be centered at the top of the screen. The word
“instruction” will be appear to the left of the CPU image. “instruction” will move into the CPU and the number“0100110” will come out of the right side of the CPU, move across the rest of the screen and disappear. The cycle is then stared over.
Title: The Second Stage: Decode Text: The second stage of the pipeline is to take the previously fetched
instruction and decode the instruction into a form that the CPU can understand.This often involves the decoding of machine code into a binary number format.
Screen 3:Graphics: The CPU graphic is centered at the top of the screen. The binary
number “0011” appears to the top left of the CPU chip and moves into it. A “3” comes out of the top right of the CPU. Then, “10110110” appear to the middle left of the CPU and moves into the chip. A “+” comes out of the middle right of the chip. Then “0100” appears to the bottom left of the CPU and moves into the chip. A “4” comes out of the bottom right of the chip. Then “= 7” appears next to the “4”. Then, all the numbers disappear and the cycle starts over.
Title: The Third Stage: Execute Text: The third stage of pipelining is the execution stage. The CPU executes the
binary instruction to determine the proper solution to the problem.
Screen 4:Graphics: A CPU chip image and a memory chip image will be positioned
horizontally from each other on the top of the screen. An arrow will point from the CPU chip to the memory chip image. The word “result” will appear below the CPU chip and move from the CPU chip to the memory chip. Then it will disappear and repeat the cycle.
Title: The Fourth Stage: Store Text: The last stage of a pipeline is to store the solution. The result is sent from
the CPU to the memory to be stored in an address.
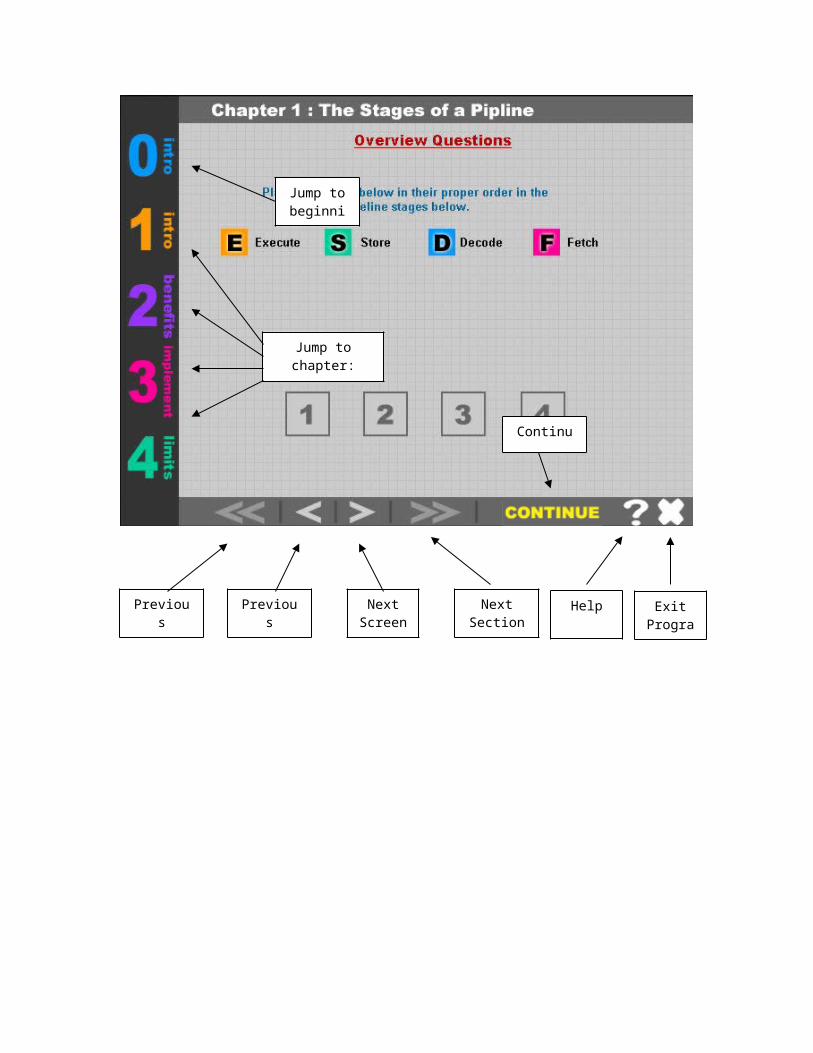
Screen 5:Graphics: Appearing horizontally across the top of the screen are an orange
square with “Execute” to the right of it and “E” inside it, then a green square with “Store” to the right of it and “S” inside it , then a blue square with “Decode” to the right of it and “D” inside it, then a pink square with “Fetch” to the right of it and “F” inside it. At the bottom of the screen are 4 squares with “1”, “2”, “3”, and “4” inside them respectively. This is a drag and drop exercise. The F square has to be dragged to the 1 square, the D square has to be dragged to the 2 square, the E square has to be dragged to the 3 square, and the S square has to be dragged to the 4 square to be correct. If the user gets them all correct, the word “CORRECT!!!” appears below the squares in red standard font.
Title: Overview QuestionsText: Place the stages below in their proper order in the pipeline stages below.
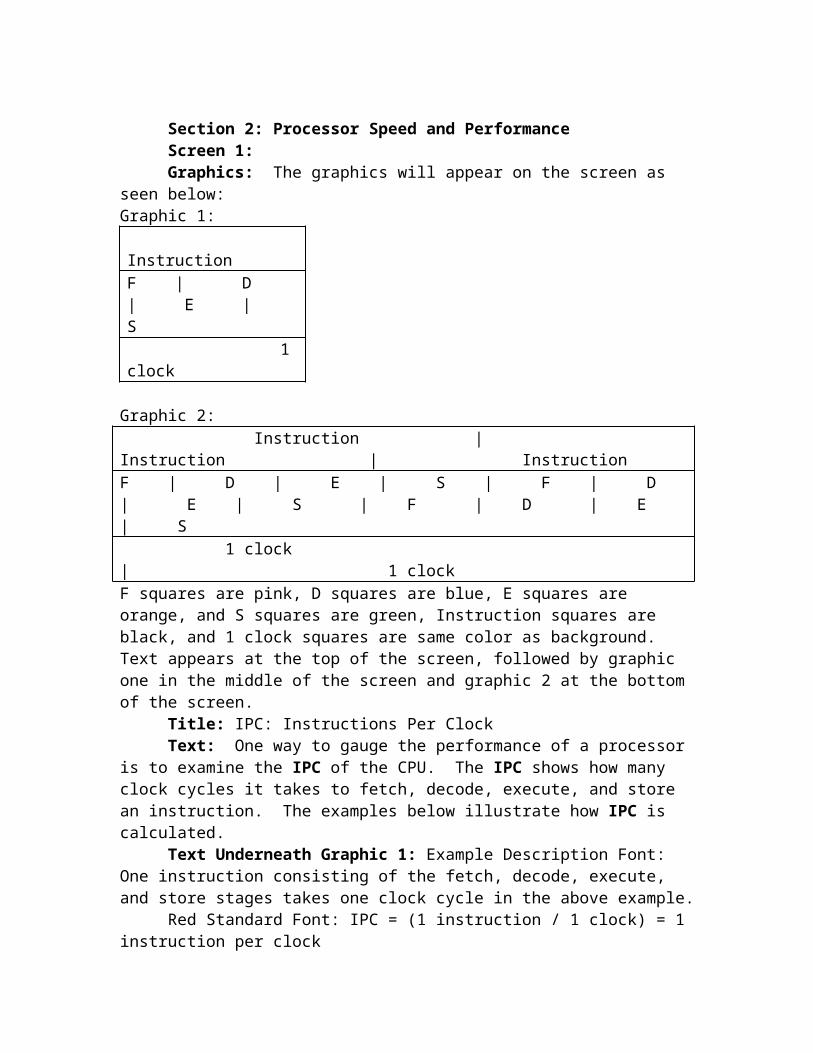
Section 2: Processor Speed and PerformanceScreen 1:Graphics: The graphics will appear on the screen as seen below:
Graphic 1: InstructionF | D | E | S 1 clock
Graphic 2: Instruction | Instruction | InstructionF | D | E | S | F | D | E | S | F | D | E | S 1 clock | 1 clockF squares are pink, D squares are blue, E squares are orange, and S squares are green, Instruction squares are black, and 1 clock squares are same color as background. Text appears at the top of the screen, followed by graphic one in the middle of the screen and graphic 2 at the bottom of the screen.
Title: IPC: Instructions Per Clock Text: One way to gauge the performance of a processor is to examine the IPC of
the CPU. The IPC shows how many clock cycles it takes to fetch, decode, execute, and store an instruction. The examples below illustrate how IPC is calculated.
Text Underneath Graphic 1: Example Description Font: One instruction consisting of the fetch, decode, execute, and store stages takes one clock cycle in the above example.
Red Standard Font: IPC = (1 instruction / 1 clock) = 1 instruction per clockText Underneath Graphic 2: Example Description Font: For this example, there
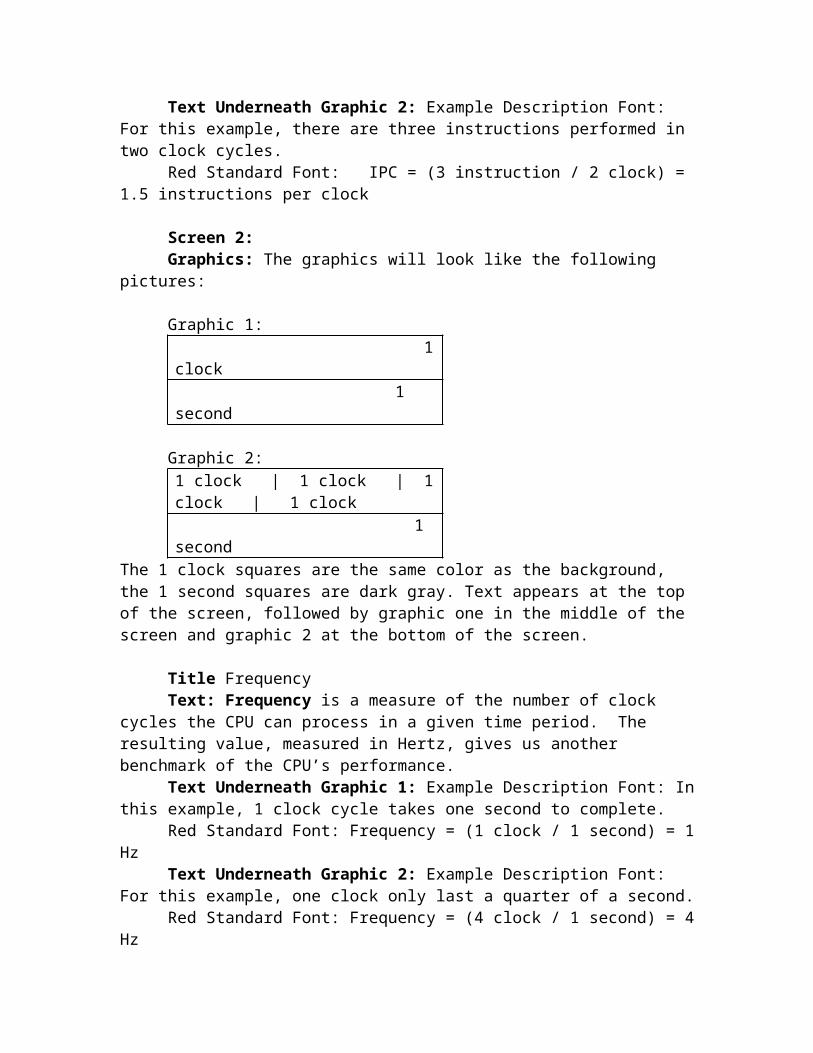
are three instructions performed in two clock cycles.Red Standard Font: IPC = (3 instruction / 2 clock) = 1.5 instructions per clock Screen 2:Graphics: The graphics will look like the following pictures:
Graphic 1:

1 clock 1 second
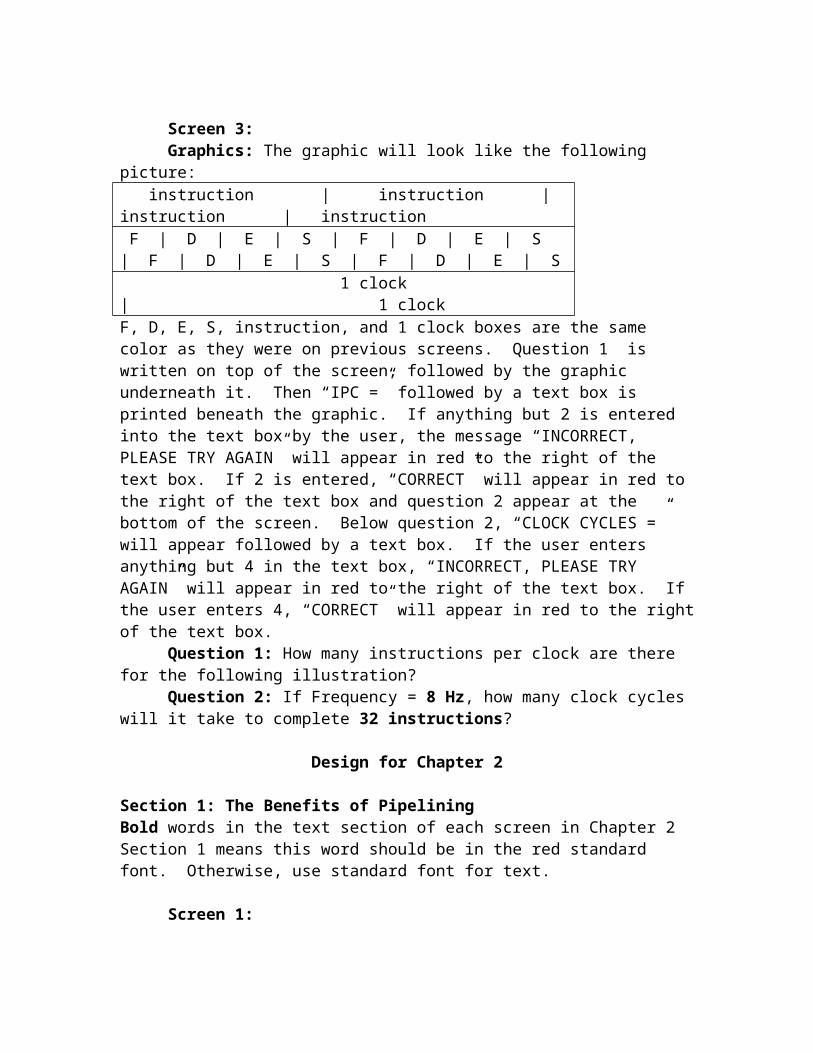
Graphic 2:1 clock | 1 clock | 1 clock | 1 clock 1 second
The 1 clock squares are the same color as the background, the 1 second squares are dark gray. Text appears at the top of the screen, followed by graphic one in the middle of the screen and graphic 2 at the bottom of the screen.
Title FrequencyText: Frequency is a measure of the number of clock cycles the CPU can process
in a given time period. The resulting value, measured in Hertz, gives us another benchmark of the CPU’s performance.
Text Underneath Graphic 1: Example Description Font: In this example, 1 clock cycle takes one second to complete.
Red Standard Font: Frequency = (1 clock / 1 second) = 1 HzText Underneath Graphic 2: Example Description Font: For this example, one
clock only last a quarter of a second.Red Standard Font: Frequency = (4 clock / 1 second) = 4 Hz
Screen 3:Graphics: The graphic will look like the following picture:
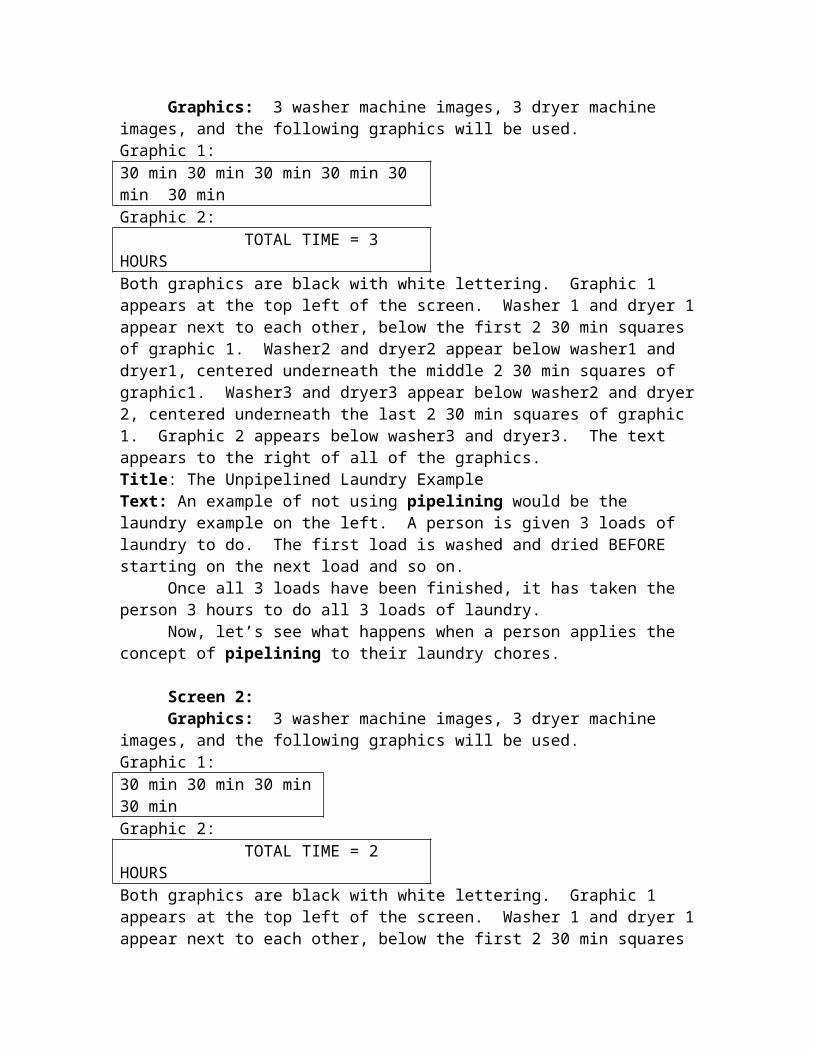
instruction | instruction | instruction | instruction F | D | E | S | F | D | E | S | F | D | E | S | F | D | E | S 1 clock | 1 clock F, D, E, S, instruction, and 1 clock boxes are the same color as they were on previous screens. Question 1 is written on top of the screen, followed by the graphic underneath it. Then “IPC =” followed by a text box is printed beneath the graphic. If anything but 2 is entered into the text box by the user, the message “INCORRECT, PLEASE TRY AGAIN” will appear in red to the right of the text box. If 2 is entered, “CORRECT” will appear in red to the right of the text box and question 2 appear at the bottom of the screen. Below question 2, “CLOCK CYCLES =” will appear followed by a text box. If the user enters anything but 4 in the text box, “INCORRECT, PLEASE TRY AGAIN” will appear in red to the right of the text box. If the user enters 4, “CORRECT” will appear in red to the right of the text box.
Question 1: How many instructions per clock are there for the following illustration?
Question 2: If Frequency = 8 Hz, how many clock cycles will it take to complete 32 instructions?
Design for Chapter 2
Section 1: The Benefits of PipeliningBold words in the text section of each screen in Chapter 2 Section 1 means this word should be in the red standard font. Otherwise, use standard font for text.

Screen 1:Graphics: 3 washer machine images, 3 dryer machine images, and the following
graphics will be used.Graphic 1:30 min 30 min 30 min 30 min 30 min 30 minGraphic 2: TOTAL TIME = 3 HOURSBoth graphics are black with white lettering. Graphic 1 appears at the top left of the screen. Washer 1 and dryer 1 appear next to each other, below the first 2 30 min squares of graphic 1. Washer2 and dryer2 appear below washer1 and dryer1, centered underneath the middle 2 30 min squares of graphic1. Washer3 and dryer3 appear below washer2 and dryer 2, centered underneath the last 2 30 min squares of graphic 1. Graphic 2 appears below washer3 and dryer3. The text appears to the right of all of the graphics. Title: The Unpipelined Laundry Example Text: An example of not using pipelining would be the laundry example on the left. A person is given 3 loads of laundry to do. The first load is washed and dried BEFORE starting on the next load and so on.
Once all 3 loads have been finished, it has taken the person 3 hours to do all 3 loads of laundry.
Now, let’s see what happens when a person applies the concept of pipelining to their laundry chores.
Screen 2:Graphics: 3 washer machine images, 3 dryer machine images, and the following
graphics will be used.Graphic 1:30 min 30 min 30 min 30 min Graphic 2: TOTAL TIME = 2 HOURSBoth graphics are black with white lettering. Graphic 1 appears at the top left of the screen. Washer 1 and dryer 1 appear next to each other, below the first 2 30 min squares of graphic 1. Washer2 appears directly underneath dryer1 and dryer2 is directly to the right of washer2. Washer 3 is directly underneath dryer2 and dryer3 is directly to the right of washer 3. Graphic 2 appears below washer3 and dryer3. The text appears to the right of all of the graphics.
Title: The Pipelined Laundry ExampleText: Now, let’s see what happens when a person is given 3 loads of laundry and
applies pipelining. Instead of waiting to start the next load AFTER the previous load is washed and
dried, the person begins to wash the second load with the first load drying. In this way, the washing machine and drying machine are in continuous use.
As a result, doing 3 loads of laundry now only takes 2 hours total when using pipelining. The time saved versus the unpipelined example is 1 hour.
Screen 3:

Graphics: An image of a car chassis, seats and engine, body of car, and a wrench.At the top of the screen, there will be the following text: 1. Chassis and Wheels 2. Interior and Engine 3. Body Shop
The wrench starts turning below 1. Above 1, the chassis and wheels of the car appears. Then the wrench and chassis moves to 2. Above 2, the seats and engine are put on top of the chassis. Then, the wrench and chassis move to 3. Above 3, the body of the car is put on the chassis. Then, the car disappears and the cycle starts over. The text is written below the graphics.
Audio: Sound of the machine used to take the screws off the wheel of a car in a car shop.
Title: The Unpipelined Assembly Line Text: Take the example of a car assembly line with one worker and three
different stations to assemble a given car. In order to assemble the car, the worker will have to move to each station to complete the next assembly step.
Because of this, the assembly line will only be able to handle one car at a time and production will be limited.
The comparison to pipelining is only performing one instruction at a time. That is doing only one fetch, decode, execute, and store by the processor at any given time.
Screen 4:Graphics: Same as screen 3 except there will be 1 wrench under each category
turning at the same time. The chassis and wheels will appear above 1, but when it moves to 2, a new chassis and wheels will appear above 1 and so on. This cycle continues the entire time the screen is viewed.
Audio: Same as in Screen 3.Title: The Pipelined Assembly Line
Text: Now we have a pipelined example of an assembly line with three workers each assigned to their own station. Now the assembly line has the ability to handle three separate cars and can produce many more cars than the previous assembly line with only one worker.
This example shows the benefits of a pipeline. Instead of only handling only one instruction at a time, the pipeline operates on multiple instructions at a time, just as the workers operate on multiple cars in the above illustration.
Section 2: Performance ComparisonBold words in the text section of each screen in Chapter 2 Section 2 means this word should be in the emphasis standard font. Otherwise, use standard font for text.
Screen 1:Graphics: The graphics are as follows:
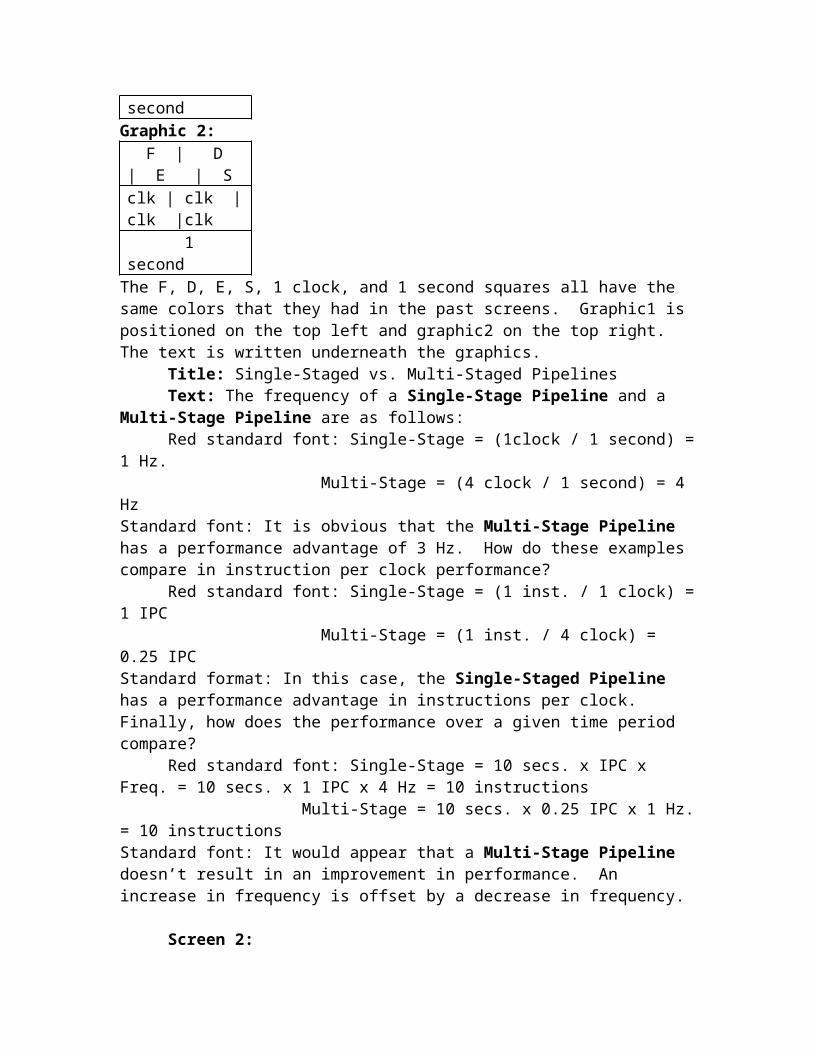
Graphic1: F | D | E | S 1 clock 1 second
Graphic 2:
F | D | E | S clk | clk | clk |clk 1 second
The F, D, E, S, 1 clock, and 1 second squares all have the same colors that they had in the past screens. Graphic1 is positioned on the top left and graphic2 on the top right. The text is written underneath the graphics.
Title: Single-Staged vs. Multi-Staged Pipelines Text: The frequency of a Single-Stage Pipeline and a Multi-Stage Pipeline are
as follows:Red standard font: Single-Stage = (1clock / 1 second) = 1 Hz.
Multi-Stage = (4 clock / 1 second) = 4 HzStandard font: It is obvious that the Multi-Stage Pipeline has a performance advantage of 3 Hz. How do these examples compare in instruction per clock performance?
Red standard font: Single-Stage = (1 inst. / 1 clock) = 1 IPC Multi-Stage = (1 inst. / 4 clock) = 0.25 IPC
Standard format: In this case, the Single-Staged Pipeline has a performance advantage in instructions per clock. Finally, how does the performance over a given time period compare?
Red standard font: Single-Stage = 10 secs. x IPC x Freq. = 10 secs. x 1 IPC x 4 Hz = 10 instructions
Multi-Stage = 10 secs. x 0.25 IPC x 1 Hz. = 10 instructionsStandard font: It would appear that a Multi-Stage Pipeline doesn’t result in an improvement in performance. An increase in frequency is offset by a decrease in frequency.
Screen 2:Graphics: The graphics are as follows:
Graphic1: instruction F | D | E | S Graphic 2:clk | clk | clk | clk 1 secondThere will be five graphic1’s stacked one on top of the other to the left of the screen. They will be stacked so that the F of the bottom graphic is underneath the D of the top graphic. Beneath the last graphic1, there will be 2 graphic2’s placed directly next to each other, side by side One will be lined up exactly underneath the last graphic 1, the other will be to the left. The text is written to the right of the graphics.
Title: Increased Instructions Per ClockText: In order to realize the advantage of the Multi-Stage Pipeline, it is
necessary to realize its full potential. In the example of the assembly line, the output of cars wasn’t at its peak until 3 workers were used to keep the line busy at all times.
As shown by the illustration on the left, the Multi-Stage Pipeline is utitlized most efficiently when processing multiple instruction tasks at once. At any one time, the fetch, decode, execute, and store stages of an instruction can be taking place.
Looking at the instructions over time (10 seconds) yields the following results:
Red standard font: 10 secs. x IPC x Freq. = 10 secs. x 5/8 IPC x 4 Hz = 25 instructions
Standard font: Now the performance benefit of a Multi-Stage Pipeline is realized. From the calculation on the previous page, we see that the Single-Stage Pipeline can only perform 10 instructions over the same time period.
Screen 3:Graphics: Four buttons placed horizontally across the middle of the screen
labeled 100, 120, 150, and 200 respectively. If 150 is pressed, “CORRECT 30 secs x 5/8 IPC x 8 Hz. = 150” appears in red below the buttons. If any other button is pressed, “Wrong Answer, Please Try Again” appears in red below the buttons and then disappears. All other text is printed above the buttons.
Title: Overview QuestionText: Calculate the number of instructions that can be calculated given the
following information:Example description font: Total Time = 30 seconds
IPC = 5/8 instructions per clock Frequency = 8 Hz
Design for Chapter 3
Bold words in the text section of each screen in Chapter 3 means this word should be in the emphasis standard font. Otherwise, use standard font for text.
Section 1: Stage Constraints and DependencyScreen 1: Graphics: Three of this graphic is needed:
F | D | E | S Colors of the squares are the same as before. The graphics are at the top of the screen. They are stacked one on top of the other, with the F of the bottom underneath the D of the top. A blue box highlights the top S with the middle E and a red box highlights the middle S with the bottom E. “store and execute don’t interfere with each other” is written in blue to the right of the blue box and “store and execute interfere” is written in red to right of the read box. To the left of the stacked graphics is the following assembly code written in red:MOV A, M1MOV B, M2ADD A, BAll text is written under the graphics. Assembly code is written in red, explanations of assembly code is written in blue.
Title: Store Limitation Text: In the example above, there are 3 assembly instructions that do the
following:MOV A, M1 – moves contents of memory address M1 to register AMOV B, M2 – moves contents of memory address M1 to register BADD A, B – adds register A & B values and stores the result in register A
With the MOV A and MOV B we do not encounter any problems with the store and execute stages because the execute stage of MOV B does not need any of the information being stored in MOV AIn the case of MOV B and ADD instructions, there is a problem because ADD is trying to add the B value which hasn’t been determined yet from the previous MOV B instruction.
Screen 2:Graphics: Same graphics as screen 1 except that there are 4 graphics stacked on
top of each other instead of three. The assembly text written to the left of the graphics is as follows:MOV A, M1MOV B, M2NOPADD A,BAll assembly commands in this screen are in red. The highlighted boxes are also different from screen 1. The S in the second graphic down is highlighted in a red box as well as the E in the bottom graphic. The text “store and execute no longer interfere with each other” will be written in red to the right of the graphics and an arrow points from the text to the 2 highlighted boxes.
Title: Solution to Store LimitationText: The solution to this problem is to insert a NOP instruction which means no
operation. This NOP actually doesn’t have any function except to provide the needed delay for the MOV B instruction to finish its store operation.
With the NOP there is no longer a store limitation problem because MOV B has now finished its store before ADD begins its execute stage.
Screen 3:Graphics: Three buttons positioned vertically at the middle left of the screen.
The top button is labeled A, the middle button B, and the bottom button C. If A or C are clicked, “Wrong Answer, Please Try Again” appears in red below the buttons. If B is chosen, “CORRECT NOP provides the necessary delay in a program to prevent problems with the store and execute stages” appears in red below the buttons.
Title: Overview QuestionQuestion: What is the purpose of a NOP instruction?Choice A: Re-reads contents of a memory addressChoice B: Alleviates store and execute conflictsChoice C: Doesn’t have any purpose
Section 2: Improving PerformanceScreen 1: Graphics: There will be three Pentium chip images used. The Pentium will be on
the top left of the screen, the Pentium 3 chip will directly below the Pentium, and the Pentium 4 chip will be below the Pentium 3. Text is to the right of the graphics. All Pentium chip names in the text use red standard font.
Title: Additional Stages
Text: We have already seen the performance benefits of a multi-stage pipeline over a single-stage pipeline.
To increase the performance of a processor further, the stages of a pipeline can be broken down in smaller stages besides the fetch, decode, execute, and store stages. For Example, the fetch stage can be broken down in a few separate stages.
In real world applications, Intel has gradually increased the number of stages in the pipeline of its various processors as a means to improve performance:
Pentium- 5 stagesPentium Pro, Pentium 2, Pentium 3- 10 stages Pentium 4- 20 stages
Screen 2:Graphics: The graphic will be a small Assembly program: Program 110: ADD A, B JMP 10 MOV a, M120: ENDThe program will be in the upper left of the screen and text will appear around the
program.Title: Jump LimitationsText: Besides the Store Limitation, there is another problem that can affect
pipelining. This problem revolves around the JMP instruction which causes a program to jump or branch to a different place.
The example or Program 1 helps illustrate the JMP problem. The instruction JMP tells the program to immediately go to the line labeled 10. But with pipelining, the next instruction of MOV is fetched into the pipeline. Actually we want the ADD instruction to be the next instruction to allow the JMP to reach its execution stage and then load the proper instruction.
While this doesn’t prove to be a large problem when there is only one instance of a JMP, what happens when a JMP instruction is used to create a program loop? The delay caused by placing a NOP after the JMP will now be multiplied by the total number of iterations of the loop causing an increased delay. Since programs regularly include loops, this can be a very large problem.
Screen 3:Graphics: The graphic will be another Assembly program:Program 2 A=0 B=010: ADD A, B if (B<100) JMP 10 else JMP 2020: END

The program will be in the upper left of the screen and text will appear around the program.
Title: Branch PredictionText: One way to limit this delay is to use branch prediction whenever a
processor encounters a loop such as the one on the right.This particular program involves a loop that excuses a total of 100 times.
Normally, the JMP 10 instruction would be followed by a NOP so the program could properly jump to label 10. This way, ADD would be the next instruction instead of the JMP 20.
Branch prediction would eliminate these NOP’s by using an algorithm to guess where the program should jump to. For example, in Program 2 once the program had entered the loop, the processor would automatically guess each time to jump back to label 10.
While branch prediction does rid a program of a lot of the delay that can accumulate with loops, it does create another problem…
Design for Chapter 4
Bold words in the text section of each screen in Chapter 4 means this word should be in the emphasis standard font. Otherwise, use standard font for text.
Section 1: Branch PredictionScreen 1:Graphics: Program 2 from Chapter 3 Section 2 Screen 3 will be pictured in the
upper left corner of the screen. Positioned in the top middle of the screen is the graphics from Chapter 3 Section 1 Screen 2, stacked in exactly the same manner. To the right of the graphics is the text : # of loops 99 100 - program should exit loop here 101 102 - program actually exits loop at this pointEach number has an arrow pointing to the graphic it represents. (ie. 99 points to the top graphic, 100 to the next one down, etc).
Title: Incorrect PredictionText: Because branch prediction is largely based upon guesses, there is a
possibility that the processor will make an incorrect assumption.The loop in Program 2 above is designated to exit after it has executed 100
iterations, but it won’t actually exit until the 102nd time. This happens because of the processor’s blind assumption to always loop. It isn’t until the 102nd instruction in the loop is loaded that the execute for the 100th instruction is actually calculated.
It’s at this point the processor realizes that its earlier assumption was incorrect and must find a way to correct the mistake.
Screen 2:

Graphics: Program 2 from Screen 1 is replaced by a toilet, but otherwise, the graphics are the same. To the right of the graphics, there will be the following:
# of loop99100 - exit loop101 - flush instruction102 - flush instruction
There are also arrows leading from number to graphic, exactly like in Screen 1. The graphic that 101 is pointing to will move behind the toilet and then the graphic that 102 is pointing to will do the same thing. To the right of both numbers, “flush instruction” will disappear and “new instruction” will appear in its place. Then, 2 new graphics will appear in the same place the ones currently behind the toilet used to be. Then, the graphics behind the toilet will disappear as “flush instruction” appears again to the right of 101 and 102. The cycle then begins again. All the main text of this screen is written below the graphics.
Audio: Sound of a toilet flushingTitle: Flushing the Pipeline Text: In order to fix the mistakes the processor has made, all of the incorrect
guesses must be thrown out. The instructions that represent those guesses must be removed from the pipeline in a process called flushing the pipeline.
In the case of the previous program, all of the wrong instructions loaded after the 100th loop of the program must be flushed from the pipeline so the correct instructions can be loaded into the pipeline next.
The necessity of flushing the pipeline of wrong guesses wastes valuable time. Processors with longer pipelines automatically have a greater penalty associated with them because of the increased number of instructions that have to be flushed with an incorrect guess. Improving the branch prediction algorithm becomes more important with new processors with longer pipelines.
Screen 3:Graphics: There will be a total of 9 buttons. Three buttons positioned
horizontally, labeled A, B, and C respectively will be at the top of the screen, just below question 1. In the middle of the screen, question 2 will appear with three buttons positioned horizontally appearing below it. The buttons will be labeled A, B, and C respectively. Then, question 3 will appear at the bottom of the screen with buttons A, B, and C, positioned vertically underneath it.
Title: No title Text:Question 1: What is one problem associated with pipelining?Choice A: Assembly DilemmaChoice B: Decode FaultChoice C: Store Limitation
If buttons A or B are chosen, then the message “Wrong Answer, Try Again” appears in red below button A. If button C is chosen, then the message “CORRECT” appears in red below button A.
Question 2: What is a second problem associated with pipelining?
Choice A: Incorrect Branch PredictionChoice B: Fetch ErrorChoice C: Instruction Loss
If buttons B or C are chosen, then the message “Wrong Answer, Try Again” appears in red below button A. If button A is chosen, then the message “CORRECT” appears in red below button A.
Question 3: When is it necessary to flush the pipeline?Choice A: There are too many instructions loaded into the pipeline at once for the
processor to handleChoice B: When one or more stages of a pipeline are skippedChoice C: Instructions are loaded in the pipeline that do not belong because of an
incorrect guessIf buttons A or B are chosen, then the message “Wrong Answer, Try Again” appears in red at the bottom of the screen. If button C is chosen, then the message “CORRECT” appears at the bottom of the screen
Design for the EndTitle: SummaryLayout: Text written in paragraph form across the entire page from top to bottom. Dark blue, bold, standard font is used.Text: Pipelining is important aspect of processors to increase their performance. When pipelining is not used a processor’s abilities are wasted just as an assembly line’s resources are wasted when there are not enough workers to staff the line.
While pipelining does have many benefits, there are a few complications that are present. The future of processors relies on the increased size of the pipelines used and the ability to come up with solutions to some the drawbacks of pipelining.
In standard font: This presentation was created by:Joshua HanningsAndrew PobudaJoe Rummel