global climate change and its distributional impacts maurizio bussolo, rafael de hoyos, denis...
TRANSCRIPT
Global Climate Change and its Distributional Impacts
Maurizio Bussolo, Rafael de Hoyos, Denis Medvedev and Dominique van der MensbruggheThe World Bank
“Future of the Global Economy”11th Annual Conference on Global Economic AnalysisHelsinki, 12-14 June, 2008

ENVISAGE: Model featuresENVISAGE: Model features• Standard dynamic global CGE.• Flexible aggregation (regions and sectors) and time frame.• 2001 GTAP-based base year including IEA-based energy
demand and trade (MTOE) and estimates of CO2 emissions by sector and fuel (shifting to 2004).
• Integrated climate module with links from emissions to radiative forcing to temperature change.
• Flexible energy demand system.• Flexible emissions control—carbon taxes, caps, cap and trade,
demand exemptions.
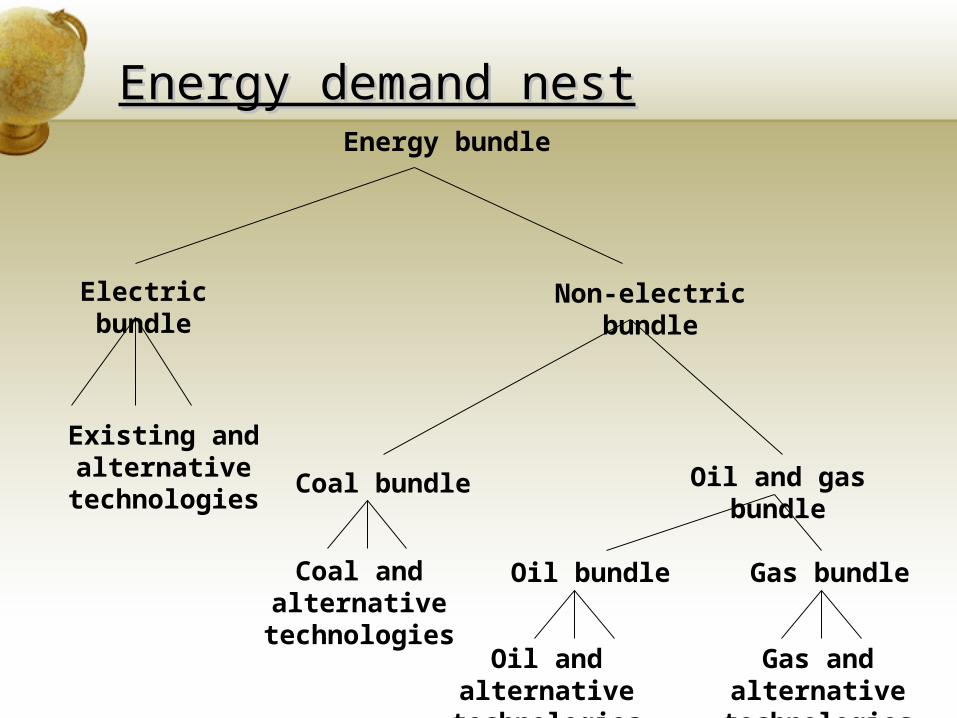
Energy demand nestEnergy demand nestEnergy bundle
Electric bundle
Existing and alternative technologies
Non-electric bundle
Coal bundle Oil and gas bundle
Coal and alternative technologies
Oil bundle Gas bundle
Oil and alternative technologies
Gas and alternative technologies

Three scenariosThree scenarios• Baseline, or business-as-usual, with climate change damages• Baseline without climate change damages.• Global mitigation scenario—targetting 500 ppm concentration
by 2050

Key baseline assumptionsKey baseline assumptions• UN population forecast—labor force growth equated to
growth of working age population (15-65).• Savings rate driven by growth and youth and elderly
dependency rates.• Trend productivity in agriculture is exogenous (2.5% per
annum), with temperature-based damage function.• Productivity in manufacturing is higher than in services (2%).• Productivity is calibrated through 2015 and then fixed.• Autonomous energy efficiency improvement (AEEI) increases
by 1% per annum (in all regions and sectors).• Capital account is exogenous.

Source: Simulations with World Bank’s ENVISAGE model.
0
1
2
3
4
5
6
7
8
2005 2010 2015 2020 2025 2030 2035 2040 2045 2050
Pe
rce
nt
pe
r a
nn
um
0
20
40
60
80
100
120
140
160
$2
00
1 trillio
n
Developing, right-axis
Developing growth rate, left-axis
High-income growth rate, left-axis
Baseline GDP
Developed, right-axis
0.0
0.5
1.0
1.5
2.0
2.5
3.0
3.5
4.0
2005 2010 2015 2020 2025 2030 2035 2040 2045 2050
Pe
rce
nt
pe
r a
nn
um
0
5
10
15
20
25
30
35
40
GtC
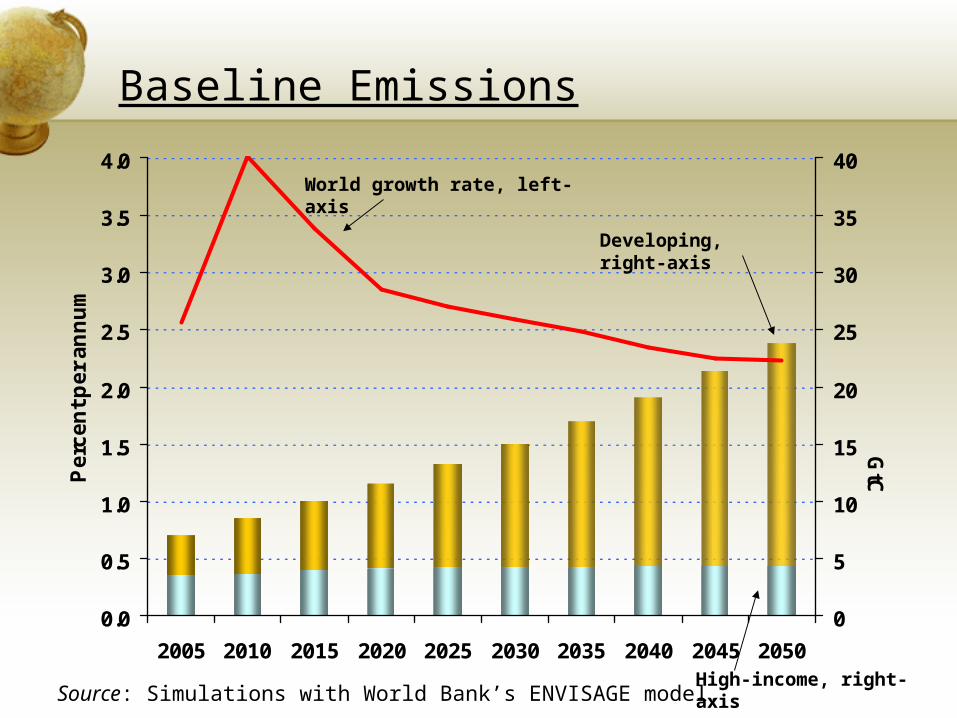
Source: Simulations with World Bank’s ENVISAGE model.
Developing, right-axis
High-income, right-axis
World growth rate, left-axis
Baseline Emissions

Concentration, forcing and temperature
0
100
200
300
400
500
600
2001 2010 2020 2030 2040 2050
Conc
rent
ation
ppm
0
1
2
3
4
5
6
Radiative forcing (W
/m2) and tem
perature (°C)
Concentration Forcing
Temperature
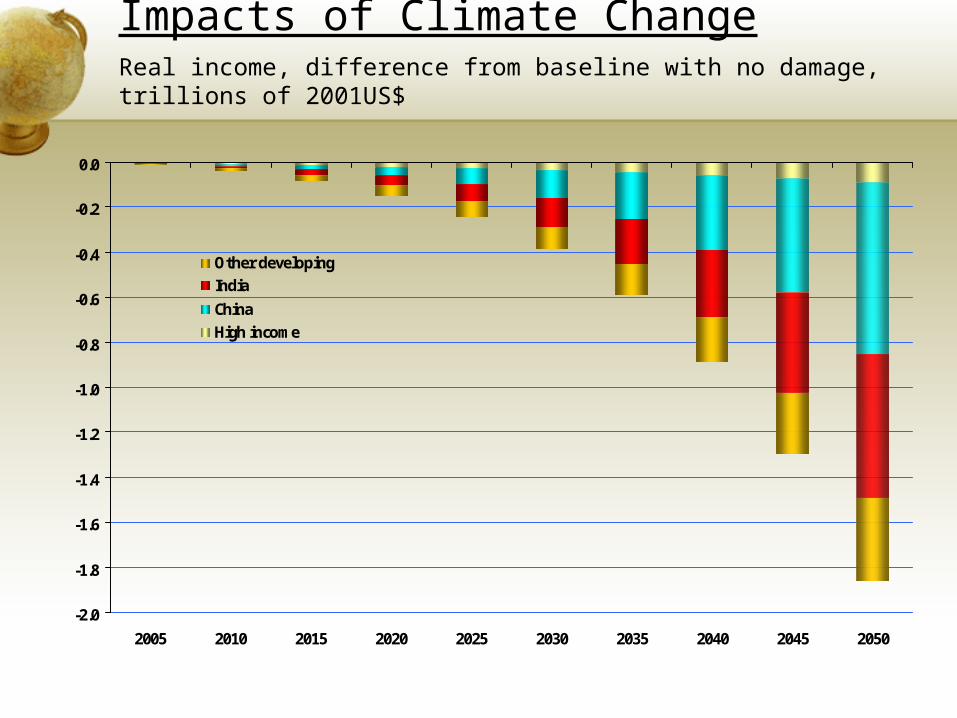
Impacts of Climate ChangeReal income, difference from baseline with no damage, trillions of 2001US$
-2.0
-1.8
-1.6
-1.4
-1.2
-1.0
-0.8
-0.6
-0.4
-0.2
0.0
2005 2010 2015 2020 2025 2030 2035 2040 2045 2050
Other developingIndiaChinaHigh income

Impacts of Climate ChangeReal income, perce nt difference from baseline with no damage in 2050
-7 -6 -5 -4 -3 -2 -1 0 1 2
Canada
Rest of MENA
United States
Japan
Rest of high income
EU 27 and EFTA
Indonesia and Malaysia
Brazil
Russia
Rest of LAC
Rest of Europe and Central Asia
MENA Energy exporters
Rest of South Asia
Rest of developing East Asia
Sub Saharan Africa
Other LAC energy exporters
China
India
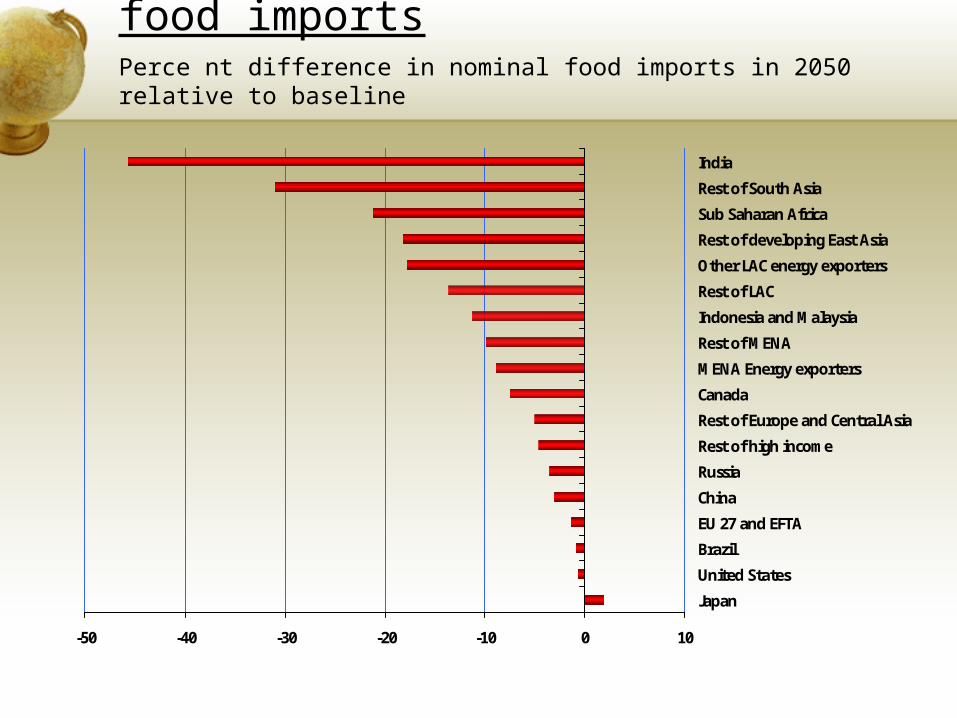
Climate change damages and food importsPerce nt difference in nominal food imports in 2050 relative to baseline
-50 -40 -30 -20 -10 0 10
Japan
United States
Brazil
EU 27 and EFTA
China
Russia
Rest of high income
Rest of Europe and Central Asia
Canada
MENA Energy exporters
Rest of MENA
Indonesia and Malaysia
Rest of LAC
Other LAC energy exporters
Rest of developing East Asia
Sub Saharan Africa
Rest of South Asia
India

Percent reduction in emissionsPerce nt reduction in CO2 emissions relative to baseline in 2050
-90 -80 -70 -60 -50 -40 -30 -20 -10 0
Brazil
Japan
Other LAC energy exportersRest of MENA
EU 27 and EFTASub Saharan Africa
Rest of South Asia
Indonesia and MalaysiaMENA Energy exporters
Canada
Rest of high incomeRussia
United States
Rest of developing East AsiaRest of LAC
Rest of Europe and Central AsiaWorld total
India
China
$93 per ton of carbon in 2050

Real income losses/gains from mitigationPerce nt change in real income relative to baseline in 2050
-8 -6 -4 -2 0 2 4
Canada
Rest of MENA
United States
Japan
Rest of high income
EU 27 and EFTA
Indonesia and Malaysia
Brazil
Russia
Rest of LAC
Rest of Europe and Central Asia
MENA Energy exporters
Rest of South Asia
Rest of developing East Asia
Sub Saharan Africa
Other LAC energy exporters
China
India
Climate change damages
Mitigation

Global income distribution
0.0
0.1
0.1
0.2
0.2
0.3
0.3
0.4
0.4
0.5
0 2 4 6 8 10
Den
sity
of l
og(h
ouse
hold
per
cap
ita
inco
me
or
cons
umpti
on, 1
993
PPP)
Observed (2000)BaU (2050)BaUnd (2050)
Note: BaU = baseline, BaUnd = baseline with no damages.Source: Simulations with World Bank’s GIDD model.

Percent of total number of poor
0
20
40
60
80
100
2000 BaU, 2050 BaUnd, 2050 GBL, 2050
Poor in agriculture
Poor in non-agriculture
Note: BaU = baseline, BaUnd = baseline with no damages, GBL = global mitigation scenario.Source: Simulations with World Bank’s GIDD model.
Climate change impacts on poverty

Percentage change in real income or consumption
-5
0
5
10
15
20
0 20 40 60 80 100
No damages from climate changeGlobal mitigation via uniform tax
Source: Simulations with World Bank’s GIDD model.
Growth incidence of climate damages and mitigation

Composition of 10 percent of global population most affected by climate change
Non-agricultural households in EasternEurope and Central Asia
Agricultural households in LatinAmerica and the Caribbean
Non-agricultural households in LatinAmerica and the Caribbean
Agricultural households in South Asia
Non-agricultural households in SouthAsia
Source: Simulations with World Bank’s GIDD model.
Incidence of damages from climate change

Take away messagesTake away messages• Standard SRES ‘worse case’ baseline scenarios are too
optimistic• Staying at 550 ppm will require a major effort• Negative effects from climate change on agricultural output
will be significant with income, trade and poverty impacts• No major cost from ‘modest’ mitigation efforts• Poor are hardest hit from climate change
• Caveats -- many