global expression analysis: mrna
DESCRIPTION
Global Expression Analysis: mRNA. Anders Thelin Molecular Biology Astr aZeneca R&D Mölndal. A cell is defined by its protein content/activities. Her edity and environment affect protein content (gene expression). cell-cell interactio n. hormones. disease. nutrition. - PowerPoint PPT PresentationTRANSCRIPT

Department: Molecular BiologyAuthor: A. Thelin
Global Expression Analysis: mRNA
Anders ThelinMolecular BiologyAstraZeneca R&D Mölndal

Department: Molecular BiologyAuthor: A. Thelin
•A cell is defined by its protein content/activities
•Heredity and environment affect protein content(gene expression)
hormonescell-cell interaction
nutrition disease

Department: Molecular BiologyAuthor: A. Thelin
Traditional Drug Discovery Process
Medical need
Idea
Model
Lead
CD Toxicology
Human testingPharmacokinetics
Chemicals

Department: Molecular BiologyAuthor: A. Thelin
Drug
Effect
No effect
Hit
ModelExperimental animal
TissueCells
Cell preparation
Black Box Approach
Unknowntarget protein

Department: Molecular BiologyAuthor: A. Thelin
This approach has, historically, been very successful but,the success of the “black box” approach is dependent ona relevant model. Potential problems……...
- hard to find relevant disease model- selected animal model may appear to have the same
disease process as humans but does in fact not.- identified lead substances have only effect in animal model
may be caused by model protein target isdifferent compared to human
- effects of lead substance is unspecific, giving problemstoxicology

Department: Molecular BiologyAuthor: A. Thelin
Molecular Approach
Drug
Effect
No effect
Hit
Known drugtarget

Department: Molecular BiologyAuthor: A. Thelin
A molecular understanding of the disease mechanismwould allow…..- selection of optimal target (protein)- design of drugs for specific effect- development of HTS models- development of transgenic model animals

Department: Molecular BiologyAuthor: A. Thelin
How do we find molecular targets?

Department: Molecular BiologyAuthor: A. Thelin
PR
OT
EI
N
DNA mRNA
pro-tein
pro-tein
pro-tein
pro-tein
pro-tein
pro-tein
The proteins in a celldetermine all processes in the cell

Department: Molecular BiologyAuthor: A. Thelin
Disease and disease treatment affect proteins
DiseaseP
RO
TE
IN
DNA mRNA
pro-tein
pro-tein
pro-tein
pro-tein
pro-tein
pro-tein

Department: Molecular BiologyAuthor: A. Thelin
How can gene expression be analyzed?
•Functional assay•Proteomics•Genetic profilingmRNA levels
Department: Molecular BiologyAuthor: A. Thelin
Global measurement of protein activity
Can’t be doneBut….

Department: Molecular BiologyAuthor: A. Thelin
Protein amountor
mRNA amountcan!
Correlation between amount and activity?
Correlation between change in amount and activity?

Department: Molecular BiologyAuthor: A. Thelin
Understanding gene expressionis important for understanding howcells function at the molecular level
Diseases and disease treatmentaffect gene expression
Assumptions
Department: Molecular BiologyAuthor: A. Thelin
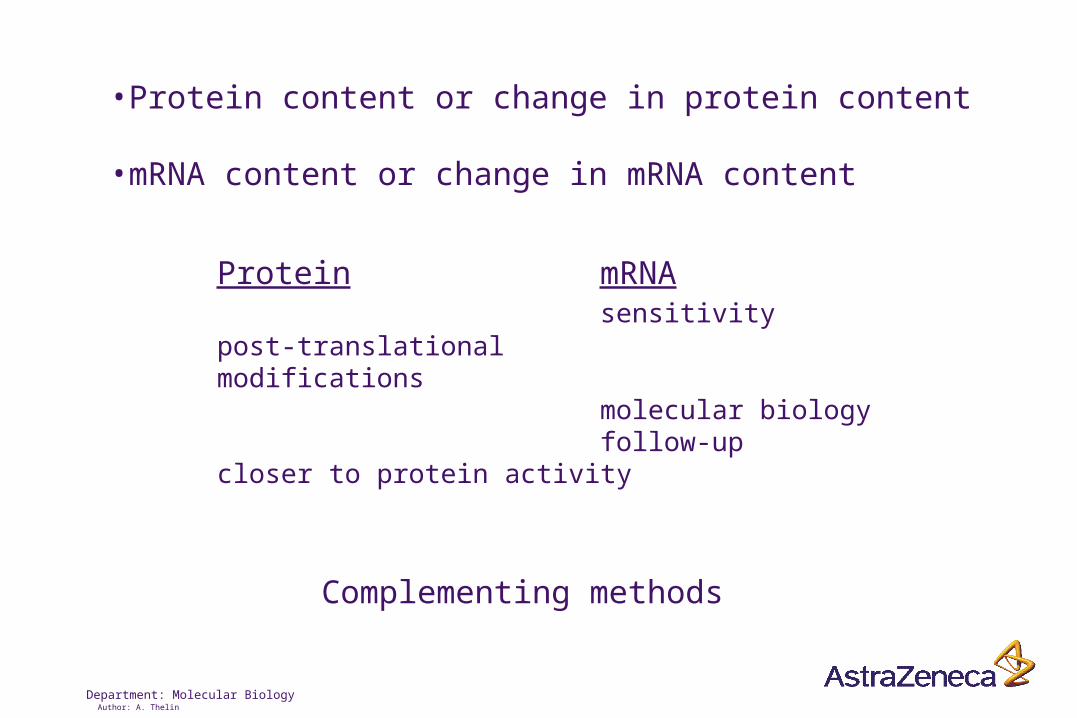
•Protein content or change in protein content
•mRNA content or change in mRNA content
Protein mRNAsensitivity
post-translationalmodifications
molecular biologyfollow-up
closer to protein activity
Complementing methods

Department: Molecular BiologyAuthor: A. Thelin
Smallest genome of free living organism codes for <500 genes(Mycoplasma genitalium)
Mammalian genomes codes for 40.000 genes
Saccharomyces cerevisiae genome codes for 6500 genes

Department: Molecular BiologyAuthor: A. Thelin
How many genes are expressed in a mammalian cell?
10.000-20.000
A liver cell contains 106 mRNA molecules
About 100 species are abundant with 5.000-50.000 copies/cellSeveral hundred species have 100-1.000 copies/cellSeveral thousand species have 0.1-1 copies/cell

Department: Molecular BiologyAuthor: A. Thelin
What affects gene expression?
Development/differentiationHormones/growth factorsCell-to-cell contact
Environmentnutritionheat shocktoxic substancespathogensinjuries/inflammation

Department: Molecular BiologyAuthor: A. Thelin
Different cells express different genes
Expression of genes are regulated
Regulation can occur at several levels1. Transcription2. mRNA stability3. Translation4. Protein stability

Department: Molecular BiologyAuthor: A. Thelin
•Single gene expression-Northern blot-Ribonuclease protection assay (RPA)-Reverse transcriptase polymerase chain reaction (RT-PCR)
•Global (multiple) gene expression-Differential display-Representational difference analysis (RDA)-Serial analysis of gene expression (SAGE)-DNA microchip arrays

Department: Molecular BiologyAuthor: A. Thelin
Northern blotRNA
Agarose gel
Nylon membrane
Hybridization
Autoradiography
Probe (radiolabeled antisense cDNA or RNA)

Department: Molecular BiologyAuthor: A. Thelin
Ribonuclease protection assay
RNA sample Add radiolabeled RNA probe Add RNase A and T1
Separate fragments on gelautoradiography

Department: Molecular BiologyAuthor: A. Thelin
Reverse transcriptase polymerase chain reaction
RNA sample cDNAReverse transcription
Reverse transcriptase, primer
cDNA PCR productPCR amplification
Taq polymerase, specific primer
Agarose gel

Department: Molecular BiologyAuthor: A. Thelin
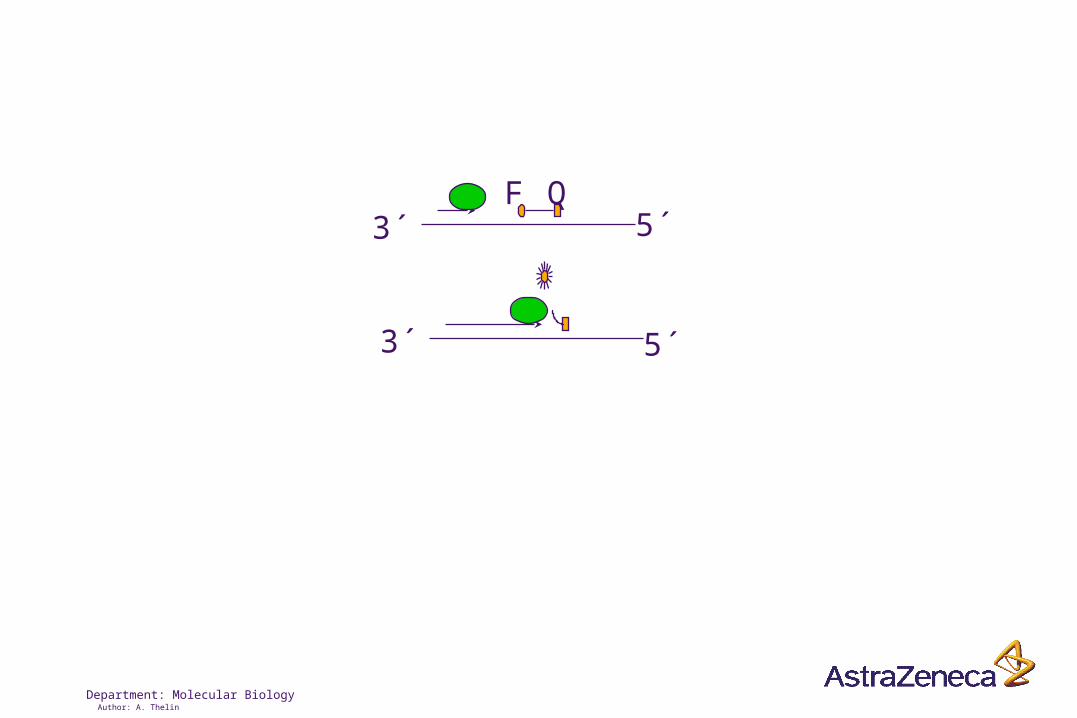
Real-time reverse transcriptase PCR-Very sensitive-Robust-”Fast”
0
2 0
4 0
6 0
8 0
1 0 0
1 2 0
1 5 9 13 17 21 25 29 33 37 41 45 49 53
C t
0
2 0
4 0
6 0
8 0
1 0 0
1 2 0
1 5 9 13 17 21 25 29 33 37 41 45 49 53
C t
Department: Molecular BiologyAuthor: A. Thelin
5´3´
5´3´
F Q

Department: Molecular BiologyAuthor: A. Thelin
Differential Display
Total RNA(>2 µg)
cDNAAnchored primers
PCRRandom primers
1a 1b 2a 2b 3a 3b 4a 4b
(A) (B)
1a 2a 3a 4a 1b 2b 3b 4b

Department: Molecular BiologyAuthor: A. Thelin
Representational Difference Analysis (RDA)in collaboration with RIT
totalRNA>50ng
cDNA
1 2
Linker
PCR
Amplifies cDNA whichare specific for tissue 1
cDNA(1)PCR

Department: Molecular BiologyAuthor: A. Thelin
Tissue 2Tissue 1mRNA
cDNA
mRNA
cDNA
mix, melt, anneal
Fill in the ends
PCR amplify
cDNA specific for tissue 1 enriched
Restriction digestAdd linker
In excess
exponential linear
Restriction digest
Representational Difference Analysis

DepartmentAuthor
Serial Analysis of Gene Expression
AAAAAAAATTTTTTTTT
AAAAAAAATTTTTTTTT
AAAAAAAATTTTTTTTT
AAAAAAAATTTTTTTTT
AAAAAAAATTTTTTTTT
AAAAAAAATTTTTTTTT
A GGATGCATGCCTACGTAC
A GGATGCATGCCTACGTAC
A GGATGCATGCCTACGTAC
AAAAAAAATTTTTTTTT
AAAAAAAATTTTTTTTT
AAAAAAAATTTTTTTTT
B GGATGCATGCCTACGTAC
B GGATGCATGCCTACGTAC
B GGATGCATGCCTACGTAC
A GGATGCATGCCTACGTAC
XXXXXXXXXXXXXXXXXX BGGATGCATG
CCTACGTACOOOOOOOOOOOOOOOOOO
CATGGTAC
XXXXXXXXXXXXXXXXXX
CATGGTAC
OOOOOOOOOOOOOOOOOO
XXXXXXXXXXXXXXXXXX
OOOOOOOOOOOOOOOOOO
XXXXXXXXXXXXXXXXXX
CATGGTAC
OOOOOOOOOOOOOOOOOO
AAAAAAAATTTTTTTTT
AAAAAAAATTTTTTTTT
AAAAAAAATTTTTTTTT
GATC
GATC
GATC
Biotinylated anchored primerscDNA synthesis
Imobilisation streptavidin beadsrestriction enzyme digestion
Divide in two poolsadd linker A and BCut with tagging enzymeLigate blunt ends
Ditag
Cut with CATGrestriction enzymeLigate to multi ditag
Department: Molecular BiologyAuthor: A. Thelin
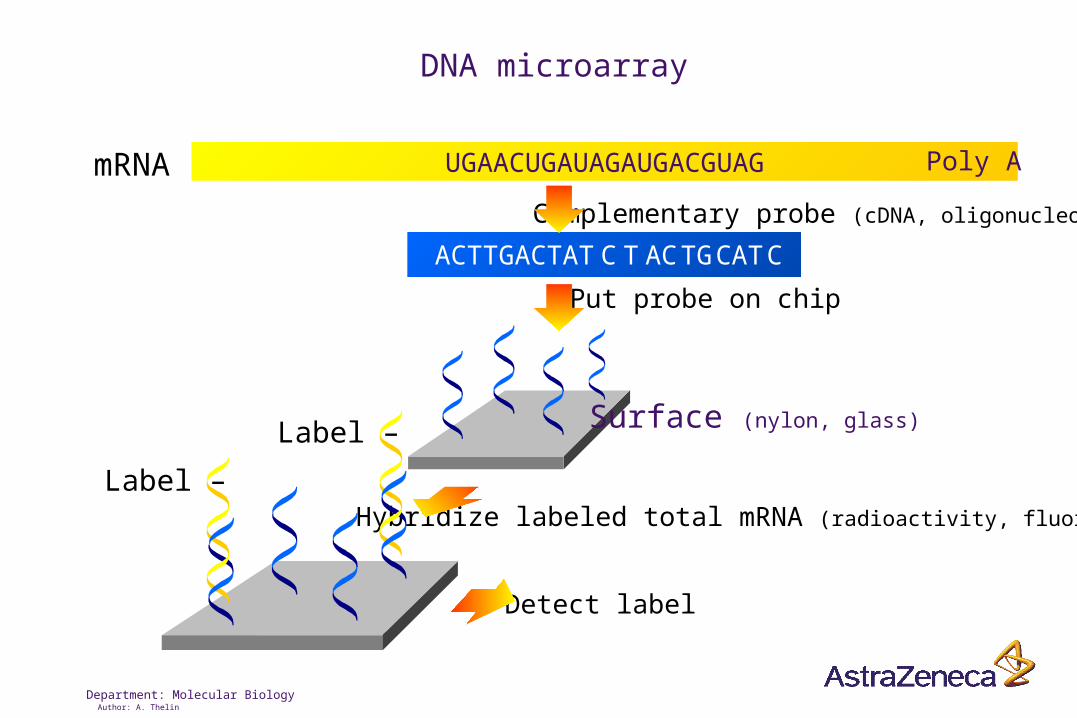
UGAACUGAUAGAUGACGUAGmRNA
Complementary probe (cDNA, oligonucleotide)
ACTTGACTAT C T AC TG CAT C
Poly A
Put probe on chip
Hybridize labeled total mRNA (radioactivity, fluoresence)
Detect label
Label –
Label –
Surface (nylon, glass)
DNA microarray
Department: Molecular BiologyAuthor: A. Thelin
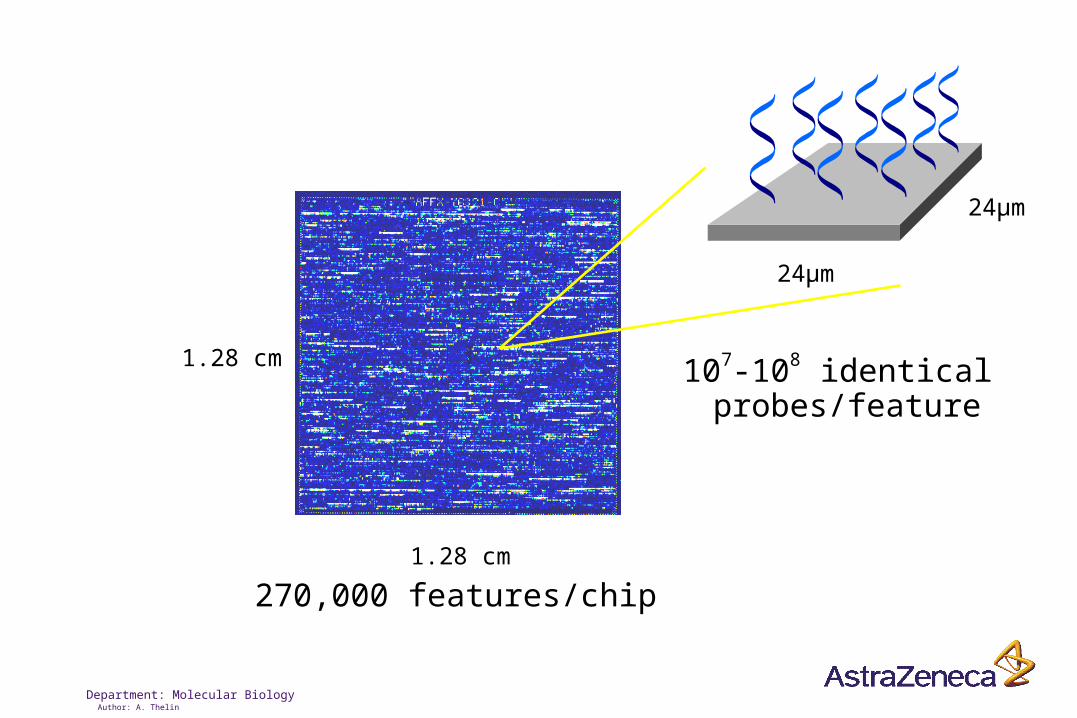
1.28 cm
1.28 cm
24µm
24µm
107-108 identical probes/feature
270,000 features/chip

Department: Molecular BiologyAuthor: A. Thelin
O O O O O
Light(deprotection)
HO HO O O O T T O O O
T T C C O
Light(deprotection)
T T O O O
C A T A TA G C T G
T T C C G
MaskMask
SubstrateSubstrate
MaskMask
SubstrateSubstrate
T –T –
C –C –REPEATREPEAT
Photolithography (Affymetrix)

Department: Molecular BiologyAuthor: A. Thelin
Affymetrix DNA chip
PMMM
5’ 3’
PM -25 bases with perfectmatch to probe sequenceMM -25 bases with one basemismatch to probe sequence
mRNA
10-20 pairs

Department: Molecular BiologyAuthor: A. Thelin
Commercial Affymetrix Arrays
Human 30.000 genesMouse 30.000 genesRat 21.000 genesYeast 6.100 genes
Custom made arrays
Department: Molecular BiologyAuthor: A. Thelin
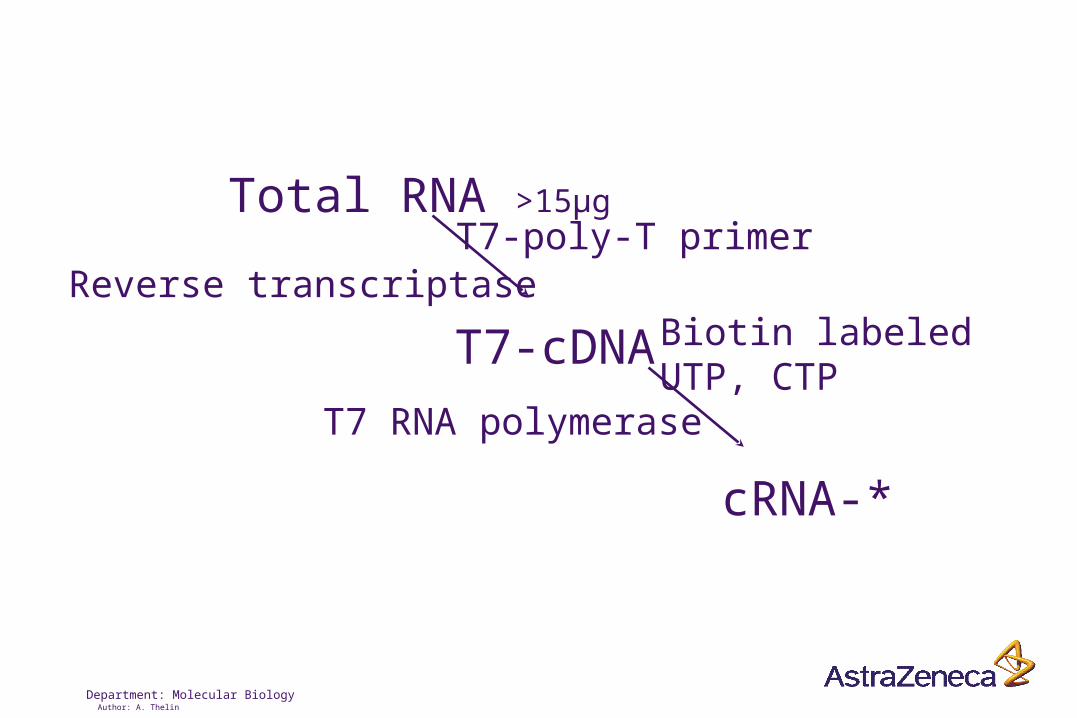
Total RNA >15µg
T7-cDNA
cRNA-*
T7-poly-T primerReverse transcriptase
T7 RNA polymerase
Biotin labeledUTP, CTP

Department: Molecular BiologyAuthor: A. Thelin
Hybridize cRNA-* on chip
Wash away unbound cRNA
Add streptavidin conjugated phycoerythrin
Wash again
Detect fluoresence using aconfocal microscope

Department: Molecular BiologyAuthor: A. Thelin
Probe Arrays Probe Arrays
(chips)(chips)
Fluidics StationFluidics StationScannerScanner
SoftwareSoftware
Department: Molecular BiologyAuthor: A. Thelin
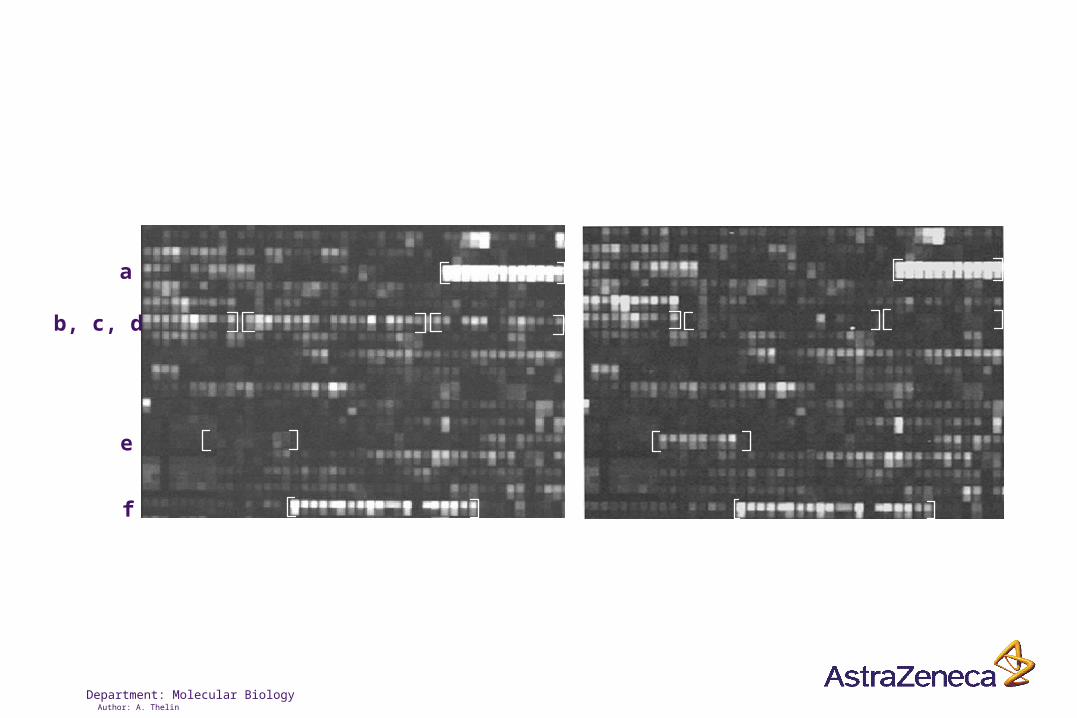
a
b, c, d
e
f

Department: Molecular BiologyAuthor: A. Thelin
•Generate huge amounts of complex data-Data storage
•Expression of many genes will be changed-Individual variation-Experimental variation-Direct, indirect effect
•Reduce complexity-Experimental design-Mathematical/Statistical analysis-Bioinformatic analysis

Department: Molecular BiologyAuthor: A. Thelin
Experimental design
•Individual variation
•Experimental variation
•Paired samples vs. Multiple samples

Department: Molecular BiologyAuthor: A. Thelin
DNA micro array data can be usedin two types of analysis
•Find specific genes•Find gene or samples with similar gene expression patterns
Department: Molecular BiologyAuthor: A. Thelin
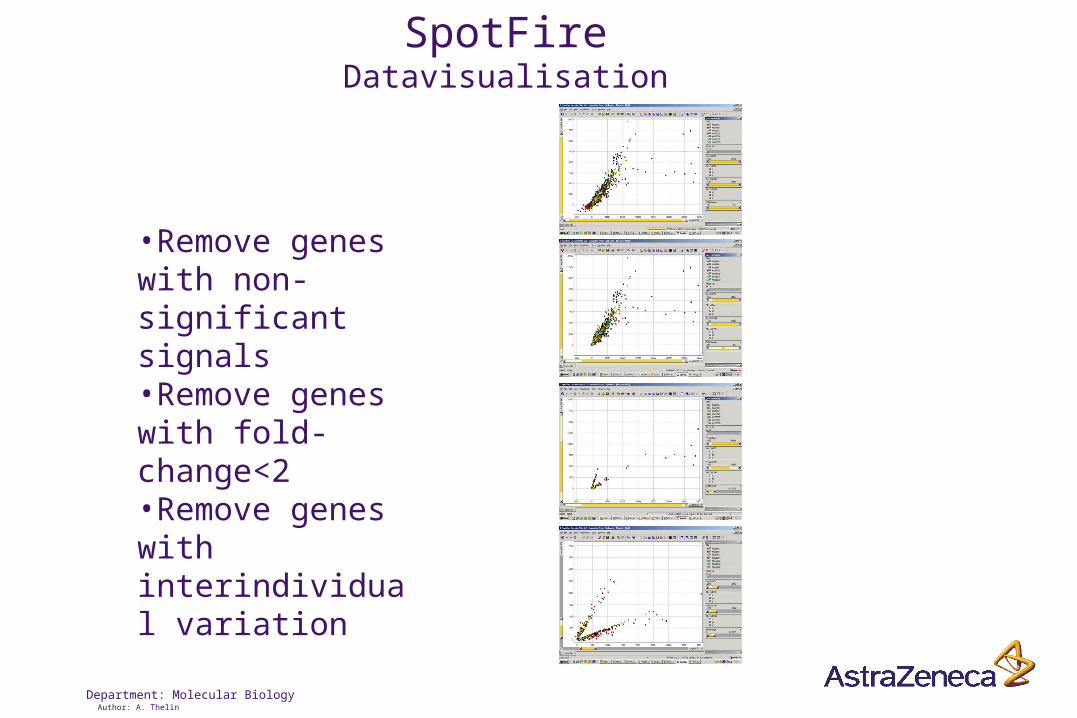
SpotFireDatavisualisation
•Remove genes with non-significant signals•Remove genes with fold-change<2•Remove genes with interindividual variation

Department: Molecular BiologyAuthor: A. Thelin
Mathematical/Statistical analysis
Expression level
Time
18 genes

Department: Molecular BiologyAuthor: A. Thelin
Expression level
Time
Clustering

Department: Molecular BiologyAuthor: A. Thelin
•Find groups of genes with similar expression patternsor
•Find groups of samples with similar gene expression patterns
Cluster analysis
Soukas et al. In Genes & Development, 14:963-980, (2000)
Sorli et al. PNAS 98: 10869-10874 (2001)
Genes with similarexpression patternsafter leptin treatment.One cluster containedseveral genes regu-lated by SREBP-1.Suggest that leptinpartly may act via SREBP-1.
Subgrouping of different types of breast cancer
Samples with no histological difference couldbe grouped into subgroups using expression patterns.These subgroups had different clinical prognosis.

Department: Molecular BiologyAuthor: A. Thelin
Model validation using cluster analysis
Fig. 1Study 24665
0102030405060708090
100
1 15 22 29 39 46 53 60 67
Days
% w
eig
ht
incr
ease
Control
Low gainers
High gainers
Normal gainers
Restricted diet
Obesity model: high-low gainer.Eating behavour is controlled byhypothalamus. Is differences ineating behavour reflected bydifferences in hypothalamicgene expression?
HighG
3
HighG
2
HighG
5H
ighG4
HighG
1
LowG
2Low
G5
LowG
3Low
G4
LowG
1
Geneexpression in hypothalamus reflect eating behaviour.One sample/animal is an outlier.
Analyze gene expression inhypothalamus from five HighGand five LowG.Cluster individuals withsimilar gene expressionpatterns using hierchicalclustering

Department: Molecular BiologyAuthor: A. Thelin
Bioinformatics
An array experiment produce lists of geneswhich you are mostly unfamiliar with
Biology information databasesLitteratureExperts
Department: Molecular BiologyAuthor: A. Thelin

Department: Molecular BiologyAuthor: A. Thelin
Gene Profiling Follow-up Experiments
•Expression profiling findings needs to be verified-New tissues-Tissue distribution-New similar conditions-Better resolution
•Establish relation-Cause-effect-Temporal-spatial

Department: Molecular BiologyAuthor: A. Thelin
Future and current development
Smaller samples
•Microdissection
•Sample amplification

Department: Molecular BiologyAuthor: A. Thelin
Insulin Resistance Syndrome
•Metabolic disease•Initially increasing levels of insulin and glucose•Later collapse of insulin production with elevated glucose
•Multifactoral disease•Obesity important factor
•Untreated IRS leads to an increased risk for cardiovascular disease•IRS is increasing in the western world

Department: Molecular BiologyAuthor: A. Thelin
Insulin
Glucose
Triglycerides

Department: Molecular BiologyAuthor: A. Thelin
PPAR
ADIPOCYTE-FABP
KERATINOCYTE LBP
PEPCK
PPAR-RE
THIAZOLIDINEDIONE(TZD)
INSULIN
GLUCOSE
TRIGLYCERIDES

Department: Molecular BiologyAuthor: A. Thelin
ob/ob Mice were treated with TZD for one weekTissues were isolated:muscles, fats and liver

Department: Molecular BiologyAuthor: A. Thelin
•12 INDIVIDUAL LIVERS•78000 DATAPOINTS•6400 GENES•TRANSFER DATA TO EXCEL•CALCULATE AVERAGE•COMPARE CHANGE IN AVERAGE
OVER TIME•REMOVE GENES WHICH SHOW
LESS THAN 5-FOLD CHANGE OVER TIME
APPROXIMATELY 1000 GENES SHOWEDGREATER THAN 5-FOLD CHANGE

Department: Molecular BiologyAuthor: A. Thelin
SUBSTANTIAL INDIVIDUALVARIATION, EVEN IN INBREAD MICE
0
200
400
600
800
1000
1200
0 2 4 6 8
0
200
400
600
800
0 2 4 6 8
050
100150200
250300350
0 2 4 6 8

Department: Molecular BiologyAuthor: A. Thelin
SORT OUT GENES WHEREINDIVIDUAL VARIATION ISSUBSTANTIAL
0 2 4 6 80 2 4 6 8
REMOVE ALL GENES WHERE LESSTHAN TWO TIME POINTS CONTAINSIGNIFICANT DATA
326 GENES WERE >5-FOLD REGULATEDAND HAD AT LEAST TWO TIME-POINTSWITH SIGNIFICANT DATA

Department: Molecular BiologyAuthor: A. Thelin
SORT GENES FOR DIFFERENTTIMEPATTERNS
11 22
64 73
67 89

Department: Molecular BiologyAuthor: A. Thelin
Expected
Adipsin
A-FABP
E-FABP
PPAR-
Unexpected

Department: Molecular BiologyAuthor: A. Thelin
Summary
•DNA arrays generate large amounts of data•Experimental design important•Confirmation•Bioinformatics•Follow-up experiments