global flows of fruit and vegetables in the third...
TRANSCRIPT
�����������������������
Globalization would put feeble Japanese agriculture in the crisis of collapse in the near
future, but has made hefty profits in the world. These profits, however, are not fairly shared
among countries or social stratum ; globalization has established the structure that dichoto-
mized the world into the starved South and the epicurean North. From this viewpoint, food
regimes theory attracts a lot of attention to geographers and sociologists in Europe and North
America.
Food regimes theory advanced by Friedmann & McMichael ( ) has revealed capital
accumulation from the historical perspective and global hegemonism in the agro-food sector.
The first food regime, in which wheat and frozen meat were exported from South America
and Australia to industrialized urban areas in Europe under the British hegemony, emerged
from to World War I. The global agricultural trade was altered from the complementary
system where scarce commodities were exchanged to the modern system based on compara-
tive advantage. Consequently, farmers in Western countries were forced to compete with
their counterparts in other countries and started the industrialization of agriculture.
After World War II, American industrialized agriculture took the helm of world agro-food
25
* Tokyo University of Agriculture
: This study investigated spatial flow patterns of international agricultural
trade, employing Q-mode factor analysis for the international trade volume of fruit
and vegetables with FAO statistics. As previous studies have pointed out, this
quantitative research verified the characteristics of the third food regime where fruit
and vegetables are the major sector of the agricultural trade and are exported from
developing countries in Africa or Latin America to developed countries. This study
also indicated that apart from north-south trade, trade of fruit and vegetables among
developed countries is the mainstream flow, and a load of leguminous vegetables or
nuts are traded among developing countries in Southeast Asia or the Indian subcon-
tinent. Consequently, global trade of fruit and vegetables is in the process of
multi-polarization.
: agricultural trade, food regime, FFV (fresh fruit and vegetables), spatial
flow patterns, factor analysis
Nagatada Takayanagi*
Global Flows of Fruit and Vegetables
in the Third Food Regime
summary
Key words
I. Introduction
. Research Agenda
+323
+21*
+

農村研究 第 号 � �
international flow patterns of fruits and vegetables respectively by employing factor analysis.
systems based on the productionism. Although this type of agriculture, which churned out
wheat, livestock products, and soybeans grown in a crop rotation prevailed all over the world,
it needed energy, agrichemicals, and agricultural machinery produced in developed countries
like the U.S. Accordingly, as a result vertical integration and vertical disintegration pro-
gressed (Takayanagi, ), and the second food regime was formed by transnational corpo-
rations, or agribusiness, which reorganized world agro-food systems.
Many scholars point out that current world agro-food systems started getting into a new
stage after the oil crises and the collapse of Bretton Woods system. The Expanded European
Community, incorporating the U.K., Ireland, and Denmark in , became a counterforce
against the U.S. in the world food market. As the agricultural crisis got worse due to
overproduction and overloaded debt of farms, trade wars were waged in the s. The World
Trade Organization, which was set up in as the successor of GATT, promoted its
a liated countries to reduce agricultural support packages and export subsidies, and the
tari cation of most agricultural products to intensify the free trade system (Jarosz, ).
This trade liberalization exerted an influence on the investment of agribusinesses on the
global scale. For instance, trade liberalization for beef in Japan attracted foreign investment
of Japanese trading firms and American food companies to Australia (Ufkes, ). It follows
previous statements that the current agro-food system is the transition of the third food
regime where transnational corporations reign supreme under the free trade system. In
addition to the U.S. and EU, since Japan became to have strong clout for international
agricultural trade, the ongoing third food regime is based on a multi-polarity of power (Le
Heron, ).
In recent years, several articles have been devoted to research on the global agro-food
systems, which was characterized by the flow of fresh fruit and vegetables (FFV) from
farmers in developing countries to upscale consumers in developed countries (Arce &
Marsden, ; Kritzinger et al., ; Dolan & Humphrey, ). These discourses are
worthy of attention in considering the relationships between agribusiness, contract farmers,
and consumers, but no studies have attempted to explain the spatial flow patterns of
agricultural trade on the whole. Therefore, the purpose of this study is to identify flow
patterns of international agricultural trade, particularly fruit and vegetables, on global scale.
This research uses the FAOSTAT and the World Agricultural Trade Matrix (WATM)
provided by the Food and Agricultural Organization. First, this research outlines world
agricultural trade, focusing on the magnitude of fruit and vegetables, and then finds out
Numerous studies using factor analysis in geography have been conducted to figure out
nodal regions over the few decades. This analysis method has been well established since
spatial flow patterns, such as automobile tra c (Hayashi, ), commodity flows (Kanno,
), truck tra c (Okui, ), cargo flows (Murayama, ), and person trips (Ito, ), have
been obtained. In recent years, international flows such as flight networks (Park, ) have
26
. Research Materials and Analysis Method
,**/
+31-
+32*
+33/
$
$ +300
+33-
+33-
+33- ,**. ,**.
$ +31.
+310 $ +32* +32. +331
+33/
+*, ,**0
,
�
�
�
been studied, but there has been no attempt on the international agricultural trade flows.
The WATM is statistical data showing the flow matrices from export countries to import
countries by specific commodities, not showing aggregated data like vegetables or fruits.
Therefore, I categorized those items into vegetables or fruits in line with Japanese agricultur-
al statistics : vegetables include melons, cantaloupes, watermelons, berries, pulses (excluding
soybeans), tubers (excluding cassavas and powdered or starch) ; and fruits include nuts .
This analysis was mainly conducted on the basis of volume, because most items a ect the
daily diet in the world agro-food systems, even though their prices are low. Besides, this
analysis adopted the data of import volume in light of statistical reliability, because the
WATM lacks export data for some developing countries, which may be due to political
instability .
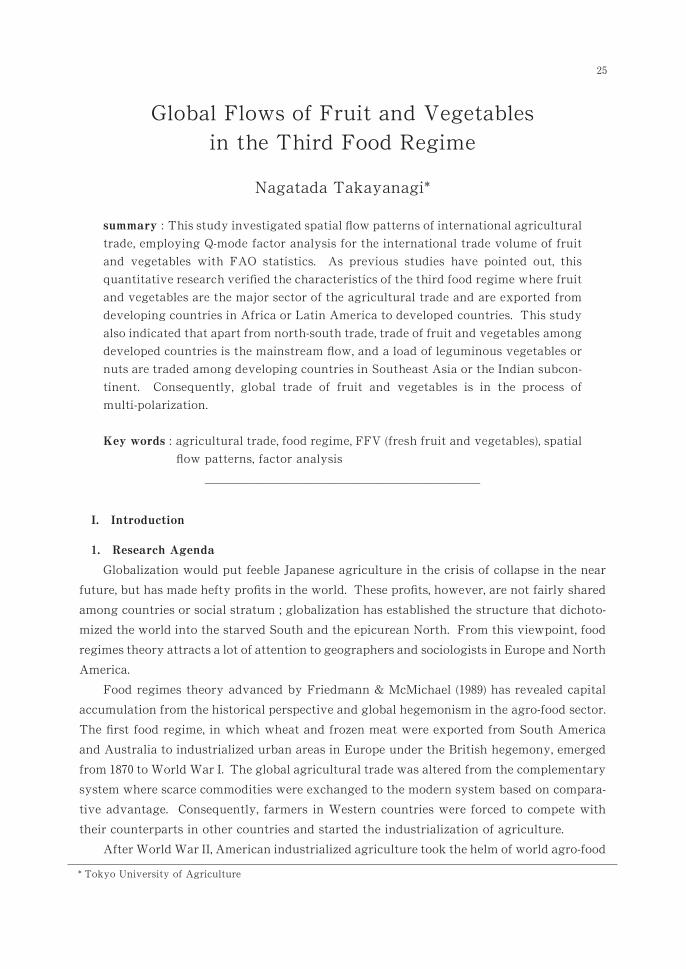
Agricultural trade has globally expanded in not only durable products but also perisha-
ble fruit and vegetables. While the production volume of fruit and vegetables in was .
. times as much as that in , the trade volume has increased more than fourfold in those
years. Fruit and vegetables have become the most massive sector in agricultural trade
based on nominal value, outgrowing the meat or grain sectors (Fig. ). The world trade value
of fruit and vegetables was the prominent amount of $ billion as of in comparison to
grain ($ ) or meats ($ billion). Fruit and vegetables had played second fiddle in world
agro-food systems until recently, because they were considered as side dishes or snacks rather
27
Source : FAOSTAT.
Global Flows of Fruit and Vegetables in the Third Food Regime
World agricultual trade value by selected sectorsFig.
II. Expansion of World Fruit and Vegetables Trade
. Increasing Fruit and Vegetables Trade
+
,
#
,**, , *
, / +30,
.*
+
+*+ ,**.
10 //
+
+
農村研究 第 号
�
� �
�
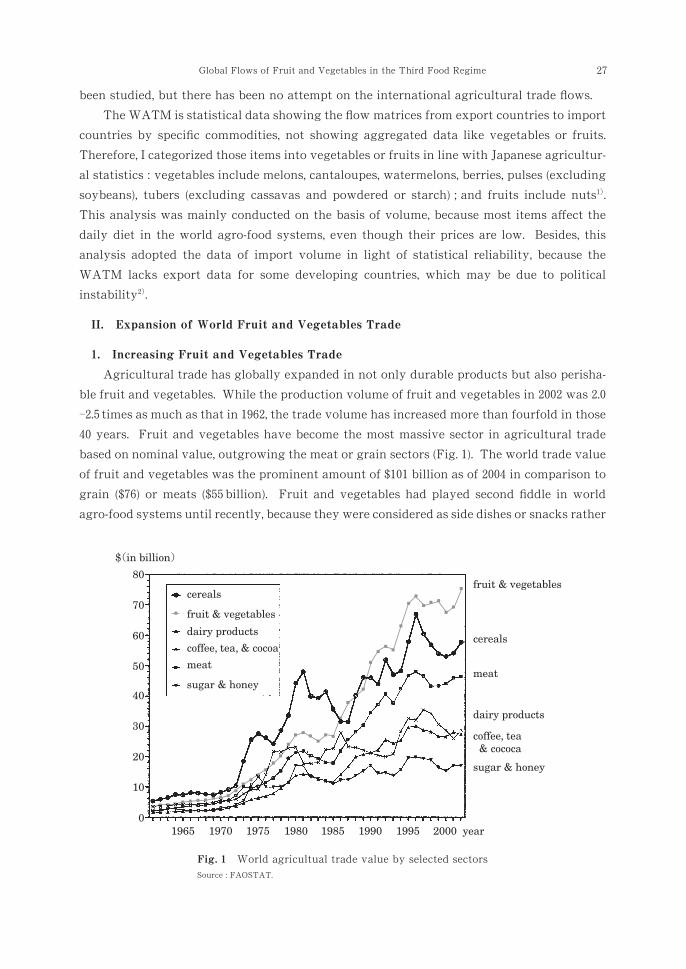
than staple foods. However, fruit and vegetables are growing in importance in the globalizing
world economy.
Western Europe is the centerpiece of world fruit and vegetable trade. Figure shows
export of fruit and vegetables in value by countries. Spain, the Netherlands, Italy, Belgium,
and France are remarkable in size, whereas countries in Eastern Europe (except Poland) or the
former Soviet Union do not export many horticultural products.
In Africa, a considerable number of countries have increased their export value of fruit
and vegetables for the last years. Ghana ( . times), Guinea-Bissau ( . times), Nigeria ( .
times), Zimbabwe ( . times), and Cameroon ( . times) are the top countries to do so.
Nevertheless, each export value stays within the range from merely $ . million to $ . million
and is even less than Japan ($ . million), because exports from these countries were next to
nothing in the ’s. Thus, some African countries have sharply increased their exports of
fruit and vegetables to wealthy Western Europe, but gross value of export in most African
countries is far less than that in Europe or the Americas.
Leading export items have not changed in the fruit sector or the vegetable sector, but
various items have been recently traded in the global arena of the market. In the s, export
vegetables were long-life items such as potatoes, tomatoes and their processed foods, onions,
and leguminous vegetables, accounting altogether for of the world total volume. Potat-
oes, tomatoes, and onions remain the top items in vegetable export, but newly popular
vegetables such as watermelons, melons and cantaloupes, cucumbers and gherkins, as well as
28
Notes : ) Countries whose export value is more than $ million are shown.
) This map is illustrated by the Winkel Tripel projection (inset map : Bonne projection).
Source : FAOSTAT.
Export value of fruit and vegetables ( )Fig.
. World Export Volume by Items
-
,
,* 0. * -/ 0 ,+ +
+- 3 3 0 /
, * . 2
3 2
+32*
+30*
1*
-
+ ,*
,
+*, ,**0
,**,,
,

� �
�
� � �
various peppers have been more rapidly increasing in the world trade market. Additionally,
export items have been diversified in the last decade. Recent exploding items are cranberries
( . times), garlic ( . times), frozen potatoes ( . times), taros ( . times), and mushrooms ( .
times). Top items in fruit export have not changed for years, but export volume of
various juices processed from oranges, apples, and grapes is more remarkable than fresh
items because juice is consumed more conveniently. Also, there are newly emerging fruit
export items, such as papayas ( . times), plantains ( . times), quinces ( . times), mangos ( .
times), miscellaneous fresh tropical fruits ( . times), and miscellaneous dehydrated tropical
fruits ( . times).
Most fruit items are exported from developing countries to developed countries. Figure
, showing that most items are placed on the right, indicates that the rates of developed
countries are significant. Bananas, pineapples and mangoes are typical items exported from
tropical developing countries to developed countries. Moreover, developed countries import
. of apple juice, . of orange juice, and . of grape juice, that is, fruit juice is
exported almost exclusively to the North. However, there are a few exceptions : peaches and
kiwi fruits are traded among temperate developed countries ; and cashews are traded among
developing countries.
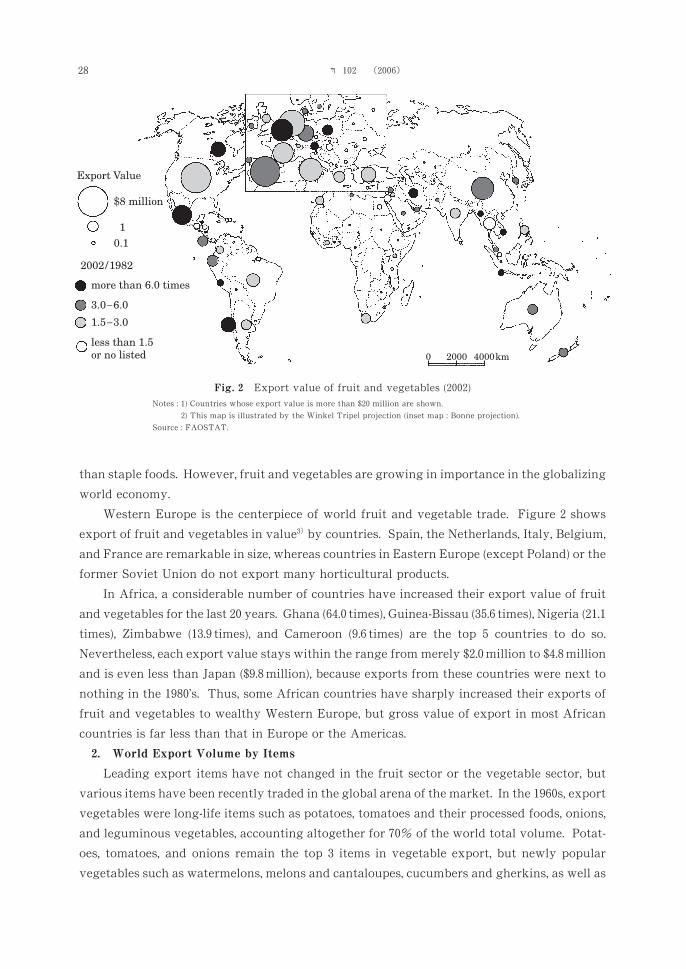
Vegetable items can be classified into categories (Fig. ) : flows mostly among
29
Notes : ) Developed countries are members of Development Assistance Committee, OECD.
) Top items are shown.
) Including their allied species such as clementines and satsumas.
Source : FAOSTAT.
Global Flows of Fruit and Vegetables in the Third Food Regime
Major fruit trade volume and total shares for developed countries ( )Fig.
. /2 1 . , - * , 3 , 0
. .*
- 2 - * , 3 , 2
- +
+, .
-
23 / 22 - 20 1
/ .
+ ,,
, ,*
-
,**,-
農村研究 第 号 � �
��
��
developed countries, including peeled tomatoes, frozen potatoes, lettuce, potatoes, cauliflo-
wers, and carrots, flows mostly among developing countries, including garlic, peas, and
beans, flows mostly from developed countries to developing countries, including lentils
whose major exporter is Canada exporting to Turkey, Algeria, Colombia, and Morocco, and
whose second most exporter is Australia exporting to Egypt, Pakistan, Turkey, and Sri
Lanka, flows from both developing countries and developed countries to developed coun-
tries, including melons/cantaloupes, frozen vegetables, peppers and cucumbers/gherkins,
flows among both developing and developed countries.
All statistical analyses mentioned above verify several Anglophone scholars’ findings
that the exports of less familiar fruits have recently increased drastically from the tropics to
developed countries (Friedland, ; Le Heron & Roche, ). However, actual volume or
value of vegetable flows from developing countries to developed countries are not as large as
they emphasized ; and there are many items traded within developed countries or within
developing countries. In general, while regionality in preference for fruits is unclear because
they are consumed as snacks or desserts, vegetable trade has diverse patterns, because
vegetables are cooked or prepared before eating and thus traditional dietary culture deter-
mines what kind of vegetables are imported.
30
Notes : ) Developed countries are members of Development Assistance Committee, OECD.
) Top items are shown.
Source : FAOSTAT.
Major vegetable trade volume and total shares for developed countries ( )Fig.
+33. +33/
+ ,,
, ,*
+*, ,**0
,**,.
�
�
� �
�
�
�
�
To delve into details for the international flow of fruits and vegetables, two matrices
were constructed in which each cell contains total import volume (i.e. items are summed up
into the group of vegetables or fruits), and then Q-mode factor analysis was applied to the
matrices, yielding factor scores as import countries (i.e. destinations) and factor loadings as
export countries (i.e. origins). Using the non-weighted least-squares method, factors with
an eigenvalue greater than . were extracted from the matrix of vegetable trade and
factors from the matrix of fruit trade. The first factors of vegetable trade and the first
factors of fruit trade were worth consideration in light of convincing possibility. Cumulative
contributions for vegetables and fruits are . and . respectively, which can explain
trade patterns to a considerable extent. After varimax rotation, I recognized factor loadings
over . on the basis of absolute value as export countries and factor scores over . as import
countries, and then analyzed and explained flow patterns.
Factor I accounts for . of all the vegetable flows. It can be considered as ‘flows to the
United States’, since its factor score is well above . . Countries with a high factor loading,
Honduras ( . ), Mexico ( . ), Dominican Republic ( . ), Costa Rica ( . ), Canada ( . ),
Peru ( . ), Guatemala ( . ), and so on, indicate close ties between the U.S. and Latin
America and the importance of NAFTA. Mexico is the largest exporter to the U.S., shipping
a great amount of fruit vegetables such as tomatoes, cucumbers, cantaloupes, and water-
melons. Other than the Americas, India attracts a lot of attention, although its factor loading
( . ) is less considerable.
Factor II is also important, accounting for . , slightly lower than the first factor. It
can be considered as ‘flows to Germany’, since its factor score ( . ) is by far the highest of the
origins. Flows from European countries are conspicuous, as high degree countries in factor
loadings are the Czech Republic ( . ), Italy ( . ), Austria ( . ), Hungary ( . ), the
Netherlands ( . ), and so forth. Also, Turkey ( . ) is noteworthy, because it aspires to join
the EU, and labor migration called
Factor III accounts for . . It can be considered as ‘flows to Russia’, since its factor score
( . ) is highest. Countries with a high factor loading are Uzbekistan ( . ), Kazakhstan ( . ),
and Ukraine ( . ), which constituted the former Soviet Union. Although their exports are
not very large, onions and tomatoes from Uzbekistan, onions from Kazakhstan, and peas from
Ukraine make up the majority of exports to Russia. Accordingly, Russia is still the chief
trading partner for them.
Factor IV accounts for . . It can be considered as ‘flows to Japan’, since its factor score
( . ) is highest. Asia-Pacific economies export vegetables to Japan, as factor loadings of
Taiwan ( . ), China ( . ), and New Zealand ( . ) are especially high, and Thailand’s
loading ( . ) is also substantially high. Although the U.S. exports an enormous volume of
31Global Flows of Fruit and Vegetables in the Third Food Regime
from Turkey is in common in Germany.Gastarbeiter
III. Trade Flow Patterns of Fruits and Vegetables
. Extracting of Factors
. Flow Patterns of Vegetable Trade
0
1
+/
+ * +0
++ 3
02 . 10 .
* ,/ . *
+, 3
2 ,
* 33, * 322 * 32. * 32- * 3--
* 230 * 2++
* -1.
++ +
1 3
* 3*+ * 2// * 2/. * 110
* 1// * 0.1
2 2
2 - * 332 * 332
* 32-
/ 3
2 ,
* 32. * 3-* * 200
* .2*
+
,

農村研究 第 号 � �
�
��
vegetables, its factor loading greater than . is found only in the Factor IV, which proves
Japan is relatively significant for a U.S. export destination.
Factor V accounts for . . It can be considered as ‘flows to France’, since its factor score
( . ) is highest. Countries with a high factor loading are Morocco ( . ), Belgium ( . ), Israel
( . ), and so on. From Morocco, tomatoes are the major export vegetable, shipping of
exports to France. Belgium is a potato exporting country, and particularly ships of
32
Notes : ) Indonesia is both an origin and a destination in the factor VI.
) These maps are illustrated by the Winkel Tripel projection (inset maps : Bonne projection).
World vegetable trade flows (Factor I-VI. X)Fig.
* ,/
/ 1
1 3 * 302 * 13.
* 10/ 2*
2*
+
,
+*, ,**0
/

�
�
�
�
�
�
�
�
frozen potatoes to France. Vegetables flow over the Mediterranean Sea, as Israel exports
potatoes, peppers, and tomatoes.
Factor VI accounts for . . As the highest factor scores are . to Malaysia, . to the
Philippines, and . to Indonesia, and a high degree loading is . of Thailand and . of
Indonesia, this factor can be considered as ‘flows in Southeast Asia’. In addition, it is notable
that neighboring economies such as Hong Kong ( . ), India ( . ), Australia ( . ), and New
Zealand ( . ) have strong nodes with Southeast Asia. The major import vegetable in
Malaysia is the onion mainly from India and Myanmar. In Indonesia, garlic is a main trading
vegetable, importing from China through Hong Kong . On the other hand, Indonesia exports
cabbages and potatoes to Malaysia. In addition, Australia exports beans to the Philippines
and peas to Malaysia. Also, Thailand exports onions to Malaysia and peas to Malaysia and
the Philippines. The aforementioned shows that intricate flows are found in Southeast Asia
and its neighbors such as India and Australasia.
Factor VII accounts for . . It can be considered as ‘flows to the U.K.’, since its factor
score ( . ) is highest. Countries with a high factor loading are Ireland ( . ) and Cyprus
( . ), which build historically close relationships with the U.K., and Portugal ( . ), Israel
( . ), Italy ( . ), and Spain ( . ). Main import vegetables to the U.K. are potatoes (
thousand tons combined with frozen) and tomatoes ( thousand tons combined with
processed).
Factor VIII accounts for . . It can be considered as ‘flows to Saudi Arabia’, since its
factor score ( . ) is highest. International vegetable flows are found within the Middle East,
as factor loadings of Syria ( . ), Egypt ( . ), and Turkey ( . ) are high. Although Saudi
Arabia imports many kinds of vegetables, the imported item with the largest volume is the
tomato, which is mainly from Syria and Turkey. In addition, onions are also a major imported
vegetable, chiefly imported from Egypt.
Factor IX accounts for . . It can be considered as ‘flows to Belgium’, since its factor
score ( . ) is highest. Countries with a high factor loading are France ( . ) and Cyprus
( . ). France exports potatoes and peas ; and Cyprus exports potatoes.
Factor X and Factor XI account for . respectively. As the factor score of Sri Lanka
( . ) is highest in the Factor X, vegetable flows from India and Pakistan are found. In the
Factor XI, the factor score of India ( . ) is highest, and the factor score of Pakistan ( . ) is also
considerable high points. Countries with a high factor loading are Afghanistan, Myanmar,
and Australia. Myanmar exports peas, in particular black
Factor I accounts for . of all the fruit flows. It can be considered as ‘flows to the
33Global Flows of Fruit and Vegetables in the Third Food Regime
. The export of peas from
Myanmar significantly increased from . million tons in to . million tons in .
Bilateral trade between India and Australia has a long history, tracing back to the early th
century, and has expanded rapidly for recent years. The main export item from Australia is
chickpeas. These two factors indicate that South Asia has a trading sphere extending
adjacent to Myanmar and Australia on the other side of the Indian Ocean.
matpe
. Flow Patterns of Fruit Trade
2
/ , 1 / / .
. 1 * 23- * 2.2
* /3, * .00 * ./0
* ,11
/ +
1 3 * 303
* 0*1 * 1+-
* /,- * -+3 * -+, 12*
1**
. +
1 3
* 32. * 3+* * /,+
- -
2 * * 2+*
* 1+3
- +
2 *
0 - / /
+0 ,
3
* +1 +33* + + ,**,
+3
-

農村研究 第 号 � �
�
United States’, since its factor score ( . ) is highest. Countries with a high factor loading,
Mexico ( . ), Trinidad and Tobago ( . ), Canada ( . ), Guatemala ( . ), Honduras ( . ),
Chili ( . ), and so on are located in the Americas. That suggests the U.S. is the important
destination of fruit export for Latin American Countries and Canada. In addition, some Asian
countries such as India ( . ), Indonesia ( . ), and Thailand ( . ) export fruits to the U.S.,
as well as vegetables.
Factor II accounts for . . It can be considered as ‘flows to Germany’, since its factor
score ( . ) is greatly higher than the other countries. Germany has strong linkages with
34
Note : These maps are illustrated by the Winkel Tripel projection (inset maps : Bonne projection).
World vegetable trade flows (Factor VII-IX. XI)Fig.
3 -
* 321 * 320 * 313 * 31. * 30-
* 3/+
* 1,+ * --+ * -+1
+. /
3 +
+*, ,**0
0
�
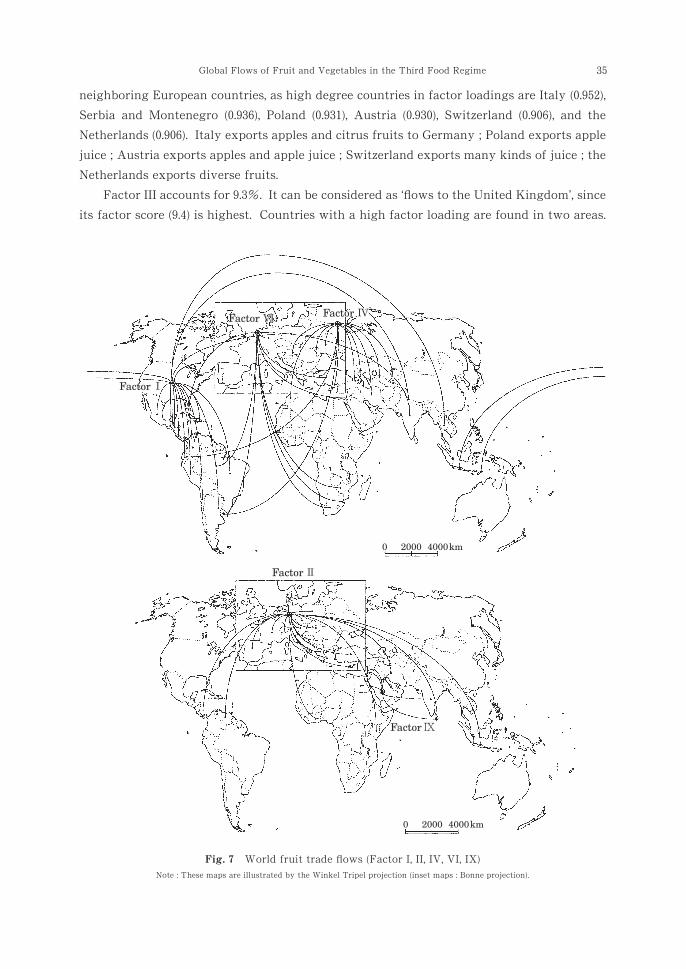
neighboring European countries, as high degree countries in factor loadings are Italy ( . ),
Serbia and Montenegro ( . ), Poland ( . ), Austria ( . ), Switzerland ( . ), and the
Netherlands ( . ). Italy exports apples and citrus fruits to Germany ; Poland exports apple
juice ; Austria exports apples and apple juice ; Switzerland exports many kinds of juice ; the
Netherlands exports diverse fruits.
Factor III accounts for . . It can be considered as ‘flows to the United Kingdom’, since
its factor score ( . ) is highest. Countries with a high factor loading are found in two areas.
35
Note : These maps are illustrated by the Winkel Tripel projection (inset maps : Bonne projection).
Global Flows of Fruit and Vegetables in the Third Food Regime
World fruit trade flows (Factor I, II, IV, VI, IX)Fig.
* 3/,
* 3-0 * 3-+ * 3-* * 3*0
* 3*0
3 -
3 .
1

農村研究 第 号
�
� �
�
First is in Caribbean countries, such as Saint Lucia ( . ), Jamaica ( . ), and Belize ( . ).
These countries principally export bananas, in addition to Jamaica exporting oranges and
Belize exporting orange juice. Also, African courtiers, such as South Africa ( . ),
Cameroon ( . ), and Swaziland ( . ), export fruits to the U.K., although factor loadings
are lower. South Africa exports loads of citrus fruits, grapes, and grapefruits, yet the
important item to be exported from South Africa is the apple, of which are shipped to the
U.K. The export item of Cameroon is the banana. All of these African countries were
formerly under control of the U.K in the colonial days, and are still members of the British
36
Note : These maps are illustrated by the Winkel Tripel projection (inset maps : Bonne projection).
World fruit trade flows (Factor III, V, VII, VIII)Fig.
+*
* 33- * 32/ * 2,0
* //3
* -1, * --*
.*
0
+*, ,**0
2
�
�
�
�
�
�
�
�
�
Commonwealth. As for fruit trades, nodal regions that are historically formed are still found
with neocolonialism under the third food regime . As for developed countries, Ireland is also
an export origin to the U.K.
Factor IV accounts for . . It can be considered as ‘flows to Russia’, since its factor score
( . ) is highest. Countries with a high factor loading are Uzbekistan ( . ), Tajikistan ( . ),
Azerbaijan ( . ), Georgia ( . ), Moldova ( . ), and Ukraine ( . ), with the former
Soviet-bloc states having strong relations with Russia. Grapes and raisins from Uzbekistan
and Tajikistan, oranges from Azerbaijan and Kazakhstan, peaches from Georgia, and apples
from Moldova are exported.
Factor V accounts for . . It can be considered as ‘flows to France’, since its factor score
( . ) is highest. France has tight-knit relationships with African countries, as factor loadings
of Cote d’Ivoire ( . ), Tunisia ( . ), Morocco ( . ), Kenya ( . ), Cameroon ( . ) are high
enough to be considered. Main items are pineapples and bananas from Cote d’Ivoire and dates
and oranges from Tunisia. These states excluding Kenya were former colonies ruled by
France.
Factor VI accounts for . . It can be considered as ‘flows to the Netherlands’, since its
factor score ( . ) is highest. Countries with a high factor loading are found in southern Africa,
for example Zimbabwe ( . ), Swaziland ( . ), and South Africa ( . ), and in Latin
American countries such as Cuba ( . ), Brazil ( . ), and Uruguay ( . ). The Netherlands
has the most comprehensive gateway of fruit trade in Europe, as bananas, citrus fruits,
oranges, grapefruit juice, and other things are flown into the port of Rotterdam and are
distributed to the rest of Europe both by water and by land.
Factor VII accounts for . . It can be considered as ‘flows to Japan’, since its factor score
( . ) is highest. The Pacific Rim trade region centered on Japan is found, as economies with
a high factor loading are Taiwan ( . ), South Korea ( . ), the Philippines ( . ), China
( . ), the U.S. ( . ), Australia ( . ), and New Zealand ( . ). Notably, Japan is also the
only state for the U.S. export destination of fruit trade.
Factor VIII accounts for . , slightly lower than Factors VII and VI. It can be considered
as ‘flows to India’, since its factor score ( . ) is highest. Some African countries show high
value in factor loading, such as Tanzania ( . ) and Guinea Bissau ( . ), as well as southern
and western Asian countries, Pakistan ( . ), United Arab Emirates ( . ), and Iran ( . ).
Virtually all of the fruit exports from Tanzania or Guinea Bissau to India are cashew nuts,
because India is a center for the world cashew nut processing industry. India is the second
largest grower of the cashew nut (quite recently outproduced by Viet Nam), but faces an
acute shortage of raw cashew. Therefore, India imports a large volume of raw cashew nuts
from African countries, and then processes and exports mostly to the U.S., Europe, and Japan.
Factor IX accounts for . . It can be considered as ‘flows to Saudi Arabia’, since its
factor score ( . ) is highest. Wealthy countries with oil money in the Middle East must import
fruits because of their desert environment. Countries with a high factor loading are Syria
( . ), Lebanon ( . ), and Egypt ( . ), which export citrus fruits, mainly oranges.
37Global Flows of Fruit and Vegetables in the Third Food Regime
++
+,
+-
2 0
3 . * 332 * 332
* 332 * 33, * 322 * 0,/
0 -
3 +
* 31, * 3/- * 0*/ * /*0 * .3-
/ 2
3 ,
* 3*+ * 21* * 0-3
* 301 * 0*0 * .13
/ 2
3 *
* 310 * 300 * 3,/
* 22* * /-0 * .03 * ,2-
/ 2
3 -
* 32/ * 32.
* 30. * 211 * 13.
. ,
2 3
* 33* * 3.0 * 3..

農村研究 第 号 � �
�
�
�
��
�
Although the concept of FFV refers to both fruits and vegetables, there are some
di erences between fruits and vegetables in the spatial flow patterns. Fruit trade is more
distinct in flows from developing countries to developed countries than vegetable trade. The
tight-knit relationship between Latin America and the U.S. or Africa and Europe is shown in
fruit trade rather than vegetable trade. In this study, factor loadings indicate relative
dependence on import countries for export countries. Some African or Latin American
countries have high values of factor loading to their former colonial ruler even after long
period of political independence. In other words, spatial fruit trade patterns can be deter-
mined by social closeness rather than physical proximity in some cases.
The north-south trade is not minor for current agro-food systems, yet this study suggests
other flow patterns are well worth consideration from the perspective of quantitative analy-
sis. First, intracontitental flows among European countries still retain an overwhelming
share of world trade. Vegetable trade volume in Western Europe accounted for of the
world total volume as of . Germany, France, the U.K., and Belgium are the main importers
whose variances in total of vegetable trade is . . Second, vegetable and fruit trades are
not one-way flow from developing countries to developed countries. Export volume of
vegetables from Africa and developed Europe is no more than thousand tons, and has not
caught up with other flows like China-Japan. In addition, vegetable flows between Africa and
Europe are not necessarily one-way trade, as export volume from Africa to Europe is almost
equal to its counterflows. Similarly, the U.S. imports thousand tons from each Central
American country such as Guatemala, Honduras, and Costa Rica, but of all vegetable
imports are from Mexico and Canada. Canada imports of its vegetables from the U.S. and
Mexico ; Mexico imports of its vegetables from the U.S. and Canada. Accordingly, it is
more accurate that this pattern is considered as NAFTA flow, rather than Latin America-
North America flow. Third, this factor analysis identified flow patterns that are located
among developing countries in Southeast Asia, the Indian subcontinent, and the Middle East.
Huge volume of leguminous vegetables or nuts is currently traded among developing
countries for their own consumption and export commodities. Also, some newly flourishing
countries with industrialized economy or oil dollar import an enormous volume of fruits or
vegetables.
The international trade of fruit and vegetables, which has rapidly expanded in recent
decades, is the most significant part of the global agro-food systems under the third food
regime. This study statistically verified that FFV came to play an important role in world
agricultural trade, with a particular increase in exotic tropical fruits export to developed
countries.
Results from this study lead to the conclusion that global trade of fruit and vegetables
has diverse patterns. Although it is true enough that the third food regime prompts more
38
. Discussion
IV. Conclusion
#
.+
,***
. ,1 .
0**
+,* ,/*
10
3,
31
+*, ,**0
.

�
�
����
�
�
�
�
�
�
�
There are a few exceptions : ginger is listed in the spice group in the FAOSTAT, and hop is listed in
the fruit group in the FAOSTAT but is supposed to be an industrial crop in Japan. Thus both of them
were not included in fruits or vegetables in this study.
Although FAO statistics and the WATM have some flaws in classification of items or calculating
data, no other resource is available for the sake of this research.
Aggregated data in volume are not available from the FAOSTAT.
Including what is called
Including
Countries of which vegetable export volume is less than thousand tons or vegetable import
volume is less than thousand tons, and fruit export volume is less than thousand tons or fruit
import volume is less than thousand tons were eliminated in order to extract commonality of flow
patterns.
The factor score of Costa Rica was relatively high but its export volume was extremely negligible,
one ninetieth of the U.S. Accordingly, Costa Rica was not regarded as a major import country in the
factor I.
Although absolute volume of direct export from China is larger than by way Hong Kong, vegetable
export from China to Japan is so enormous and so various that the factor score of China ( . ) is not
high.
These agricultural products are also exported to Japan as the raw materials for beansprouts called
Cameroon was ruled by Germany before World War I, and then divided into the eastern part ruled
by the U.K. and the western part ruled by France.
This result corroborates the previous suggestion : some African or Caribbean states have trade
orientation toward their ex-colonizer, although the position of the U.K. has weakened (Nierop &
DeVos, ).
Shifting of foreign trade policy to liberalization encouraged planting cashew nut trees. Most farms
are owned by domestic capital, but most shippers and traders are foreigners such as Senegalese or
Guinean (Ito, ).
Mozambique was the largest producer of cashew nuts in the early s. Although, its output has
declined sharply, a moderate amount of cashew nuts are still exported to India (Cramer, ), but no
data of Mozambique is available from the WATM.
active international flows of fruit and vegetables from developing countries to developed
countries, particularly from Latin America to the United States and from Africa to Europe,
other flow patterns should not be disregarded. Most fruit and vegetable trades are found
within the advanced world in volume, and especially flows of vegetables from developing
countries are nothing more than a part of global trade. In addition, some African, Asian, or
Lain American countries import fruits and vegetables as much as they export. Moreover,
some developing countries are increasing in importance as not only exporters but also
importers because of their economic growth. Consequently, global trade of fruit and vegeta-
bles is in the process of multi-polarization.
39Global Flows of Fruit and Vegetables in the Third Food Regime
in Japanese.
mushrooms.
satoimo
shiitake
moyashi.
Notes
+
,
-
.
/
0 1*
/* ./
,*
1
2
* +0*
3
+*
++
+322
+,
+333
+- +31*
+333

農村研究 第 号 � �
�
�
�
�
�
�
�
�
�
�
�
�
�
�
�
�
�
�� �� �� � �
Hauliers in Japan,”
Arce, A. & Marsden, T.K. ( ), “The Social Construction of International Food : A New Research
Agenda,”
Cramer, C. ( ), “Can Africa Industrialize by Processing Primary Commodities? : The Case of Mozambi-
can Cashew Nuts,”
Dolan, C. & Humphrey, J. ( ), “Changing Governance Patterns in the Trade in Fresh Vegetables
Between Africa and the United Kingdom,”
Friedland, W.H. ( ), “The New Globalization : The Case of Fresh Produce,” Bonanno, A., Busch, L.,
Friedland, W.H., Gouveia, L., and Mingione, E. (eds.), From
Friedmann, H. & McMichael, P. ( ), “Agriculture and the State System : The Rise and Decline of
National Agriculture,”
Hayashi, N. ( ), “Functional Regions Based on Interregional Automobile Flows in the Nagoya Metro-
politan Area,”
Ito, S. ( ),
Ito, S. ( ),
Jarosz, L. ( ), “Working in the Global Food System : A Focus for International Comparative Analysis,”
Kanno, M. ( ), “Canonical Analysis of Commodity Flows and Socio-Economic Structure in Major U.S.
Metropolitan Areas,”
Kritzinger, A., Barrientos, S. & Rossouw, H. ( ), “Global Production and Flexible Employment in South
African Horticulture : Experiences of Contract Workers in Fruit Exports,”
Le Heron, R. ( ),
Le Heron, R. & Roche, M. ( ), “A ‘Fresh’ Place in Food’s Space,”
Murayama, Y. ( ), “Regional Structure of Japanese Commodity Flows : An Approach of Geographical
Field Theory,”
Nierop, T. & DeVos, S. ( ), “Of Shrinking Empires and Changing Roles : World Trade Patterns in the
Postwar Period,”
Nojiri, W. ( ), “The Patterns of Freight Flows Carried by Railway Containers and Regular Road
Okui, M. ( ), “Regional Structure of Truck Movements within Hokkaido,”
Park, J. ( ), “International Urban System in Terms of Air Passenger Flow : A Case of Fukuoka in the
East Asian Urban System,”
Takayanagi, N. ( ), “A Theoretical Review on the Spatial Structure of Agri-food Systems in the
Globalizing Economy ( ),”
Ufkes, F.M. ( ), “Trade Liberalization, Agro-Food Politics and the Globalization of Agriculture,”
(JE) : written in Japanese with English summary (J) : written in Japanese
Received November ,
Accepted January ,
40
Vol. , No. , . (JE)
Vol. , No. , .
Vol. , No. , .
Vol. , No. , .
Lawrence, Universi-
ty Press of Kansas, .
Vol. , No. , .
Vol. , No. , . (JE)
Tokyo, Kokon Shoin. (J)
Tokyo, Tsuge Shobo Shinsya. (J)
Vol. , No. , .
Vol. , No. , .
Vol. ,
No. , .
Oxford, Pergamon Press.
Vol. , No. , .
, Vol. , No. , . (JE)
Vol. , No. , .
Vol. , No. , . (JE)
Vol. , No. ,
. (JE)
Vol. , . (JE)
Vol. , No. , .
Annals of the Japan Association of Economic Geographers,
Economic Geography,
World Development,
Environment and Planning A,
Columbus to ConAgra,
Sociologia Ruralis,
Geographical Review of Japan,
Spatio-temporal Structure of the City : An Urban Cosmology,
Nishi-Afurika No Zibeta Kara : Ginia-Bisau Borantia Taiken-ki (From the Ground of Western
Africa : A Narrative through Volunteer Activities in Guinea-Bissau),
Progress in Human Geography,
Geographical Review of Japan,
Sociologia Ruralis,
Globalized Agriculture : Political Choice,
Area,
Annals of the Association of Economic Geographers
Tijdschrift voor Economische en Sociale Geografie,
Geographical Review of Japan,
Annals of the Japan Association of Economic Geographers,
Journal of Rural Community Studies,
Political Geography,
References
+33-
+333
,**.
+33.
+323
+31.
+331
+333
+330
+310
,**.
+33-
+33/
+32.
+322
+33-
+32*
+33/
,**/
+
+33-
+/ ,**/
++ ,**0
+*, ,**0
-3 , +-0 +/.
03 - ,3- -++
,1 1 +,.1 +,00
-0 - .3+ /*3
,+* ,-,
,3 , 3- ++1
.1 / ,21 -**
,* + .+ //
.3 . +31 ,+0
..
+ +1 -3
,1 + ,- --
-* , 3/ +++
13 / -.- -0.
/- . ,0- ,13
.+ ,
+-/ +..
+** 03 12
+, - ,+/ ,-+

本稿は の統計を利用して モ ド因子分析 摘した 量的にはヨ ロッパを中心に 先進国内の流動
によって 世界の野菜 果物貿易の空間流動パタ ン が圧倒的であり 豆類やナッツ類などは 東南アジアや
を検出した 欧米の地理学や社会学において 野菜や果 インド亜大陸など発展途上国間で大量に流動してい
物が農業貿易の中で重要性を増しており 発展途上国 る したがって 現在の第 次フ ドレジ ムの下で
から先進国への流動が強調されてきた 本研究はこの 世界の野菜 果物貿易は多極化しつつあるといえる
ような傾向を統計的に確認するとともに 世界の野
菜 果物流動は必ずしも南北貿易が主流ではなく 他 農業貿易 フ ドレジ ム 生鮮野
の貿易パタ ンに着目することも重要であることを指 菜 果物 空間流動パタ ン 因子分析
東京農業大学高柳 長直
キ ワ ド
第 次フ ドレジ ムにおける世界の野菜 果物貿易の空間流動
��
� � �� � �� �
� � � �� ��
� � �� �
� ��
� �
� �� �
� �
� �
� �
�
�
��
�
41Global Flows of Fruit and Vegetables in the Third Food Regime
FAO Q
FFV:
-
-