global off-grid solar market report semi-annual sales … · d.light mobisol shanghai easy yingli...
TRANSCRIPT

Global Off-Grid Solar Market ReportSemi-Annual Sales and Impact Data July - December 2017, PUBLIC REPORT

Authors’ Note
Our latest Global Off-Grid Solar Market Report presents sales and impact data covering July 1 to December 31, 2017, reflecting the performance of 67 affiliates working in this vibrant sector. This includes GOGLA members and companies that sell Lighting Global quality-verified products.
With the needs of investors, manufacturers, distributors, entrepreneurs, donors and policymakers in mind, the GOGLA and World Bank Group Lighting Global sales data report offers a uniquely detailed and robust snapshot of the development of the sector every six months. This report is built on a continuously growing data set to draw observations of key trends, insights and changes which underpin the market’s development. As such, we seek to provide insightful market intelligence that sector players will find essential in making more informed decisions in the operation of their businesses.
With more than 1 billion people living without access to the electric grid, who collectively spend about $27 billion annually on lighting and mobile phone charging, the sector has a lot of business potential to tap into. The 2018 Off-Grid Solar Market Trends Report provided us with a deeper understanding of potential future avenues for the sector. The potential of the market remains vast: the authors of the report expect the market to grow by around 25% year-on-year, and provide improved energy access to 740 million people by 2022.
The sales data collected for the present report seems to confirm that the market is back on a solid growth path after the temporary dip in sales reported in the first half of 2017, especially in the Pico-PV segment, mainly due to localized shocks in several key markets such as the demonetization in India and the drought across East Africa. Lighting Global and GOGLA will continue to push for high-quality, nuanced data to accurately tell the story of the industry’s evolution.
The present report features an aggregate of sales data shared with us by the companies that drive the sector, covering an estimated 30% of the total market of Pico-PV products and Solar Home System (SHS) kits. All companies that have contributed their sales data receive their own individual, tailored report, indicating their share of all relevant markets, and have access to a comprehensive online reporting platform that visualizes key market insights. If you would like to participate in our next data collection round, please get in touch with us.
Sincerely,
Koen Peters, Executive Director, GOGLA
Content TeamSilvia Francioso, Susie Wheeldon and Laura Sundblad (GOGLA) Leo Blyth and Itotia Njagi (Lighting Global, IFC) Hedde Rijkes, Marly te Selle and Yael Aartsma (Berenschot)Front cover © Total
Russell Sturm, Global Head, Energy Access, International Finance Corporation

3
Table of Contents
About this Report About the Authors Participants Methodology
Data Processing Product Categories
Report Highlights Key Global Figures Market DynamicsGlobal Market Insights
Historical InsightsInsights by Product Category
Detailed Sales DataRegional Market Insights
Historical InsightsInsights by Product Category
Market Insights by Country
Impact Metrics Methodology
Limitations of the Impact Metrics and ReportingList of Impact Metrics
Key Global Figures Analysis Impact Created
References and Credits Contact Information
445668
101011141418
2222242634
444444454647
50
51

4
About the Authors
This report is produced by GOGLA and Lighting Global with the assistance of Berenschot
Global Off-Grid Lighting Association GOGLA is the voice of the off-grid solar lighting and electrification sector. Established in 2012, GOGLA now represents over 125 members as a neutral, independent, not-for-profit industry association. Its mission is to help its members build sustainable markets, delivering quality, affordable products and services to as many households, businesses and communities as possible across the developing world. The products and solutions that GOGLA members sell transform lives. They improve health and education, create jobs and income opportunities and help consumers save money.
Lighting Global Lighting Global is the World Bank Group’s platform to support sustainable growth of the international off-grid solar market as a means of rapidly increasing energy access to the 1.1 billion people without grid electricity. Through Lighting Global, the International Finance Corporation (IFC) and the World Bank work with the Global Off-Grid Lighting Association (GOGLA), manufacturers, distributors, and other development partners to develop the modern off-grid energy market. The Lighting Global program supports market development by working with private companies to lower first-mover risk and mobilize private sector investment through market intelligence, quality assurance, business support services and consumer education.
Berenschot Berenschot is a leading Dutch management consultancy firm with an extensive track record in supporting industry associations, including on market data collection. Berenschot has been elected by clients as one of the best management consultancy firm of the Netherlands. Berenschot maintains a high standard of confidentiality, as stated in the Berenschot Terms and Conditions.
About this Report

5
Manufacturers
All Weather Solar Jua Solar OmniVoltaic Energy Solutions Sunna Design
Anji Dasol Lagazel Orb Energy Super Star Group Solar
Azuri Little Sun OvSolar True Solar
BBOXX Lumos Global Philips Lighting Videre Global
Biolite M-KOPA RAL Consumer Products Village Power
Bright Products AS Mibawa Suppliers Renewit Waka-Waka (Off-Grid Solutions)
d.Light Mobisol Shanghai Easy Yingli
EcoZoom Limited Nadji-Bi Simpa Networks Zhejaing Holley
Fenix International Niwa Sinoware Zimpertec
Fosera Nizam Energy Solaris Offgrid
Greenlight Planet Nokero International SolarNow
Jua Energy Off-Grid: Electric SolarWay
Distributors
Azimuth Offgrid Sun(former Futura Sun)
Smarter Grid International Sunny Money (Solar Aid)
Bright Life by Finca Oolu Solar Solar Sister Total
EcoEnergy Pawame SolarHome UpOwa
Lumi PEG Africa Solarkiosk Zonful Enterprises
Mwezi Limited Qotto SolarWorks!
NewLight Africa (Heya!) Simusolar Sosai Renewables Energy
Table 1: List of Participants
Participants
© Philips Lighting
About this Report

6
Methodology
Companies are classified either as distributors of other companies’ branded products or as manufacturers of their own branded products. Only aggregate data from companies categorized as manufacturers is presented here to avoid double-counting. In this reporting round, this amounts to 46 companies out of the 67 that participated in the data collection.
Market Share RepresentedThis report only includes data on products sold by affiliates, meaning GOGLA members or companies that sell Lighting Global quality-verified products. Based on previous analysis by Dalberg Advisors for the Off-Grid Solar Market Trends Report 2018, we estimate that the data reported here represents about 30% of all sales of Pico-PV products and Solar Home System (SHS) kits. This proportion varies substantially from country to country; the market share estimates for non-affiliates Pico-PV devices globally and across seven national markets can be found in the table below.
Accuracy All data is self-reported by the companies, and while it is cross-checked for consistency, the companies are ultimately responsible for accurate reporting of product specifications, pricing information, sales volumes and locations of sales. Companies may also choose to report sales volumes but not revenues.
Data ChecksThe research team checked the submitted data for consistency and logic with respect to previously collected data by Berenschot or Lighting Global. Based on these checks, some small adjustments have been made concerning product performance specifications and the ‘quality-verified’ status of products where necessary.
Data Collection ProcessAs in the previous rounds, this data collection and reporting process was overseen by the Dutch management consultancy firm Berenschot, while Lighting Global and GOGLA provided specialized industry knowledge within the research team. The online questionnaire and results platform were programmed by Getting Social, a Dutch web development company.
Missing Data Where meaningful data was missing, we tried to address this by consulting our existing data sets, or by contacting respondents. Unfortunately, even after these actions, some data is still missing.
ConfidentialityData on a specific region, country or product category is only included when it has satisfied the three-data point rule, meaning that at least three separate product manufacturers have reported data for any single data point. When we have fewer than three responses for a region, country or product category, no results are shown to protect the proprietary interests of the companies who have supplied data in support of this industry report.
Segment BNEF (2016) Interviews and desk research
Lighting Global /Ipsos (2016-2017)
MTR 2018 Field Survey
Final Estimates for MTR 2018
Share represented by affiliates
Global 66% 71% 2 29%
Kenya 30-55% 35% 35% 65%
Tanzania 67-90% 72% 72% 18%
Ethiopia 40-65% 57% 57% 43%
Uganda 60-70% 49% 55% 45%
Nigeria 80-85% 67% 70% 30%
India 70-80% 75% 75% 25%
Myanmar 90% 100% 90% 10%
Table 2: - Variation in market share estimates of non-affiliate Pico-PV devices by source 1
About this Report
7
Country CategorizationSales data is provided in this report for all countries where at least three companies reported sales; in this reporting round, this amounts to 54 countries. The regional groupings in this report follow the World Bank country and lending groups3. For sub-regional groupings in Sub-Saharan Africa, the United Nations categorization of geographical sub-regions is used4.
Revenues and CurrencyOnly cash sales revenues are presented in this report; these figures do not include revenues generated through Pay-As-You-Go (PAYGO) business models, typically used on larger Pico-PV devices as well as SHS kits, which allow users to pay for their products via embedded consumer financing. All cash sales revenues provided in this report are denoted in US dollars ($).
Newly Installed CapacityThe newly installed capacity represents the amount in Mega Watts (MW) of solar panels deployed during this reporting round, and it has been computed using the reported panel size per product. This new lens has been introduced to provide additional insights on the off-grid solar market as well as being able to align with the larger PV industry.
1 Sources: (Bloomberg New Energy Finance, 2016); (Ipsos, 2016a); (Ipsos, 2016b); (Ipsos, 2017); (Lighting Global/Dalberg, Off-Grid Solar Market Trends Report 2018). Download the MTR report here: https://www.gogla.org/sites/default/files/resource_docs/2018_mtr_full_report_low-res_2018.01.15_final.pdf
2 Based on weighted average of final non-affiliate estimates from 16 countries.3 For more information, please visit: https://datahelpdesk.worldbank.org/knowledgebase/articles/906519-world-bank-country-and-lending-groups.4 For more information, please visit: http://unstats.un.org/unsd/methods/m49/m49regin.htm#africa.
Sales Data: What’s Coming UpThis report provides robust sales and cash revenues for the manufacturer affiliates participating in this data collection. We are currently undertaking work to address two key areas to improve and enhance the way we measure the performance of the off-grid solar sector:
PAYGO revenues: GOGLA is working with Altai Consulting to develop a sound methodology to reliably measure and state revenues generated through Pay-As-You-Go (PAYGO) business models. Companies and other key experts in the sector are being consulted, assessing how to best capture the existing PAYGO business models as well as the willingness to share the data needed to achieve this revision. Ideally, the PAYGO revenues reporting will be incorporated in the next round of data collection for the first half of 2018, enabling it to be included in the public report expected for the end of October 2018.
Distributors: Sales and cash revenues data gathered from affiliates classified as distributors of other companies’ branded products are not currently included in the aggregate data presented in this report, in order to avoid double-counting sales. Their data is however used to report back to these companies how they perform compared with overall reported sales, while also serving as additional resource for quality control on reported sales data from manufacturers. We aim to better understand how we can make use of their reported sales in future reporting rounds, to provide more insights in sales results of distributors and have a broader picture of the performance of the off-grid solar sector overall.
About this Report

8
Product CategoriesThis report only covers Pico-PV products and Solar Home System (SHS) kits, meaning that products that are sold as components (e.g. individual panels or batteries) or as top-up products (e.g. TVs, fans or radios that are sold as single appliances) are not included in the numbers reported here.
Data has been grouped into product categories to segment sales in a way that provides the most value and information to the market. From a market perspective, the most meaningful segmentation is based on functionality and capacity. Pico-PV product categories (for products with less than 11 Wp solar module capacity) are determined by the services that a product provides. For ease of reference, each of these
categories is represented by an indicative wattage range of PV module that is typical for most products providing the respective services. Panel wattage (in watt-peak) was used to categorize SHS kits with solar module capacities of 11 Wp and above. The definitions of these categories are presented in the table below.
The level of energy access enabled through use of these Pico-PV products and solar home system kits is indicated below using the terminology of the multi-tier framework for measuring energy access. This was developed by the World Bank’s Energy Sector Management Assistance Program (ESMAP)5 under the Sustainable Energy for All initiative.
Overall category
Solar module capacity , Watt Peak (Wp)
Categorization by services provided by product
Corresponding level of MTF energy access enabled by use of product
Pico-PV<10.999Wp
0 – 1.499 Wp (indicative) Single Light only Enables partial Tier 1 Electricity Access to a person / household
1.5 – 2.999 Wp(indicative)
Single Light & Mobile Charging Enables full Tier 1 Electricity Access to at least one person and contribute to a household
3 – 10.999 Wp(indicative)
Multiple Light & Mobile Charging Enables full Tier 1 Electricity Access to at least one person, up to a household
SHS >11Wp
11 – 20.999 Wp SHS, Entry Level (3-4 lights, phone charging, powering radio, fan etc)
Enables full Tier 1 Electricity Access to a household
21 – 49.999 Wp SHS, Basic capacity (as above plus power for TV, additional lights, appliances & extended capacity)
Enables full Tier 2 Electricity Access to a household when coupled with high-efficiency appliances
50 – 99.999 Wp SHS, Medium capacity (as above but with extended capacities)
Enables full Tier 2 Electricity Access to a household even using conventional appliances
100Wp + SHS, Higher capacity (as above but with extended capacities)
NOTE
Cells highlighted in light blue indicate the means of determining the product category: products with solar module capacity of less than 11 Wp are categorized based on services provided, while products with capacity of 11 Wp and over are categorized based on wattage of the solar module provided.
Table 3: Product Categories
5 For more information, please visit: https://www.esmap.org/node/55526
About this Report

9
© Julia Gunther
About this Report

10
72.3 million people currently living in households using an improved source of energy (i.e. solar)
39.1 million people currently with Tier 1 energy access, based on the Sustainable Energy for All Global Tracking Framework6
3.89 millionPico-PV products sold globally in H2 2017 of which 2.97 million are lanterns up to 3Wp and the remaining 920,000 are multi-light systems of 3-10.999 Wp
255,000SHS sold globally in H2 2017 (solar kits of 11+ Wp)
NOTE For more details on the impact created by the products sold, please refer to the Impact Metrics section of this report at page 44.
6 The level of energy access enabled through use of these pico-PV products and solar home system kits is indicated below using the terminology of the multi-tier framework for measuring energy access. This was developed by the World Bank’s Energy Sector Management Assistance Program (ESMAP) under the Sustainable Energy for All initiative. For more information, please visit: https://www.esmap.org/node/55526
Report Highlights
4.14 millionproducts sold globally in H2 2017
34.86 millioncumulative product sales since July 2010
$115.09 million cash sales revenues in H2 2017
22.13 MW newly installed capacity globally in H2 2017
2.1 million people currently with Tier 2 energy access, based on the Sustainable Energy for All Global Tracking Framework
What data does this report cover? This report only covers aggregate data provided by affiliates, which includes GOGLA members and companies that sell Lighting Global quality-verified products. Moreover, data is currently collected only on Pico-PV products and Solar Home System (SHS) kits; this means that products that are sold as components (e.g. individual panels or batteries) or as top-up products (e.g. TVs, fans or radios that are sold as single appliances) are not included in the numbers reported here.
What’s new: The Newly Installed Capacity In this reporting round, a new lens through which to view the sales data has been introduced: newly installed capacity. This represents the amount of solar panels - counted in Mega Watts (MW) - deployed during the reporting round. This allows for an overview of the average size of systems sold in a region or country, and therefore allows comparisons. Check out the “Detailed Sales Data” section of this report on page 22 for examples.
Report Highlights
11
• Policy change affecting duties, taxes, and the regulation of the off-grid sector;
• Action by development finance institutions, donor agencies and government market interventions;
• Technology development;• Availability of finance, in particular working capital
and local currency financing;• Macro-economic factors, including general
economic conditions, currency fluctuations, and other factors affecting the purchasing power of customers;
• Seasonal trends and other environmental factors;• Competitive dynamics, especially in relation to
competition from generic, counterfeit and look-a-like products.
In the latest reporting rounds, the off-grid sector has been influenced by:
Commodification of the market for Pico-PV products: generic, copycat and counterfeit products sold by non-affiliates companies have been causing intensified price competition for several years, especially for the single light Pico-PV categories. In the early days, affiliates’ products represented cutting edge design and quality; yet as the industry matures, that design advantage has diminished. The quality of non-affiliates’ products remains unknown. The sales for non-affiliate companies are not captured in this report and they have been estimated by Dalberg Advisors in the Off-Grid Solar Market Trends Report 2018 at 70% globally; however, this proportion is likely to vary substantially from country to country.
Increased government and development finance institution engagement: Off-grid solar continues to gain increased interest from governments and development finance institutions as a way to rapidly electrify households. This interest can translate into growth where donor activity and results-based financing have helped to propel substantial growth. However, government activity can also be harmful when it results in uncertainty for existing market players and impedes new market entrants.
Taxation systems: Tax exoneration for VAT and duties for solar products is crucial for import companies, and inconsistent interpretation by tax officials at the ports of entry represents a challenge. In India, the implementation of the new indirect taxation system – Goods and Services Tax (GST) from July 2017 may have affected the growth of the sector recovering from the demonetization.
Drought: The continued drought in East Africa had varying levels of impact across the region; in some areas, the situation did show signs of improvement. However, major food security emergencies were still occurring in many areas, particularly in the Horn of Africa. Overall, the drought continues to impact the livelihoods and purchasing power of at least some rural customer segments.
Currency devaluation: Local currency devaluation strongly influences the consumer purchasing power, and in this reporting period it has affected key national markets like Ethiopia and Nigeria. Moreover, exchange rate fluctuations represent a challenge for companies themselves hindering their capacity to plan ahead of time and price products appropriately. The resiliency of the Nigerian market is shown by the stable sales volumes despite these challenges, but the growth is slower than it would have been without the currency crisis.
Demonetization: The demonetization that came into effect in India in November 2016 seems to have ceased its negative impact on the sales volumes reported by affiliates between July and December 2017, with both the cash and the microfinance institutions channels picking up and reaching again the figures reported in the second half of 2016.
Market Dynamics
The reported sales volumes and cash sales revenues presented in this report are influenced by a range of market drivers, including:
Report Highlights

© Off Grid Electric


14
Global Market Insights
World: 4.14 million products sold $115.09 million cash sales revenues22.13 MW newly installed capacity
Historical Insights The following graphs compare the current sales count with previous counts, allowing us to reflect on the evolution of the market. The global volume of products sold in the second half of 2017 has increased by almost 20% compared to the first half of the same year (3.52 million units) and by 10% compared to the same period of 2016 (3.77 million units). Meanwhile, aggregate reported revenues generated through cash sales increased by 20% compared to the first half of the same year, from approximately $95 million to $115 million, a close match with the $114 million generated in the second half of 2016. However, it is important to remember that these revenues figures exclude the products sold via PAYGO business models; therefore,
the total revenues generated by the affiliates are significantly understated in this report. The newly installed capacity of off-grid solar products has been steadily increasing each period, recording in the second half of 2017 a 19% increase compared to the first half of the same year. This reporting round allows us to compare the full year 2017 with the previous one. This year-on-year comparison is less prone to the fluctuations of the market caused by several seasonal macro-economic factors affecting the purchasing power of customers and consequently the sales volumes. The lower sales volumes in 2017 compared to 2016 are mainly due to localized shocks in several key markets such as the demonetization.
In the second half of 2017 (July-December 2017), 4.14 million products have been sold worldwide, installing around 22 MW of solar panels and generating cash revenues of approximately $115 million. This latest figure does not include revenues from the kits delivered through PAYGO business models, often used on products of 3+ Wp and predominantly applied for products in the higher categories, which allow users to pay for their product via embedded consumer financing.
Global Market Insights 2016 (full year) 2017 (full year)
Products sold (units) * incl. PAYGO unit sales 8.069.510 7.659.276
Cash Sales Revenues (US$) ** excl. PAYGO revenues $ 252.888.741 $ 210.666.798
Newly Installed Capacity (MW) * incl. PAYGO unit sales 34.03 40.68
Table 4 - Yearly Comparison Global Sales Volumes and Cash Sales Revenues
When looking at cumulative data since sales reporting began in July 2010, 34.86 million lighting products have been sold by affiliates since H2 2010, when Lighting Global began collecting data.
Report Highlights

15
Figure 1 - Volume of Products Sold in Millions (Historical)
0.120.12 0.160.160.350.35 0.460.46
0.970.97
2.162.16 2.212.21 2.362.36
3.333.332.922.92
4.094.094.304.30
3.773.773.523.52
4.144.14
H2 2010 H1 2011 H2 2011 H1 2012 H2 2012 H1 2013 H2 2013 H1 2014 H2 2014 H1 2015 H2 2015 H1 2016 H2 2016 H1 2017 H2 20170
0.5
1
1.5
2
2.5
3
3.5
4
4.5
5
Report Highlights
NOTE1. The data presented in this chart has been compiled from various sources: The data from H2 2010 to H1 2014 originates from Lighting Global’s own data
collection, while the data from H2 2014 onwards comes from the joint Lighting Global / GOGLA / Berenschot data collection process. The methodology and the questions used have evolved over time and the number of respondents has changed with each round of data collection. Therefore, the data presented above does not constitute the basis for an in-depth statistically correct analysis. However, it does indicate general market trends and reflects the evolution of the market as it encompasses data from most of the industry leaders. As the data collection process is improved with every round and with companies submitting their data on a consistent basis, we will be able to paint an ever more accurate picture of the market.
2. This report only includes data on products sold by GOGLA members or Lighting Global associates and does not include non-branded generic products. Based on previous analysis by Dalberg Advisors for the Off-Grid Solar Market Trends Report 2018, we estimate that the data reported here represents about 30% of all sales of stand-alone off-grid solar products. This proportion is likely to vary substantially from country to country.

16
Report Highlights
Figure 2 – Newly Installed Capacity of Products sold in MW (Historical)
16.95MW16.95MW 17.09MW17.09MW18.56MW18.56MW
22.13MW22.13MW
H1 2016 H2 2016 H1 2017 H2 20170
2.5
5
7.5
10
12.5
15
17.5
20
22.5
25
NOTE1. This report only includes data on products sold by GOGLA members or Lighting Global associates and does not include non-branded generic products.
Based on previous analysis by Dalberg Advisors for the Off-Grid Solar Market Trends Report 2018, we estimate that the data reported here represents about 30% of all sales of stand-alone off-grid solar products. This proportion is likely to vary substantially from country to country.
2. The installed capacity should be considered as newly installed capacity during the reporting period, computed using the reported panel size per product.

17
Report Highlights
Figure 3 - Cumulative Global Sales in Millions: Volume of Products Sold
0.120.12 0.280.28 0.630.63 1.091.09 2.062.064.224.22
6.436.438.798.79
12.1212.1215.0415.04
19.1319.13
23.4323.43
27.2027.2030.7230.72
34.8634.86
H2 2010 H1 2011 H2 2011 H1 2012 H2 2012 H1 2013 H2 2013 H1 2014 H2 2014 H1 2015 H2 2015 H1 2016 H2 2016 H1 2017 H2 20170
5
10
15
20
25
30
35
40
NOTE1. The data presented in this chart has been compiled from various sources: The data from H2 2010 to H1 2014 originates from Lighting Global’s own data
collection, while the data from H2 2014 onwards comes from the joint Lighting Global / GOGLA / Berenschot data collection process. The methodology and the questions used have evolved over time and the number of respondents has changed with each round of data collection. Therefore, the data presented above does not constitute the basis for an in-depth statistically correct analysis. However, it does indicate general market trends and reflects the evolution of the market as it encompasses data from most of the industry leaders. As the data collection process is improved with every round and with companies submitting their data on a consistent basis, we will be able to paint an ever more accurate picture of the market.
2. This report only includes data on products sold by GOGLA members or Lighting Global associates and does not include non-branded generic products. Based on previous analysis by Dalberg Advisors for the Off-Grid Solar Market Trends Report 2018, we estimate that the data reported here represents about 30% of all sales of stand-alone off-grid solar products. This proportion is likely to vary substantially from country to country.”

18
Report Highlights
Insights by Product Category
Pico-PVWhen looking at the sales by product category, the Pico-PV products represented 94% of the total volumes in the second half of 2017, accounting for 3.89 million units sold globally. In cash sales revenues, these products generated $102 million globally, representing almost 90% of the cash sales total. It is important to note that, while the vast majority of solar lantern sales are made on a cash basis, a significant number of multi-light systems of 3-10.999 Wp are sold via PAYGO business models and data on PAYGO revenues is not considered in this report. Thus, overall revenues for Pico-PV segment of 3-10.999 Wp are likely to be significantly higher than reported here in the cash revenues value.
Among the three Pico-PV categories, the top seller in the second half of 2017 remains the single light products with mobile charging (typically powered by a panel in the range of 1.5-3 Wp), which accounted for almost half of the total reported products sold worldwide (about 1.86 million). These products also generated the lion’s share of overall cash sales revenue at $68.96 million, 60% of the global total, and they also accounted for slightly more than 4 MW of off-grid installed capacity worldwide. The second best-performing category is the single light products without mobile charging (indicative wattage 0-1.5 Wp) with 1.10 million units sold worldwide, 25% of the total. However, they generated only 8% of the total reported cash sales revenues (just over $9.70 million) and only 2% of the total installed capacity (0.42 MW). This is due to the lower retail price and small panel size of such products. The third category which comprises the multi-light systems of 3-10.999 Wp has almost hit the bar of one million products sold in this reporting round (920,000), surpassing the 20% share of the total off-grid solar market, generating almost $24 million cash revenues and installing over 4.5 MW of solar panels across the globe.
When comparing these figures with the ones for the first half of 2017, one can observe a 97% increase of the sales volumes and cash revenues of the multi-light systems of 3-10.999 Wp from 470,000 to 920,000 products reported as sold, and a 20% increase in sales for the single light products with mobile charging (typically powered by a panel in the range of 1.5-3 Wp). On the other hand, the sales of the smallest product category of the single light products without mobile charging
(indicative wattage 0-1.5 Wp) have declined by 9% in the second half of 2017 compared to the first-half; this may be explained by the commodification of the market for these entry-level products causing intensified competition from generic, copycat and counterfeit products.
Solar Home Systems (SHS)As observed in previous reporting cycles, the number of products sold in the larger, higher-cost product categories is much lower than in the smaller product categories: the 11+Wp ranges constitute about 6% of the overall sales volumes (260,000 units sold globally), and almost 60% of the total installed capacity, given their large panel size. The revenues generated from these categories cannot be reliably stated, as the majority of products sold in these categories are sold via PAYGO business models and data on PAYGO revenues is not included in this report.
Among the four SHS categories, the top seller in the second half of 2017 remains the 50-100 Wp category hitting the bar of 100,000 units sold (3% of the global total) which alone installed 7MW of new solar capacity worldwide. The next categories in line are the 21-49 Wp and the 11-20 Wp with around 70,000 units each. The 100+ Wp still falls behind the group with 14,000 systems sold worldwide in the second half of 2017.
When comparing these figures with the ones for the first half of 2017, one can observe a 230% increase of the sales volumes of the SHS of 21-49 Wp from 21,000 to 71,000 units; this increase may be explained by the introduction of new products and increased number of players active in this specific category. The 50-100 Wp and the 11-20 Wp solar home systems both registered a 20% decrease in sales compared to the first half of 2017, while the 100+ Wp is stable in terms of sales volumes. It is worth noting that, as a result of the low overall volumes being sold, it is easy to see significant swings over time due to relatively small fluctuations in sales patterns, which are not reflecting larger market trends.

19
$115,092,868$115,092,868
$9,702,267$9,702,267
$68,964,636$68,964,636
$23,684,642$23,684,642
$2,352,385$2,352,385
$582,454$582,454
$9,185,482$9,185,482
$0$0
$0$0
Total
0-1.5 Wp
1.5-3 Wp
3-10 Wp
11-20 Wp
21-49 Wp
50-100 Wp
100+ Wp
Not specified
Figure 5 - Global Cash Sales Revenues by Product Category
Report Highlights
Figure 4 - Volume of Products Sold Globally by Product Category
4,143,3664,143,366
1,103,7961,103,796
1,862,0841,862,084
922,196922,196
65,87165,871
70,55470,554
104,655104,655
14,21014,210
00
Total
0-1.5 Wp
1.5-3 Wp
3-10 Wp
11-20 Wp
21-49 Wp
50-100 Wp
100+ Wp
Not specified
NOTE1. Data is not shown for categories for which insufficient or no data points were provided. 2. Products with solar module capacity of less than 11 Wp are categorized based on services provided, while products with capacity of 11 Wp and over are
categorized based on wattage of the solar module provided
NOTE1. Data is not shown for categories for which insufficient or no data points were provided. 2. Products with solar module capacity of less than 11 Wp are categorized based on services provided, while products with capacity of 11 Wp and over are
categorized based on wattage of the solar module provided. 3. Only cash sales revenues are presented – this excludes PAYGO revenues. 4. Dividing the presented sales revenues by the volume of products sold does not equate to the average product retail price.

20
Report Highlights
Figure 6 – Global Newly Installed Capacity of Products Sold in MW by Product Category
22.13MW22.13MW
0.42MW0.42MW
4.04MW4.04MW
4.74MW4.74MW
1.01MW1.01MW
2.50MW2.50MW
7.00MW7.00MW
2.41MW2.41MW
0.00MW0.00MW
Total
0-1.5 Wp
1.5-3 Wp
3-10 Wp
11-20 Wp
21-49 Wp
50-100 Wp
100+ Wp
Not specified
NOTE1. Data is not shown for categories for which insufficient or no data points were provided. 2. Products with solar module capacity of less than 11 Wp are categorized based on services provided, while products with capacity of 11 Wp and over are
categorized based on wattage of the solar module provided. 3. The installed capacity should be considered as newly installed capacity during the reporting period, computed using the reported panel size per product.

21
Report Highlights
© d.light design

22
Regional Market Insights
Reported sales for the second half of 2017 remain concentrated in two regions, Sub-Saharan Africa and South Asia, which account respectively for 1.92 million and 1.38 million units sold. The Middle East and North Africa region was the third largest regional market with 450,000 units reported as sold; these sales are mostly related to humanitarian emergency relief actions happening in the region, therefore probably not representing a growing commercial market for off-grid products. The combined sales of these three regions amount to 3.80 million products, around 90% of all global sales. As expected the concentration applies also to the cash revenues; most of them were generated in Sub-Saharan Africa ($40.86 million) and South Asia $43.24 million). Another $21.48 million of cash sales revenues come from the Middle East and North Africa region. Thanks to the newly installed capacity lens,
it is possible to grasp the difference in category of systems sold across these three geographical regions: for instance, Sub-Saharan Africa accounts for almost 17 MW, representing 75% of the global total, while South Asia and Middle East and North Africa fall behind with respectively 3 MW and 1 MW.
East Africa represents about 70% of total sales volumes and 60% of the cash sales revenues in Sub-Saharan Africa – with 1.33 million units sold and $25.19 million cash sales revenues reported. India represents 90% of sales volumes and 85% of cash sales revenues of the sales reported in South Asia, with 1.26 million units sold, and $36.38 million in cash sales revenues. Moreover, East Africa and India represent 30% each of the global sale volumes.
Which regions does this report cover? This report only covers aggregate data provided by affiliates, which includes GOGLA members and companies that sell Lighting Global quality-verified products. Data is currently collected only on Pico-PV products and Solar Home System (SHS) kits; data on a specific region, country or product category is only included in this section when it has satisfied the three-data point rule, meaning that at least three separate manufacturers have reported data for any single data point.
© Lagazel
Detailed Sales Data

23
Latin America & Caribbean 54,000 products sold$1.48 million cash sales revenues0.14 MW newly installed capacity
North America 37,000 products sold$670,000 cash sales revenues0.04 MW newly installed capacity
Europe and Central Asia 115,000 products sold$2.6 million cash sales revenues0.39 MW newly installed capacity
East Asia & Pacific 173,000 products sold$4.75 million cash sales revenues0.58 MW newly installed capacity
South Asia 1.38 million products sold$43.24 million cash sales revenues3.03 MW newly installed capacity
Middle East & North Africa 453,000 products sold$21.48 million cash sales revenues1.05 MW newly installed capacity
Sub-Saharan Africa 1.92 million products sold$40.86 million cash sales revenues16.91 MW newly installed capacity
East Africa: 1.33 million products sold $25.19 million cash sales revenues 11.85 MW newly installed capacityWest Africa: 291,000 products sold $4.66 million cash sales revenues 4.30 MW newly installed capacityCentral Africa: 250,000 products sold$7.59 million cash sales revenues0.61 MW newly installed capacity
Detailed Sales Data

24
Historical Insights
Sub-Saharan Africa Overall compared to the first half of 2017, Sub-Saharan Africa has registered a 9% increase in sales volume while the reported cash sales revenues remained stable. The larger and more mature East African market reported a small increase in sales volumes of 9%, while the smaller and less mature ones had two different trajectories: the West African market saw a reported decrease of 33% in sales volumes, while Central Africa registered a 210% increase in sales volumes from 80,000 to 250,000 products sold between the first and the second half of 2017. It is important to note that West and Central Africa remain largely untapped markets still subject to high volatility in sales volumes due to relatively small fluctuations in sales patterns, which are not reflecting larger market trends.
South Asia Overall, compared to the first half of 2017, reported sales volumes increased by 19%, and cash sales revenues by 43%, in South Asia. Very little of the Asian market is comprised of PAYGO sales and as such, cash sales show a more complete picture of the revenues story for the region. India accounts for most of the reported sales in this market.
Other MarketsThe Middle East and North Africa market registered a 55% increase in sales volumes and a 6% increase in cash revenues compared to the first half of 2017. Meanwhile, the sales volumes increased by 43% in the East Asia and Pacific market, generating a 120% increase in the reported cash sales revenues in the region.
Figure 7 - Regional Sales: Volume of Products Sold, in Millions (Historical)
Sub-Saharan Africa India Total
H1 2014 H2 2014 H1 2015 H2 2015 H1 2016 H2 2016 H1 2017 H2 20170
1
2
3
4
5
Detailed Sales Data
NOTE1. The data presented in this chart has been compiled from various sources: The data for H1 2014 originates from Lighting Global’s own data collection,
while the data from H2 2014 onwards comes from the joint Lighting Global / GOGLA / Berenschot data collection process. The methodology and the questions used have evolved over time and the number of respondents has changed with each round of data collection. Therefore, the data presented above does not constitute the basis for an in-depth statistically correct analysis. However, it does indicate general market trends and reflects the evolution of the market as it encompasses data from most of the industry leaders. As the data collection process is improved with every round and with companies submitting their data on a consistent basis, we will be able to paint an ever more accurate picture of the market.
2. This report only includes data on products sold by GOGLA members or Lighting Global associates and does not include non-branded generic products. Based on previous analysis by Dalberg Advisors for the Off-Grid Solar Market Trends Report 2018, we estimate that the data reported here represents about 30% of all sales of stand-alone off-grid solar products. This proportion is likely to vary substantially from country to country.
For a more in-depth analysis into the countries causing these regional trends, please refer to the “Market Insights by Country” section at page 34.

25
Table 5 -Regional Sales: Volume of Products Sold and Cash Sales Revenues (Historical)
2016 H1 2016 H2 2017 H1 2017 H2
Region Total Market Total Market Total Market Total Market
World 4,298,655 3,770,855 3,515,910 4,143,366
Sub-Saharan Africa 1,956,810 1,870,821 1,768,196 1,926,827
West Africa 386,458 330,561 431,829 291,120
East Africa 1,388,531 1,487,758 1,218,853 1,327,256
Central Africa 73,191 47,688 80,390 249,665
Southern Africa 8,108 4,094 37,119 23,291
South Asia 1,758,239 1,413,805 1,161,648 1,384,607
East Asia & Pacific 112,268 96,456 121,175 173,331
Latin America & Caribbean 27,643 50,372 56,460 54,048
Middle East & North Africa 337,791 240,738 293,044 453,022
Europe & Central Asia - 84,622 105,114 114,973
North America - 14,041 10,273 36,558
2016 H1 2016 H2 2017 H1 2017 H2
Region Total Market Total Market Total Market Total Market
World $138,962,441 $113,926,299 $95,573,929 $115,092,868
Sub-Saharan Africa $55,990,030 $53,256,791 $40,673,040 $40,859,911
West Africa $8,225,194 $8,055,171 $9,811,875 $4,664,086
East Africa $43,271,927 $44,066,849 $29,135,259 $25,193,188
Central Africa $903,548 $771,018 $1,007,080 $7,586,476
Southern Africa $475,065 $314,504 $718,675 $1,363,396
South Asia $48,202,809 $35,517,189 $30,198,359 $43,235,736
East Asia & Pacific $9,501,250 $4,332,820 $2,127,894 $4,747,544
Latin America & Caribbean $1,339,653 $1,499,418 $1,393,944 $1,475,466
Middle East & North Africa $20,328,584 $16,811,235 $19,292,976 $21,484,073
Europe & Central Asia - $2,252,312 $1,556,993 $2,619,449
North America - $256,532 $330,720 $670,685
Detailed Sales Data
NOTE1. Data is not shown for categories for which insufficient or no data points were provided.2. This report only includes data on products sold by GOGLA members or Lighting Global associates and does not include non-branded generic products.
Based on previous analysis by Dalberg Advisors for the Off-Grid Solar Market Trends Report 2018, we estimate that the data reported here represents about 30% of all sales of stand-alone off-grid solar products. This proportion is likely to vary substantially from country to country.
26
Insights by Product Category
Pico-PVWhen looking at the sales by product category, the Pico-PV products still represented almost 90% of the total volumes in Sub-Saharan Africa and 98% in South Asia in the second half of 2017, accounting respectively for 1.71 million and 1.36 million units sold. In cash sales revenues, these products generated $32 million in Sub-Saharan Africa and $40 million in South Asia. It is important to note that, while the vast majority of solar lantern sales are made on a cash basis, a significant number of multi-light systems of 3-10.999 Wp are sold via PAYGO business models and data on PAYGO revenues is not considered in this report. Thus, overall revenues for Pico-PV segment of 3-10.999 Wp are likely to be significantly higher than captured in the cash revenues value.
In both regions, the top seller in the second half of 2017 remains the single light products with mobile charging (typically powered by a panel in the range of 1.5-3 Wp) with 760,000 units in Sub-Saharan Africa and 81,000 in South Asia. In this category, 240,000 products were reported sold in the Middle East and North Africa region. The second best-performing category is the single light product without mobile charging (indicative wattage 0-1.5 Wp) with 490,000 units in Sub-Saharan Africa and 450,000 in South Asia. The third category is comprised of the multi-light systems of 3-10.999 Wp shows a split between the two regions with 450,000 units sold in Sub-Saharan Africa and only 99,000 in South Asia. In this category, 130,000 products were reported sold in the East Asia and Pacific region.
When comparing these figures with the ones for the first half of 2017, one can observe an overall increase across all regions of the multi-light systems of 3-10.999 Wp, with a notable 620% increase of the sales volumes of the multi-light systems of 3-10.999 Wp in South Asia (largely dominated by India) from 14,000 to 100,000 products
sold; this may be explained by the microfinance institution and cash sales picking up after the large hit of the demonetization in India, as they are the most widely spread distribution channels in that product category on the Indian sub-continent, due to the lack of PAYGO sales prevalence in the region. It is worth noting that, as a result of the low overall volumes being sold, it is easy to see significant swings in this last category over time due to relatively small fluctuations in sales patterns, which are not reflecting larger market trends.
Solar Home Systems (SHS)The number of products sold in the larger, higher-cost product categories is much lower than in the smaller product categories; moreover, here only Sub-Saharan Africa is starting to reach significant volumes with 210,000 products sold, 74% of which have been sold across East Africa. The revenues generated from these categories cannot be reliably stated, as the majority of products sold in these categories are sold via PAYGO business models and data on PAYGO revenues is not included in this report.
When comparing these figures with the ones for the first half of 2017, one can observe a 390% increase of the sales volumes of the SHS of 21-49 Wp from 12,000 to 58,000 units in Sub-Saharan Africa, 51,000 across East Africa and 7,000 in West African markets; this increase may be explained by the introduction of new products and an increased number of players active in this specific category. The 50-100 Wp and the 11-20 Wp solar home systems both registered a 15% decrease in Sub-Saharan Africa in sales compared to the first half of 2017, while the 100+ Wp shows a 25% increase. These larger systems still have small overall volumes being sold, therefore significant swings may occur over time due to relatively small fluctuations in sales patterns, which are not reflecting larger market trends.
Detailed Sales Data
27
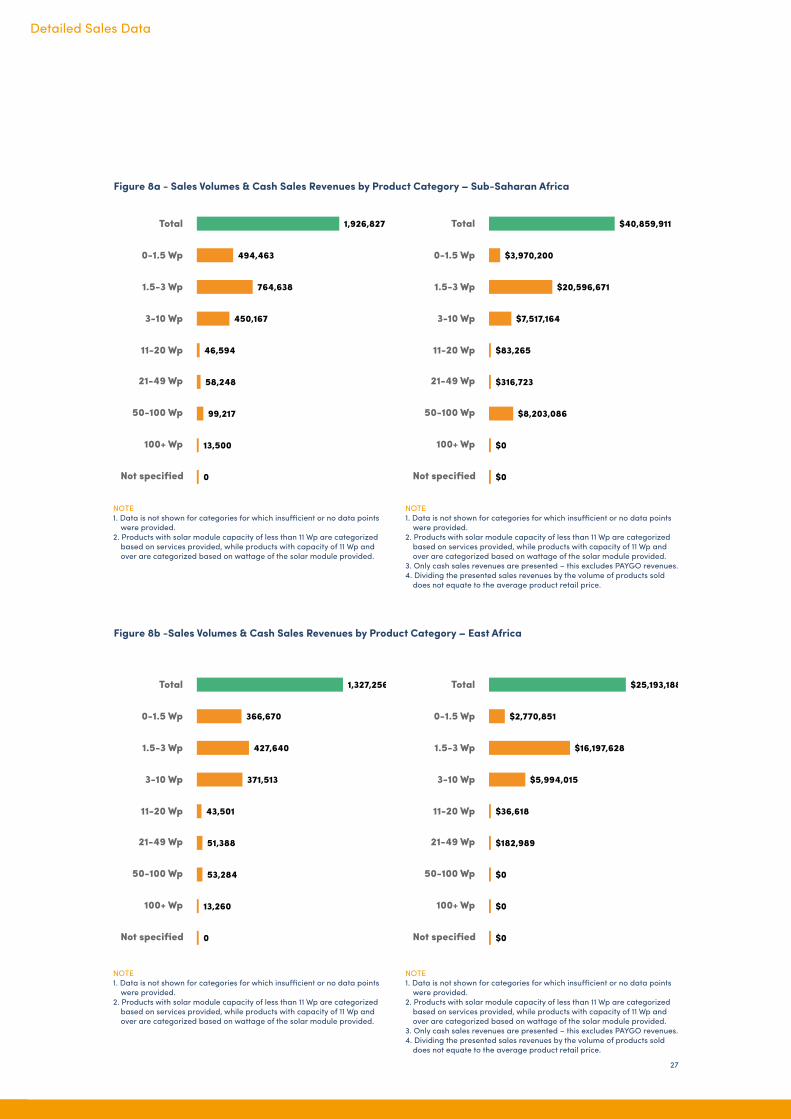
Figure 8a - Sales Volumes & Cash Sales Revenues by Product Category – Sub-Saharan Africa
1,926,8271,926,827
494,463494,463
764,638764,638
450,167450,167
46,59446,594
58,24858,248
99,21799,217
13,50013,500
00
Total
0-1.5 Wp
1.5-3 Wp
3-10 Wp
11-20 Wp
21-49 Wp
50-100 Wp
100+ Wp
Not specified
Figure 8b -Sales Volumes & Cash Sales Revenues by Product Category – East Africa
Detailed Sales Data
$40,859,911$40,859,911
$3,970,200$3,970,200
$20,596,671$20,596,671
$7,517,164$7,517,164
$83,265$83,265
$316,723$316,723
$8,203,086$8,203,086
$0$0
$0$0
Total
0-1.5 Wp
1.5-3 Wp
3-10 Wp
11-20 Wp
21-49 Wp
50-100 Wp
100+ Wp
Not specified
NOTE 1. Data is not shown for categories for which insufficient or no data points
were provided. 2. Products with solar module capacity of less than 11 Wp are categorized
based on services provided, while products with capacity of 11 Wp and over are categorized based on wattage of the solar module provided.
3. Only cash sales revenues are presented – this excludes PAYGO revenues.4. Dividing the presented sales revenues by the volume of products sold
does not equate to the average product retail price.
1,327,2561,327,256
366,670366,670
427,640427,640
371,513371,513
43,50143,501
51,38851,388
53,28453,284
13,26013,260
00
Total
0-1.5 Wp
1.5-3 Wp
3-10 Wp
11-20 Wp
21-49 Wp
50-100 Wp
100+ Wp
Not specified
$25,193,188$25,193,188
$2,770,851$2,770,851
$16,197,628$16,197,628
$5,994,015$5,994,015
$36,618$36,618
$182,989$182,989
$0$0
$0$0
$0$0
Total
0-1.5 Wp
1.5-3 Wp
3-10 Wp
11-20 Wp
21-49 Wp
50-100 Wp
100+ Wp
Not specified
NOTE 1. Data is not shown for categories for which insufficient or no data points
were provided. 2. Products with solar module capacity of less than 11 Wp are categorized
based on services provided, while products with capacity of 11 Wp and over are categorized based on wattage of the solar module provided.
3. Only cash sales revenues are presented – this excludes PAYGO revenues.4. Dividing the presented sales revenues by the volume of products sold
does not equate to the average product retail price.

28
Figure 8c - Sales Volumes & Cash Sales Revenues by Product Category – West Africa
Detailed Sales Data
291,120291,120
102,992102,992
67,95367,953
67,29067,290
3,0203,020
6,6346,634
43,11143,111
00
00
Total
0-1.5 Wp
1.5-3 Wp
3-10 Wp
11-20 Wp
21-49 Wp
50-100 Wp
100+ Wp
Not specified
$4,664,086$4,664,086
$957,836$957,836
$1,899,350$1,899,350
$1,494,687$1,494,687
$42,206$42,206
$0$0
$0$0
$0$0
$0$0
Total
0-1.5 Wp
1.5-3 Wp
3-10 Wp
11-20 Wp
21-49 Wp
50-100 Wp
100+ Wp
Not specified
NOTE 1. Data is not shown for categories for which insufficient or no data points
were provided. 2. Products with solar module capacity of less than 11 Wp are categorized
based on services provided, while products with capacity of 11 Wp and over are categorized based on wattage of the solar module provided.
3. Only cash sales revenues are presented – this excludes PAYGO revenues.4. Dividing the presented sales revenues by the volume of products sold
does not equate to the average product retail price.
249,665249,665
11,74311,743
230,467230,467
4,6314,631
00
186186
2,5042,504
00
00
Total
0-1.5 Wp
1.5-3 Wp
3-10 Wp
11-20 Wp
21-49 Wp
50-100 Wp
100+ Wp
Not specified
$7,586,476$7,586,476
$95,864$95,864
$206,362$206,362
$74,169$74,169
$0$0
$0$0
$0$0
$0$0
$0$0
Total
0-1.5 Wp
1.5-3 Wp
3-10 Wp
11-20 Wp
21-49 Wp
50-100 Wp
100+ Wp
Not specified
NOTE 1. Data is not shown for categories for which insufficient or no data points
were provided. 2. Products with solar module capacity of less than 11 Wp are categorized
based on services provided, while products with capacity of 11 Wp and over are categorized based on wattage of the solar module provided.
3. Only cash sales revenues are presented – this excludes PAYGO revenues.4. Dividing the presented sales revenues by the volume of products sold
does not equate to the average product retail price.
Figure 8d -Sales Volumes & Cash Sales Revenues by Product Category – Central Africa

29
Figure 8e -Sales Volumes & Cash Sales Revenues by Product Category – Southern Africa
Detailed Sales Data
23,29123,291
00
00
7,7337,733
00
00
318318
00
00
Total
0-1.5 Wp
1.5-3 Wp
3-10 Wp
11-20 Wp
21-49 Wp
50-100 Wp
100+ Wp
Not specified
$1,363,396$1,363,396
$0$0
$0$0
$134,291$134,291
$0$0
$0$0
$985,557$985,557
$0$0
$0$0
Total
0-1.5 Wp
1.5-3 Wp
3-10 Wp
11-20 Wp
21-49 Wp
50-100 Wp
100+ Wp
Not specified
NOTE 1. Data is not shown for categories for which insufficient or no data points
were provided. 2. Products with solar module capacity of less than 11 Wp are categorized
based on services provided, while products with capacity of 11 Wp and over are categorized based on wattage of the solar module provided.
3. Only cash sales revenues are presented – this excludes PAYGO revenues.4. Dividing the presented sales revenues by the volume of products sold
does not equate to the average product retail price.
1,384,6071,384,607
450,657450,657
810,281810,281
99,74599,745
17,35717,357
00
5,4325,432
00
00
Total
0-1.5 Wp
1.5-3 Wp
3-10 Wp
11-20 Wp
21-49 Wp
50-100 Wp
100+ Wp
Not specified
$43,235,736$43,235,736
$3,888,787$3,888,787
$31,596,797$31,596,797
$4,253,971$4,253,971
$2,075,511$2,075,511
$0$0
$0$0
$0$0
$0$0
Total
0-1.5 Wp
1.5-3 Wp
3-10 Wp
11-20 Wp
21-49 Wp
50-100 Wp
100+ Wp
Not specified
NOTE 1. Data is not shown for categories for which insufficient or no data points
were provided. 2. Products with solar module capacity of less than 11 Wp are categorized
based on services provided, while products with capacity of 11 Wp and over are categorized based on wattage of the solar module provided.
3. Only cash sales revenues are presented – this excludes PAYGO revenues.4. Dividing the presented sales revenues by the volume of products sold
does not equate to the average product retail price.
Figure 9 - Sales Volumes & Cash Sales Revenues by Product Category – South Asia

30
Figure 10 - Sales Volumes & Cash Sales Revenues by Product Category – East Asia & Pacific
Figure 11 - Sales Volumes & Cash Sales Revenues by Product Category – Middle East & North Africa
Detailed Sales Data
173,331173,331
25,10825,108
17,88517,885
126,357126,357
1,1721,172
2,8092,809
00
00
00
Total
0-1.5 Wp
1.5-3 Wp
3-10 Wp
11-20 Wp
21-49 Wp
50-100 Wp
100+ Wp
Not specified
$4,747,544$4,747,544
$226,288$226,288
$418,709$418,709
$3,967,571$3,967,571
$113,561$113,561
$0$0
$0$0
$0$0
$0$0
Total
0-1.5 Wp
1.5-3 Wp
3-10 Wp
11-20 Wp
21-49 Wp
50-100 Wp
100+ Wp
Not specified
NOTE 1. Data is not shown for categories for which insufficient or no data points
were provided. 2. Products with solar module capacity of less than 11 Wp are categorized
based on services provided, while products with capacity of 11 Wp and over are categorized based on wattage of the solar module provided.
3. Only cash sales revenues are presented – this excludes PAYGO revenues.4. Dividing the presented sales revenues by the volume of products sold
does not equate to the average product retail price.
453,022453,022
11,87811,878
240,786240,786
00
00
00
00
00
00
Total
0-1.5 Wp
1.5-3 Wp
3-10 Wp
11-20 Wp
21-49 Wp
50-100 Wp
100+ Wp
Not specified
$21,484,073$21,484,073
$140,345$140,345
$15,268,872$15,268,872
$0$0
$0$0
$0$0
$0$0
$0$0
$0$0
Total
0-1.5 Wp
1.5-3 Wp
3-10 Wp
11-20 Wp
21-49 Wp
50-100 Wp
100+ Wp
Not specified
NOTE 1. Data is not shown for categories for which insufficient or no data points
were provided. 2. Products with solar module capacity of less than 11 Wp are categorized
based on services provided, while products with capacity of 11 Wp and over are categorized based on wattage of the solar module provided.
3. Only cash sales revenues are presented – this excludes PAYGO revenues.4. Dividing the presented sales revenues by the volume of products sold
does not equate to the average product retail price.

31
Detailed Sales Data
Figure 12 - Sales Volumes & Cash Sales Revenues by Product Category – Latin America
Figure 13 - Sales Volumes & Cash Sales Revenues by Product Category – North America
54,04854,048
19,94619,946
12,93412,934
20,28020,280
00
862862
00
00
00
Total
0-1.5 Wp
1.5-3 Wp
3-10 Wp
11-20 Wp
21-49 Wp
50-100 Wp
100+ Wp
Not specified
$1,475,466$1,475,466
$207,696$207,696
$417,115$417,115
$617,772$617,772
$0$0
$0$0
$0$0
$0$0
$0$0
Total
0-1.5 Wp
1.5-3 Wp
3-10 Wp
11-20 Wp
21-49 Wp
50-100 Wp
100+ Wp
Not specified
NOTE 1. Data is not shown for categories for which insufficient or no data points
were provided. 2. Products with solar module capacity of less than 11 Wp are categorized
based on services provided, while products with capacity of 11 Wp and over are categorized based on wattage of the solar module provided.
3. Only cash sales revenues are presented – this excludes PAYGO revenues.4. Dividing the presented sales revenues by the volume of products sold
does not equate to the average product retail price.
36,55836,558
28,16428,164
6,1776,177
1,5241,524
00
00
00
00
00
Total
0-1.5 Wp
1.5-3 Wp
3-10 Wp
11-20 Wp
21-49 Wp
50-100 Wp
100+ Wp
Not specified
$670,685$670,685
$267,608$267,608
$211,296$211,296
$113,277$113,277
$0$0
$0$0
$0$0
$0$0
$0$0
Total
0-1.5 Wp
1.5-3 Wp
3-10 Wp
11-20 Wp
21-49 Wp
50-100 Wp
100+ Wp
Not specified
NOTE 1. Data is not shown for categories for which insufficient or no data points
were provided. 2. Products with solar module capacity of less than 11 Wp are categorized
based on services provided, while products with capacity of 11 Wp and over are categorized based on wattage of the solar module provided.
3. Only cash sales revenues are presented – this excludes PAYGO revenues.4. Dividing the presented sales revenues by the volume of products sold
does not equate to the average product retail price.

32
Figure 14 - Sales Volumes & Cash Sales Revenues by Product Category – Europe & Central Asia
Detailed Sales Data
114,973114,973
73,58073,580
9,3839,383
23,83623,836
00
00
00
00
00
Total
0-1.5 Wp
1.5-3 Wp
3-10 Wp
11-20 Wp
21-49 Wp
50-100 Wp
100+ Wp
Not specified
$2,619,449$2,619,449
$1,001,340$1,001,340
$455,174$455,174
$1,157,936$1,157,936
$0$0
$0$0
$0$0
$0$0
$0$0
Total
0-1.5 Wp
1.5-3 Wp
3-10 Wp
11-20 Wp
21-49 Wp
50-100 Wp
100+ Wp
Not specified
NOTE 1. Data is not shown for categories for which insufficient or no data points
were provided. 2. Products with solar module capacity of less than 11 Wp are categorized
based on services provided, while products with capacity of 11 Wp and over are categorized based on wattage of the solar module provided.
3. Only cash sales revenues are presented – this excludes PAYGO revenues.4. Dividing the presented sales revenues by the volume of products sold
does not equate to the average product retail price.

33© ovSolar
Detailed Sales Data

34
New entries in the top 10 markets list are Democratic Republic of Congo (DRC) and Malawi, where sales reached respectively 250,000 and 130,000 units sold; this may be due to the increased number of players active in the countries. Single light Pico-PV systems represents the lion’s share in both DRC and Malawi, as their small newly installed capacity suggests (less than 0.5 MW each).
In the second half of 2017, companies reported 220,000 units sold in Uganda and 160,000 in Ethiopia, positioning the two countries on the 4th and 5th position in the chart in terms of sales volumes. Also, in this case, a substantial difference can be identified in the newly installed capacity, as Uganda represents 11% of the solar capacity installed globally with its 2.41 MW while Ethiopia falls behind with only 0.46 MW installed in this reporting round.
Bangladesh can be found at the 7th position in the Top 10 countries by volume of products sold with 120,000 units and a little over $6 million cash sales revenues generated; the low installed capacity of such sales (0.40 MW) suggests that these sales may be largely due to
donation of single light Pico-PV systems for Rohingya refugee camps due to the latest emigration wave started in August 2017.
In the second half of 2017, Nigeria continued to see solid sales figures with 110,000 units sold, notably contributing 3.11 MW of newly installed solar capacity, the second largest after Kenya. The low revenues reported ($1.2 million) are primarily due to the unavailability of revenues generated in the larger categories sold via PAYGO business models.
Tanzania, after the drops registered in the previous rounds, hit again the bar of 100 million units sold but still far from the levels registered in the second half of 2016 (190,000 products); the sales contributed to almost 13% of the global newly installed capacity with 2.80 MW.Indonesia reached the last spot in the top 10 list, with 100 million products generating a little over $3 million cash revenues in the second half of 2017; the small newly installed capacity (0.30 MW) suggests that also in Indonesia the single light Pico-PV systems represent the majority of the sales volumes.
Market Insights by Country
When looking at the top 10 countries by volume of products sold in the second half of 2017, India and Kenya continue to be by far the two largest markets. Together they account for around 40% of both total products sold globally (1.76 million units) and cash sales revenues generated worldwide ($42,65 million) in the second half of 2017. However, a substantial difference can be identified between these two country markets: Kenya has newly installed almost twice as much solar capacity as India (4.26 MW against 2.45 MW) with less than half of the sales volumes; this is because 90% of the products sold in India fall in the single-light products of Pico-PV segment with indicative wattage 0-2.999 Wp.
Table 6 - Top 10 Country Markets by Volume of Products Sold
Country Volume of Products Sold
Global Volume Share
Cash Sales Revenues of Products Sold
Global Revenue Share
Newly Installed Capacity (MW)
Global Newly Installed Capacity Share
India 1,255,174 30.29% $36,381,387 31.61% 2.45MW 11.06%
Kenya 502,099 12.12% $6,268,277 5.45% 4.26MW 19.27%
Congo, Dem. Rep. 242,271 5.85% $7,427,996 6.45% 0.56MW 2.54%
Uganda 224,074 5.41% $4,923,699 4.28% 2.41MW 10.89%
Ethiopia 158,634 3.83% $6,230,026 5.41% 0.46MW 2.08%
Malawi 125,640 3.03% $4,109,099 3.57% 0.3MW 1.37%
Bangladesh 119,050 2.87% $6,313,809 5.49% 0.4MW 1.80%
Nigeria 107,576 2.60% $1,225,914 1.07% 3.11MW 14.04%
Tanzania 103,299 2.49% $778,221 0.68% 2.8MW 12.65%
Indonesia 100,650 2.43% $3,046,945 2.65% 0.3MW 1.37%
Detailed Sales Data

35
Uganda and Ethiopia still remained important markets, accounting respectively for 225,000 and 160,000 units and generating around $4.92 million and $6.23 million in cash sales revenues in this reporting round. Malawi reached 130,000 thanks to a 610% increase compared to the first half of the year, while Tanzania, after the drop registered in the previous rounds, had a 50% increase in sales hitting again the bar of 100,000 units sold but still far from the levels registered in the second half of 2016 (190,000 products). Rwanda has reported only 81,000 units sold in the second half of 2017, a comparable number to the one for the same period of 2016 but 60% lower than the sales figures of the first half of the year which amounted to 190,000 units; the swing may be explained by the drought which continues to affect the country as well as the operational challenges in distribution reported by some affiliates.
East AfricaAs in the previous rounds, the majority of sales in Sub-Saharan Africa have been recorded in East African countries, however the picture is beginning to change: Kenya, Ethiopia, Uganda and Tanzania together accounted for 50% of the sales of Sub-Saharan Africa in the second half of 2017, while they represented 70% in the same period of 2016. Even including other East African markets such as Malawi and Rwanda, the number only reaches 60% of the sales volumes in Sub-Saharan Africa, corroborating the view of an industry in expansion phase across this geographical region. Amongst the East African national markets, Kenya continues to be by far the largest one, registering an increase of around 20% compared to the first half of the year with 500,000 products sold and $6.27 million cash revenues generated in the second half of 2017.
© Julia Gunther
This report includes sales data for all countries where at least three manufacturer companies reported sales; in this reporting round, this amounts to 54 countries, 4 more than the previous reporting round, meaning that companies are expanding into new markets and new players are entering the space, delineating an industry in expansion.
Detailed Sales Data

36
West and Central AfricaVaried are the trajectories of the West Africa national markets which are beginning to make their mark; however, as they are still very young markets, they may be subject to high volatility in sales volumes between reporting periods. Nigeria continues to see solid figures of around 110,000 units sold, notably contributing 3.11 MW of newly installed solar capacity, the second largest after Kenya. After the large spike registered in the previous reporting round both Burkina Faso and Senegal registered a decrease of around 70%; on the other end of the spectrum, Ghana and Mali registered increases around 40% reaching over 40,000 products sold, each. Two new rising national markets can be found in Cote d’Ivoire and Sierra Leone with respectively 15,000 and 20,000 units sold in the second half of 2017.The Central Africa regional market almost reached the size of West Africa in this reporting round (250,000 units against 290,000), led by a 430% increase in the sales volumes in Democratic Republic of Congo (DRC) compared to the first half of 2017. Meanwhile, Cameroon saw a 94% decrease in the number of units sold from 31,000 to 2,000 units; it is important to note that these national markets are still far from maturity, so high volatility between reporting periods is likely to be observed.
South AsiaIn the second half of 2017, India represented 91% of sales volumes and 84% of cash sales revenues of the sales reported in South Asia, with 1.25 million units sold, and $36.38 million in cash sales revenues, remaining the largest market worldwide by volume of products sold. The India national market has seen an increase of 15% in sales and a 35% increase in cash sales revenues compared to the first half of 2017, reaching again the figures of the second half of 2016 when the demonetization came into effect negatively impacting the largely cash-based Indian economy. Bangladesh registered a notable 450% increase compared to the first half of 2017; these sales may be largely due to donation for Rohingya refugee camps due to the latest emigration wave started in August 2017. Meanwhile, Pakistan has reported only 7,000 units sold in the second half of 2017, a 35% increase from the same period of 2016 but 80% lower than the sales figures of the first half of the year which amounted to 38,000 units; this may be explained with the seasonality of the sales as the customer purchasing power highly depends on the agricultural outputs.
East Asia and PacificThe most relevant national market in East Asia and Pacific in the second half of 2017 was Indonesia, which hit the bar of 100,000 units sold and generated a little over $3 million cash revenues; little can be said about its evolution as it is the first time the country fulfills the three-data point rule with at least three manufacturer companies reporting sales, corroborating the view of an industry in expansion phase across the East Asia and Pacific region. Meanwhile, the Philippines has reported only 6,000 units sold in the second half of 2017, a 30% increase from the same period of 2016 but 90% lower than the sales figures of the first half of the year which amounted to 55,000 units; this may be explained by the seasonality of the sales as the customer purchasing power highly depends on the agricultural outputs. It is important to note that the national markets in this geographical region are still very young and therefore may be subject to high volatility in sales volumes between reporting periods.
Middle East and North AfricaThe Middle East and North Africa region was the third largest regional market in the second half of 2017 with 450,000 units reported as sold, registering a 55% increase in sales volumes compared to the first half of the same year; this increase may be linked to humanitarian emergency relief happening in the region. However, little can be said about the countries contributing to such an increase, as due to the three-data point rule applied in this report - the rule that excludes data from countries that report sales data from less than three manufacturers - most countries in this region are excluded.
Detailed Sales Data

37
Figure 15 - Sales Volumes by Country – Sub-Saharan Africa
1,926,8271,926,827
46,58146,581
1,9671,967
242,271242,271
15,36015,360
158,634158,634
37,86337,863
502,099502,099
43,95043,950
125,640125,640
42,62042,620
10,52310,523
4,3724,372
1,1601,160
107,576107,576
80,52980,529
17,88317,883
19,07419,074
13,97213,972
18,58918,589
103,299103,299
1,9201,920
224,074224,074
21,26821,268
8,3988,398
Sub-Saharan Africa
Burkina Faso
Cameroon
Congo, Dem. Rep.
Cote d'Ivoire
Ethiopia
Ghana
Kenya
Madagascar
Malawi
Mali
Mozambique
Namibia
Niger
Nigeria
Rwanda
Senegal
Sierra Leone
Somalia
South Africa
Tanzania
Togo
Uganda
Zambia
Zimbabwe
Detailed Sales Data
NOTE 1. Data is not shown for categories for which insufficient or no data points were provided.

38
$40,859,911$40,859,911
$665,172$665,172
$7,427,996$7,427,996
$6,230,026$6,230,026
$450,218$450,218
$6,268,277$6,268,277
$4,109,099$4,109,099
$1,810,069$1,810,069
$39,054$39,054
$1,225,914$1,225,914
$482,629$482,629
$326,255$326,255
$53,319$53,319
$273,470$273,470
$1,335,928$1,335,928
$778,221$778,221
$4,923,699$4,923,699
$696,028$696,028
$159,615$159,615
Sub-Saharan Africa
Burkina Faso
Congo, Dem. Rep.
Ethiopia
Ghana
Kenya
Malawi
Mali
Mozambique
Nigeria
Rwanda
Senegal
Sierra Leone
Somalia
South Africa
Tanzania
Uganda
Zambia
Zimbabwe
Figure 16 - Cash Sales Revenues by Country – Sub-Saharan Africa
Detailed Sales Data
NOTE 1. Data is not shown for categories for which insufficient or no data points were provided. 2. Only cash sales revenues are presented – this excludes PAYGO revenues. 3. Dividing the presented sales revenues by the volume of products sold does not equate to the average product retail price.

39
$43,235,736$43,235,736
$6,313,809$6,313,809
$36,381,387$36,381,387
$485,865$485,865
South Asia
Bangladesh
India
Pakistan
1,384,6071,384,607
119,050119,050
1,255,1741,255,174
6,7336,733
South Asia
Bangladesh
India
Pakistan
Figure 18 - Cash Sales Revenues by Country – South Asia
Figure 17 - Sales Volumes by Country – South Asia
Figure 19 - Sales Volumes by Country – East Asia & Pacific
173,331173,331
7,0247,024
9,8299,829
2,0242,024
5,1005,100
100,650100,650
2,4092,409
4,3434,343
16,41016,410
6,1636,163
7,8407,840
East Asia & Pacific
Australia
China
Hong Kong SAR, China
Fiji
Indonesia
Japan
Myanmar
Papua New Guinea
Philippines
Vanuatu
Detailed Sales Data
NOTE 1. Data is not shown for categories for which insufficient or no data points were provided.
NOTE 1. Data is not shown for categories for which insufficient or no data points were provided. 2. Only cash sales revenues are presented – this excludes PAYGO revenues. 3. Dividing the presented sales revenues by the volume of products sold does not equate to the average product retail price.
NOTE 1. Data is not shown for categories for which insufficient or no data points were provided.

40
Figure 21 - Sales Volumes by Country – Middle East & North Africa
453,022453,022
40,16240,162
Middle East & North Africa
United Arab Emirates
$4,747,544$4,747,544
$92,240$92,240
$179,325$179,325
$18,413$18,413
$179,695$179,695
$3,046,945$3,046,945
$39,591$39,591
$104,392$104,392
$278,865$278,865
$276,071$276,071
East Asia & Pacific
Australia
China
Hong Kong SAR, China
Fiji
Indonesia
Japan
Myanmar
Papua New Guinea
Philippines
Figure 20 - Cash Sales Revenues by Country – East Asia & Pacific
Figure 22 - Cash Sales Revenues by Country – Middle East & North Africa
$21,484,073$21,484,073
$2,231,866$2,231,866
Middle East & North Africa
United Arab Emirates
Detailed Sales Data
NOTE 1. Data is not shown for categories for which insufficient or no data points were provided. 2. Only cash sales revenues are presented – this excludes PAYGO revenues. 3. Dividing the presented sales revenues by the volume of products sold does not equate to the average product retail price.
NOTE 1. Data is not shown for categories for which insufficient or no data points were provided.
NOTE 1. Data is not shown for categories for which insufficient or no data points were provided. 2. Only cash sales revenues are presented – this excludes PAYGO revenues. 3. Dividing the presented sales revenues by the volume of products sold does not equate to the average product retail price.
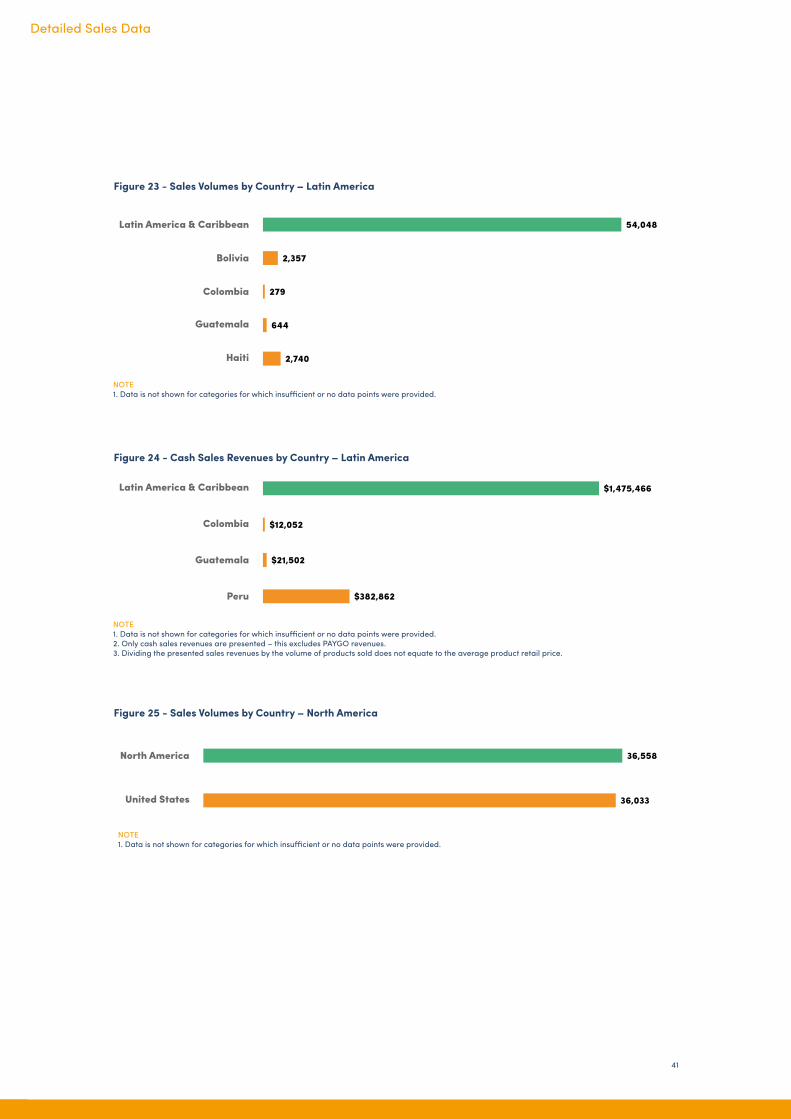
41
Figure 23 - Sales Volumes by Country – Latin America
54,04854,048
2,3572,357
279279
644644
2,7402,740
12,64712,647
Latin America & Caribbean
Bolivia
Colombia
Guatemala
Haiti
Peru
Figure 24 - Cash Sales Revenues by Country – Latin America
$1,475,466$1,475,466
$12,052$12,052
$21,502$21,502
$382,862$382,862
Latin America & Caribbean
Colombia
Guatemala
Peru
Figure 25 - Sales Volumes by Country – North America
36,55836,558
36,03336,033
North America
United States
Detailed Sales Data
NOTE 1. Data is not shown for categories for which insufficient or no data points were provided.
NOTE 1. Data is not shown for categories for which insufficient or no data points were provided. 2. Only cash sales revenues are presented – this excludes PAYGO revenues. 3. Dividing the presented sales revenues by the volume of products sold does not equate to the average product retail price.
NOTE 1. Data is not shown for categories for which insufficient or no data points were provided.

42
Detailed Sales Data
Figure 27 - Sales Volumes by Country – Europe & Central Asia
114,973114,973
7,6667,666
4,7924,792
11,04611,046
36,09836,098
11,51011,510
437437
1,6121,612
4,6994,699
6262
9,0919,091
Europe & Central Asia
Belgium
Denmark
France
Germany
Greece
Ireland
Italy
Norway
Sweden
United Kingdom
Figure 26 - Cash Sales Revenues by Country – North America
$670,685$670,685
$665,182$665,182
North America
United States
NOTE 1. Data is not shown for categories for which insufficient or no data points were provided. 2. Only cash sales revenues are presented – this excludes PAYGO revenues. 3. Dividing the presented sales revenues by the volume of products sold does not equate to the average product retail price.
NOTE 1. Data is not shown for categories for which insufficient or no data points were provided.

43
Detailed Sales Data
Figure 28 - Cash Sales Revenues by Country – Europe & Central Asia
$2,619,449$2,619,449
$289,339$289,339
$144,342$144,342
$63,408$63,408
$533,332$533,332
$109,944$109,944
$6,493$6,493
$109,025$109,025
$267,854$267,854
$921$921
$135,347$135,347
Europe & Central Asia
Belgium
Denmark
France
Germany
Greece
Ireland
Italy
Norway
Sweden
United Kingdom
© Fenix International
NOTE 1. Data is not shown for categories for which insufficient or no data points were provided. 2. Only cash sales revenues are presented – this excludes PAYGO revenues. 3. Dividing the presented sales revenues by the volume of products sold does not equate to the average product retail price.

44
Impact Metrics
Since 2013, GOGLA has had an Impact Working Group focused on examining the social impact of the off-grid solar industry. Together with external experts, this Working Group has developed a set of impact metrics that help companies to collectively report on their social and environmental impact in a consistent and comparable way – providing a standard approach for the sector as a whole. The goal is to attract investment and increase regulatory support that will facilitate industry growth and enable greater energy access.
The following pages present the aggregated impact of the affiliates, which include GOGLA Members and companies that sell Lighting Global quality-verified products that participated in the data collection for H2 2017. The results are drawn from data provided by manufacturers only, to avoid double-counting, and only calculate the impact of products currently being sold.
Please note that for the second half of 2017, a smaller number of aggregate impact numbers are being reported than in the previous rounds as the metrics and database are currently being updated to better represent the impact of differing sizes of off-grid system, and to enable cumulative impact to be more accurately estimated. However, additional impact data has been provided to the participating affiliates via their company-own reports and online results platform.
Methodology The metrics we use to report impact data in this paper were developed by the GOGLA Impact Working Group. Each one is a combination of company data (such as sales, product characteristics, and other company information) and coefficients with default values. The default values of the coefficients were determined following a review of publicly available data, data made available by participating, and by the application of informed assumptions and calculations. All metrics have been reviewed by external experts and are aligned with the IRIS impact metrics7.
Limitations of the Impact Metrics and ReportingThis report only estimates the impact made by participating companies: Therefore, while the numbers shown aggregate the impact of key players in the off-grid sector, this report does not present an estimate of all global impacts of off-grid solar for this reporting period. Based on previous analysis by Dalberg Advisors for the Off-Grid Solar Market Trends Report 2018, we estimate that the data reported here represents about 30% of all sales of Pico-PV products and Solar Home System (SHS) kits. This proportion varies substantially from country to country.
This report takes a conservative approach to data inclusion and may underestimate the total impact of participants: To estimate ‘end of life’, the impact of products is no longer calculated when they reach 1.5x their warranty period. However, it is possible that a significant number of these products are continuing to benefit households. Moreover, if companies have not provided all of the product specifications needed for a particular impact metric, the product will not be included in the analysis.
This report only estimates the impact made by product lines that are currently being sold by participating companies and within the estimated lifespan: Therefore, this report does not include the impact of products sold by participating companies if a company has discontinued a product line, yet the product is still under warranty. This is due to a limitation in the current database which is being revised for the next impact reporting period (January – June 2018).
Research on off-grid solar, and the GOGLA metrics, are being continuously improved: GOGLA’s impact metrics continue to be refined and improved and a full review and revision is underway in advance of the H1 2018 data collection. It is important to note, therefore, that the numbers presented are estimates and may change as new evidence becomes available.
7 https://iris.thegiin.org/off-grid-energy-metrics
© Bright Life by Finca
Impact Metrics

45
Measuring Impact: What’s Coming Up The impact results in this report provide a robust estimate of the impact created by companies participating in this data collection. However, we continuously aim to improve and enhance the way we measure and use impact data, and are currently undertaking work to address two key areas:
Enhancing Knowledge: To expand impact knowledge, GOGLA is working with Altai Consulting and seven leading companies – BBOXX, d.light, Fenix, Mobisol, M-KOPA, Off Grid Electric, and Solar Works – to gather more data on the impact of PAYGO and solar home systems, supported by the UK Department for International Development. We also work with partners, including Acumen, the World Bank’s Energy Sector Management Assistance Program (ESMAP) and the Schatz Energy Research Center, to integrate additional research and learnings into the Impact Metrics. Revised metrics will be launched in June 2018, enabling us to better report impact for different sizes of off-grid system.
Cumulative Data: As noted above, data presented in this report only calculates the impact of product lines currently being sold by participating companies and which are within their estimated lifespan. Limitations of the database mean that calculations do not currently include the impact of products that are no longer sold by companies but are still active and under warranty. We aim to include these products in future reports to provide a complete picture of impact at the aggregate level.
1aii. People who are benefitting from Improved Energy Access - Currently Number of people living in households currently using an improved source of energy (i.e. solar)
1bi. People with Access to Tier 1 Energy Services Number of people with Tier 1 energy access currently, based on the Sustainable Energy for All Global Tracking Framework
1bii. People with Access to Tier 2 Energy Services Number of people with Tier 2 energy access currently, based on the Sustainable Energy for All Global Tracking Framework
4a. Change in Available Hours of Light, per household (%) Change in available hours of light per day from solar product, as compared to typical usage time for status quo lighting, for an average household
4b. Change in Available Light Output, per household (%) Change in available light output (lumens) from solar product, with the average output for status quo lighting
List of Impact MetricsThe following table gives an overview of all the metrics for which the estimated aggregate results are presented in this report. All metrics, as well as the default values, their definitions and rationale (including the methodology and sources) can be found in the GOGLA Standardized Impact Metrics for the Off-Grid Energy Sector Whitepaper.
8 http://www.gogla.org/sites/www.gogla.org/files/recource_docs/gogla-standardised-impact-metrics-for-the-off-grid-energy-sector1_1.pdf
Impact Metrics

46
Key Global Impact Figures
72.3 million People currently living in households using an improved source of energy (i.e. solar)
39.1 million People currently with Tier 1 energy access, based on the Sustainable Energy for All Global Tracking Framework
2.1 million People currently with Tier 2 energy access, based on the Sustainable Energy for All Global Tracking Framework
229% Change in available hours of light, per household, compared to the available time from previous light sources (such as kerosene or candles), on average2
233% change in available light output (lumens), per household, compared to the output of previous light sources (such as kerosene or candles), on average2
NOTES1. The Global Tracking Framework was introduced by the UN’s SE4ALL program and comprises five tiers which address a previous shortfall in energy access
categorization. Before the framework was introduced, a household either had a grid connection or it did not i.e. electricity access was seen as binary2. The averages are built on products not households, i.e. we assume one product per household. The average is based on a weighted average of product
sales, i.e. products with higher sales volumes are weighted higher than those where fewer have been sold.3. The level of energy access enabled through use of these pico-PV products and solar home system kits is indicated below using the terminology of the
multi-tier framework for measuring energy access. This was developed by the World Bank’s Energy Sector Management Assistance Program (ESMAP) under the Sustainable Energy for All initiative. For more information, please visit: https://www.esmap.org/node/55526
What data does this report cover? This report only covers aggregate data provided by affiliates, which includes GOGLA members and companies that sell Lighting Global quality-verified products. Moreover, this report only estimates the impact made by participating companies taking a conservative approach to data inclusion and may underestimate the total impact of participants. For example, if companies have not provided all of the product specifications needed for a particular impact metric, this product will not be included in the analysis.
Impact Metrics
© Sunna Design

47
Analysis Impact CreatedCurrently, it is estimated that over 72 million people around the world are actively benefitting from off-grid solar products that have been sold or distributed by affiliates, meaning GOGLA Members and companies that sell Lighting Global quality-verified products. This number is a reduction from the 83 million seen in the first half of 2017. The drop is partly linked to the measurement methodology used in this report – which at present does not allow for the inclusion of products lines which are no longer being sold by companies although they remain active and within warranty – but also recognizes the conservative approach to impact measurement taken by GOGLA.
To estimate ‘end of life’, the impact of products is no longer calculated when they reach 1.5x their warranty period. Given the 1 or 2-year warranty periods of a number of products sold in 2014/15, the impact of many lanterns and systems is no longer included in the current energy access calculation. However, it is likely that a significant number of these products are continuing to benefit households. As the market matures, there is a trend towards increasing the length of product warranties, which will increase the estimated lifetime impact of products in future reporting and continue to provide improved service to customers.
This improving service to customers can also be seen in the increased light output and light hours of off-grid solar products. In just the two years since GOGLA began reporting on impact in 2016, the battery capacity of products sold – highlighted by the available light hours metric – has grown by 23%, while the light output of the products sold is now, in aggregate, 43% brighter than it was between Jan-June that year.
This growing quality of service can be seen when viewing the impact of participating off-grid companies through the ‘Tiers’ of energy access. The Tiers provided by the SEforALL Global Tracking Framework have been designed to enable different energy systems – such as off-grid, mini-grids and centralized grid – to be compared by the energy service levels that they provide to households. In the second half of 2017, the products by affiliates currently active helped an estimated 39 million people access Tier 1 energy services, and over 2 million people access to Tier 2 energy services – 250,000 more than in the first half of the same year, and 700,000 more than in the same period of 2016. This is indicative of the growth in customers now accessing larger systems which can power more lights, as well as appliances such as radios, fans and televisions.
Additional data on the impact of 3-10Wp, 11-49Wp and 50Wp+ systems is currently being gathered and will be integrated into future reporting, enabling us to further explore the impact of different off-grid products and services.
Figure 29 - People who are benefitting from Improved Energy Access - Currently
72,248,26672,248,266
33,706,58633,706,586
25,828,77425,828,774
9,253,4859,253,485
1,091,7801,091,780
683,170683,170
1,404,6741,404,674
279,794279,794
00
Total
0-1.5 Wp
1.5-3 Wp
3-10 Wp
11-20 Wp
21-49 Wp
50-100 Wp
100+ Wp
Not specified
Impact Metrics

48
Impact Metrics
Figure 30 - People with Access to Tier 1 and Tier 2 Energy Services
39,071,36939,071,369
9,123,0179,123,017
19,461,29219,461,292
9,119,9719,119,971
1,080,1181,080,118
286,969286,969
00
00
00
2,071,4952,071,495
00
00
00
00
387,297387,297
1,404,4031,404,403
279,794279,794
00
Total Market - Tier 2 Total Market - Tier 1
Total
0-1.5 Wp
1.5-3 Wp
3-10 Wp
11-20 Wp
21-49 Wp
50-100 Wp
100+ Wp
Not specified
Figure 31 - Change in Available Hours of Light, per household (%)
233%233%
118%118%
311%311%
327%327%
304%304%
362%362%
652%652%
1,148%1,148%
0%0%
Average total
0-1.5 Wp
1.5-3 Wp
3-10 Wp
11-20 Wp
21-49 Wp
50-100 Wp
100+ Wp
Not specified
NOTE 1. The Global Tracking Framework was introduced by the UN’s SE4ALL program and comprises five tiers which address a previous shortfall in energy access
categorization. Before the framework was introduced, a household either had a grid connection or it did not i.e. electricity access was seen as binary. The framework includes a more nuanced approach, starting with Tier 1 as the most basic energy access of task lighting and phone charging, progressing up to Tier 5 which describes general home lighting system, television and fan, plus any other high power appliance.

49
Impact Metrics
Figure 32 - Change in Available Light Output, per household (%)
229%229%
10%10%
136%136%
553%553%
1,237%1,237%
3,319%3,319%
2,175%2,175%
3,205%3,205%
0%0%
Average total
0-1.5 Wp
1.5-3 Wp
3-10 Wp
11-20 Wp
21-49 Wp
50-100 Wp
100+ Wp
Not specified
© Little Sun

50
References• The contents of this report present market data based on the reported sales of Lighting Global quality-verified
products and products from companies which are GOGLA members or companies that sell Lighting Global quality-verified products https://www.lightingglobal.org/products/
• Off-Grid Solar Market Trends Report 2018, Published by Dalberg Advisors and Lighting Global, an innovation of the World Bank Group, in cooperation with GOGLA https://www.lightingglobal.org/2018-global-off-grid-solar-market-trends-report/
• Beyond Connections: Energy Access Redefined, Published by the Energy Sector Management Assistance program of the World Bank group (ESMAP Technical Report 008/15), 2015 https://www.esmap.org/node/55526
• Standardized impact metrics for the off-grid energy sector, Version 2.0, January 2016, GOGLA https://www.gogla.org/sites/default/files/recource_docs/gogla-standardised-impact-metrics-for-the-off-grid-energy-sector1_1.pdf
• Lighting Global Quality Standards (Lighting Global / International Electrical Commission Technical Specification 96652) https://www.lightingglobal.org/quality-assurance-program/
Photo Credits© Bright Products© Fenix International© Bright Life by Finca© d.light design© Julia Gunther© Lagazel© Little Sun© Off Grid Electric© ovSolar© Philips Lighting© Sunna Design© Total (cover)
References and Credits

51
© Bright Products
Contact information
Global Off-Grid Lighting Association Arthur van Schendelstraat 500 3511 MH Utrecht The Netherlands
Lighting Global Energy & Resource Efficiency Unit Cross-Industry Advisory Solutions International Finance Corporation (IFC) – World Bank Group 2121 Pennsylvania Ave. NW, Washington D.C. 20433 USA

Global Off-Grid Lighting Associationwww.gogla.org [email protected]
Lighting Globalwww.lightingglobal.org [email protected] April 2018