global private equity barometer - coller capital...2 w i n t e r 2 0 1 2 - 1 3 coller capital’s...
TRANSCRIPT
A UNIQUE PERSPECTIVE ON THE ISSUES AND OPPORTUNITIESFACING INVESTORS IN PRIVATE EQUITY WORLDWIDE
Global Private Equity BarometerWINTER 2012-13

W I N T E R 2 0 1 2 - 1 32
Coller Capital’s Global Private Equity Barometer
Coller Capital’s Global Private Equity Barometer is a unique
snapshot of worldwide trends in private equity – a twice-
yearly overview of the plans and opinions of institutional
investors in private equity (Limited Partners, or LPs, as they
are known) based in North America, Europe and Asia-Pacific
(including the Middle East).
This 17th edition of the Global Private Equity Barometer
captured the views of 131 private equity investors from
round the world. The Barometer’s findings are globally
representative of the LP population by:
Investor location
Type of investing organisation
Total assets under management
Length of experience of private equity investing
Contents
Key topics in this edition of the Barometer include:
The effect of performance-related pay on LPs’ portfolio returns
LPs’ willingness to back GPs on a deal-by-deal basis
LPs’ return expectations & appetite for PE
Demand and supply in global PE markets
LPs’ plans for their number of GPs
Fundraising & due diligence since the crash
Most attractive areas for GP investment
LPs’ expectations on distributions
The IPO market
The debt markets
Asia-Pacific PE market
W I N T E R 2 0 1 2 - 1 3 3
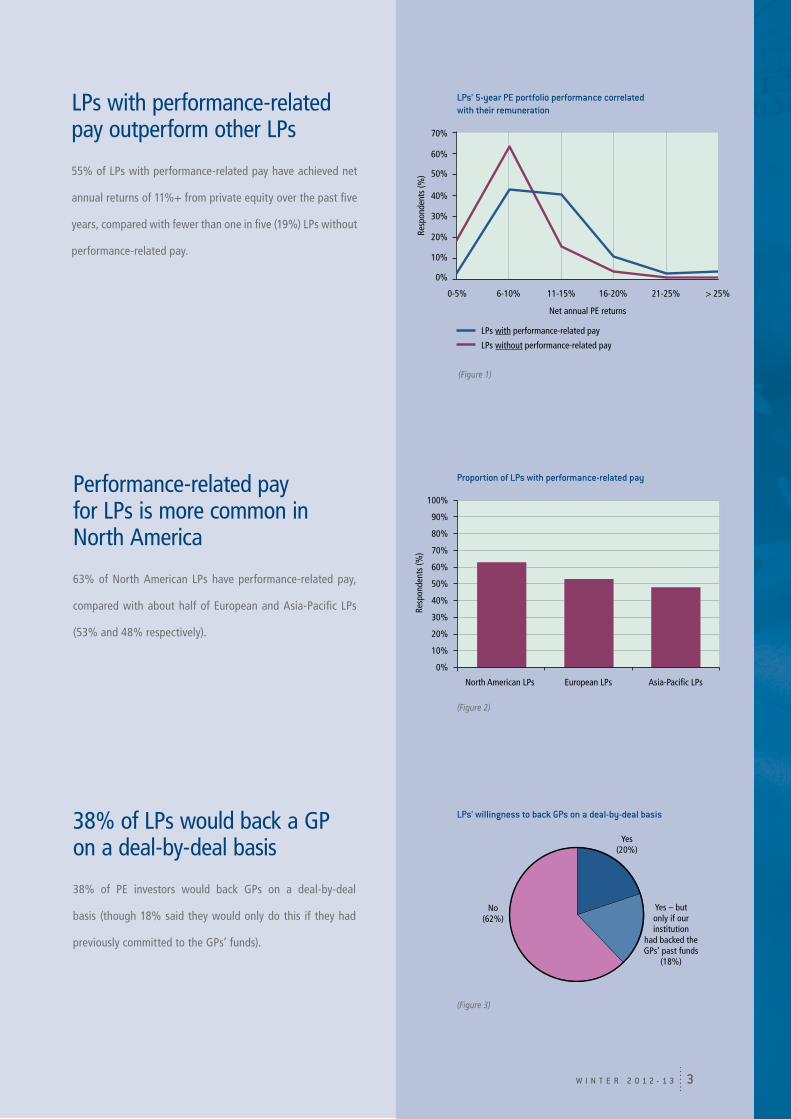
LPs with performance-related pay outperform other LPs
55% of LPs with performance-related pay have achieved net
annual returns of 11%+ from private equity over the past five
years, compared with fewer than one in five (19%) LPs without
performance-related pay.
Performance-related pay for LPs is more common in North America
63% of North American LPs have performance-related pay,
compared with about half of European and Asia-Pacific LPs
(53% and 48% respectively).
38% of LPs would back a GP on a deal-by-deal basis
38% of PE investors would back GPs on a deal-by-deal
basis (though 18% said they would only do this if they had
previously committed to the GPs’ funds).
Proportion of LPs with performance-related pay
LPs’ willingness to back GPs on a deal-by-deal basis
(Figure 3)
LPs’ 5-year PE portfolio performance correlated with their remuneration
(Figure 1)
0-5% 6-10% 11-15% 16-20% 21-25% > 25%
0%
20%
40%
60%
50%
30%
10%
70%
LPs without performance-related pay
LPs with performance-related pay
Resp
onde
nts
(%)
Net annual PE returns
North American LPs European LPs Asia-Paci�c LPs
0%
10%
20%
30%
40%
50%
60%
70%
80%
90%
100%
Resp
onde
nts
(%)
(Figure 2)
Yes(20%)
Yes – butonly if ourinstitution
had backed theGPs’ past funds
(18%)
No(62%)
W I N T E R 2 0 1 2 - 1 34
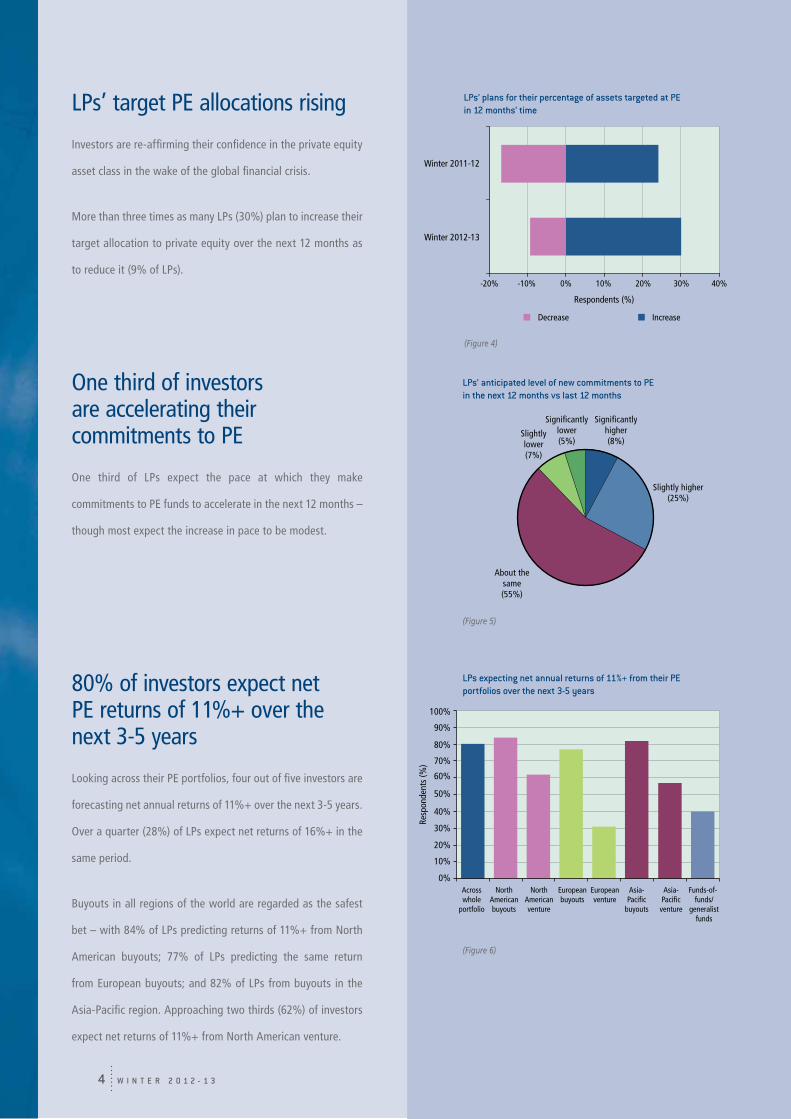
LPs’ target PE allocations rising
Investors are re-affirming their confidence in the private equity
asset class in the wake of the global financial crisis.
More than three times as many LPs (30%) plan to increase their
target allocation to private equity over the next 12 months as
to reduce it (9% of LPs).
One third of investors are accelerating their commitments to PE
One third of LPs expect the pace at which they make
commitments to PE funds to accelerate in the next 12 months –
though most expect the increase in pace to be modest.
80% of investors expect net PE returns of 11%+ over the next 3-5 years
Looking across their PE portfolios, four out of five investors are
forecasting net annual returns of 11%+ over the next 3-5 years.
Over a quarter (28%) of LPs expect net returns of 16%+ in the
same period.
Buyouts in all regions of the world are regarded as the safest
bet – with 84% of LPs predicting returns of 11%+ from North
American buyouts; 77% of LPs predicting the same return
from European buyouts; and 82% of LPs from buyouts in the
Asia-Pacific region. Approaching two thirds (62%) of investors
expect net returns of 11%+ from North American venture.
LPs’ anticipated level of new commitments to PE in the next 12 months vs last 12 months
LPs expecting net annual returns of 11%+ from their PE portfolios over the next 3-5 years
(Figure 5)
LPs’ plans for their percentage of assets targeted at PE in 12 months’ time
(Figure 4)
(Figure 6)
-20% -10% 0% 10% 20% 30% 40%
IncreaseDecrease
Winter 2012-13
Winter 2011-12
Respondents (%)
About thesame(55%)
Slightly higher(25%)
Signi�cantlyhigher(8%)
Slightlylower(7%)
Signi�cantlylower(5%)
0%
10%
20%
30%
50%
60%
70%
80%
90%
40%
100%
Resp
onde
nts
(%)
NorthAmericanbuyouts
Across whole
portfolio
Asia-Pacic
buyouts
European buyouts
Asia-Pacic
venture
Funds-of-funds/
generalist funds
European venture
North American venture
W I N T E R 2 0 1 2 - 1 3 5
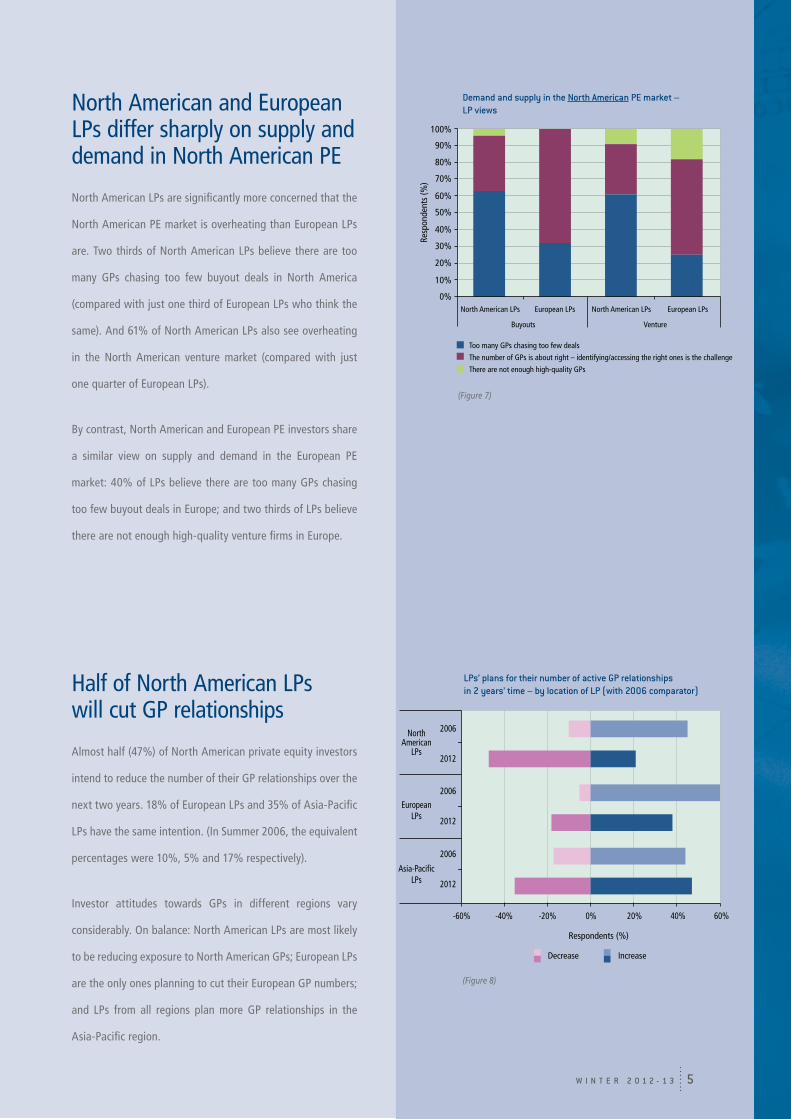
North American and European LPs differ sharply on supply and demand in North American PE
North American LPs are significantly more concerned that the
North American PE market is overheating than European LPs
are. Two thirds of North American LPs believe there are too
many GPs chasing too few buyout deals in North America
(compared with just one third of European LPs who think the
same). And 61% of North American LPs also see overheating
in the North American venture market (compared with just
one quarter of European LPs).
By contrast, North American and European PE investors share
a similar view on supply and demand in the European PE
market: 40% of LPs believe there are too many GPs chasing
too few buyout deals in Europe; and two thirds of LPs believe
there are not enough high-quality venture firms in Europe.
Half of North American LPs will cut GP relationships
Almost half (47%) of North American private equity investors
intend to reduce the number of their GP relationships over the
next two years. 18% of European LPs and 35% of Asia-Pacific
LPs have the same intention. (In Summer 2006, the equivalent
percentages were 10%, 5% and 17% respectively).
Investor attitudes towards GPs in different regions vary
considerably. On balance: North American LPs are most likely
to be reducing exposure to North American GPs; European LPs
are the only ones planning to cut their European GP numbers;
and LPs from all regions plan more GP relationships in the
Asia-Pacific region.
Demand and supply in the North American PE market –LP views
LPs’ plans for their number of active GP relationships in 2 years’ time – by location of LP (with 2006 comparator)
0%
10%
20%
30%
50%
60%
70%
80%
90%
40%
100%
Resp
onde
nts
(%)
North American LPs European LPs North American LPs European LPs
Buyouts Venture
Too many GPs chasing too few deals
The number of GPs is about right – identifying/accessing the right ones is the challenge
There are not enough high-quality GPs
(Figure 7)
NorthAmerican
LPs
2006
2012
2006
2012
2006
2012
EuropeanLPs
Asia-Paci�cLPs
Respondents (%)
-40%-60% -20% 0% 20% 40% 60%
Decrease Increase
(Figure 8)

W I N T E R 2 0 1 2 - 1 36
Proportion of LPs committing early to a fund to secure an ‘early bird’ discount in the last 2 yearsAlmost 2 in 5 LPs have
taken advantage of ‘early bird’ discounts
In the last two years, 38% of LPs have committed early to
a private equity fund to take advantage of an ‘early bird’
discount on fees – and 15% of LPs have done so several times.
GP staffing issues and strategy drift are LPs’ greatest concerns
Continuity and succession issues within private equity firms
and strategy drift by GPs are the greatest concerns for LPs in
today’s fundraising environment. These issues were cited by
80% and 73% of LPs respectively.
Heightened competition in individual private equity markets
and growth in the size of GPs’ funds – which were LPs’ greatest
worries in the pre-crash period – also remain significant
concerns today.
(Figure 9)
Several times(15%)
Never(62%)
Once(23%)
LPs’ concerns in the current fundraising environment
0% 10% 20% 30% 40% 50% 60% 70% 80% 90% 100%
Winter 2012-13 Winter 2005-06
Continuity/succession issues
Strategy drift by GPs
Heightened competition/declining returns in specific markets
Growth in fund size(compared with a GP's prior fund)
Fund terms & conditions
Quality of GP reporting/transparency
Respondents (%)
(Figure 10)
W I N T E R 2 0 1 2 - 1 3 7
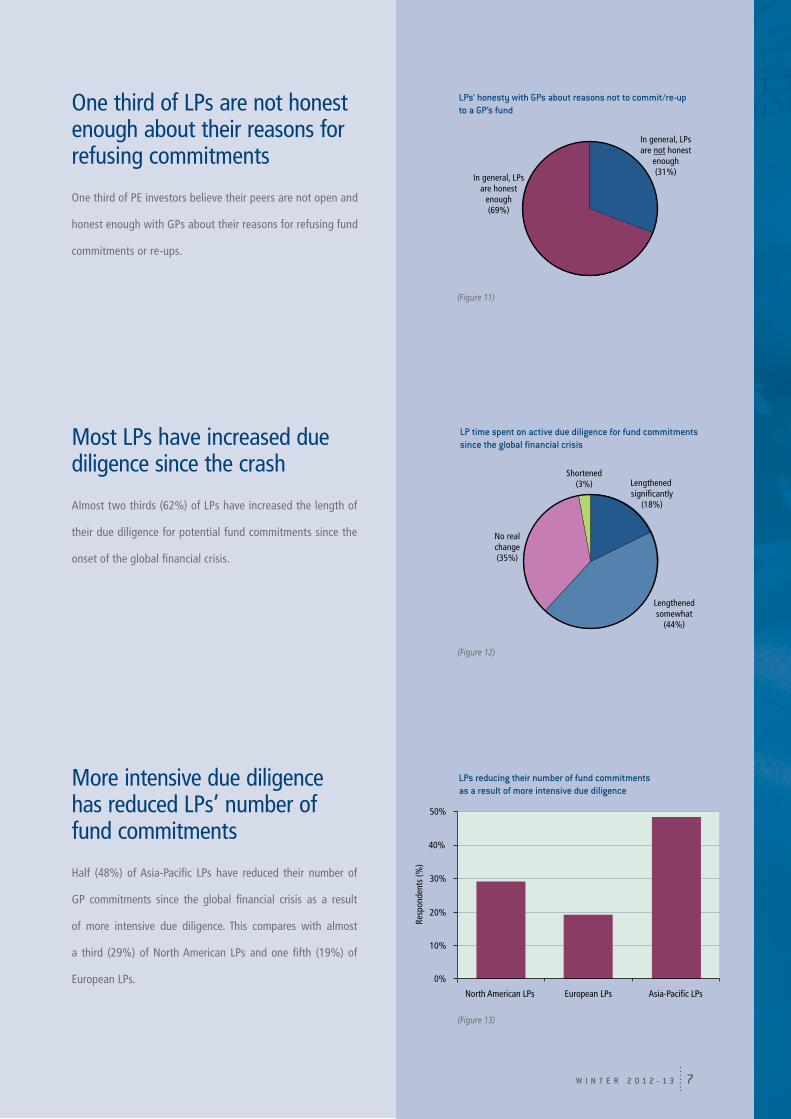
Most LPs have increased due diligence since the crash
Almost two thirds (62%) of LPs have increased the length of
their due diligence for potential fund commitments since the
onset of the global financial crisis.
More intensive due diligence has reduced LPs’ number of fund commitments
Half (48%) of Asia-Pacific LPs have reduced their number of
GP commitments since the global financial crisis as a result
of more intensive due diligence. This compares with almost
a third (29%) of North American LPs and one fifth (19%) of
European LPs.
LP time spent on active due diligence for fund commitments since the global financial crisis
LPs reducing their number of fund commitments as a result of more intensive due diligence
One third of LPs are not honest enough about their reasons for refusing commitments
One third of PE investors believe their peers are not open and
honest enough with GPs about their reasons for refusing fund
commitments or re-ups.
LPs’ honesty with GPs about reasons not to commit/re-up to a GP’s fund
(Figure 11)
(Figure 12)
In general, LPsare honest
enough(69%)
In general, LPsare not honest
enough(31%)
Lengthenedsomewhat
(44%)
Lengthened signi cantly
(18%)
Shortened(3%)
No realchange(35%)
North American LPs European LPs Asia-Paci�c LPs
0%
10%
20%
30%
40%
50%
Resp
onde
nts
(%)
(Figure 13)
W I N T E R 2 0 1 2 - 1 38
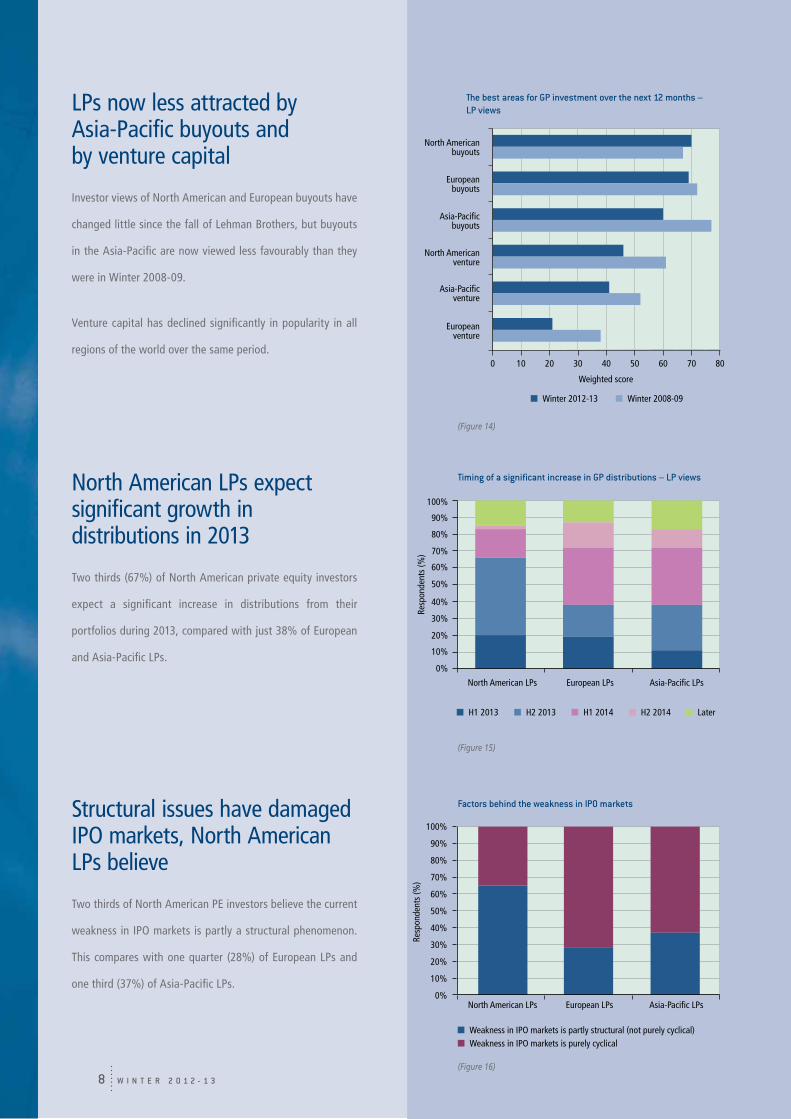
LPs now less attracted by Asia-Pacific buyouts and by venture capital
Investor views of North American and European buyouts have
changed little since the fall of Lehman Brothers, but buyouts
in the Asia-Pacific are now viewed less favourably than they
were in Winter 2008-09.
Venture capital has declined significantly in popularity in all
regions of the world over the same period.
North American LPs expect significant growth in distributions in 2013
Two thirds (67%) of North American private equity investors
expect a significant increase in distributions from their
portfolios during 2013, compared with just 38% of European
and Asia-Pacific LPs.
Structural issues have damaged IPO markets, North American LPs believe
Two thirds of North American PE investors believe the current
weakness in IPO markets is partly a structural phenomenon.
This compares with one quarter (28%) of European LPs and
one third (37%) of Asia-Pacific LPs.
The best areas for GP investment over the next 12 months – LP views
Timing of a significant increase in GP distributions – LP views
Factors behind the weakness in IPO markets
(Figure 15)
(Figure 16)
Asia-Paci�cbuyouts
Europeanbuyouts
North Americanbuyouts
North Americanventure
Asia-Paci�cventure
Europeanventure
Weighted score
0 6010 20 30 40 50 70 80
Winter 2012-13 Winter 2008-09
North American LPs European LPs Asia-Paci�c LPs
H1 2013 H2 2013 H1 2014 H2 2014 Later
Resp
onde
nts
(%)
0%
10%
20%
30%
50%
60%
70%
80%
90%
40%
100%
North American LPs European LPs Asia-Paci�c LPs
Weakness in IPO markets is partly structural (not purely cyclical)Weakness in IPO markets is purely cyclical
Resp
onde
nts
(%)
0%
10%
20%
30%
50%
60%
70%
80%
90%
40%
100%
(Figure 14)
W I N T E R 2 0 1 2 - 1 3 9
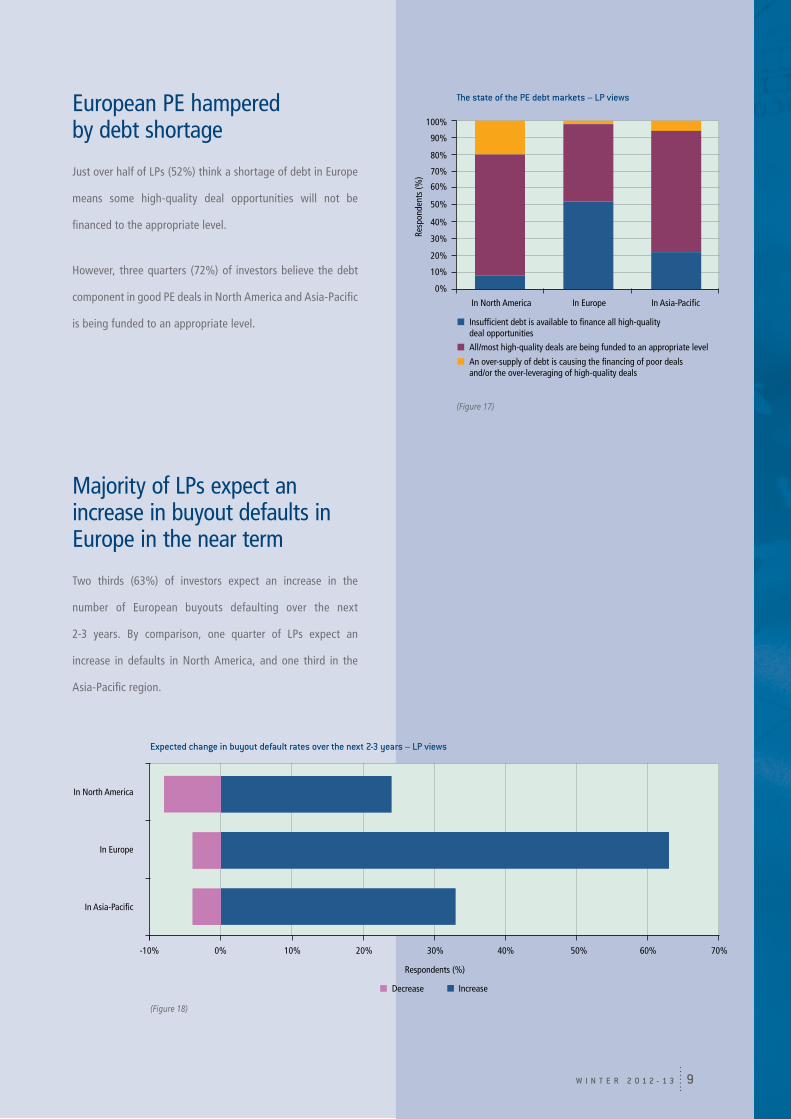
European PE hampered by debt shortage
Just over half of LPs (52%) think a shortage of debt in Europe
means some high-quality deal opportunities will not be
financed to the appropriate level.
However, three quarters (72%) of investors believe the debt
component in good PE deals in North America and Asia-Pacific
is being funded to an appropriate level.
Majority of LPs expect an increase in buyout defaults in Europe in the near term
Two thirds (63%) of investors expect an increase in the
number of European buyouts defaulting over the next
2-3 years. By comparison, one quarter of LPs expect an
increase in defaults in North America, and one third in the
Asia-Pacific region.
The state of the PE debt markets – LP views
(Figure 17)
Expected change in buyout default rates over the next 2-3 years – LP views
In North America In Europe In Asia-Paci�c
An over-supply of debt is causing the �nancing of poor deals and/or the over-leveraging of high-quality deals
All/most high-quality deals are being funded to an appropriate level
Insuf�cient debt is available to �nance all high-quality deal opportunities
Resp
onde
nts
(%)
0%
10%
20%
30%
50%
60%
70%
80%
90%
40%
100%
IncreaseDecrease
0% 10% 20% 30% 40% 50% 60% 70%-10%
In Asia-Pacic
In Europe
In North America
Respondents (%)
(Figure 18)

W I N T E R 2 0 1 2 - 1 310
Early PE investors underestimated the risks in India and China, LPs say
LPs believe early PE investors in India and China underestimated
the risks of investing in these countries. Two thirds (69%) of LPs
think investors were too optimistic about India, and over half
(54%) say the same about China. Political and regulatory risks
are believed to have been the most frequently underestimated
risk in both countries.
The risk/reward equation for PE investment in China is worsening, many LPs think
Three times as many LPs see the risk/reward equation getting
worse in China as those who see it improving. The picture for
India is more balanced.
Nascent Asian PE markets gain importance in LPs’ eyes
One fifth of LPs are now focusing more attention on nascent
Asian PE markets such as Indonesia and Vietnam, compared
with the more developed markets of Australasia, Japan, Korea,
India and China.
The risk/reward equation in India and China – LP views
Early investors’ assessments of investment risk in India and China – LP views
(Figure 19)
(Figure 21)
Proportion of LPs focusing more attention on nascent Asian PE markets compared with more developed Asian PE markets
No(80%)
Yes(20%)
ImprovingWorsening
Respondents (%)
0%-10%-20%-30%-40%-50% 10% 20%
In China
In India
In India In China
Fairly accurateToo optimistic Too pessimistic
Resp
onde
nts
(%)
0%
10%
20%
30%
50%
60%
70%
80%
90%
40%
100%
(Figure 20)
W I N T E R 2 0 1 2 - 1 3 11
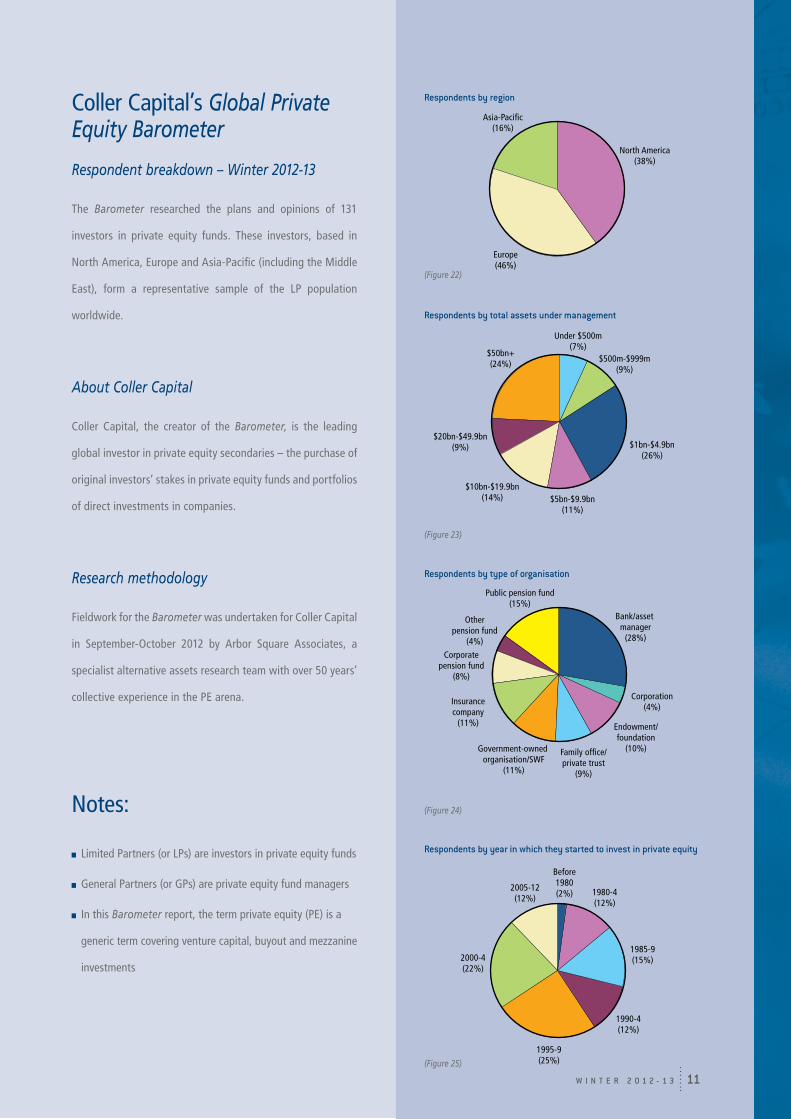
Coller Capital’s Global Private Equity Barometer
Respondent breakdown – Winter 2012-13
The Barometer researched the plans and opinions of 131
investors in private equity funds. These investors, based in
North America, Europe and Asia-Pacific (including the Middle
East), form a representative sample of the LP population
worldwide.
About Coller Capital
Coller Capital, the creator of the Barometer, is the leading
global investor in private equity secondaries – the purchase of
original investors’ stakes in private equity funds and portfolios
of direct investments in companies.
Research methodology
Fieldwork for the Barometer was undertaken for Coller Capital
in September-October 2012 by Arbor Square Associates, a
specialist alternative assets research team with over 50 years’
collective experience in the PE arena.
Notes:
Limited Partners (or LPs) are investors in private equity funds
General Partners (or GPs) are private equity fund managers
In this Barometer report, the term private equity (PE) is a
generic term covering venture capital, buyout and mezzanine
investments
Respondents by region
(Figure 22)
Respondents by year in which they started to invest in private equity
North America(38%)
Europe(46%)
Asia-Paci�c(16%)
$10bn-$19.9bn(14%)
$20bn-$49.9bn(9%)
$5bn-$9.9bn(11%)
$1bn-$4.9bn(26%)
$500m-$999m(9%)
Under $500m(7%)
$50bn+(24%)
Insurancecompany
(11%)
Corporatepension fund
(8%)
Government-owned organisation/SWF
(11%)
Family of�ce/private trust
(9%)
Endowment/foundation
(10%)
Corporation(4%)
Bank/asset manager
(28%)
Public pension fund(15%)
Otherpension fund
(4%)
1995-9(25%)
1990-4(12%)
1985-9(15%)
1980-4(12%)
Before1980(2%)
2005-12(12%)
2000-4(22%)
Respondents by total assets under management
(Figure 23)
(Figure 25)
Respondents by type of organisation
(Figure 24)

www.collercapital.com