global private label trends - province of manitoba | home · pdf file ·...
TRANSCRIPT

International
Markets
Bureau
MARKET ANALYSIS REPORT | APRIL 2010
Global Private Label Trends
So
urc
e:
MIN
TE
L
So
urc
e:
MIN
TE
L

PAGE 3
EXECUTIVE SUMMARY
INSIDE THIS ISSUE
One of the most important
drivers of private label
penetration growth in many
markets is the heightened
level of grocery retail
concentration.
“
”
SIZE AND SCOPE 3-5
EVOLUTION OF PRIVATE
LABEL PRODUCTS
5-7
DRIVERS AND INHIBITORS OF
THE PRIVATE LABEL
MARKET
7
DEMOGRAPHICS 8-9
INSIDE CANADA’S PRIVATE 9-11
WHAT’S IN IT FOR SMALL- TO-MEDIUM-SIZED
11-12
FUTURE OF PRIVATE LABEL 12-13
KEY RESOURCES 14
Global Private Label Trends
Globalization of the agri-food industry has led to an increasingly complex marketplace. The consolidation and expansion of retail chains has had a significant impact on consumers, manufacturers and producers alike. This movement has given consumers tens of thousands of products to choose from, resulting in both unprecedented convenience and confusion. For manufacturers and producers, the result has been increased pressure and competition. While the retail landscape is vast, offering a wide range of products among categories, there is a distinct divide between national and retail-owned products. Traditionally, retail or private label brand products have been inexpensive generic products. However, over time they have evolved to become increasingly competitive with national brands. The purpose of this report is to highlight private label growth on the global stage. By examining private label products, markets and consumers, it is evident that this sector provides various opportunities for small and medium-sized enterprises (SMEs). The consolidation and expansion of the retail industry, in addition to the recent economic downturn, has created a spike in the creation of private label products, as well as the demand for these products This report aims at helping SMEs better understand what private label products are, how they evolved, who buys them, what categories have experienced success or failure, and the benefits and burdens of producing and manufacturing for private label retailers.
Private label products—commonly referred to as name brand, store brand, own label, retailer brand or generics—are brands owned by the retailer rather than the producer or manufacturer. Private label products are found in almost all food and beverage categories. For some food categories, products have been repackaged or otherwise prepared in-store to expand product offerings, especially within the fresh produce category (such as bagged salads and fruit trays).
DEFINITION OF PRIVATE LABEL

PAGE 3
More recently, retailers have been aligning private label brands with identified consumer trends, such as premium and indulgence, everyday value, health and wellness, and organic and ethical (Collins & Bone, 2008) (Figure 1).In some cases, private label brands are purchased through a wholesale buying club, giving retailers shared rights to a particular brand. Figure 1 Private Label Shopping Trends in Food and Non-Alcoholic Beverages
Source: Collins, K. and Bone, D. (Datamonitor, November 2008)
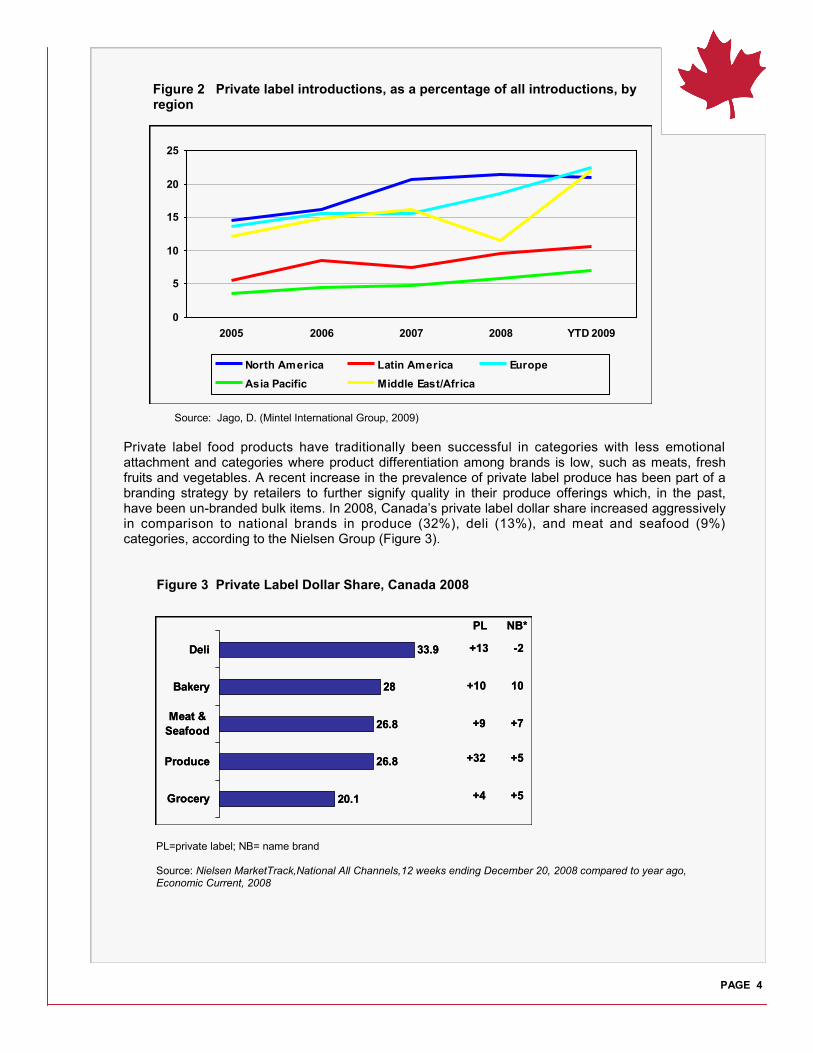
The private label industry is approaching US$1 trillion in sales annually and, as the recession of 2008-09 deepened, experienced spikes in sales and product introductions (Collins & Bone, 2008). The largest markets for private label food and beverage products are found primarily in North America and Europe. Canada‟s private label sales were estimated at CAD$10.9 billion in 2009 and were representative of 19% of the total market share for food and beverage products (Strauss, 2009). In 2007, private label spending in the United States (U.S.) reached just over US$94 billion and European Union (E.U.) spending reached over US$365 billion (Collins & Bone, 2008). Figure 2, which illustrates private label introductions as a percentage of all product introductions for major geographic regions over the 2005-2009 (year-to-date) period, shows greatest penetration in North America and Europe and, in 2008-2009, in the Middle East/Africa. Developing countries are also being increasingly exposed to private label through retail expansion and are becoming more aware of its benefits. However, social stigma remains a barrier to private label growth in developing countries, especially in China, India, and Malaysia where private label penetration rates remain low (Collins & Bone, 2008). Famous brand-name products signify class and status among many consumers and, as average incomes grow, national brands become more affordable, leading to greater demand. Conversely, consumers in the United Kingdom (U.K.) and most other European consumers put relatively little importance on brand image and these countries have one of the largest private label penetration rates in the world (Collins & Bone, 2008). Early placement of private label products in emerging markets might better position firms for success as the popularity of brand image changes over time and food is no longer deemed a status item.
SIZE AND SCOPE
PAGE 4
Figure 2 Private label introductions, as a percentage of all introductions, by region Source: Jago, D. (Mintel International Group, 2009)
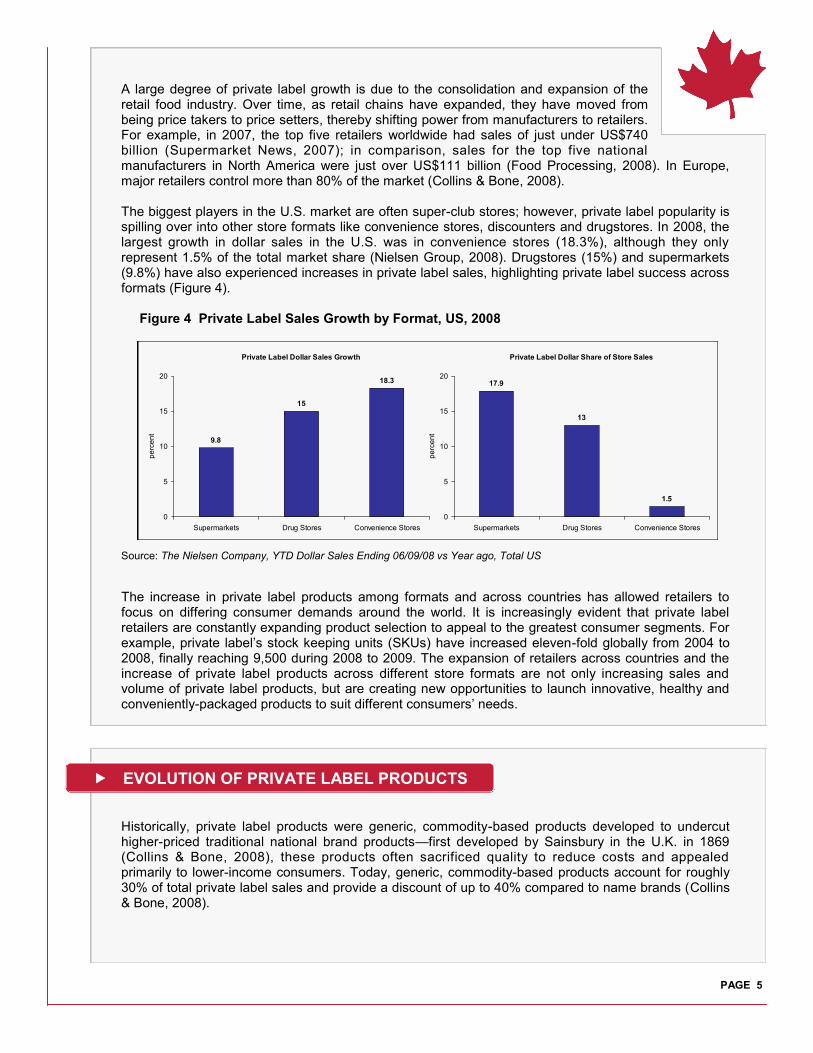
Private label food products have traditionally been successful in categories with less emotional attachment and categories where product differentiation among brands is low, such as meats, fresh fruits and vegetables. A recent increase in the prevalence of private label produce has been part of a branding strategy by retailers to further signify quality in their produce offerings which, in the past, have been un-branded bulk items. In 2008, Canada‟s private label dollar share increased aggressively in comparison to national brands in produce (32%), deli (13%), and meat and seafood (9%) categories, according to the Nielsen Group (Figure 3). Figure 3 Private Label Dollar Share, Canada 2008 PL=private label; NB= name brand Source: Nielsen MarketTrack,National All Channels,12 weeks ending December 20, 2008 compared to year ago, Economic Current, 2008
0
5
10
15
20
25
2005 2006 2007 2008 YTD 2009
North America Latin America Europe
Asia Pacific Middle East/Africa
20.1
26.8
26.8
28
33.9
Grocery
Produce
Meat &
Seafood
Bakery
Deli
PL NB*
+13 -2
+10 10
+9 +7
+32 +5
+4 +5 20.1
26.8
26.8
28
33.9
Grocery
Produce
Meat &
Seafood
Bakery
Deli
PL NB*
+13 -2
+10 10
+9 +7
+32 +5
+4 +5
PAGE 5
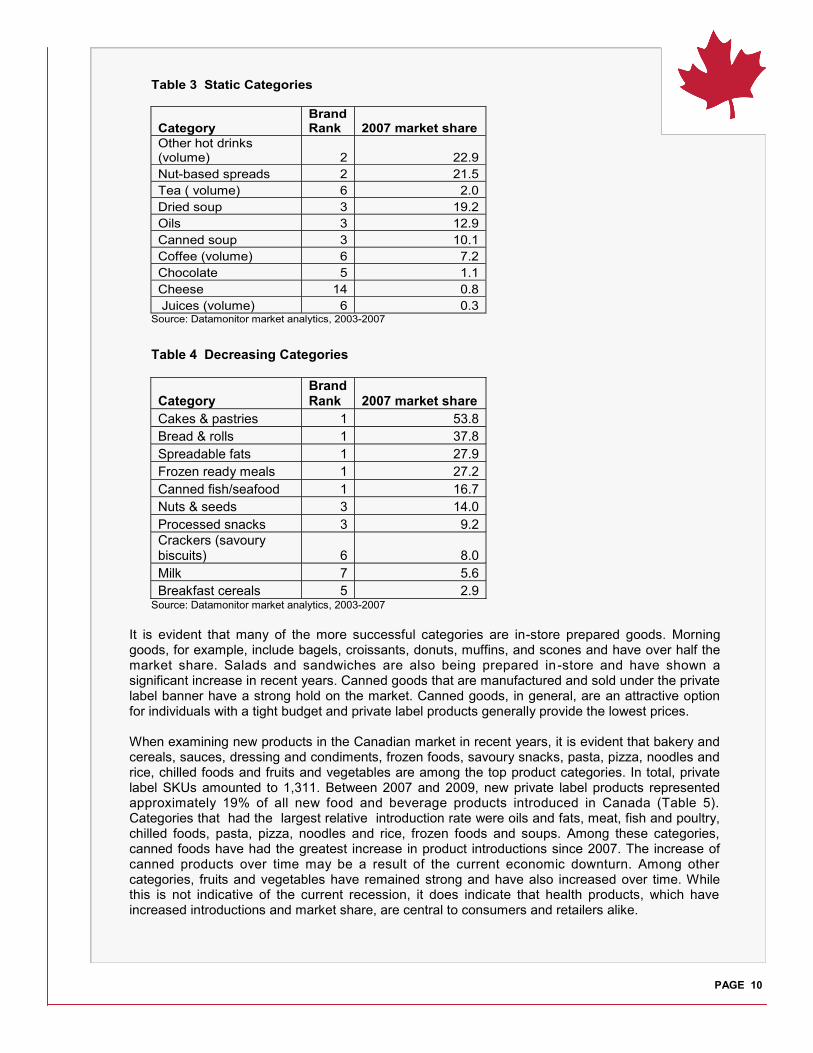
A large degree of private label growth is due to the consolidation and expansion of the retail food industry. Over time, as retail chains have expanded, they have moved from being price takers to price setters, thereby shifting power from manufacturers to retailers. For example, in 2007, the top five retailers worldwide had sales of just under US$740 billion (Supermarket News, 2007); in comparison, sales for the top five national manufacturers in North America were just over US$111 billion (Food Processing, 2008). In Europe, major retailers control more than 80% of the market (Collins & Bone, 2008). The biggest players in the U.S. market are often super-club stores; however, private label popularity is spilling over into other store formats like convenience stores, discounters and drugstores. In 2008, the largest growth in dollar sales in the U.S. was in convenience stores (18.3%), although they only represent 1.5% of the total market share (Nielsen Group, 2008). Drugstores (15%) and supermarkets (9.8%) have also experienced increases in private label sales, highlighting private label success across formats (Figure 4). Figure 4 Private Label Sales Growth by Format, US, 2008
Source: The Nielsen Company, YTD Dollar Sales Ending 06/09/08 vs Year ago, Total US
The increase in private label products among formats and across countries has allowed retailers to focus on differing consumer demands around the world. It is increasingly evident that private label retailers are constantly expanding product selection to appeal to the greatest consumer segments. For example, private label‟s stock keeping units (SKUs) have increased eleven-fold globally from 2004 to 2008, finally reaching 9,500 during 2008 to 2009. The expansion of retailers across countries and the increase of private label products across different store formats are not only increasing sales and volume of private label products, but are creating new opportunities to launch innovative, healthy and conveniently-packaged products to suit different consumers‟ needs.
Historically, private label products were generic, commodity-based products developed to undercut higher-priced traditional national brand products—first developed by Sainsbury in the U.K. in 1869 (Collins & Bone, 2008), these products often sacrificed quality to reduce costs and appealed primarily to lower-income consumers. Today, generic, commodity-based products account for roughly 30% of total private label sales and provide a discount of up to 40% compared to name brands (Collins & Bone, 2008).
Private Label Dollar Sales Growth
9.8
15
18.3
0
5
10
15
20
Supermarkets Drug Stores Convenience Stores
pe
rce
nt
Private Label Dollar Share of Store Sales
17.9
13
1.5
0
5
10
15
20
Supermarkets Drug Stores Convenience Stores
pe
rce
nt
EVOLUTION OF PRIVATE LABEL PRODUCTS

PAGE 6
In the 1980s, retail copy brands or mimics were introduced and now represent the bulk of private label sales. Retail copy brands represent upwards of 50% of private label sales and offer a discount range between 20 and 30% in comparison to leading brands. These products aim to provide value by producing similar products of comparable quality at lower prices. The ability to offer value alternatives has been a key positioning strategy for retailers to promote both store brand quality and value in efforts to gain consumers‟ trust and loyalty. The first value brand was Tesco‟s Value range, launched in 1995; today, it includes over 2,000 products in food and non-food categories (Collins & Bone, 2008). Other retailers quickly followed suit creating their own value lines. For example, Sainsbury created Essentials, later renamed Basics, and Wal-Mart created Coles Smart Buy (Collins & Bone, 2008). Figure 5 A Continuum of Private Label Development
Source: Collins, K. and Bone, D. (Datamonitor, November 2008)
In the 1990s, retailers started developing sophisticated tiered product offerings. The development of innovative premium products has recently been part of the tiered approach, targeting consumers who demand high-quality products and are willing to pay a higher price (Ipsos Reid, 2008). The development of products with high quality ingredients, great taste, health-related benefits or reduced levels of salt and fat has helped capture the premium consumer segment. Premium private label products account for 20% of total private label sales and offer a discount range of 10 to 20% in relation to leading brands. This product type is redefining private label perception by highlighting quality and is often tailored to meet emerging consumer trends. Figure 5 illustrates the continuum of private label development from generic products to innovation leaders/destination brands. The tiered system has been essential to expanding the appeal of private label products and the breadth of product offerings. This system has built trust and loyalty among consumers by providing a variety of products that meet individual consumer price and quality standards. Today, retailers have further developed their product offerings by introducing specialty sub-brands that respond to specific consumer trends. For example, President‟s Choice offers three distinct, specialty product lines, Blue Menu (Health and Wellness), Organics (quality/health/environment) and Mini Chiefs (Children 5-10/Nutrition).
Private label
players adopt
different
approaches
depending on
whether the
strategy is
geared towards
differentiation
or low pricing
LEVEL 3
Tiered Product
Offerings Across
Differing Price
Points
Specialist sub-brands, such as Boot’s Expert
line of private label personal care
LEVEL 4
Total Category
Management and
Innovation Leaders.
‘Destination brands ’
Offering new or unique
credentials that create
reasons to come to a store;
e.g. Kroger’s Private
Selections brand that
includes some original
formulations for which there are no branded alternatives
LEVEL 2
Own label entry
& Stand Alone
Retailer Brands
Bearing the name of
the retail store,
comparable
on quality and price
LEVEL 1
Generic Low
Cost Alternatives
& Me Too
Imitations
No frills substitutes
to everyday famous
brands. Evolving from unknown
brands in the 1970s
Accounts for a lesser share of sales and a
lesser amount of time and investment
Accounts for higher share of sales but
requires more time and investment
Differentiation strategyLow price strategy

PAGE 7
The ability to create products in line with consumers‟ health or lifestyle objectives makes product choice easy. Blue menu, for example, appeals to individuals who are seeking
healthier alternatives to their tradit ional food choices. Creating an easily dif ferent iated product l ine and positioning it against less healthy products highlights the line‟s health benefits and captures health-oriented consumers‟ attention. Private label also offers retailers the ability to create products in line with their corporate identity. For example, as illustrated on the left, Schwarz‟s Lidl was the first large discount retailer to develop its own fair-trade private label (Queck, 2008).
Analysis conducted by Datamonitor revealed that the private label market is affected by a broad range of drivers and inhibitors as summarized in Figure 6. One of the most important drivers of private label penetration growth in many markets is the heightened level of grocery retail concentration (Collins & Bone, 2008). Figure 6 Drivers and Inhibitors of the Private Label market
DRIVERS AND INHIBITORS OF THE PRIVATE LABEL MARKET
Source: Queck,M. (Planet Retail, 2008)
Consumers are on a constant
search for price-led value, and are
actively seeking out new formats to
achieve a better price.
The growing power and influence of
larger retailers as distribution
becomes more concentrated.
Changing shopping patterns which
helps to boost private label brand
familiarity.
The failure of famous brand industry
players to successfully differentiate
their offerings and capture
shoppers’ imagination.
The relatively low influence of brand
image on product choice.
Marketing difficulties.
Consumer perception and
independent studies indicating that
private label products are just as
good – if not better – than famous
brand equivalents.
Expanding availability.Private label products (especially
the discount brands) are often
comparatively easy to identify
thereby facilitating ‘speed shopping’
and providing consumers with
quality assurance.
The potential loss of consumer
choice (in certain categories) where
fewer options already exist.
Private label overload making the
grocery arena a less inspiring
destination.
Famous brands could make gains
in an improved economy, with
consumers switching back to
traditional labels.
Low awareness and acceptance of
private labels in emerging markets
could prevent penetration growth.
Criticism levied towards major
retailers towards the poor quality of
brands (whether nutritional,
efficacy, etc).
Private label appeals to consumers’
desire to simplify and focus on what
really matters.
Private label is entering
a critical era
DRIVERS DRIVERS
INHIBITORS INHIBITORS
Source: Collins, K. and Bone, D. (Datamonitor, November 2008)

PAGE 8
Gender There is indication that gender generally has no influence on private label purchases. However, women, on average, put an increased emphasis on the image of national brands; conversely, men expect well-known brands to cost more and put less emphasis on the image of national brands (Adams, 2005). Age While younger individuals have a generally accepting attitude toward private label products, image has a greater influence on their purchasing decisions. This has led to the success of national brands in capturing market share for consumers 18 to 24 years of age (Figure 7). In 2006, this age group had the lowest rate of purchase of private label (12.7%) compared to other groups. In 2006, 69.5% of younger consumers purchased more national brand products than private label. Early mid-lifers (those 25 to 34 years of age) are generally heavier national brand consumers, with 64.6% purchasing more national brands than private label. Conversely, 16.9% of this group purchased more private label than national brands. The late mid-lifers and seniors link private label with economy-priced products because of its historical relationship with budget brands. Although this group traditionally associates private label with lower-cost goods, they still have a higher frequency of private label purchases than any other group. Perhaps with age, image and advertising are less influential and older consumers see the functionality and quality of foods as a more important determinant of purchases. This coincides with the current stage of private label evolution in which retailers focus on providing quality and positioning products in line with consumer trends.
Figure 7 Private Label Consumption, by Age Group
PL=private label; NB= name brand Source: Collins & Bone, 2008.
DEMOGRAPHICS
37.5
32
17.8
8.7
4
40.6
24.6
17.9
9.6
7.3
32
27.2
21.5
13.7
5.6
Frequent NB
purchasers
Moderate NB
purchasers
Almost equal Moderate PL
purchasers
Frequest PL
purchasers
18-24 25-34 Late Midlifers/Seniors

PAGE 9
Income Income level has a major influence on the shopping habits of individuals around the world. While incomes vary from country to country, shopping habits are very similar for money-strapped consumers. Price sensitivity among this group remains high as food prices increase, and has resulted in consumers trading down or finding substitutes for their traditional foods. A 2005 U.S. study examined food consumption behaviour among different socioeconomic groups in relation to private label and national brand purchases. It found that lower -income consumers purchased lower-priced private label goods more often. In addition, lower-income consumers, when purchasing national brand products, often selected either larger package sizes or promotional products (Akbay & Jones, 2005).
In 2006, Datamonitor (2008) found that consumers, regardless of income level, have been trading down, increasing private label consumption and giving up their favourite brands to respond to the deteriorating economic condition. It was found that lower-income individuals were trading down more vigorously, but even consumers with annual incomes above US$100,000 were also changing consumption habits to reduce spending (Table 1).
In Canada, private label products are found almost everywhere; however, their success is unpredictable in many cases. Market share data provided by Datamonitor shows a picture of the successes and failures across categories. From 2003 to 2007, there were 23 growth categories, 10 static categories and 10 declining categories. Private label market share ranged from a high of 53% to a low of 0.3% (Tables 2, 3, 4).
Table 1 Purchasing Changes by Income
% of consumers who have made changes over the past 6 months by income
Less than $35K $35-54.9K $55-99.9K $100K+ Total
Try lower-priced brands 62% 55% 46% 35% 50%
Buy more private label 58% 58% 47% 31% 50%
Give up favourite brands 58% 52% 38% 19% 42% Source: Datamonitor, IRI Times & Trends (2008) Competing in a Transformed Economy, May 2008
INSIDE CANADA’S PRIVATE LABEL MARKET
Table 2 Top 10 categories of increasing market share (value)
Category Brand Rank
2007 market share
Morning goods 1 52.7
Concentrates (volume) 1 50.9
Canned meat products 1 46.9
Canned fruit 1 46.2
Sandwiches/salads 1 32.5
Deli food 2 32.4
Chilled meat products 1 31.3
Chilled ready meals 1 31.3
Canned vegetables 1 27.5
Popcorn 2 26.5 Source: Datamonitor market analytics, 2003-2007
PAGE 10
It is evident that many of the more successful categories are in-store prepared goods. Morning goods, for example, include bagels, croissants, donuts, muffins, and scones and have over half the market share. Salads and sandwiches are also being prepared in-store and have shown a significant increase in recent years. Canned goods that are manufactured and sold under the private label banner have a strong hold on the market. Canned goods, in general, are an attractive option for individuals with a tight budget and private label products generally provide the lowest prices. When examining new products in the Canadian market in recent years, it is evident that bakery and cereals, sauces, dressing and condiments, frozen foods, savoury snacks, pasta, pizza, noodles and rice, chilled foods and fruits and vegetables are among the top product categories. In total, private label SKUs amounted to 1,311. Between 2007 and 2009, new private label products represented approximately 19% of all new food and beverage products introduced in Canada (Table 5). Categories that had the largest relative introduction rate were oils and fats, meat, fish and poultry, chilled foods, pasta, pizza, noodles and rice, frozen foods and soups. Among these categories, canned foods have had the greatest increase in product introductions since 2007. The increase of canned products over time may be a result of the current economic downturn. Among other categories, fruits and vegetables have remained strong and have also increased over time. While this is not indicative of the current recession, it does indicate that health products, which have increased introductions and market share, are central to consumers and retailers alike.
Table 3 Static Categories
Category Brand Rank 2007 market share
Other hot drinks (volume) 2 22.9
Nut-based spreads 2 21.5
Tea ( volume) 6 2.0
Dried soup 3 19.2
Oils 3 12.9
Canned soup 3 10.1
Coffee (volume) 6 7.2
Chocolate 5 1.1
Cheese 14 0.8
Juices (volume) 6 0.3 Source: Datamonitor market analytics, 2003-2007
Table 4 Decreasing Categories
Category Brand Rank 2007 market share
Cakes & pastries 1 53.8
Bread & rolls 1 37.8
Spreadable fats 1 27.9
Frozen ready meals 1 27.2
Canned fish/seafood 1 16.7
Nuts & seeds 3 14.0
Processed snacks 3 9.2
Crackers (savoury biscuits) 6 8.0
Milk 7 5.6
Breakfast cereals 5 2.9 Source: Datamonitor market analytics, 2003-2007

PAGE 11
Private label products not only provide consumers with a variety of competitive products of good quality, but also offer a unique opportunity for producers and manufacturers to take advantage of this growing trend. Retail Consolidation and Expansion The retail food industry is expanding and entering different geographical markets. Producing or manufacturing private label products for major retailers provides a consistent and stable demand for products of different variety and quality. Taking advantage of retailers‟ expansionary trends will further allow SMEs to expand production capacity and provide stable revenues, especially in categories with high SKU proliferation (Table 5). Categories of high SKU proliferation generally have a large assortment of products with relatively smaller volumes in comparison to categories of SKU contraction. Larger manufacturers are often volume-driven and will not change production lines to fill small volume orders. This provides an opportunity for SMEs to pick up smaller volume orders and build credibility among retailers.
WHAT’S IN IT FOR SMALL-TO-MEDIUM-SIZED ENTERPRISES?
Table 5 Private Label Penetration Rate Among New Products (2007-2009)
Category
Private Label % by
Category Category
# of SKUs
Oils and Fats 41% Bakery and Cereals 240
Meat, Fish and Poultry 32% Sauces, Dressing and Condiments 161
Chilled Foods 31% Frozen Foods 117
Pasta, Pizza, Noodles and Rice 29% Savoury Snacks 112
Frozen Foods 27% Pasta, Pizza, Noodles and Rice 95
Soups 23% Chilled Foods 88
Canned Food 23% Fruit and Vegetables 79
Bakery and Cereals 22% Dairy 71
Fruit and Vegetables 22% Meat, Fish and Poultry 64
Savoury Snacks 20% Canned Food 62
Sauces, Dressing and Condiments 18% Confectioneries 47
Desserts 18% Dried Foods 47
Dried Foods 17% Soups 37
Dairy 16% Baby Food 31
Ice Cream 16% Ice Cream 17
Baby Food 13% Sweet and Savoury Spreads 17
Sweet and Savoury Spreads 6% Oils and Fats 16
Confectioneries 5% Desserts 10 Source: Datamonitor, Product Launch Analytics

PAGE 12
No Advertising Costs By teaming up with retailers, manufacturers and producers can virtually eliminate marketing and advertising costs. Retailers are becoming more advanced and are using in-store advertising and promotions to provide customer incentives to increase private label or store brand purchases. Listing or shelving costs, which are normally an expense for manufacturers, are absorbed by retailers when products are branded by the retailer. Customer reward plans, coupon booklets, credit cards, and in-store samples are just a few things retailers are doing to capture consumers‟ attention. Technology Retailers are becoming more efficient because of advancements in in-store technologies. Electric „point of sale‟ software and detailed barcodes allow retailers to plan, track and organize inventory in a quick and easy manner (Adams, 2005). Manufacturers and producers benefit indirectly from this advancing technology as in-store tracking mechanisms become more sophisticated. Inventory is instantly tracked, allowing retailers to know exactly when new orders should be placed. This gives private label manufacturers more accurate information for forecasting production, as well as better control over their inventory, and allows them to meet strict production and delivery deadlines. In-store data provides detailed information on categories and frequency of purchase that can be linked to sales‟ promotions, consumer trends, and media attention, thereby providing insight into future sales patterns. This may lead retailers to share their findings with manufacturers and producers, enabling them to conduct research and development and tweak products in order to maintain or grow sales. The addition of reward systems provides valuable information that allows retailers to match consumer characteristics (age, location, income, gender and background) with purchases. This provides detailed and accurate information on the new and developing purchasing patterns that are most likely to lead to product innovation and expansion and provide further opportunities for SMEs. Reducing Risk Many national brand manufacturers are using private label contracts to fill excess plant capacity. Private label development provides manufacturers and producers with the opportunity to maintain higher levels of production, while creating diversity and reducing risks. Retailers do not provide as high a marginal return for producing their products, but they do decrease advertising and shelving costs and provide stability in poor economic times. By having both national and private label brands, manufacturers and producers are able to take advantage of demand spikes in business cycle fluctuations and hedge risks. However, private label contracts can sometimes take up the majority of production capacity which creates the risk of having only one buyer. Moreover, retailers are constantly trying to lower costs and, therefore, pay manufacturers less. It is also easy to be undercut and lose contracts that may be essential to a small or medium-sized company‟s plant capacity. Finally, retailers have full control of their brands, which gives manufacturers no recognition among consumers. It is crucial to shield against these risks by negotiating contracts over a longer period of time and maintaining relationships with multiple buyers.
Private label has experienced considerable growth in the last decade, both in size and scope. As retailers expand into new countries and develop more of their own private label products, national brands will face increased pressure to reduce costs and differentiate their product offerings. The current recession provides an opportunity for private label growth by capturing money-strapped or risk-averse consumers.
FUTURE OF PRIVATE LABEL

PAGE 13
While national brands can use an emotional connection with consumers to maintain loyalty in poor economic times, they have found it increasingly difficult to convince consumers that their products are worth the extra cost. As private label products have moved from generic staple-based products to today‟s premium and innovative products, they have had increased appeal across demographic groups and geographic regions. While tomorrow‟s private label market is rather uncertain, current consumer trends will continue to evolve and shape demand for these products. A study by The Hartman Group (2006) found that “when consumers take into consideration essential elements of purchase decision-making (quality, value, price, taste, appearance, etc.,) the gap between private label and name brands has definitely closed. As Figure 8 illustrates, only 5% of consumers believe private label products are “inferior” to name brands. When asked how private label compares to name brands, one-third (33%) of consumers saw absolutely no difference, while half (49%) of consumers believe that private label is close to name brands.”
As baby boomers reach retirement age, greater demand for products geared toward specific health-related concerns will begin to drive growth in health and wellness food and beverage products. As high blood pressure, diabetes and heart disease become even more prevalent, consumers will seek differentiated product lines aimed at controlling and easing these kinds of health problems, while providing selection, quality, and great taste at a reasonable price. Innovation in health food products will be the key to capturing the attention of aging baby boomers, helping them to slow aging and prevent illness through targeted food products. While health and wellness is a top issue among older consumers, younger consumers are becoming increasingly aware of other issues that affect their lives today. The introduction of ethical and environmental consumerism is a growing trend as consumers become more aware of production processes and their social impacts. Packaging that reduces consumers‟ carbon footprint and, in some cases, reduces production costs, will continue to garner attention. Products, in general, are becoming more and more multifaceted and innovative — using the latest technologies and focusing on both functional benefits (such as quality, convenience and health) and psychological needs (ethical and environmental concerns product image and brand perception). These trends will shape the evolution of private label products in the years to come.
Figure 8 Closing the Gap: How Similar are Private Labels to National Brands? NB= name or national brand Source: The Hartman Group (2006)
2
5
11
33
49
Superior to NB
Inferior to NB
Better than NB
Identical, no
difference
Close, but not
as good as NB
percent

PAGE 14
Adams, M. (December 2005). How to resist the private label threat in 2006: Strategies for retaining consumer loyalty to famous brands. Datamonitor, New Consumer Insight Series Akbay, C. and Jones, E. (2005). Food consumption behaviour of socioeconomic groups for private labels and national brands. Food Quality and Preference, 16, 7: 621-631. Burton, S. et al. (1998). A scale for measuring attitudes toward private label products and an examination of its psychological and behavioural correlations. Journal of the Academy of Marketing Science, 26, 4 : 293-306. Ipsos Reid. (March, 2008). Emerging consumer demand for premium foods and beverages in Canada: Literature review. Prepared for the Canadian Council of Grocery Distributors, Saint John, NB. Collins, K. and Bone, D. (November 2008). Private label shopping trends in food and non-alcoholic beverages: Effectively targeting value conscious shoppers and understanding consumers’ attachment to food and drink brands. Datamonitor, New Consumer Insight Series. Food Processing. Top 100 . (August 2008). Retr ieved December 2009 f rom http:/ /www.foodprocessing.com/Media/MediaManager/FPTop100_2008.pdf Hartman Group, the. (2006). Pulse report: Private label from a consumer perspective. Information Resources, Inc (IRI). (May 2008). Competing in a transforming economy, special report: executive summary. Times & Trends: A snapshot of trends shaping the CPG and retail industries. Jago, D. (June 2009). Private label. Mintel International Group, GNPD Live trends Webinar. Nielsen Group, the. (February 2009). Economic Current, A Canadian Perspective. Nielsen Group, the. (06/09/2008). US Private Label Dollar Sales Growth. Queck, Mathias. (June 2008). Discounters as private label drivers. Planet Retail Ltd Retrieved August 2009 from www.elelmiszer.hu/download.php?id=112 Strauss, M. (March 21, 2009). (Re)making a name in no name. The Globe and Mail. Supermarket News. (May 26, 2008). Top 25 global retailers. Retrieved August 2009 from http://supermarketnews.com/global-retailers/
KEY RESOURCES

Global Private Label Trends © Her Majesty the Queen in Right of Canada, 2010 ISSN 1920-6593 Market Analysis Report AAFC No. 11184E Photo Credits All Photographs reproduced in this publication are used by permission of the rights holders. All images, unless otherwise noted, are copyright Her Majesty the Queen in Right of Canada.
For additional copies of this publication or to request an alternate format, please contact: Agriculture and Agri-Food Canada 1341 Baseline Road, Tower 5, 4th floor Ottawa, ON Canada K1A 0C5 E-mail: [email protected]
Aussi disponible en français sous le titre : Les marques maison : tendances mondiales
The Government of Canada has prepared this report based on primary and secondary sources of information. Although every effort has been made to ensure that the information is accurate, Agriculture and Agri-Food Canada assumes no liability for any actions taken based on the information contained herein.