global & regional m&a report q1 2018 - s3.eu-west-2 ... · market shares in global m&a...
TRANSCRIPT
Finding the opportunities in mergers and acquisitions
Global & Regional M&A Report Q1 2018Including League Tables of Financial Advisors
An Acuris Company
mergermarket.com
Content
Overview 03
Global 04
Europe 09
US 14
Latin America 19
AsiaPacific (excl. Japan) 24
Japan 29
Middle East & Africa 34
M&A and PE League Tables 39
Criteria & Contacts 74
An Acuris Company
mergermarket.com
mergermarket.com
28.8%
48.8% 16.8%
1.6%
1.0%
3.0%
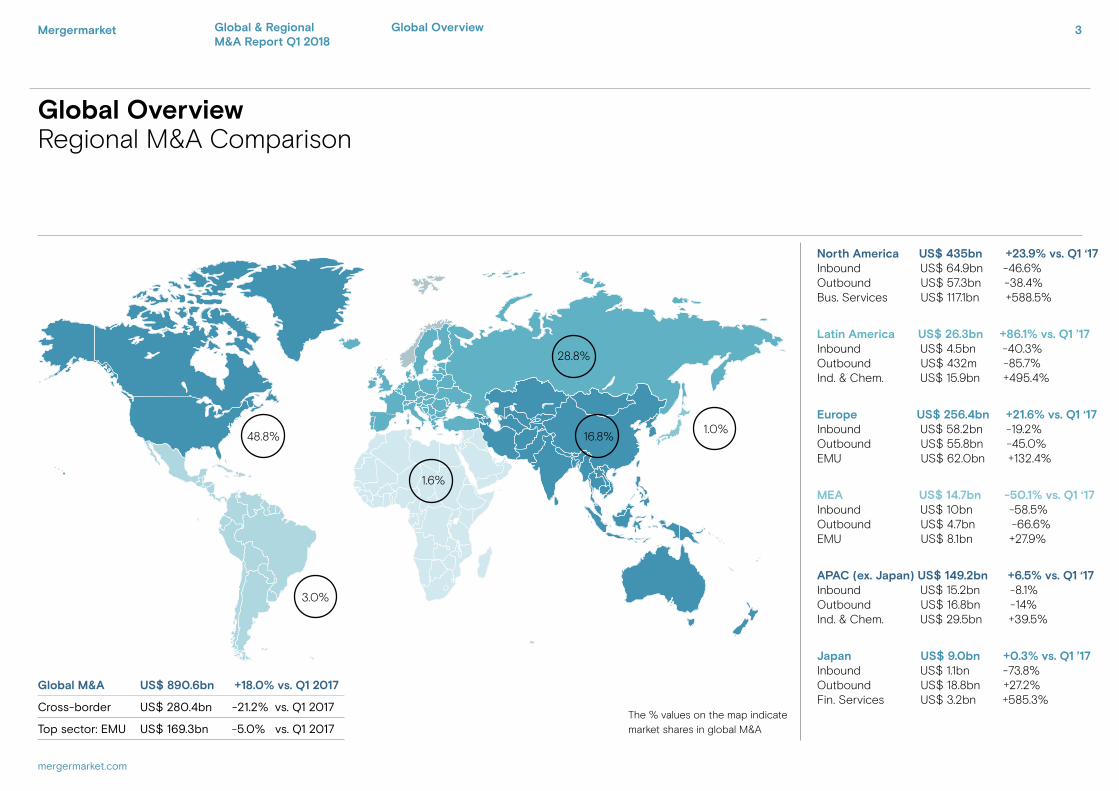
MEA US$ 14.7bn -50.1% vs. Q1 ‘17 Inbound US$ 10bn -58.5% Outbound US$ 4.7bn -66.6%EMU US$ 8.1bn +27.9%
Europe US$ 256.4bn +21.6% vs. Q1 ‘17 Inbound US$ 58.2bn -19.2% Outbound US$ 55.8bn -45.0%EMU US$ 62.0bn +132.4%
Latin America US$ 26.3bn +86.1% vs. Q1 ’17 Inbound US$ 4.5bn -40.3% Outbound US$ 432m -85.7%Ind. & Chem. US$ 15.9bn +495.4%
North America US$ 435bn +23.9% vs. Q1 ‘17 Inbound US$ 64.9bn -46.6% Outbound US$ 57.3bn -38.4%Bus. Services US$ 117.1bn +588.5%
APAC (ex. Japan) US$ 149.2bn +6.5% vs. Q1 ‘17 Inbound US$ 15.2bn -8.1% Outbound US$ 16.8bn -14%Ind. & Chem. US$ 29.5bn +39.5%
Global Overview Regional M&A Comparison
Japan US$ 9.0bn +0.3% vs. Q1 ’17 Inbound US$ 1.1bn -73.8% Outbound US$ 18.8bn +27.2%Fin. Services US$ 3.2bn +585.3%
The % values on the map indicate market shares in global M&A
Global M&A US$ 890.6bn +18.0% vs. Q1 2017
Cross-border US$ 280.4bn -21.2% vs. Q1 2017
Top sector: EMU US$ 169.3bn -5.0% vs. Q1 2017
Mergermarket 3Global OverviewGlobal & Regional M&A Report Q1 2018

4Mergermarket
mergermarket.com
Number of megadeals
(> US$ 10bn) announced in Q1
Increase in value from
Q1 2017 to Q1 2018
1418%
Value of M&A in Q1 2018, the strongest start to the year on
Mergermarket record (since 2001)
US$ 890.6bn
Global
Value (US$bn)
Deal details
Announce-ment date
Bidder company Target company Target geography
Target sector
67.9 8-Mar Cigna Corporation Express Scripts Holding Company
USA Business Services
46.6 12-Mar E.ON SE innogy SE Germany Energy, Mining & Utilities
39.6 23-Mar Consortium formed by ACS SA, Atlantia SpA and Hochtief AG
Abertis Infraestructuras SA
Spain Construction
26.6 26-Mar Brookfield Property Partners LP
General Growth Properties Inc(65.86% Stake)
USA Real Estate
23.1 29-Jan Keurig Green Mountain Inc
Dr Pepper Snapple Group Inc
USA Consumer
Mergermarket Global AnalysisGlobal & Regional M&A Report Q1 2018
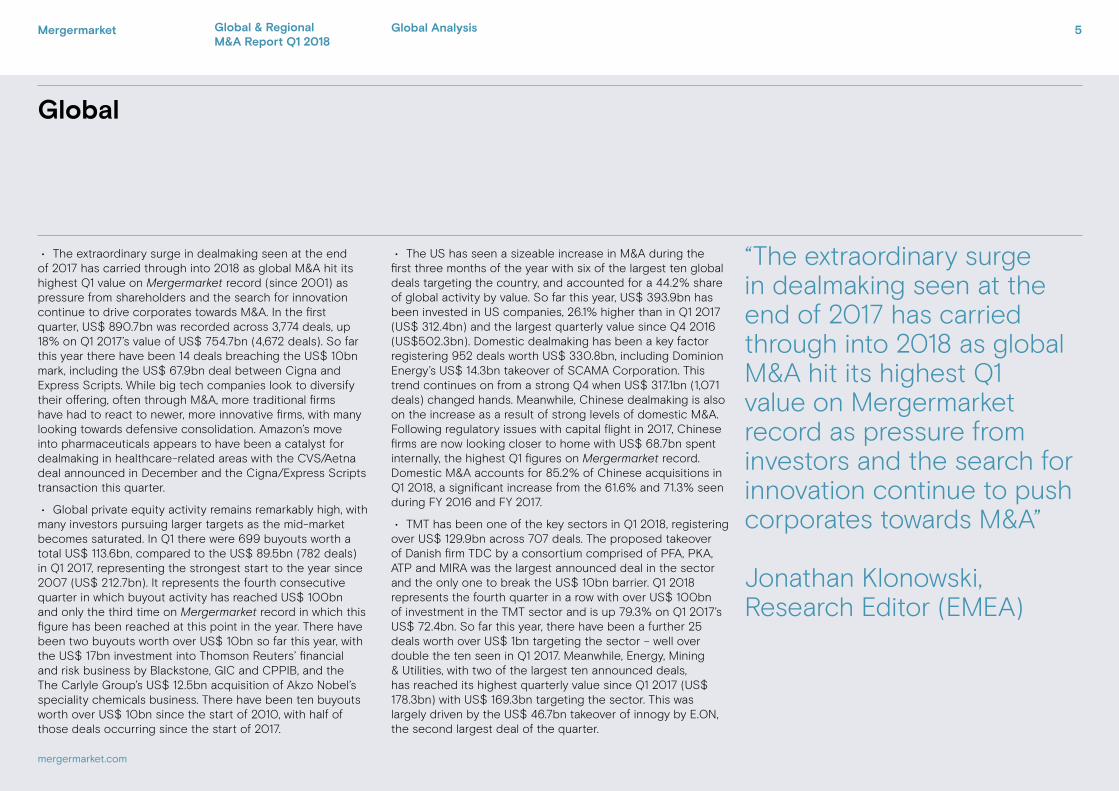
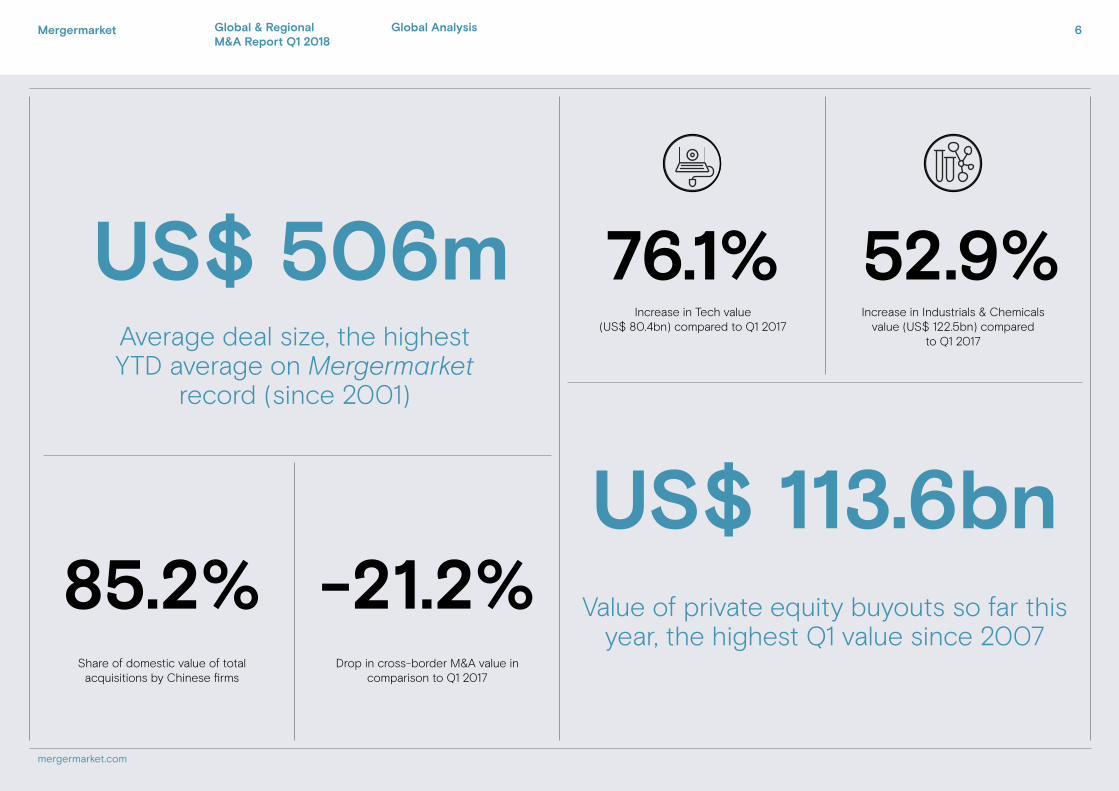
• The extraordinary surge in dealmaking seen at the end of 2017 has carried through into 2018 as global M&A hit its highest Q1 value on Mergermarket record (since 2001) as pressure from shareholders and the search for innovation continue to drive corporates towards M&A. In the first quarter, US$ 890.7bn was recorded across 3,774 deals, up 18% on Q1 2017’s value of US$ 754.7bn (4,672 deals). So far this year there have been 14 deals breaching the US$ 10bn mark, including the US$ 67.9bn deal between Cigna and Express Scripts. While big tech companies look to diversify their offering, often through M&A, more traditional firms have had to react to newer, more innovative firms, with many looking towards defensive consolidation. Amazon’s move into pharmaceuticals appears to have been a catalyst for dealmaking in healthcare-related areas with the CVS/Aetna deal announced in December and the Cigna/Express Scripts transaction this quarter.
• Global private equity activity remains remarkably high, with many investors pursuing larger targets as the mid-market becomes saturated. In Q1 there were 699 buyouts worth a total US$ 113.6bn, compared to the US$ 89.5bn (782 deals) in Q1 2017, representing the strongest start to the year since 2007 (US$ 212.7bn). It represents the fourth consecutive quarter in which buyout activity has reached US$ 100bn and only the third time on Mergermarket record in which this figure has been reached at this point in the year. There have been two buyouts worth over US$ 10bn so far this year, with the US$ 17bn investment into Thomson Reuters’ financial and risk business by Blackstone, GIC and CPPIB, and the The Carlyle Group’s US$ 12.5bn acquisition of Akzo Nobel’s speciality chemicals business. There have been ten buyouts worth over US$ 10bn since the start of 2010, with half of those deals occurring since the start of 2017.
• The US has seen a sizeable increase in M&A during the first three months of the year with six of the largest ten global deals targeting the country, and accounted for a 44.2% share of global activity by value. So far this year, US$ 393.9bn has been invested in US companies, 26.1% higher than in Q1 2017 (US$ 312.4bn) and the largest quarterly value since Q4 2016 (US$502.3bn). Domestic dealmaking has been a key factor registering 952 deals worth US$ 330.8bn, including Dominion Energy’s US$ 14.3bn takeover of SCAMA Corporation. This trend continues on from a strong Q4 when US$ 317.1bn (1,071 deals) changed hands. Meanwhile, Chinese dealmaking is also on the increase as a result of strong levels of domestic M&A. Following regulatory issues with capital flight in 2017, Chinese firms are now looking closer to home with US$ 68.7bn spent internally, the highest Q1 figures on Mergermarket record. Domestic M&A accounts for 85.2% of Chinese acquisitions in Q1 2018, a significant increase from the 61.6% and 71.3% seen during FY 2016 and FY 2017.
• TMT has been one of the key sectors in Q1 2018, registering over US$ 129.9bn across 707 deals. The proposed takeover of Danish firm TDC by a consortium comprised of PFA, PKA, ATP and MIRA was the largest announced deal in the sector and the only one to break the US$ 10bn barrier. Q1 2018 represents the fourth quarter in a row with over US$ 100bn of investment in the TMT sector and is up 79.3% on Q1 2017’s US$ 72.4bn. So far this year, there have been a further 25 deals worth over US$ 1bn targeting the sector – well over double the ten seen in Q1 2017. Meanwhile, Energy, Mining & Utilities, with two of the largest ten announced deals, has reached its highest quarterly value since Q1 2017 (US$ 178.3bn) with US$ 169.3bn targeting the sector. This was largely driven by the US$ 46.7bn takeover of innogy by E.ON, the second largest deal of the quarter.
“The extraordinary surge in dealmaking seen at the end of 2017 has carried through into 2018 as global M&A hit its highest Q1 value on Mergermarket record as pressure from investors and the search for innovation continue to push corporates towards M&A”
Jonathan Klonowski, Research Editor (EMEA)
Global
Mergermarket 5
mergermarket.com
Global AnalysisGlobal & Regional M&A Report Q1 2018
Mergermarket.com
US$ 113.6bnValue of private equity buyouts so far this
year, the highest Q1 value since 2007
Increase in Industrials & Chemicals value (US$ 122.5bn) compared
to Q1 2017
Increase in Tech value (US$ 80.4bn) compared to Q1 2017
52.9%76.1%
Drop in cross-border M&A value in comparison to Q1 2017
-21.2%Share of domestic value of total
acquisitions by Chinese firms
85.2%
Average deal size, the highest YTD average on Mergermarket
record (since 2001)
US$ 506m
Mergermarket 6
mergermarket.com
Global AnalysisGlobal & Regional M&A Report Q1 2018
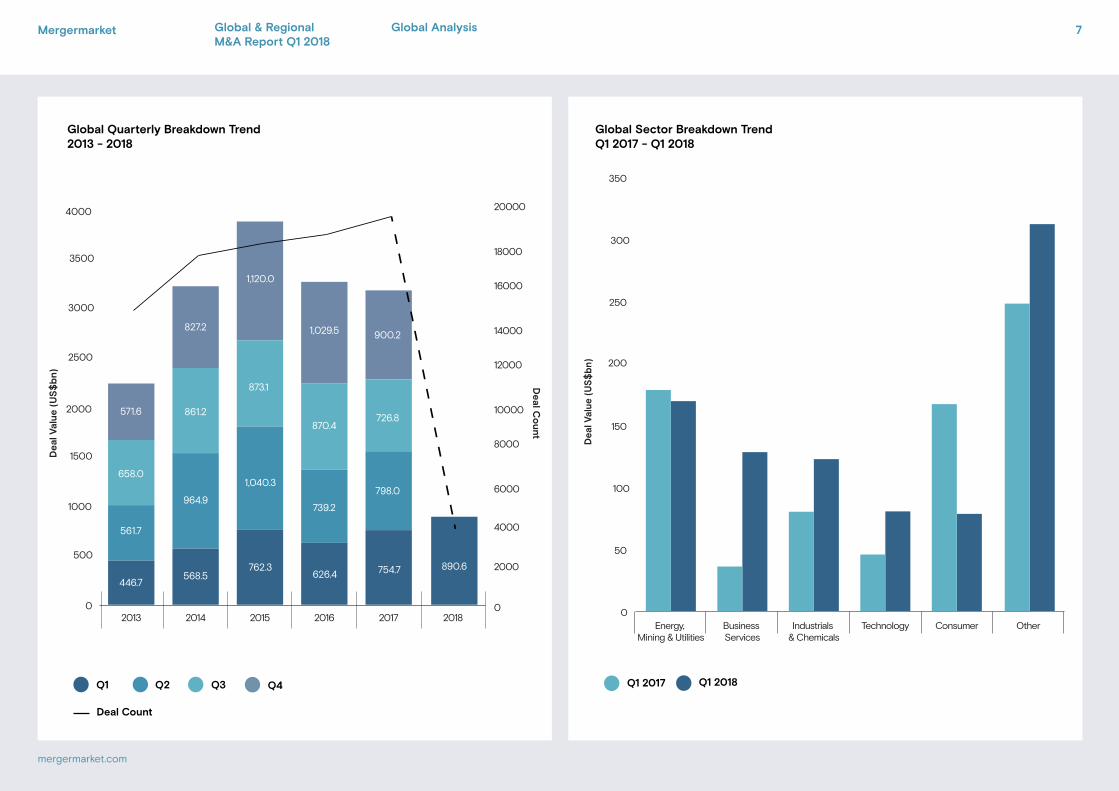
Chart title 1Chart title 2
Chart title 1Chart title 2
0
50
100
150
200
250
300
350
OtherConsumerTechnologyIndustrials & Chemicals
Business Services
Energy, Mining & Utilities
Dea
l Val
ue (
US
$b
n)
Q1 2017 Q1 2018
0
500
1000
1500
2000
2500
3000
3500
4000
2018201720162015201420130
2000
4000
6000
8000
10000
12000
14000
16000
18000
20000
1,120.0
1,040.3
446.7
827.2
861.2
890.6
739.2
870.4
626.4
726.8
Dea
l Val
ue
(US
$b
n)
Deal C
ou
nt
1,029.5 900.2
754.7
798.0
762.3
873.1
964.9
568.5
658.0
571.6
561.7
Q3Q2 Q4Q1
Deal Count
Global Quarterly Breakdown Trend2013 - 2018
Global Sector Breakdown TrendQ1 2017 - Q1 2018
Mergermarket 7
mergermarket.com
Global AnalysisGlobal & Regional M&A Report Q1 2018
Mergermarket 8
mergermarket.com
Global Analysis
Ranking Q1 2018 Q1 2017 Regional ranking comparison
Q1 2018
Q1 2017
Company name Value (US$m)
Deal count
Value (US$m)
% Value change
Europe US Asia Pacific
Japan Middle East & Africa
Latin America
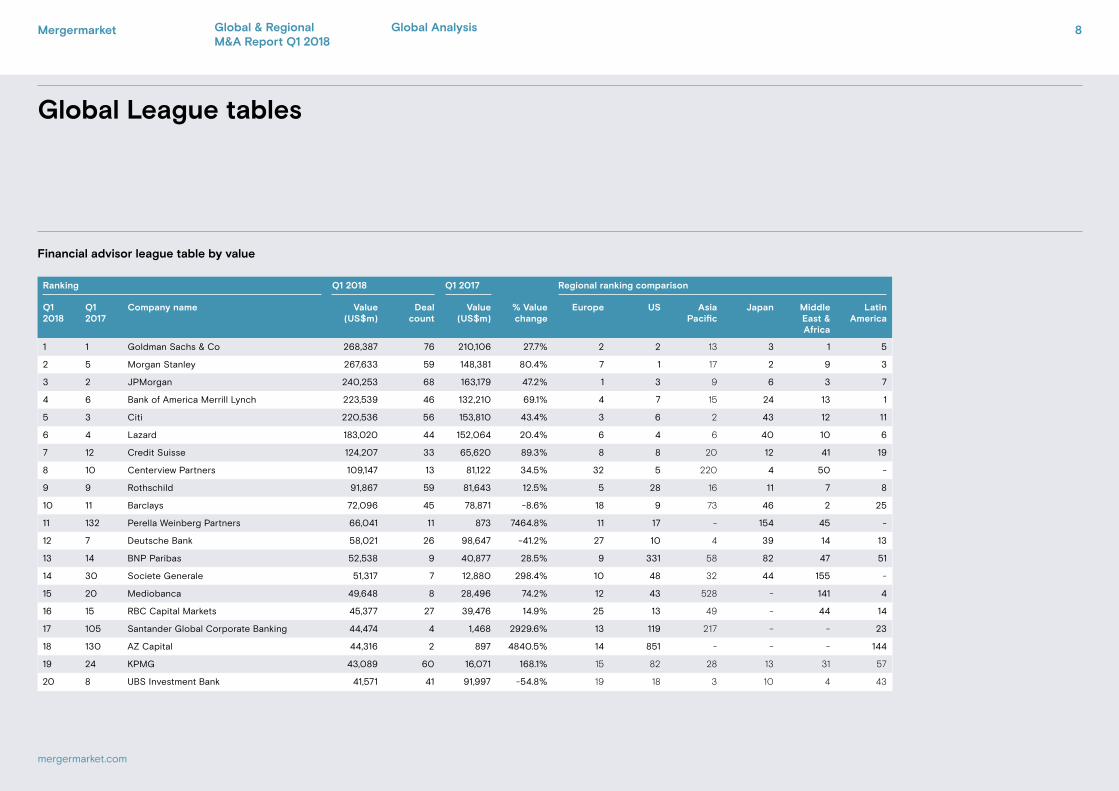
1 1 Goldman Sachs & Co 268,387 76 210,106 27.7% 2 2 13 3 1 5
2 5 Morgan Stanley 267,633 59 148,381 80.4% 7 1 17 2 9 3
3 2 JPMorgan 240,253 68 163,179 47.2% 1 3 9 6 3 7
4 6 Bank of America Merrill Lynch 223,539 46 132,210 69.1% 4 7 15 24 13 1
5 3 Citi 220,536 56 153,810 43.4% 3 6 2 43 12 11
6 4 Lazard 183,020 44 152,064 20.4% 6 4 6 40 10 6
7 12 Credit Suisse 124,207 33 65,620 89.3% 8 8 20 12 41 19
8 10 Centerview Partners 109,147 13 81,122 34.5% 32 5 220 4 50 -
9 9 Rothschild 91,867 59 81,643 12.5% 5 28 16 11 7 8
10 11 Barclays 72,096 45 78,871 -8.6% 18 9 73 46 2 25
11 132 Perella Weinberg Partners 66,041 11 873 7464.8% 11 17 - 154 45 -
12 7 Deutsche Bank 58,021 26 98,647 -41.2% 27 10 4 39 14 13
13 14 BNP Paribas 52,538 9 40,877 28.5% 9 331 58 82 47 51
14 30 Societe Generale 51,317 7 12,880 298.4% 10 48 32 44 155 -
15 20 Mediobanca 49,648 8 28,496 74.2% 12 43 528 - 141 4
16 15 RBC Capital Markets 45,377 27 39,476 14.9% 25 13 49 - 44 14
17 105 Santander Global Corporate Banking 44,474 4 1,468 2929.6% 13 119 217 - - 23
18 130 AZ Capital 44,316 2 897 4840.5% 14 851 - - - 144
19 24 KPMG 43,089 60 16,071 168.1% 15 82 28 13 31 57
20 8 UBS Investment Bank 41,571 41 91,997 -54.8% 19 18 3 10 4 43
Global League tables
Financial advisor league table by value
Global & Regional M&A Report Q1 2018
Mergermarket 9
mergermarket.com
Europe Analysis
Europe
Value (US$bn)
Deal details
Announce-ment date
Bidder company Target company Target geography
Target sector
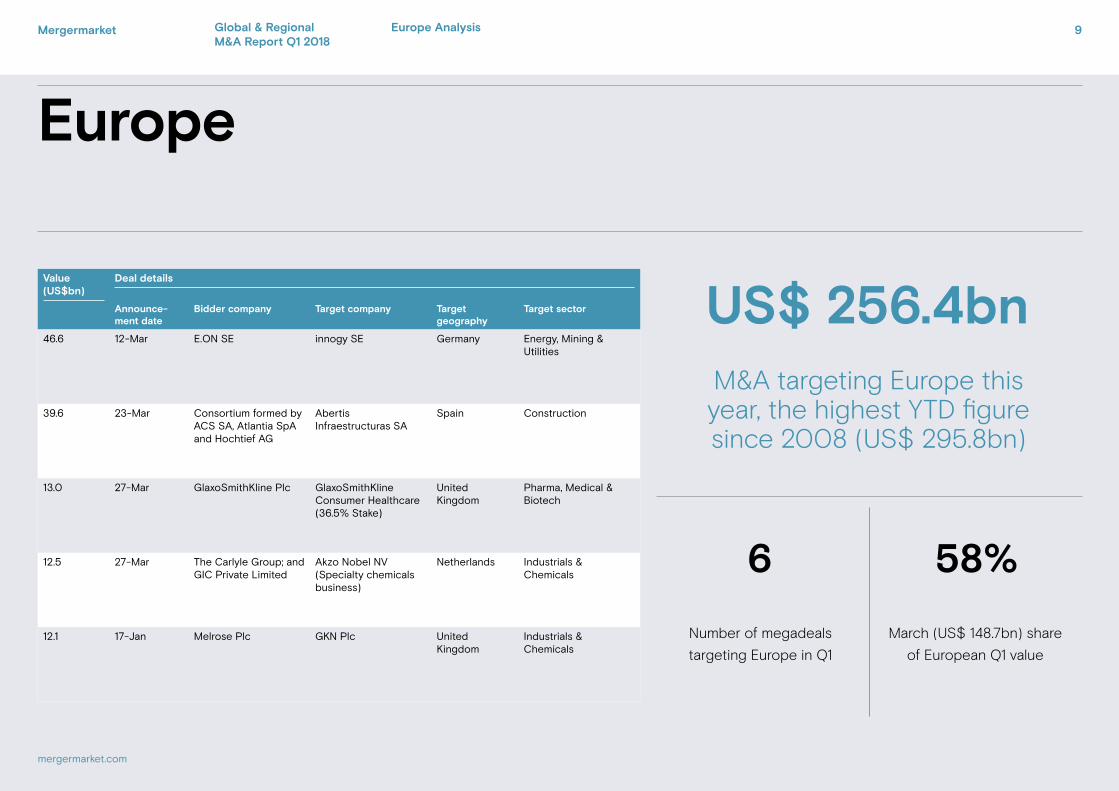
46.6 12-Mar E.ON SE innogy SE Germany Energy, Mining & Utilities
39.6 23-Mar Consortium formed by ACS SA, Atlantia SpA and Hochtief AG
Abertis Infraestructuras SA
Spain Construction
13.0 27-Mar GlaxoSmithKline Plc GlaxoSmithKline Consumer Healthcare (36.5% Stake)
United Kingdom
Pharma, Medical & Biotech
12.5 27-Mar The Carlyle Group; and GIC Private Limited
Akzo Nobel NV (Specialty chemicals business)
Netherlands Industrials & Chemicals
12.1 17-Jan Melrose Plc GKN Plc United Kingdom
Industrials & Chemicals
March (US$ 148.7bn) share
of European Q1 value
Number of megadeals
targeting Europe in Q1
58%6
M&A targeting Europe this year, the highest YTD figure since 2008 (US$ 295.8bn)
US$ 256.4bn
Global & Regional M&A Report Q1 2018
Mergermarket 10
mergermarket.com
“Politics has once again been at the forefront of dealmakers’ minds as both Germany and Italy battled uncertainty, while Brexit negotiations continue to rumble on”
Jonathan Klonowski, Research Editor (EMEA)
Europe
Europe AnalysisGlobal & Regional M&A Report Q1 2018
• A clear surge in dealmaking in March pushed Europe’s YTD figure to its highest post-crisis value on Mergermarket. Activity in the first quarter hit US$ 256.4bn (1,409 deals), 21.6% higher than Q1 2017’s already sky-high figure of US$ 211bn. This represents just the third time in Mergermarket history that Europe has breached the US$ 250bn mark at this point in the year. This year’s figures were driven by an increased number of megadeals, with a total of six deals surpassing the US$ 10bn mark. The largest of which was E.ON’s US$ 46.6bn acquisition of German-energy firm innogy, accounting for over just under a fifth of Europe’s value this year. The final week of the quarter saw the announcement of two of the quarter’s largest deals with GSK’s US$ 13bn acquisition of the remaining 36.5% in its consumer healthcare joint venture with Novartis, and the US$ 12.5bn deal between The Carlyle Group/GIC and Akzo Nobel both being agreed.
• Politics once again will have been at the forefront of dealmakers’ minds as both Germany and Italy battled uncertainty, while Brexit negotiations continue to rumble on. Last year saw a more stable market with renewed growth across the Eurozone as an increased confidence led to an active M&A market, which has carried forward into 2018. This year, while the grand coalition in Germany was agreed, the Italian elections in early March have left the country moving towards a more populist position and much remains to be seen whether a slowdown will occur and whether a stable government can be formed. The UK and Germany remained the most targeted countries by both value and deal count, respectively exceeding the US$ 50bn figure. The UK received 266 deals worth US$ 59.3bn, its highest quarterly value since Q4 2016 (US$ 72.9bn) while the innogy transaction pushed German M&A to US$ 54.1bn across 180 deals.
• Investment by European firms into the rest of the world maintained the high levels seen in the final quarter of 2017 with US$ 55.8bn spent on foreign assets in Q1. French companies have been particularly active on this front, with two deals outside Europe worth over US$ 10bn announced in Q1. In mid-January, Sanofi acquired US-biotech firm Bioverativ for US$ 11.1bn, while AXA made a US$ 14.8bn purchase of XL Group in early March. In total there has been US$ 28.4bn invested by French companies outside Europe, representing 50.9% of Europe’s total value so far this year. The last two quarters have now seen over US$ 25bn deployed by French companies outside Europe, the only two quarters on Mergermarket record to do so. The trend reflects President Macron’s desire to create ‘European champions’ able to compete at a higher level against firms in the US and China.
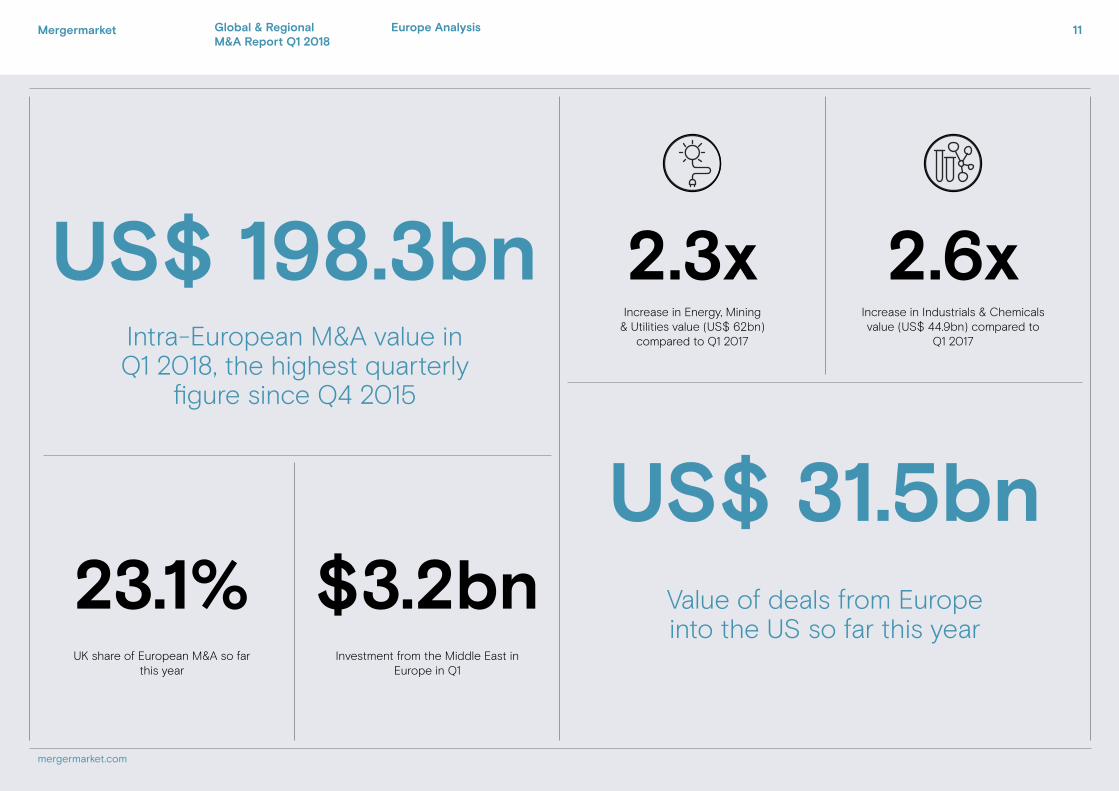
• Following on from the trend seen in 2017, intra-European dealmaking has once again been active across the continent in the first quarter with the top three deals all being conducted between European companies. The first three months of 2018 have seen 1,161 deals worth a total US$ 198.3bn, the highest first quarter value since 2007 (US$ 204.2bn, 1,505 deals). Deals between European countries in FY 2017 (US$ 551.8bn, 6,362 deals) hit their highest annual deal count on Mergermarket record (since 2001) and their second highest value since the financial crisis. Meanwhile, foreign investment has started to pick up after the drop towards the end of 2017, registering US$ 58.2bn (248 deals) in Q1, 11% higher than in Q4 2017 (US$ 52.4bn). This still represents the second lowest quarterly value since Q1 2014 (US$ 55.8bn) and is 23.2% lower than the average quarterly value since 2012 (US$ 75.7bn, 302 deals).
Mergermarket.com
23.1%UK share of European M&A so far
this yearInvestment from the Middle East in
Europe in Q1
$3.2bnUS$ 31.5bn
Value of deals from Europe into the US so far this year
Increase in Industrials & Chemicals value (US$ 44.9bn) compared to
Q1 2017
Increase in Energy, Mining & Utilities value (US$ 62bn)
compared to Q1 2017Intra-European M&A value in Q1 2018, the highest quarterly
figure since Q4 2015
US$ 198.3bn 2.6x2.3x
11
mergermarket.com
Mergermarket Europe AnalysisGlobal & Regional M&A Report Q1 2018

Chart title 1Chart title 2
Chart title 1Chart title 2
0
25
50
75
100
125
150
OtherPharma, Medical & Biotech
TelecomsConstructionIndustrials & Chemicals
Energy, Mining & Utilities
Dea
l Val
ue (
US
$b
n)
Q1 2017 Q1 2018
0
100
200
300
400
500
600
700
800
900
1000
2018201720162015201420130
1000
2000
3000
4000
5000
6000
7000
8000
9000
10000
213.8
310.5
158.0
158.6
256.4
262.0
179.6
163.9
177.6
Dea
l Val
ue (
US
$b
n)
Deal C
ount
292.3
272.2
174.2
198.2
178.8
211.3
201.0
136.3211.0
302.5
186.3
196.2
Q3Q2 Q4Q1
Deal Count
Europe Quarterly Breakdown Trend2013 - 2018
Europe Sector Breakdown TrendQ1 2017 - Q1 2018
12
mergermarket.com
Mergermarket Europe AnalysisGlobal & Regional M&A Report Q1 2018
Europe League tables
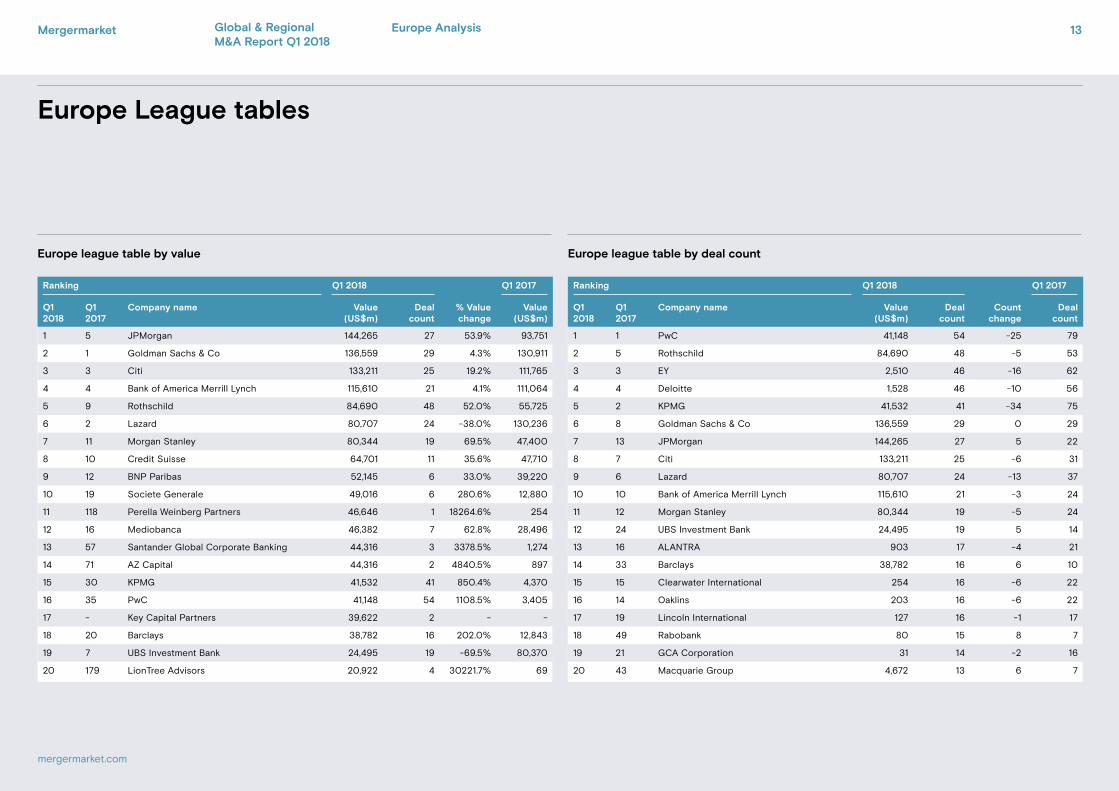
Europe league table by value
Ranking Q1 2018 Q1 2017
Q1 2018
Q1 2017
Company name Value (US$m)
Deal count
Count change
Deal count
1 1 PwC 41,148 54 -25 79
2 5 Rothschild 84,690 48 -5 53
3 3 EY 2,510 46 -16 62
4 4 Deloitte 1,528 46 -10 56
5 2 KPMG 41,532 41 -34 75
6 8 Goldman Sachs & Co 136,559 29 0 29
7 13 JPMorgan 144,265 27 5 22
8 7 Citi 133,211 25 -6 31
9 6 Lazard 80,707 24 -13 37
10 10 Bank of America Merrill Lynch 115,610 21 -3 24
11 12 Morgan Stanley 80,344 19 -5 24
12 24 UBS Investment Bank 24,495 19 5 14
13 16 ALANTRA 903 17 -4 21
14 33 Barclays 38,782 16 6 10
15 15 Clearwater International 254 16 -6 22
16 14 Oaklins 203 16 -6 22
17 19 Lincoln International 127 16 -1 17
18 49 Rabobank 80 15 8 7
19 21 GCA Corporation 31 14 -2 16
20 43 Macquarie Group 4,672 13 6 7
Ranking Q1 2018 Q1 2017
Q1 2018
Q1 2017
Company name Value (US$m)
Deal count
% Value change
Value (US$m)
1 5 JPMorgan 144,265 27 53.9% 93,751
2 1 Goldman Sachs & Co 136,559 29 4.3% 130,911
3 3 Citi 133,211 25 19.2% 111,765
4 4 Bank of America Merrill Lynch 115,610 21 4.1% 111,064
5 9 Rothschild 84,690 48 52.0% 55,725
6 2 Lazard 80,707 24 -38.0% 130,236
7 11 Morgan Stanley 80,344 19 69.5% 47,400
8 10 Credit Suisse 64,701 11 35.6% 47,710
9 12 BNP Paribas 52,145 6 33.0% 39,220
10 19 Societe Generale 49,016 6 280.6% 12,880
11 118 Perella Weinberg Partners 46,646 1 18264.6% 254
12 16 Mediobanca 46,382 7 62.8% 28,496
13 57 Santander Global Corporate Banking 44,316 3 3378.5% 1,274
14 71 AZ Capital 44,316 2 4840.5% 897
15 30 KPMG 41,532 41 850.4% 4,370
16 35 PwC 41,148 54 1108.5% 3,405
17 - Key Capital Partners 39,622 2 - -
18 20 Barclays 38,782 16 202.0% 12,843
19 7 UBS Investment Bank 24,495 19 -69.5% 80,370
20 179 LionTree Advisors 20,922 4 30221.7% 69
Europe league table by deal count
Mergermarket 13
mergermarket.com
Europe AnalysisGlobal & Regional M&A Report Q1 2018
Mergermarket 14
mergermarket.com
US Analysis
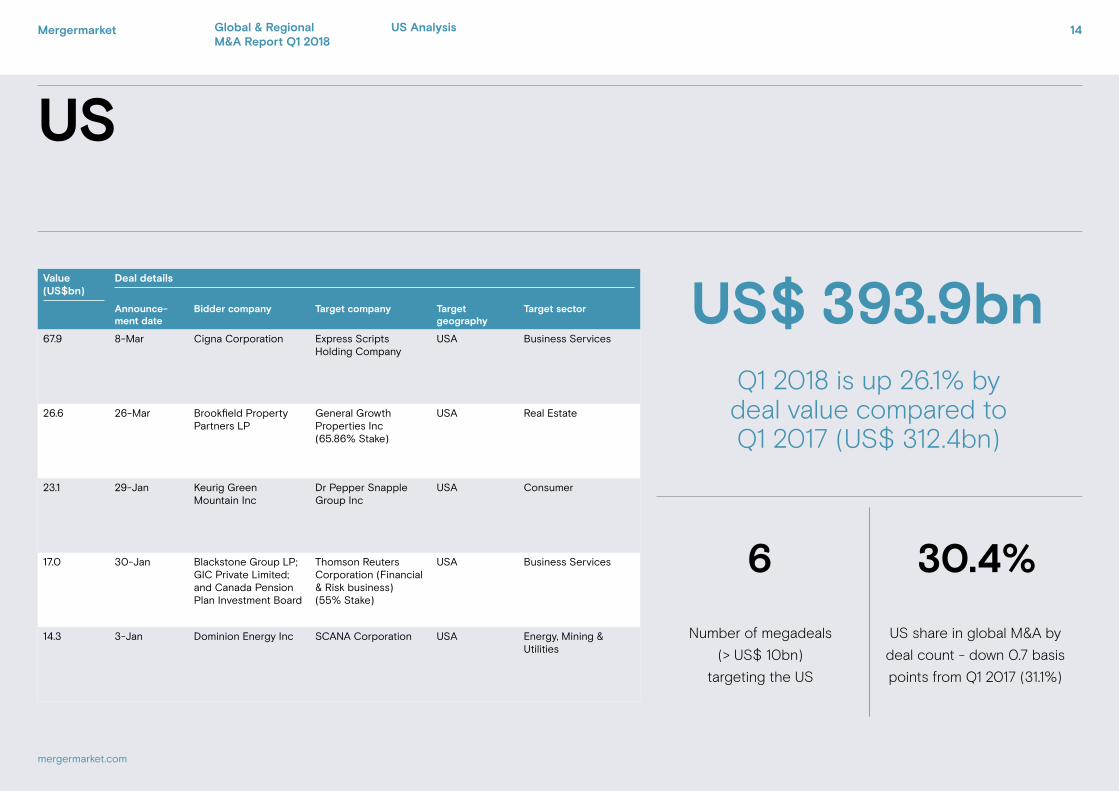
US
Value (US$bn)
Deal details
Announce-ment date
Bidder company Target company Target geography
Target sector
67.9 8-Mar Cigna Corporation Express Scripts Holding Company
USA Business Services
26.6 26-Mar Brookfield Property Partners LP
General Growth Properties Inc (65.86% Stake)
USA Real Estate
23.1 29-Jan Keurig Green Mountain Inc
Dr Pepper Snapple Group Inc
USA Consumer
17.0 30-Jan Blackstone Group LP; GIC Private Limited; and Canada Pension Plan Investment Board
Thomson Reuters Corporation (Financial & Risk business) (55% Stake)
USA Business Services
14.3 3-Jan Dominion Energy Inc SCANA Corporation USA Energy, Mining & Utilities
US share in global M&A by
deal count - down 0.7 basis
points from Q1 2017 (31.1%)
Number of megadeals
(> US$ 10bn)
targeting the US
30.4%6
Q1 2018 is up 26.1% by deal value compared to Q1 2017 (US$ 312.4bn)
US$ 393.9bn
Global & Regional M&A Report Q1 2018
Mergermarket 15
mergermarket.com
US Analysis
“The rapid onslaught of Technology’s influence has not been without serious consequences on, among many things, data privacy, national security, economic policy, and the future of other sectors.”
Elizabeth Lim,Research Editor (Americas)
US
Global & Regional M&A Report Q1 2018
• Though the first quarter of 2018 is not likely to go down in history for shattering US M&A records, it could become known as one of the more interesting starts to a year. Among other happenings: the White House introduced steel and aluminium tariffs, sparking concerns over a trade war and spooking dealmakers; opening arguments were given in the antitrust trial between AT&T/Time Warner and the Justice Department; and President Trump blocked Broadcom’s takeover bid for Qualcomm. Finally, Comcast also entered the Media fray by exploring an offer to buy Sky in a competing bid with Disney, who is itself in the process of taking over most of Twenty-First Century Fox. The latter already owns 39.1% of Sky, and its acquisition of the remaining 60.9% is currently under regulatory review. One could not be blamed for believing that anything seems possible at this point. And, though US M&A fell by 305 deals to 1,148 compared to 1,453 in Q1 2017, value rose by 26.1% to US$ 393.9bn from the US$ 312.4bn recorded during the same period last year.
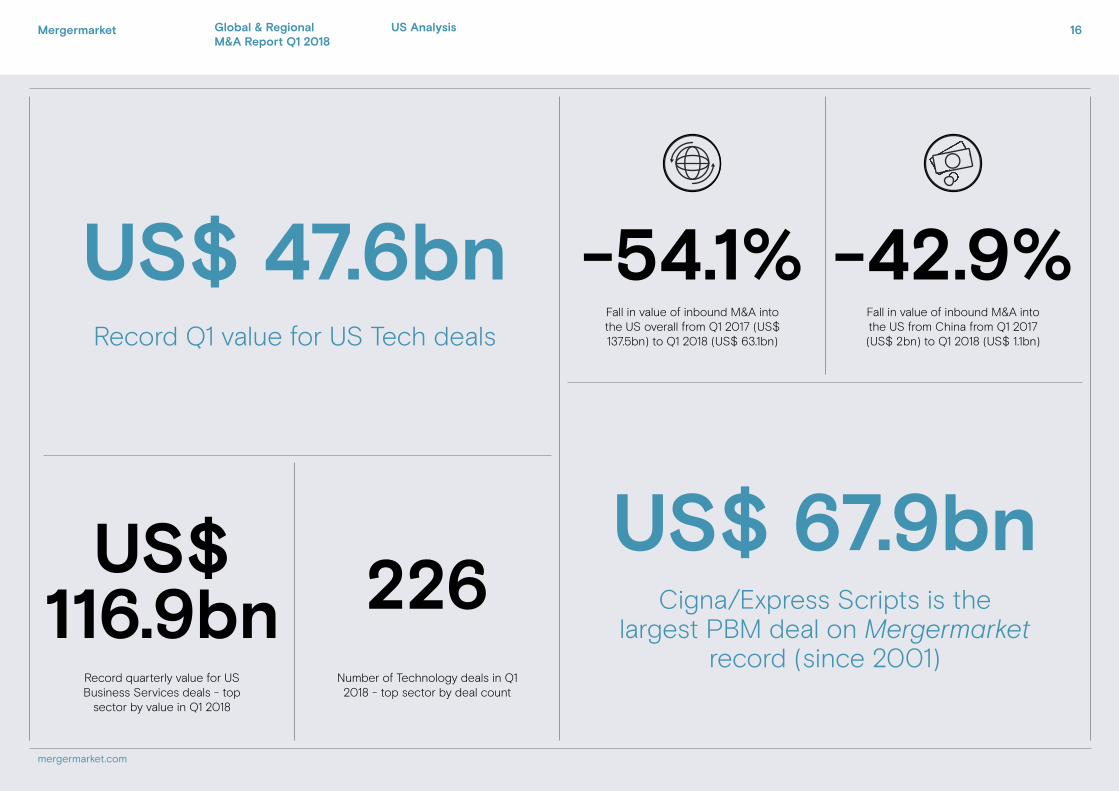
• Many of these battles to consolidate have been driven largely by Technology or by Tech giants beginning to exercise their might in other sectors. The past year could certainly be said to have fallen under the “Amazon effect” which, after last year’s disruptions in retail, has also begun to disrupt the US healthcare market – particularly in the area of pharmacy benefit management (PBM). Q1 2018’s top sector was Business Services with US$ 116.9bn in value, 58.1% of which was due to Cigna’s US$ 67.9bn bid for Express Scripts. The year’s largest deal to date, the transaction is also on par with CVS Health’s US$ 67.8bn bid for Aetna in Q4 2017. Further, Amazon’s announcement in January that it would team up with Berkshire Hathaway and JP Morgan to form a healthcare company for their employees has other industry players on their guard.
• Pharma, Medical & Biotech (PMB) saw a 15.7% decline in Q1 value to US$ 28bn and a fall in deal count to 108 transactions compared to Q1 2017 as the sector struggles to find its footing in the age of Amazon while also navigating its new gains from tax reform. With a significantly reduced corporate tax rate from 35% to 21%, repatriation of cash from abroad that could be used for future acquisitions in place of the tax inversion deals of yesteryear now seems more likely. Relatedly, Financial Services (FS), also feeling the ripple effects of changes in healthcare, saw a shift in large deals from banking toward insurance. Overall, FS saw US$ 14.9bn across 97 transactions in Q1 2018, a 33.5% fall in value with 27 fewer deals compared to Q1 2017. However, when looking at the seven US FS deals valued over US$ 1bn announced so far in 2018, five fell under the insurance sub-sector, covering a range of types from title to property to life. By contrast, last year saw just one such transaction falling under insurance.
• The rapid onslaught of Technology’s influence has not been without consequences. As the Trump Administration has demonstrated a willingness to block deals on national security grounds and instated increasingly protectionist policies, much of which has been aimed at China, inbound M&A from the latter has fallen 42.9% by value to US$ 1.1bn from Q1 2017 while deal count has dropped to 13 deals, four fewer than last year. Moreover, concerns over data privacy following not only the Russian hack during the 2016 presidential election and ensuing special counsel investigation but also the more recent Cambridge Analytica/Facebook scandal are likely to lead to calls for more regulation, with Facebook CEO Mark Zuckerberg and COO Sheryl Sandberg both stating that the company would be open to regulation. What this bodes for Technology’s future growth and its continued influence on all other sectors remains to be seen.
Mergermarket.com
US$ 47.6bn
US$ 116.9bn 226
Record Q1 value for US Tech deals
US$ 67.9bn Cigna/Express Scripts is the
largest PBM deal on Mergermarket record (since 2001)
Fall in value of inbound M&A into the US overall from Q1 2017 (US$ 137.5bn) to Q1 2018 (US$ 63.1bn)
Record quarterly value for US Business Services deals - top
sector by value in Q1 2018
Number of Technology deals in Q1 2018 - top sector by deal count
Fall in value of inbound M&A into the US from China from Q1 2017 (US$ 2bn) to Q1 2018 (US$ 1.1bn)
-42.9%-54.1%
Mergermarket 16
mergermarket.com
US AnalysisGlobal & Regional M&A Report Q1 2018
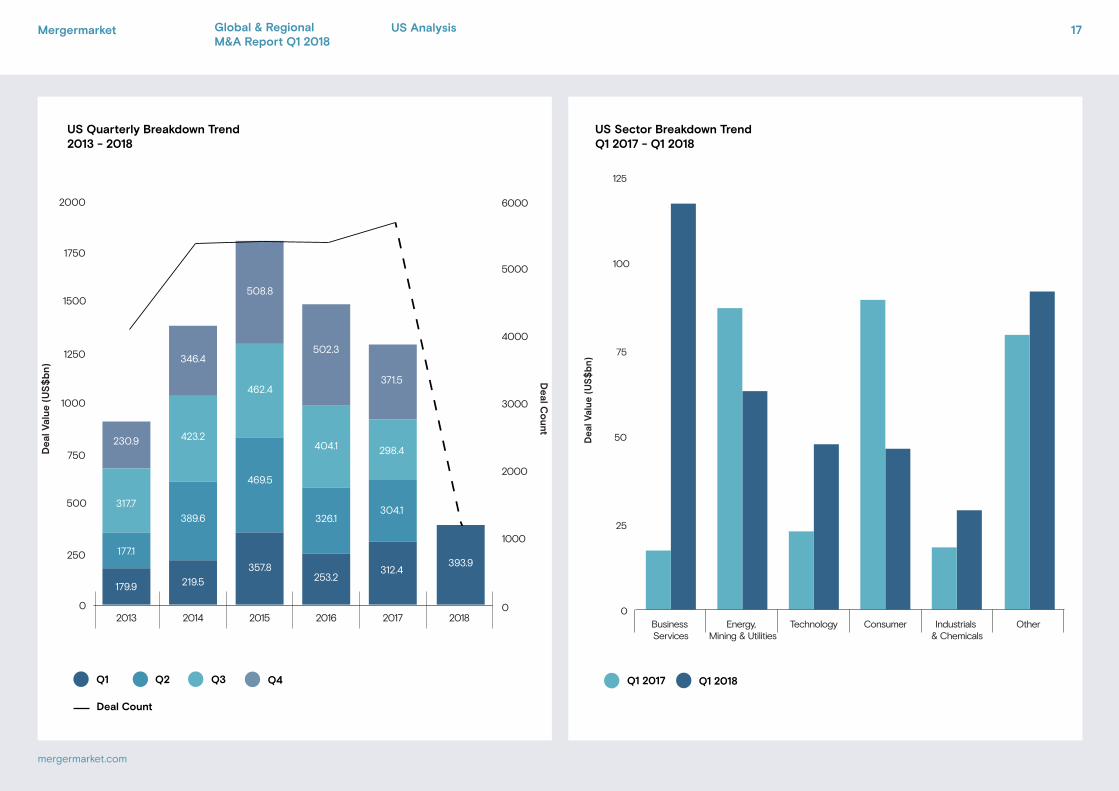
Chart title 1Chart title 2
Chart title 1Chart title 2
0
25
50
75
100
125
OtherIndustrials & Chemicals
ConsumerTechnologyEnergy, Mining & Utilities
Business Services
Dea
l Val
ue (
US
$b
n)
Q1 2017 Q1 2018
0
250
500
750
1000
1250
1500
1750
2000
2018201720162015201420130
1000
2000
3000
4000
5000
6000
508.8
469.5
179.9
346.4
423.2
393.9
404.1
502.3
326.1
298.4Dea
l Val
ue
(US
$b
n)
Deal C
ount
253.2
371.5
312.4
304.1
357.8
462.4
389.6
219.5
317.7
230.9
177.1
Q3Q2 Q4Q1
Deal Count
US Quarterly Breakdown Trend2013 - 2018
US Sector Breakdown TrendQ1 2017 - Q1 2018
17
mergermarket.com
Mergermarket US AnalysisGlobal & Regional M&A Report Q1 2018
US League tables
US league table by value US league table by deal count
Ranking Q1 2018 Q1 2017
Q1 2018
Q1 2017
Company name Value (US$m)
Deal count
Count change
Deal count
1 1 Goldman Sachs & Co 154,342 58 -2 60
2 3 JPMorgan 137,734 47 3 44
3 2 Morgan Stanley 182,970 39 -6 45
4 5 Citi 100,034 38 3 35
5 7 Barclays 51,072 36 3 33
6 4 Houlihan Lokey 9,013 35 -7 42
7 6 Evercore 33,328 30 -5 35
8 13 Jefferies 17,198 30 8 22
9 14 Stifel/KBW 8,953 27 5 22
10 9 Bank of America Merrill Lynch 99,890 26 -3 29
11 8 Lazard 131,141 24 -8 32
12 16 Raymond James & Associates 1,681 24 4 20
13 15 Credit Suisse 70,839 22 1 21
14 21 Moelis & Company 13,533 22 5 17
15 23 Lincoln International 774 21 4 17
16 12 RBC Capital Markets 27,082 20 -4 24
17 27 UBS Investment Bank 18,634 20 7 13
18 22 Robert W. Baird & Co 3,792 19 2 17
19 10 Piper Jaffray & Co 1,645 19 -10 29
20 11 Rothschild 11,070 18 -9 27
Ranking Q1 2018 Q1 2017
Q1 2018
Q1 2017
Company name Value (US$m)
Deal count
% Value change
Value (US$m)
1 4 Morgan Stanley 182,970 39 71.7% 106,557
2 1 Goldman Sachs & Co 154,342 58 -8.4% 168,481
3 2 JPMorgan 137,734 47 4.6% 131,657
4 3 Lazard 131,141 24 13.0% 116,078
5 7 Centerview Partners 102,371 11 26.2% 81,122
6 6 Citi 100,034 38 12.8% 88,699
7 8 Bank of America Merrill Lynch 99,890 26 27.4% 78,384
8 11 Credit Suisse 70,839 22 34.5% 52,649
9 10 Barclays 51,072 36 -23.4% 66,669
10 5 Deutsche Bank 39,295 15 -55.9% 89,097
11 12 Evercore 33,328 30 -28.0% 46,304
12 105 Guggenheim Partners 30,007 9 6423.3% 460
13 13 RBC Capital Markets 27,082 20 -23.3% 35,287
14= - AFW 23,131 1 - -
14= 21 BDT & Company 23,131 1 163.1% 8,792
16 23 PJT Partners 21,435 6 156.8% 8,348
17 90 Perella Weinberg Partners 19,395 10 3033.3% 619
18 9 UBS Investment Bank 18,634 20 -72.9% 68,751
19 20 Jefferies 17,198 30 22.2% 14,075
20 17 TD Securities 17,000 3 -17.1% 20,511
Mergermarket 18
mergermarket.com
US AnalysisGlobal & Regional M&A Report Q1 2018
Mergermarket 19
mergermarket.com
Latin America Analysis
LatinAmericaValue (US$m)
Deal details
Announce-ment date
Bidder company Target company Target geography Target sector
15,326 16-Mar Suzano Papel e Celulose SA
Fibria Celulose SA Brazil Industrials & Chemicals
3,266 16-Feb Enel Chile SA Enel Generación Chile (40.02% Stake)
Chile Energy, Mining & Utilities
1,700 14-Feb Banco Popular de Puerto Rico
Wells Fargo & Company (Auto finance business in Puerto Rico)
Puerto Rico Financial Services
900 3-Jan Didi Chuxing Technology Co Ltd
99 Taxis Desenvolvimento de Softwares Ltda (70% Stake)
Brazil TMT
583 26-Jan InRetail Peru Corp Quicorp SA Peru Pharma, Medical & Biotech
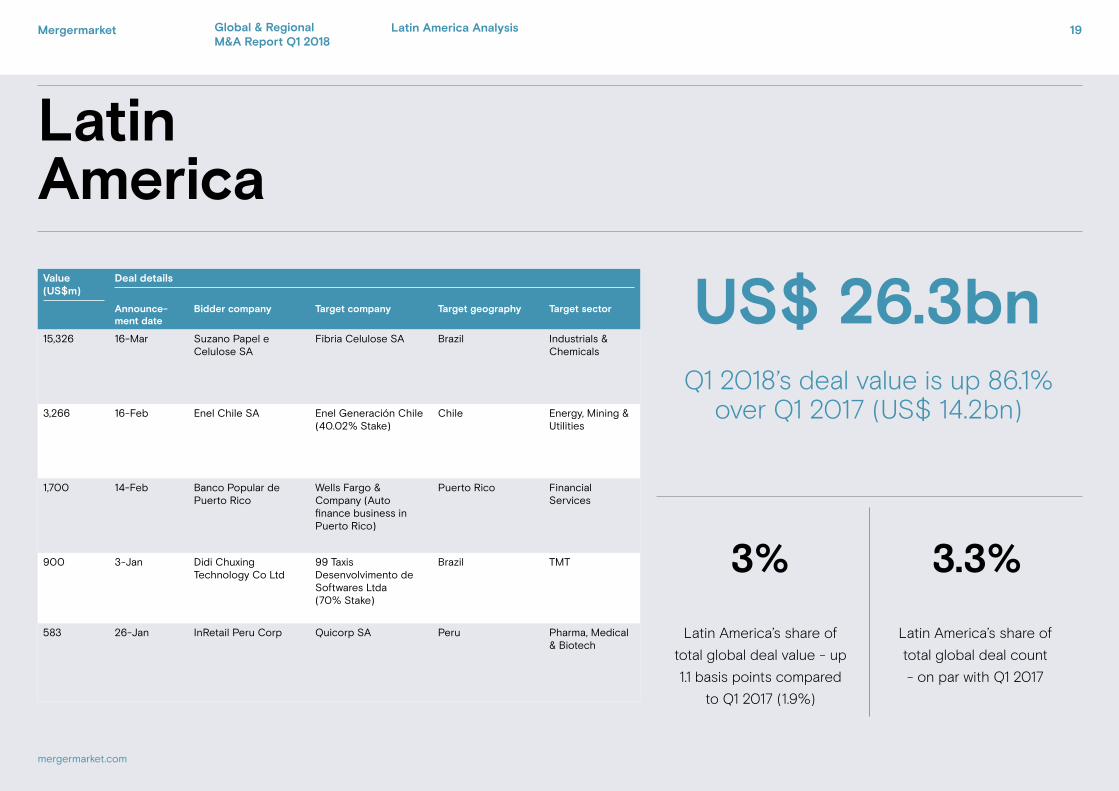
Latin America’s share of
total global deal count
- on par with Q1 2017
Latin America’s share of
total global deal value - up
1.1 basis points compared
to Q1 2017 (1.9%)
3.3%3%
Q1 2018’s deal value is up 86.1% over Q1 2017 (US$ 14.2bn)
US$ 26.3bn
Global & Regional M&A Report Q1 2018
Mergermarket 20
mergermarket.com
Global & Regional M&A Report Q1 2018
“As Latin America has attempted to move past political scandals, low commodities prices, and domestic unrest, new challenges have arisen, including the US wanting to renegotiate NAFTA and imposing steel and aluminium tariffs that would hurt Brazil and others.”
Elizabeth Lim,Research Editor (Americas)
Latin America
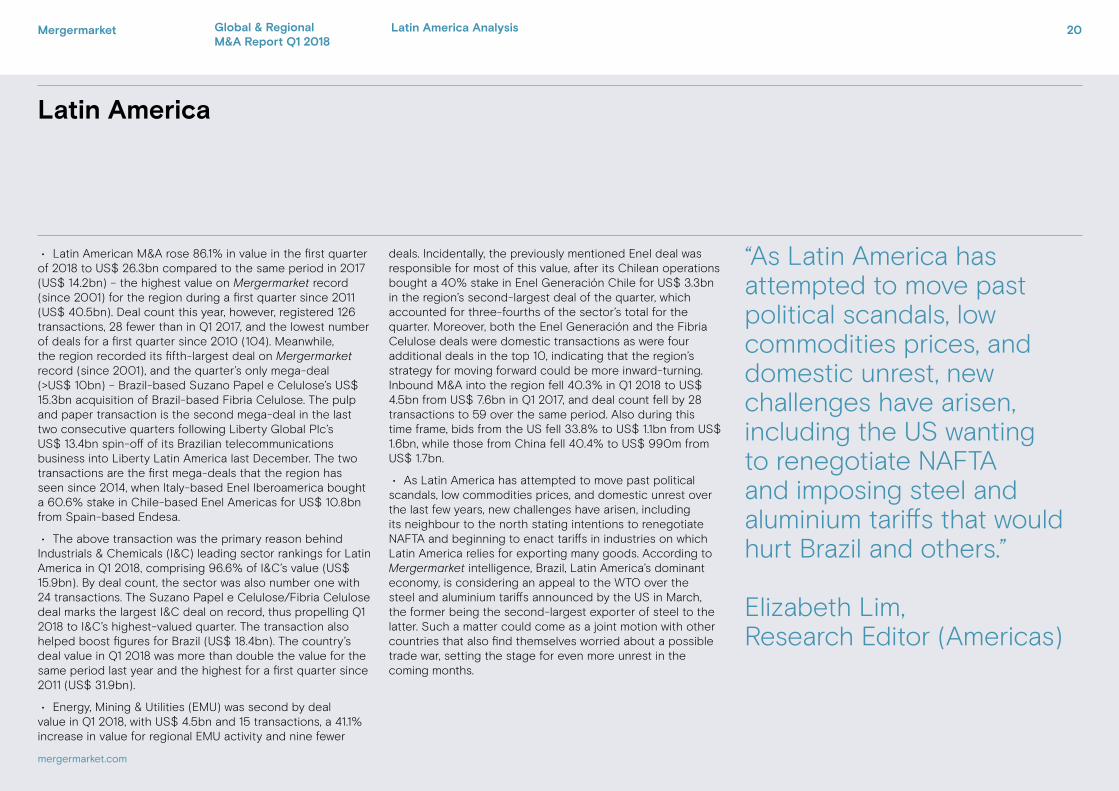
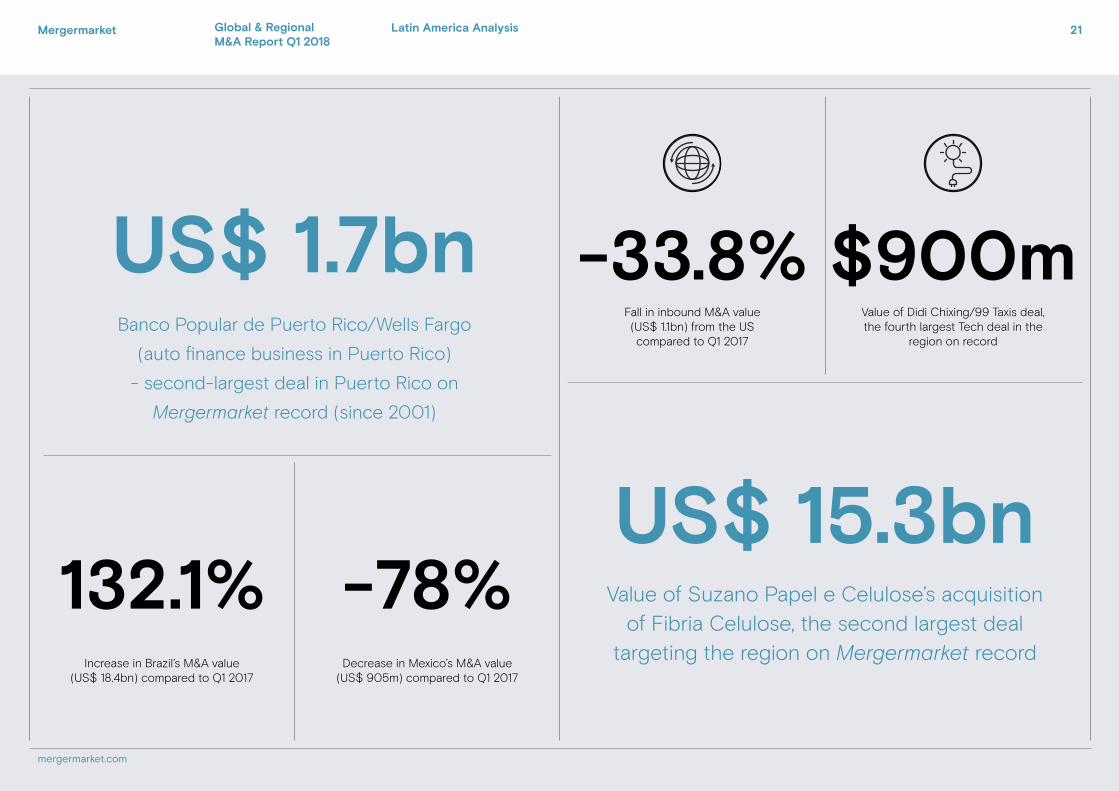
• Latin American M&A rose 86.1% in value in the first quarter of 2018 to US$ 26.3bn compared to the same period in 2017 (US$ 14.2bn) – the highest value on Mergermarket record (since 2001) for the region during a first quarter since 2011 (US$ 40.5bn). Deal count this year, however, registered 126 transactions, 28 fewer than in Q1 2017, and the lowest number of deals for a first quarter since 2010 (104). Meanwhile, the region recorded its fifth-largest deal on Mergermarket record (since 2001), and the quarter’s only mega-deal (>US$ 10bn) – Brazil-based Suzano Papel e Celulose’s US$ 15.3bn acquisition of Brazil-based Fibria Celulose. The pulp and paper transaction is the second mega-deal in the last two consecutive quarters following Liberty Global Plc’s US$ 13.4bn spin-off of its Brazilian telecommunications business into Liberty Latin America last December. The two transactions are the first mega-deals that the region has seen since 2014, when Italy-based Enel Iberoamerica bought a 60.6% stake in Chile-based Enel Americas for US$ 10.8bn from Spain-based Endesa.
• The above transaction was the primary reason behind Industrials & Chemicals (I&C) leading sector rankings for Latin America in Q1 2018, comprising 96.6% of I&C’s value (US$ 15.9bn). By deal count, the sector was also number one with 24 transactions. The Suzano Papel e Celulose/Fibria Celulose deal marks the largest I&C deal on record, thus propelling Q1 2018 to I&C’s highest-valued quarter. The transaction also helped boost figures for Brazil (US$ 18.4bn). The country’s deal value in Q1 2018 was more than double the value for the same period last year and the highest for a first quarter since 2011 (US$ 31.9bn).
• Energy, Mining & Utilities (EMU) was second by deal value in Q1 2018, with US$ 4.5bn and 15 transactions, a 41.1% increase in value for regional EMU activity and nine fewer
deals. Incidentally, the previously mentioned Enel deal was responsible for most of this value, after its Chilean operations bought a 40% stake in Enel Generación Chile for US$ 3.3bn in the region’s second-largest deal of the quarter, which accounted for three-fourths of the sector’s total for the quarter. Moreover, both the Enel Generación and the Fibria Celulose deals were domestic transactions as were four additional deals in the top 10, indicating that the region’s strategy for moving forward could be more inward-turning. Inbound M&A into the region fell 40.3% in Q1 2018 to US$ 4.5bn from US$ 7.6bn in Q1 2017, and deal count fell by 28 transactions to 59 over the same period. Also during this time frame, bids from the US fell 33.8% to US$ 1.1bn from US$ 1.6bn, while those from China fell 40.4% to US$ 990m from US$ 1.7bn.
• As Latin America has attempted to move past political scandals, low commodities prices, and domestic unrest over the last few years, new challenges have arisen, including its neighbour to the north stating intentions to renegotiate NAFTA and beginning to enact tariffs in industries on which Latin America relies for exporting many goods. According to Mergermarket intelligence, Brazil, Latin America’s dominant economy, is considering an appeal to the WTO over the steel and aluminium tariffs announced by the US in March, the former being the second-largest exporter of steel to the latter. Such a matter could come as a joint motion with other countries that also find themselves worried about a possible trade war, setting the stage for even more unrest in the coming months.
Latin America Analysis
Mergermarket.com
US$ 1.7bn
132.1% -78%
Banco Popular de Puerto Rico/Wells Fargo
(auto finance business in Puerto Rico)
- second-largest deal in Puerto Rico on
Mergermarket record (since 2001)
US$ 15.3bnValue of Suzano Papel e Celulose’s acquisition
of Fibria Celulose, the second largest deal targeting the region on Mergermarket record
Fall in inbound M&A value (US$ 1.1bn) from the US compared to Q1 2017
Increase in Brazil’s M&A value (US$ 18.4bn) compared to Q1 2017
Decrease in Mexico’s M&A value (US$ 905m) compared to Q1 2017
Value of Didi Chixing/99 Taxis deal, the fourth largest Tech deal in the
region on record
$900m-33.8%
Mergermarket 21
mergermarket.com
Global & Regional M&A Report Q1 2018
Latin America Analysis
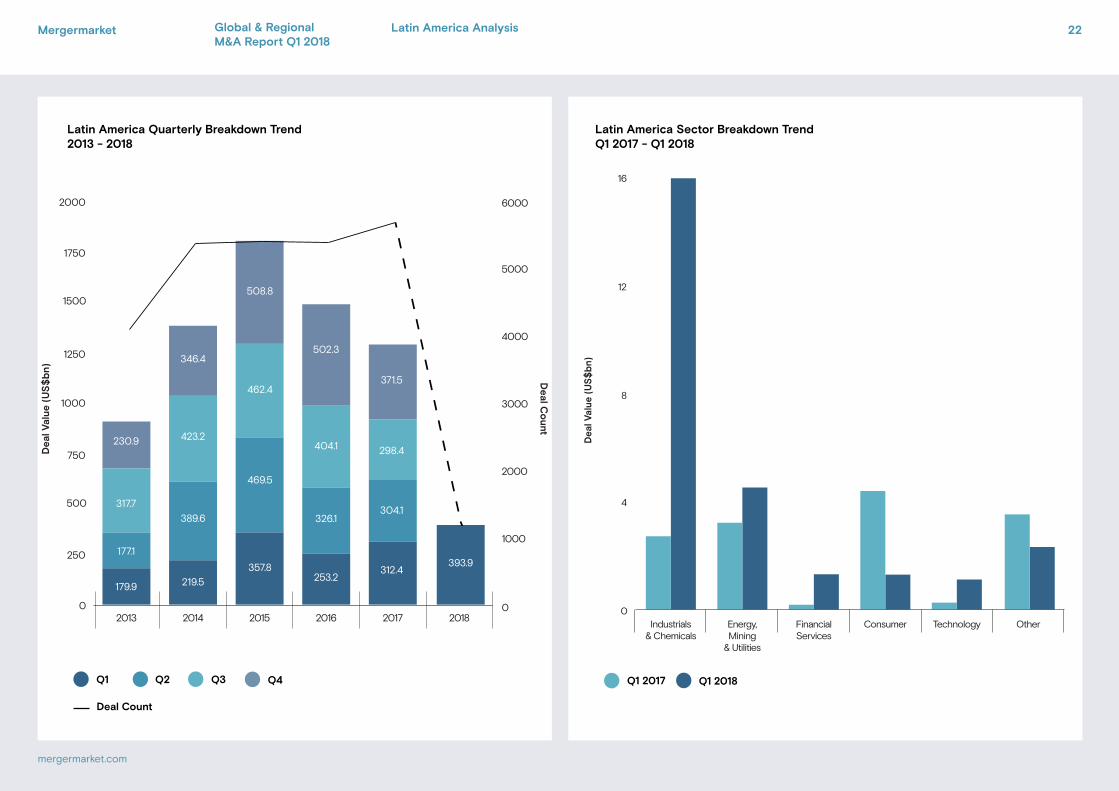
Chart title 1Chart title 2
Chart title 1Chart title 2
0
4
8
12
16
OtherTechnologyConsumerFinancialServices
Energy,Mining
& Utilities
Industrials& Chemicals
Dea
l Val
ue (
US
$b
n)
Q1 2017 Q1 2018
0
250
500
750
1000
1250
1500
1750
2000
2018201720162015201420130
1000
2000
3000
4000
5000
6000
508.8
469.5
179.9
346.4
423.2
393.9
404.1
502.3
326.1
298.4Dea
l Val
ue
(US
$b
n)
Deal C
ount
253.2
371.5
312.4
304.1
357.8
462.4
389.6
219.5
317.7
230.9
177.1
Q3Q2 Q4Q1
Deal Count
Latin America Quarterly Breakdown Trend2013 - 2018
Latin America Sector Breakdown TrendQ1 2017 - Q1 2018
22
mergermarket.com
Mergermarket Global & Regional M&A Report Q1 2018
Latin America Analysis
Latin America League tables
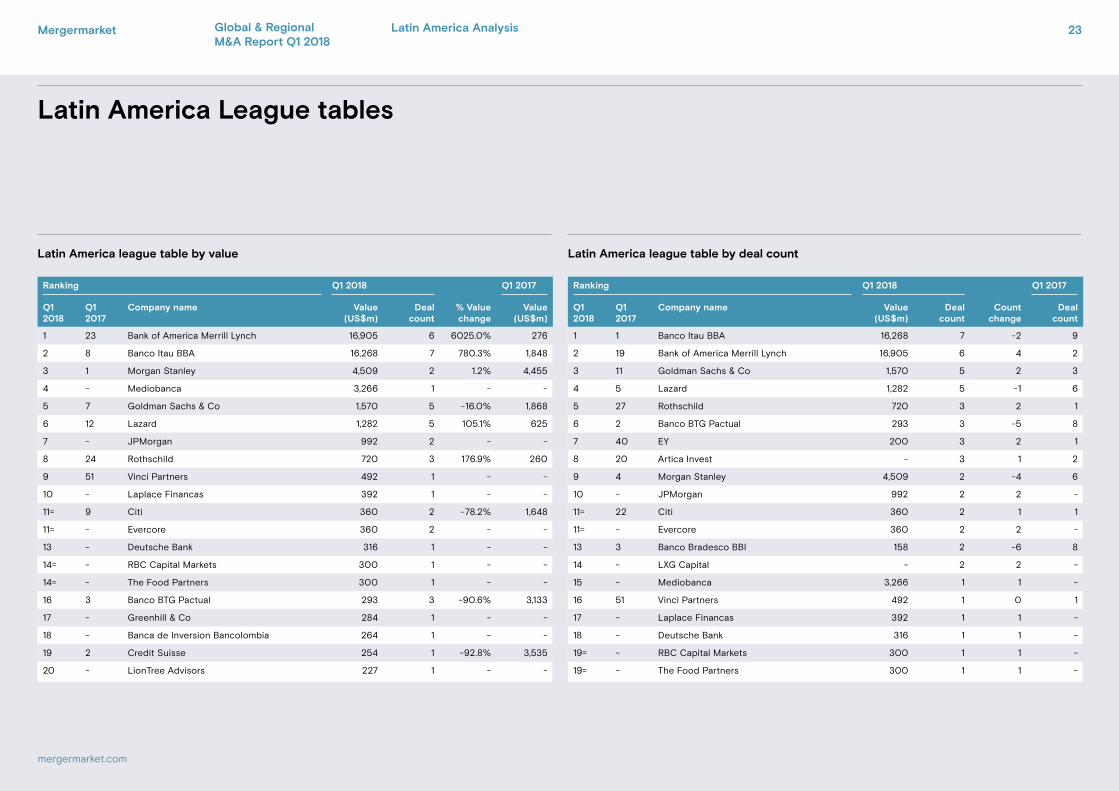
Latin America league table by value Latin America league table by deal count
Ranking Q1 2018 Q1 2017
Q1 2018
Q1 2017
Company name Value (US$m)
Deal count
Count change
Deal count
1 1 Banco Itau BBA 16,268 7 -2 9
2 19 Bank of America Merrill Lynch 16,905 6 4 2
3 11 Goldman Sachs & Co 1,570 5 2 3
4 5 Lazard 1,282 5 -1 6
5 27 Rothschild 720 3 2 1
6 2 Banco BTG Pactual 293 3 -5 8
7 40 EY 200 3 2 1
8 20 Artica Invest - 3 1 2
9 4 Morgan Stanley 4,509 2 -4 6
10 - JPMorgan 992 2 2 -
11= 22 Citi 360 2 1 1
11= - Evercore 360 2 2 -
13 3 Banco Bradesco BBI 158 2 -6 8
14 - LXG Capital - 2 2 -
15 - Mediobanca 3,266 1 1 -
16 51 Vinci Partners 492 1 0 1
17 - Laplace Financas 392 1 1 -
18 - Deutsche Bank 316 1 1 -
19= - RBC Capital Markets 300 1 1 -
19= - The Food Partners 300 1 1 -
Ranking Q1 2018 Q1 2017
Q1 2018
Q1 2017
Company name Value (US$m)
Deal count
% Value change
Value (US$m)
1 23 Bank of America Merrill Lynch 16,905 6 6025.0% 276
2 8 Banco Itau BBA 16,268 7 780.3% 1,848
3 1 Morgan Stanley 4,509 2 1.2% 4,455
4 - Mediobanca 3,266 1 - -
5 7 Goldman Sachs & Co 1,570 5 -16.0% 1,868
6 12 Lazard 1,282 5 105.1% 625
7 - JPMorgan 992 2 - -
8 24 Rothschild 720 3 176.9% 260
9 51 Vinci Partners 492 1 - -
10 - Laplace Financas 392 1 - -
11= 9 Citi 360 2 -78.2% 1,648
11= - Evercore 360 2 - -
13 - Deutsche Bank 316 1 - -
14= - RBC Capital Markets 300 1 - -
14= - The Food Partners 300 1 - -
16 3 Banco BTG Pactual 293 3 -90.6% 3,133
17 - Greenhill & Co 284 1 - -
18 - Banca de Inversion Bancolombia 264 1 - -
19 2 Credit Suisse 254 1 -92.8% 3,535
20 - LionTree Advisors 227 1 - -
Mergermarket 23
mergermarket.com
Global & Regional M&A Report Q1 2018
Latin America Analysis
Mergermarket 24
mergermarket.com
Asia Pacific(excl. Japan)Value (US$m)
Deal details
Announce-ment date
Bidder company Target company Target geography
Target sector
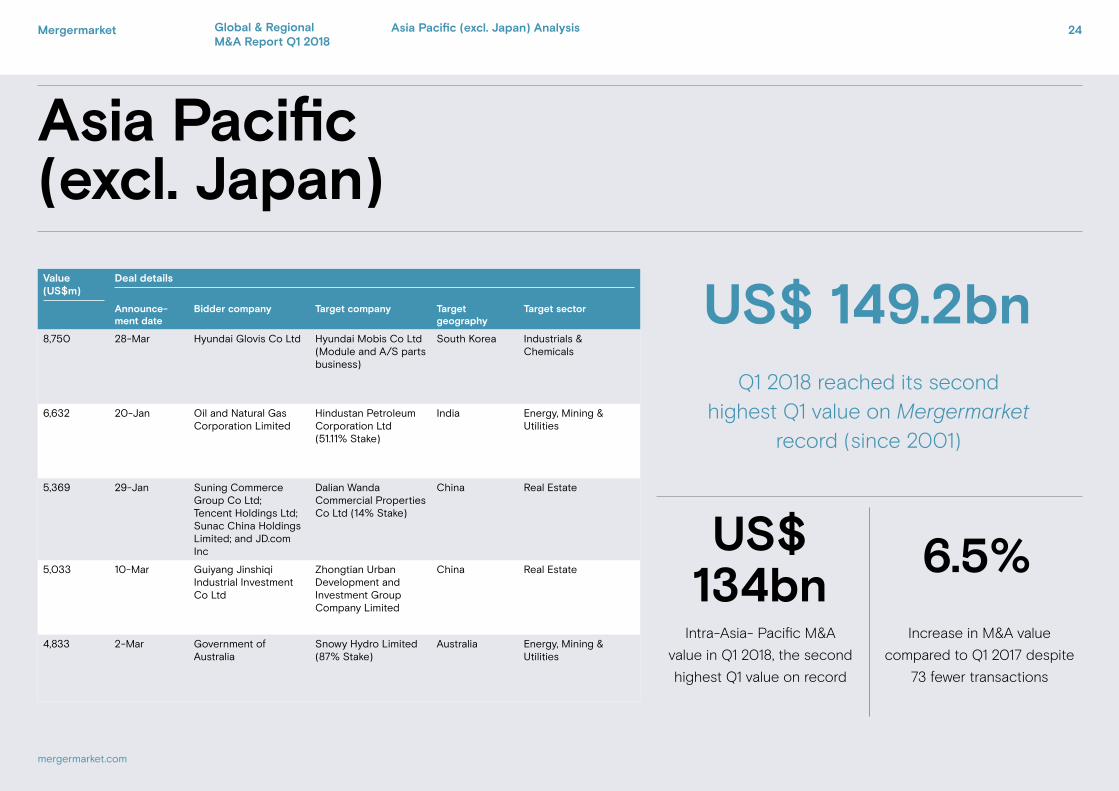
8,750 28-Mar Hyundai Glovis Co Ltd Hyundai Mobis Co Ltd (Module and A/S parts business)
South Korea Industrials & Chemicals
6,632 20-Jan Oil and Natural Gas Corporation Limited
Hindustan Petroleum Corporation Ltd (51.11% Stake)
India Energy, Mining & Utilities
5,369 29-Jan Suning Commerce Group Co Ltd; Tencent Holdings Ltd; Sunac China Holdings Limited; and JD.com Inc
Dalian Wanda Commercial Properties Co Ltd (14% Stake)
China Real Estate
5,033 10-Mar Guiyang Jinshiqi Industrial Investment Co Ltd
Zhongtian Urban Development and Investment Group Company Limited
China Real Estate
4,833 2-Mar Government of Australia
Snowy Hydro Limited (87% Stake)
Australia Energy, Mining & Utilities
Increase in M&A value
compared to Q1 2017 despite
73 fewer transactions
Intra-Asia- Pacific M&A
value in Q1 2018, the second
highest Q1 value on record
6.5%US$134bn
Q1 2018 reached its second highest Q1 value on Mergermarket
record (since 2001)
US$ 149.2bn
Global & Regional M&A Report Q1 2018
Asia Pacific (excl. Japan) Analysis
Mergermarket 25
mergermarket.com
Global & Regional M&A Report Q1 2018
“Following the overall global trend, the M&A activity in Asia-Pacific (excl. Japan) had a positive start to 2018 compared to last year”
Amy Wu, Senior Research Analyst
Asia Pacific (excl. Japan)
• Following the overall global trend, the M&A activity in Asia-Pacific (excl. Japan) had a positive start to 2018 compared to last year. The region witnessed 788 deals valued at US$ 149.2bn in the first quarter of 2018, up 6.5% by value compared to Q1 2017 (861 deals, US$ 140.1bn). The first quarter of the year marked the second highest Q1 value on Mergermarket record (since 2001), highlighting Asia-Pacific’s optimistic stance for dealmaking. The region saw four transactions over US$ 5bn, same as the first quarter in 2017, including the US$ 8.8bn acquisition of the South Korea based Hyundai Mobis by Hyundai Glovis’s module and A/S parts businesses from Hyundai Mobis, the largest deal targeting the region so far this year.
• Much of the region’s M&A activity continued to be driven by key sectors such as Industrials & Chemicals and Energy, Mining & Utilities (EMU). Industrials & Chemicals continued to be the most active sector in terms of both value and deal count with 167 deals worth US$ 29.5bn, accounting for 21.2% of deals in the region and 19.8% of the value. The Automotive sub-sector was a standout performer with 12 deals valued at a total US$ 14.8bn, up 420.4% by value with seven fewer deals compared to Q1 2017, largely due to the US$ 3.8bn asset-swap of Chinese electric-car manufacturer Beijing Electric Vehicle with Chengdu Qianfeng Electronics. With 63 deals announced worth US$ 26.9bn, Energy, Mining & Utilities was the second most dynamic sector in terms of deal value, yet down 6.2% compared to Q1 2017. EMU deals in the pipeline include Chinese clean energy service provider Beijing Enterprises Clean Energy Group’s intention to acquire several liquefied natural gas (LNG) terminal projects in North China, for up to CNY 6bn (US$ 953.2m) according to Mergermarket intelligence.
• Cross-border activity between Asia-Pacific (excl. Japan) and other regions had a quiet start to the year. Inbound M&A registered 128 deals totalling US$ 15.2bn, a decrease of 8.1% by value compared to Q1 2017. This marked the lowest quarterly number of foreign investments since Q1 2012. Across the whole Asia-Pacific (excl. Japan) region, Australia was the most attractive country to investors outside the region in terms of both deal value and count, recording 36 inbound transactions valued at US$ 6.4bn. The largest inbound transaction in the first quarter was Switzerland-based Glencore’s 82% stake acquisition in Hail Creek coal mine and 71.2% of the Valeria coal development project in Australia for a combined US$ 1.7bn. Outbound investment mirrored the downturn of inbound M&A, declining 14% in Q1 2018 to US$ 16.8bn from US$ 19.5bn in the same period last year.
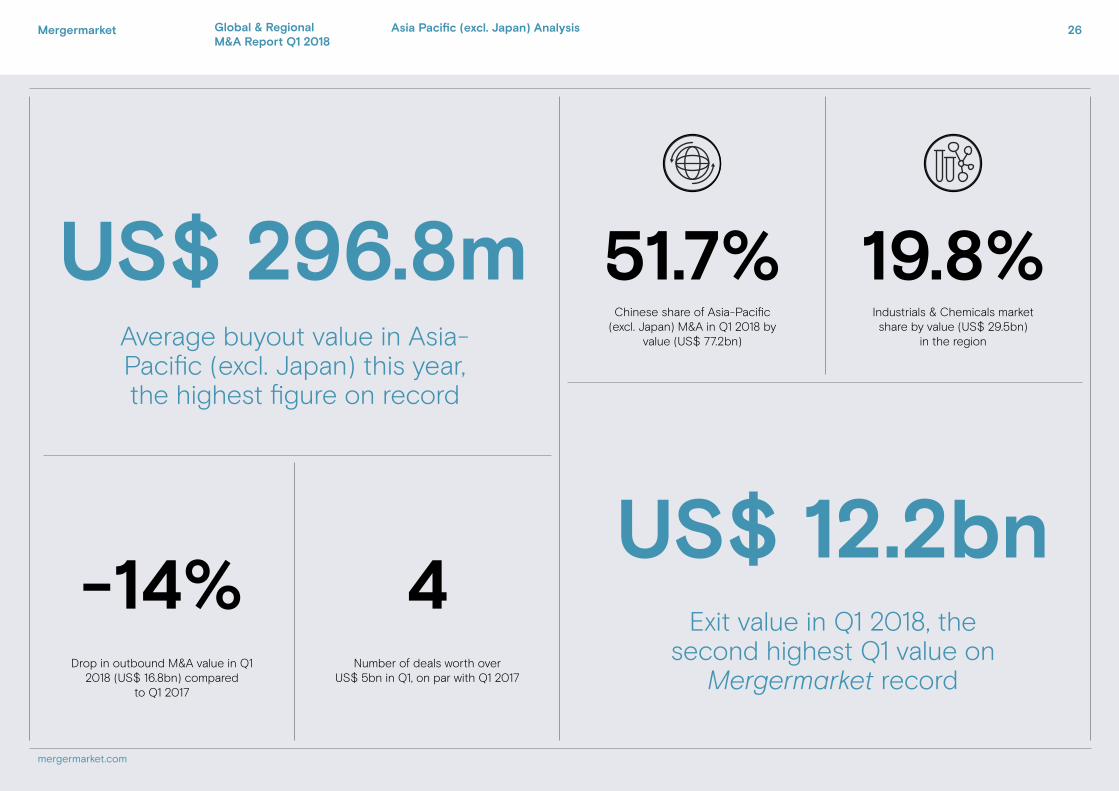
• On the other hand, private equity activity in the region had a stellar first quarter. Private equity buyouts targeting Asia-Pacific (excl. Japan) recorded 97 deals for US$ 24.3bn, up 37.1% by value with five fewer transactions compared to Q1 2017. These figures reflect an ongoing increase in deal sizes in private equity deals, with the average buyout in Q1 2018 reaching US$ 296.8m, the highest yearly buyout average on Mergermarket record. Meanwhile, exits soared to US$ 12.2bn in Q1 2018, up 20.1% compared to the same period in 2017. The region’s exit value marked the second best Q1 on Mergermarket record (since 2001). Exit deals announced included the Seaspan Corporation’s acquisition of an 89% stake in Greater China Intermodal Investments from Carlyle, Tiger Group Investments and The Washington Companies for US$ 1.4bn.
Asia Pacific (excl. Japan) Analysis
Mergermarket.com
Drop in outbound M&A value in Q1 2018 (US$ 16.8bn) compared
to Q1 2017
-14%Number of deals worth over
US$ 5bn in Q1, on par with Q1 2017
4
Industrials & Chemicals market share by value (US$ 29.5bn)
in the region
Chinese share of Asia-Pacific (excl. Japan) M&A in Q1 2018 by
value (US$ 77.2bn)Average buyout value in Asia-Pacific (excl. Japan) this year, the highest figure on record
US$ 296.8m 19.8%51.7%
US$ 12.2bnExit value in Q1 2018, the
second highest Q1 value on Mergermarket record
Mergermarket 26
mergermarket.com
Global & Regional M&A Report Q1 2018
Asia Pacific (excl. Japan) Analysis
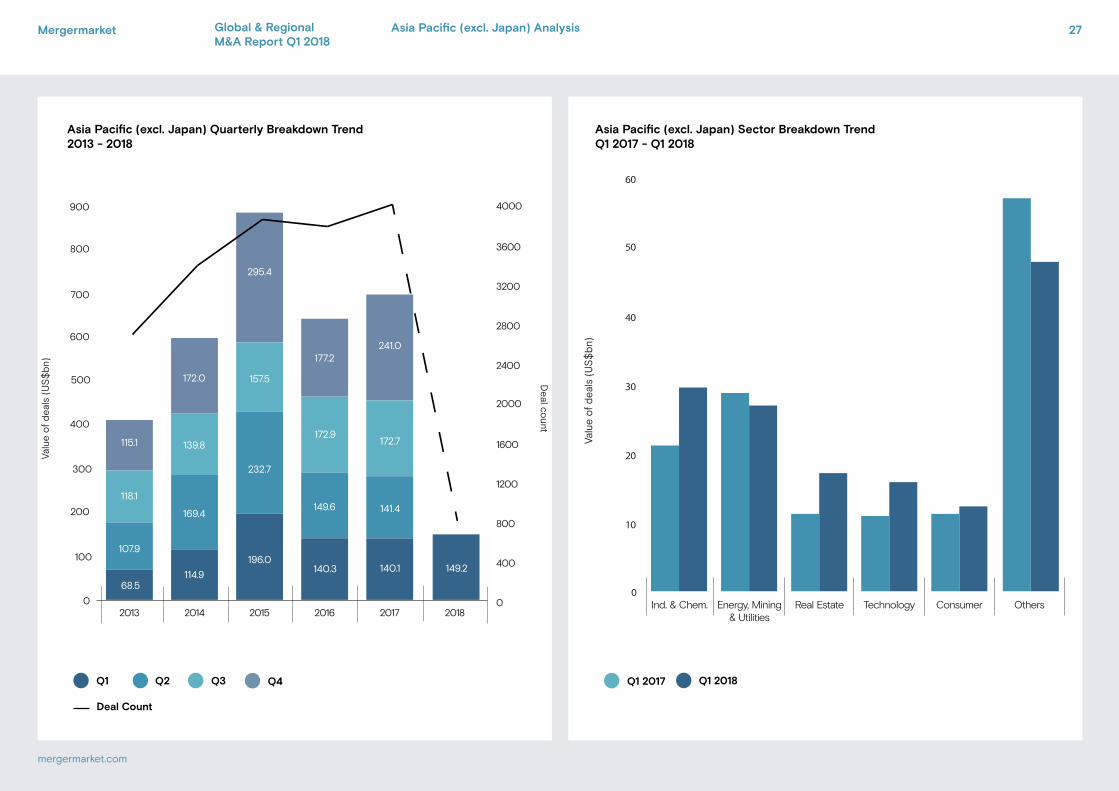
Chart title 1Chart title 2
Chart title 1Chart title 2
0
10
20
30
40
50
60
OthersConsumerTechnologyReal EstateEnergy, Mining& Utilities
Ind. & Chem.
Valu
e of
dea
ls (
US
$bn
)
Q1 2017 Q1 2018
0
100
200
300
400
500
600
700
800
900
2018201720162015201420130
400
800
1200
1600
2000
2400
2800
3200
3600
4000
118.1
172.0
169.4 141.4
115.1
68.5
149.6
177.2
172.9
140.3 149.2140.1
241.0
172.7
Valu
e of
dea
ls (
US
$b
n)
Deal co
unt
16.2
295.4
232.7
157.5
196.0
139.8
114.9
107.9
Q3Q2 Q4Q1
Deal Count
Asia Pacific (excl. Japan) Quarterly Breakdown Trend2013 - 2018
Asia Pacific (excl. Japan) Sector Breakdown TrendQ1 2017 - Q1 2018
27
mergermarket.com
Mergermarket Global & Regional M&A Report Q1 2018
Asia Pacific (excl. Japan) Analysis
Asia Pacific (excl. Japan) League tables
Asia Pacific (excl. Japan) league table by value Asia Pacific (excl. Japan) league table by deal count
Ranking Q1 2018 Q1 2017
Q1 2018
Q1 2017
Company name Value (US$m)
Deal count
Count change
Deal count
1 18 UBS Investment Bank 12,226 15 8 7
2 2 KPMG 1,612 15 -12 27
3 12 Citi 13,088 13 4 9
4 7 Deloitte 1,368 13 0 13
5 4 Goldman Sachs & Co 5,378 12 -8 20
6 10 CITIC Securities 13,576 11 1 10
7 9 Rothschild 3,205 11 1 10
8 15 Macquarie Group 2,757 9 1 8
9 1 EY 8,772 8 -20 28
10 23 Lazard 8,248 8 3 5
11 11 JPMorgan 6,410 8 -2 10
12 17 China Securities 5,467 8 0 8
13 20 China Renaissance Partners 4,830 8 1 7
14 13 Credit Suisse 2,340 8 -1 9
15 16 Huatai Securities 2,329 8 0 8
16 3 PwC 461 8 -13 21
17 14 Somerley Capital 2,973 7 -1 8
18 19 Bank of America Merrill Lynch 3,284 6 -1 7
19 5 Morgan Stanley 3,191 6 -8 14
20 31 Deutsche Bank 8,868 5 1 4
Ranking Q1 2018 Q1 2017
Q1 2018
Q1 2017
Company name Value (US$m)
Deal count
% Value change
Value (US$m)
1 15 CITIC Securities 13,576 11 34.2% 10,113
2 22 Citi 13,088 13 214.7% 4,159
3 3 UBS Investment Bank 12,226 15 -35.8% 19,039
4 27 Deutsche Bank 8,868 5 183.1% 3,132
5 23 EY 8,772 8 146.2% 3,563
6 21 Lazard 8,248 8 87.4% 4,401
7 66 JM Financial 8,092 2 1360.6% 554
8 - SBI Capital Markets 6,632 1 - -
9 17 JPMorgan 6,410 8 -24.1% 8,446
10 25 Haitong Securities 5,972 2 79.9% 3,320
11 7 China International Capital Corporation 5,754 5 -57.2% 13,449
12 34 China Securities 5,467 8 154.0% 2,152
13 2 Goldman Sachs & Co 5,378 12 -78.8% 25,314
14 18 China Renaissance Partners 4,830 8 -31.6% 7,065
15 5 Bank of America Merrill Lynch 3,284 6 -79.0% 15,644
16 4 Rothschild 3,205 11 -80.2% 16,160
17 1 Morgan Stanley 3,191 6 -91.9% 39,375
18 6 Somerley Capital 2,973 7 -79.3% 14,352
19 11 Macquarie Group 2,757 9 -77.6% 12,284
20 29 Credit Suisse 2,340 8 -23.3% 3,052
Mergermarket 28
mergermarket.com
Global & Regional M&A Report Q1 2018
Asia Pacific (excl. Japan) Analysis
Mergermarket 29
mergermarket.com
Japan
Value (US$m)
Deal details
Announce-ment date
Bidder company Target company Target sector Seller Company
1,143 24-Jan Sekisui House Reit Inc Sekisui House Residential Investment Corporation
Financial Services
1,117 20-Feb Mitsubishi Corporation Mitsubishi Motors Corporation (10.76% Stake)
Industrials & Chemicals
990 2-Mar Nippon Life Insurance Company
MassMutual Life Insurance Company (85.1% Stake)
Financial Services
Massachusetts Mutual Life Insurance Company
762 9-Mar Denso Corporation Renesas Electronics Corporation (4.5% Stake)
TMT Innovation Network Corporation of Japan
700 27-Feb eBay Inc Giosis Pte Ltd (Japan Business)
TMT Giosis Pte LtdShare of global M&A
value so far this year
Value of M&A targeting
Japan in Q1, on par
with Q1 2017
US$ 9bn
Value of outbound Japanese M&A in Q1 2018, 27.2%
higher than Q1 2017
US$ 18.8bn
Global & Regional M&A Report Q1 2018
Japan Analysis
1.0%
Mergermarket 30
mergermarket.com
Global & Regional M&A Report Q1 2018
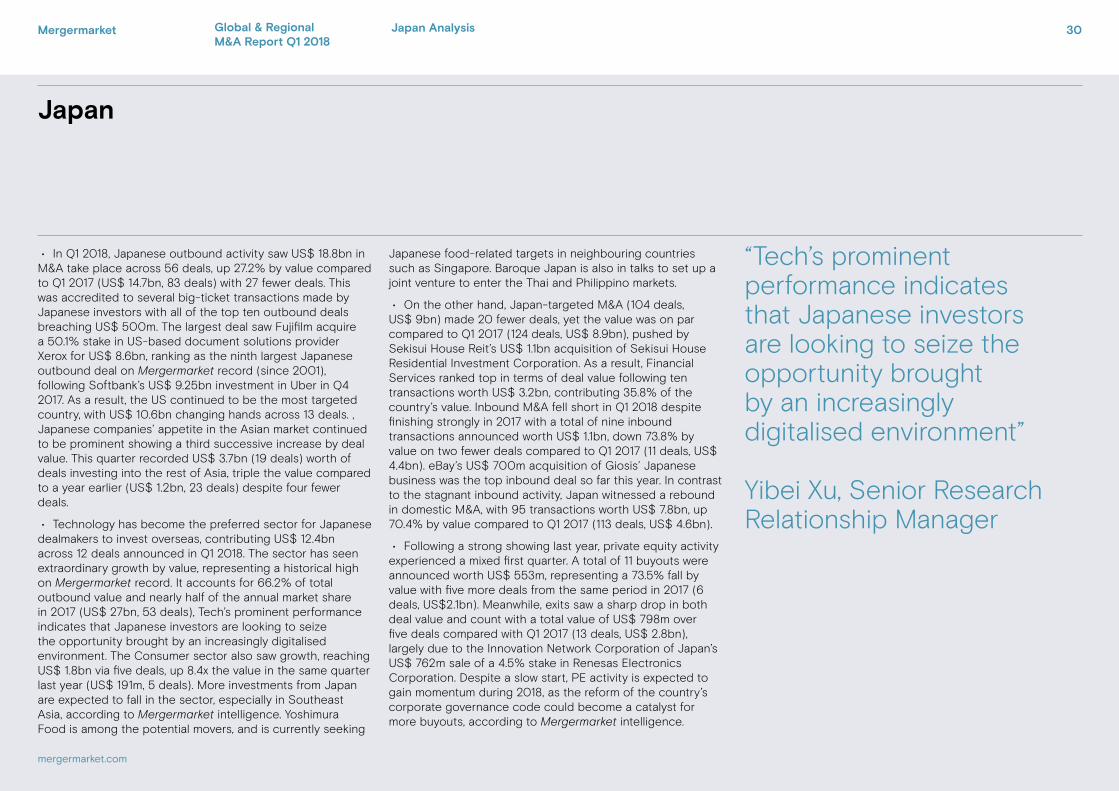
“Tech’s prominent performance indicates that Japanese investors are looking to seize the opportunity brought by an increasingly digitalised environment”
Yibei Xu, Senior Research Relationship Manager
Japan
Japan Analysis
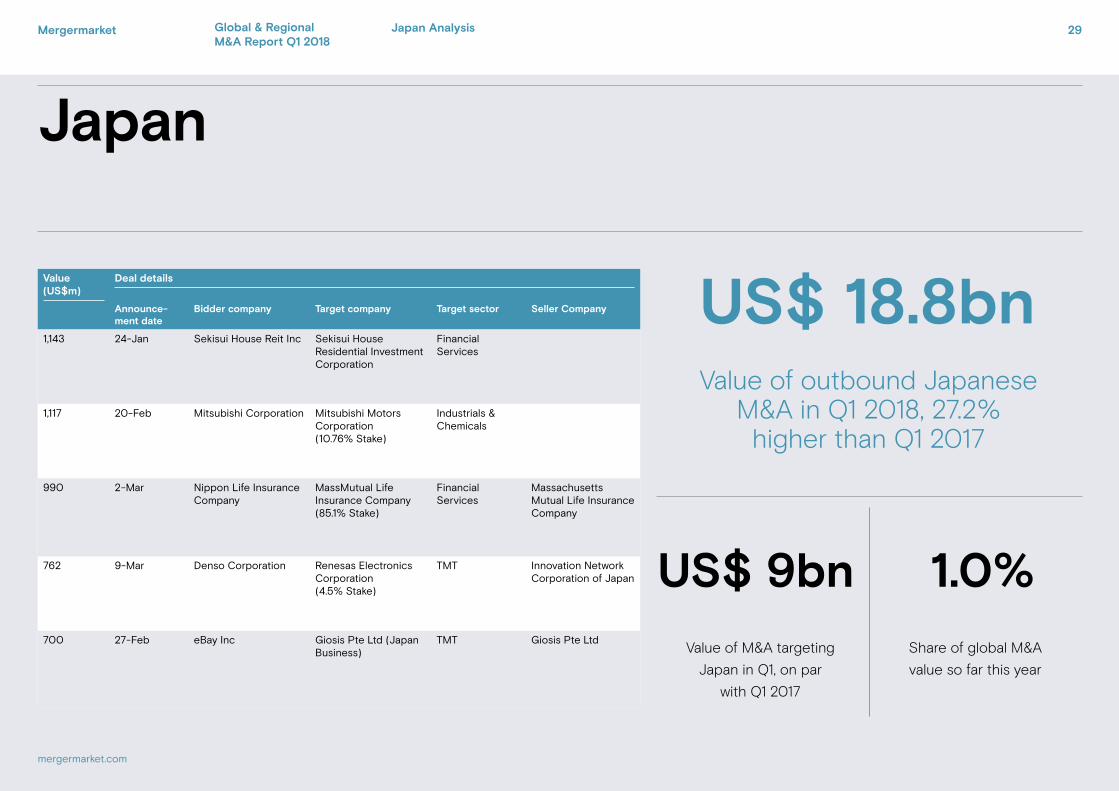
• In Q1 2018, Japanese outbound activity saw US$ 18.8bn in M&A take place across 56 deals, up 27.2% by value compared to Q1 2017 (US$ 14.7bn, 83 deals) with 27 fewer deals. This was accredited to several big-ticket transactions made by Japanese investors with all of the top ten outbound deals breaching US$ 500m. The largest deal saw Fujifilm acquire a 50.1% stake in US-based document solutions provider Xerox for US$ 8.6bn, ranking as the ninth largest Japanese outbound deal on Mergermarket record (since 2001), following Softbank’s US$ 9.25bn investment in Uber in Q4 2017. As a result, the US continued to be the most targeted country, with US$ 10.6bn changing hands across 13 deals. , Japanese companies’ appetite in the Asian market continued to be prominent showing a third successive increase by deal value. This quarter recorded US$ 3.7bn (19 deals) worth of deals investing into the rest of Asia, triple the value compared to a year earlier (US$ 1.2bn, 23 deals) despite four fewer deals.
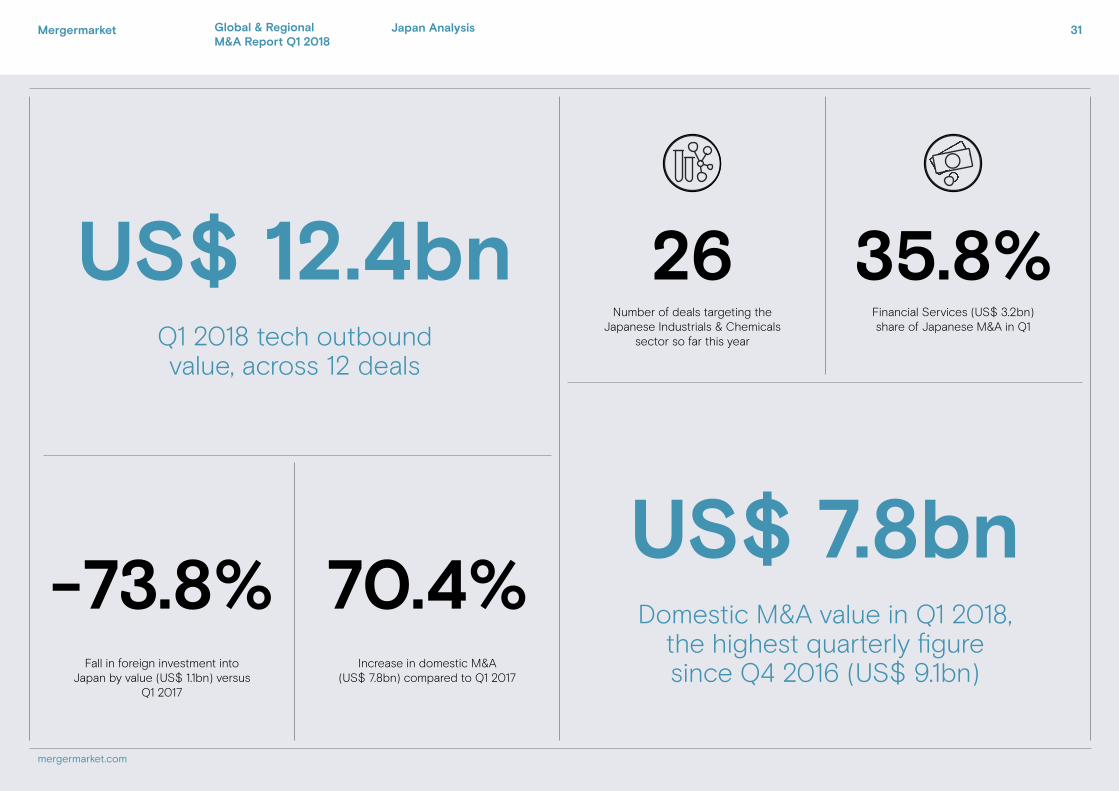
• Technology has become the preferred sector for Japanese dealmakers to invest overseas, contributing US$ 12.4bn across 12 deals announced in Q1 2018. The sector has seen extraordinary growth by value, representing a historical high on Mergermarket record. It accounts for 66.2% of total outbound value and nearly half of the annual market share in 2017 (US$ 27bn, 53 deals), Tech’s prominent performance indicates that Japanese investors are looking to seize the opportunity brought by an increasingly digitalised environment. The Consumer sector also saw growth, reaching US$ 1.8bn via five deals, up 8.4x the value in the same quarter last year (US$ 191m, 5 deals). More investments from Japan are expected to fall in the sector, especially in Southeast Asia, according to Mergermarket intelligence. Yoshimura Food is among the potential movers, and is currently seeking
Japanese food-related targets in neighbouring countries such as Singapore. Baroque Japan is also in talks to set up a joint venture to enter the Thai and Philippino markets.
• On the other hand, Japan-targeted M&A (104 deals, US$ 9bn) made 20 fewer deals, yet the value was on par compared to Q1 2017 (124 deals, US$ 8.9bn), pushed by Sekisui House Reit’s US$ 1.1bn acquisition of Sekisui House Residential Investment Corporation. As a result, Financial Services ranked top in terms of deal value following ten transactions worth US$ 3.2bn, contributing 35.8% of the country’s value. Inbound M&A fell short in Q1 2018 despite finishing strongly in 2017 with a total of nine inbound transactions announced worth US$ 1.1bn, down 73.8% by value on two fewer deals compared to Q1 2017 (11 deals, US$ 4.4bn). eBay’s US$ 700m acquisition of Giosis’ Japanese business was the top inbound deal so far this year. In contrast to the stagnant inbound activity, Japan witnessed a rebound in domestic M&A, with 95 transactions worth US$ 7.8bn, up 70.4% by value compared to Q1 2017 (113 deals, US$ 4.6bn).
• Following a strong showing last year, private equity activity experienced a mixed first quarter. A total of 11 buyouts were announced worth US$ 553m, representing a 73.5% fall by value with five more deals from the same period in 2017 (6 deals, US$2.1bn). Meanwhile, exits saw a sharp drop in both deal value and count with a total value of US$ 798m over five deals compared with Q1 2017 (13 deals, US$ 2.8bn), largely due to the Innovation Network Corporation of Japan’s US$ 762m sale of a 4.5% stake in Renesas Electronics Corporation. Despite a slow start, PE activity is expected to gain momentum during 2018, as the reform of the country’s corporate governance code could become a catalyst for more buyouts, according to Mergermarket intelligence.
Mergermarket.com
Fall in foreign investment into Japan by value (US$ 1.1bn) versus
Q1 2017
-73.8%Increase in domestic M&A
(US$ 7.8bn) compared to Q1 2017
70.4%
Financial Services (US$ 3.2bn) share of Japanese M&A in Q1
Number of deals targeting the Japanese Industrials & Chemicals
sector so far this yearQ1 2018 tech outbound value, across 12 deals
US$ 12.4bn 35.8%26
Domestic M&A value in Q1 2018, the highest quarterly figure since Q4 2016 (US$ 9.1bn)
US$ 7.8bn
Mergermarket 31
mergermarket.com
Global & Regional M&A Report Q1 2018
Japan Analysis
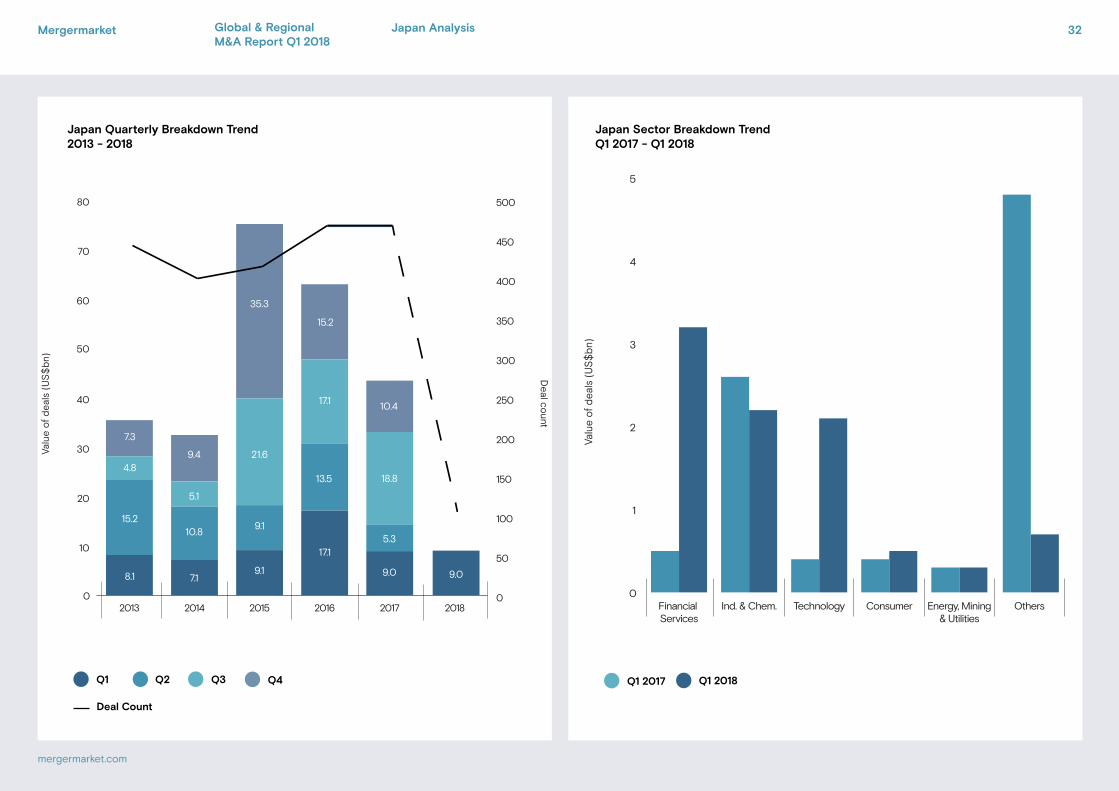
Chart title 1Chart title 2
Chart title 1Chart title 2
0
1
2
3
4
5
OthersEnergy, Mining& Utilities
ConsumerTechnologyInd. & Chem.Financial Services
Valu
e of
dea
ls (
US
$bn
)
Q1 2017 Q1 2018
0
10
20
30
40
50
60
70
80
2018201720162015201420130
50
100
150
200
250
300
350
400
450
500
4.89.4
10.85.3
7.3
15.2
8.1
13.5
15.2
17.1
17.1
9.09.0
18.8
10.4
Valu
e of
dea
ls (
US
$b
n)
Deal co
unt
35.3
21.6
9.1
9.1
5.1
7.1
Q3Q2 Q4Q1
Deal Count
Japan Quarterly Breakdown Trend2013 - 2018
Japan Sector Breakdown TrendQ1 2017 - Q1 2018
32
mergermarket.com
Mergermarket Global & Regional M&A Report Q1 2018
Japan Analysis
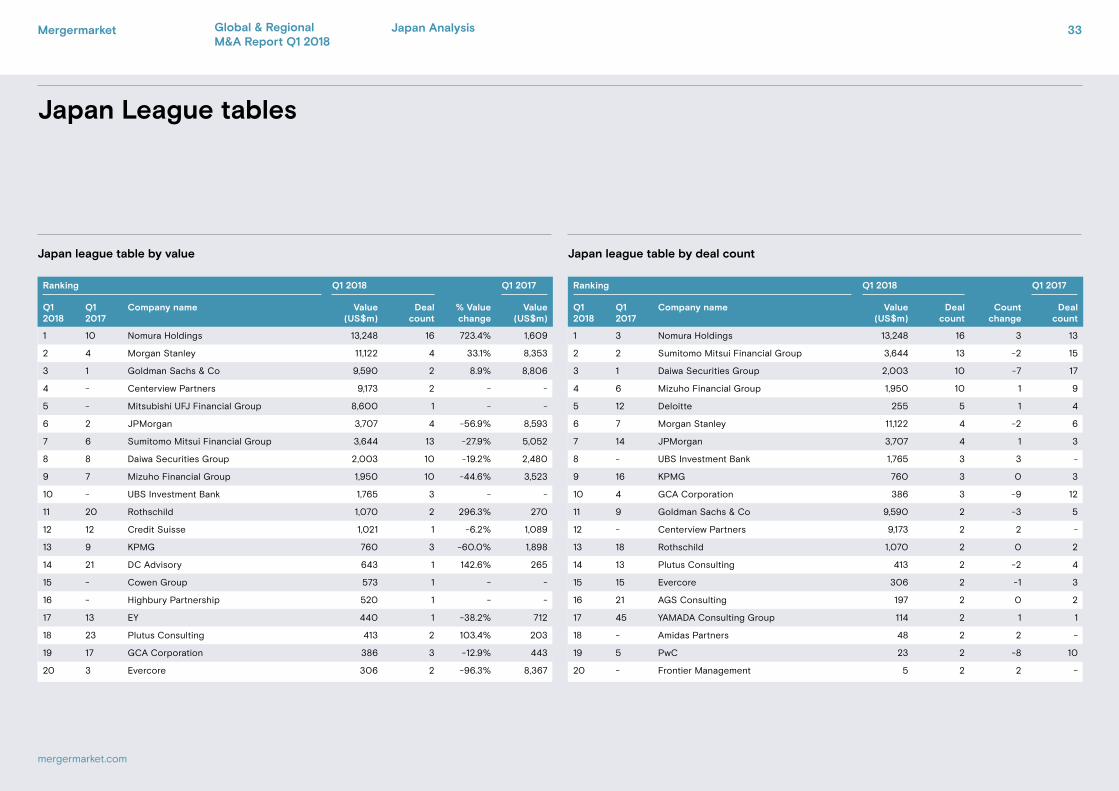
Japan League tables
Japan league table by value Japan league table by deal count
Ranking Q1 2018 Q1 2017
Q1 2018
Q1 2017
Company name Value (US$m)
Deal count
Count change
Deal count
1 3 Nomura Holdings 13,248 16 3 13
2 2 Sumitomo Mitsui Financial Group 3,644 13 -2 15
3 1 Daiwa Securities Group 2,003 10 -7 17
4 6 Mizuho Financial Group 1,950 10 1 9
5 12 Deloitte 255 5 1 4
6 7 Morgan Stanley 11,122 4 -2 6
7 14 JPMorgan 3,707 4 1 3
8 - UBS Investment Bank 1,765 3 3 -
9 16 KPMG 760 3 0 3
10 4 GCA Corporation 386 3 -9 12
11 9 Goldman Sachs & Co 9,590 2 -3 5
12 - Centerview Partners 9,173 2 2 -
13 18 Rothschild 1,070 2 0 2
14 13 Plutus Consulting 413 2 -2 4
15 15 Evercore 306 2 -1 3
16 21 AGS Consulting 197 2 0 2
17 45 YAMADA Consulting Group 114 2 1 1
18 - Amidas Partners 48 2 2 -
19 5 PwC 23 2 -8 10
20 - Frontier Management 5 2 2 -
Ranking Q1 2018 Q1 2017
Q1 2018
Q1 2017
Company name Value (US$m)
Deal count
% Value change
Value (US$m)
1 10 Nomura Holdings 13,248 16 723.4% 1,609
2 4 Morgan Stanley 11,122 4 33.1% 8,353
3 1 Goldman Sachs & Co 9,590 2 8.9% 8,806
4 - Centerview Partners 9,173 2 - -
5 - Mitsubishi UFJ Financial Group 8,600 1 - -
6 2 JPMorgan 3,707 4 -56.9% 8,593
7 6 Sumitomo Mitsui Financial Group 3,644 13 -27.9% 5,052
8 8 Daiwa Securities Group 2,003 10 -19.2% 2,480
9 7 Mizuho Financial Group 1,950 10 -44.6% 3,523
10 - UBS Investment Bank 1,765 3 - -
11 20 Rothschild 1,070 2 296.3% 270
12 12 Credit Suisse 1,021 1 -6.2% 1,089
13 9 KPMG 760 3 -60.0% 1,898
14 21 DC Advisory 643 1 142.6% 265
15 - Cowen Group 573 1 - -
16 - Highbury Partnership 520 1 - -
17 13 EY 440 1 -38.2% 712
18 23 Plutus Consulting 413 2 103.4% 203
19 17 GCA Corporation 386 3 -12.9% 443
20 3 Evercore 306 2 -96.3% 8,367
Mergermarket 33
mergermarket.com
Global & Regional M&A Report Q1 2018
Japan Analysis
Mergermarket 34
mergermarket.com
Middle East & Africa
Value (US$m)
Deal details
Announce-ment date
Bidder company Target company Target geography
Target sector
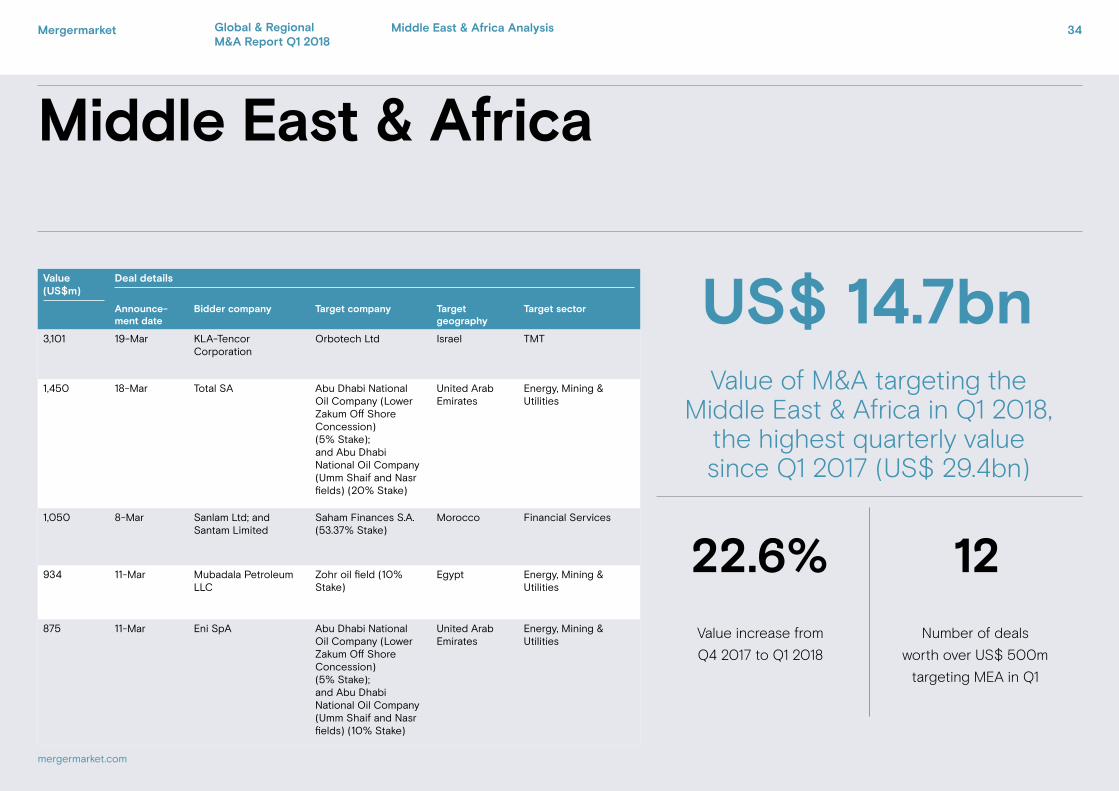
3,101 19-Mar KLA-Tencor Corporation
Orbotech Ltd Israel TMT
1,450 18-Mar Total SA Abu Dhabi National Oil Company (Lower Zakum Off Shore Concession) (5% Stake); and Abu Dhabi National Oil Company (Umm Shaif and Nasr fields) (20% Stake)
United Arab Emirates
Energy, Mining & Utilities
1,050 8-Mar Sanlam Ltd; and Santam Limited
Saham Finances S.A. (53.37% Stake)
Morocco Financial Services
934 11-Mar Mubadala Petroleum LLC
Zohr oil field (10% Stake)
Egypt Energy, Mining & Utilities
875 11-Mar Eni SpA Abu Dhabi National Oil Company (Lower Zakum Off Shore Concession) (5% Stake); and Abu Dhabi National Oil Company (Umm Shaif and Nasr fields) (10% Stake)
United Arab Emirates
Energy, Mining & Utilities
Number of deals
worth over US$ 500m
targeting MEA in Q1
Value increase from
Q4 2017 to Q1 2018
1222.6%
Value of M&A targeting the Middle East & Africa in Q1 2018,
the highest quarterly value since Q1 2017 (US$ 29.4bn)
US$ 14.7bn
Global & Regional M&A Report Q1 2018
Middle East & Africa Analysis
Mergermarket 35
mergermarket.com
Global & Regional M&A Report Q1 2018
“Continued political uncertainty appears to be hitting South African dealmakers and has led to a considerable drop in activity in the first quarter”
Jonathan Klonowski, Research Editor (EMEA)
Middle East & Africa
Middle East & Africa Analysis
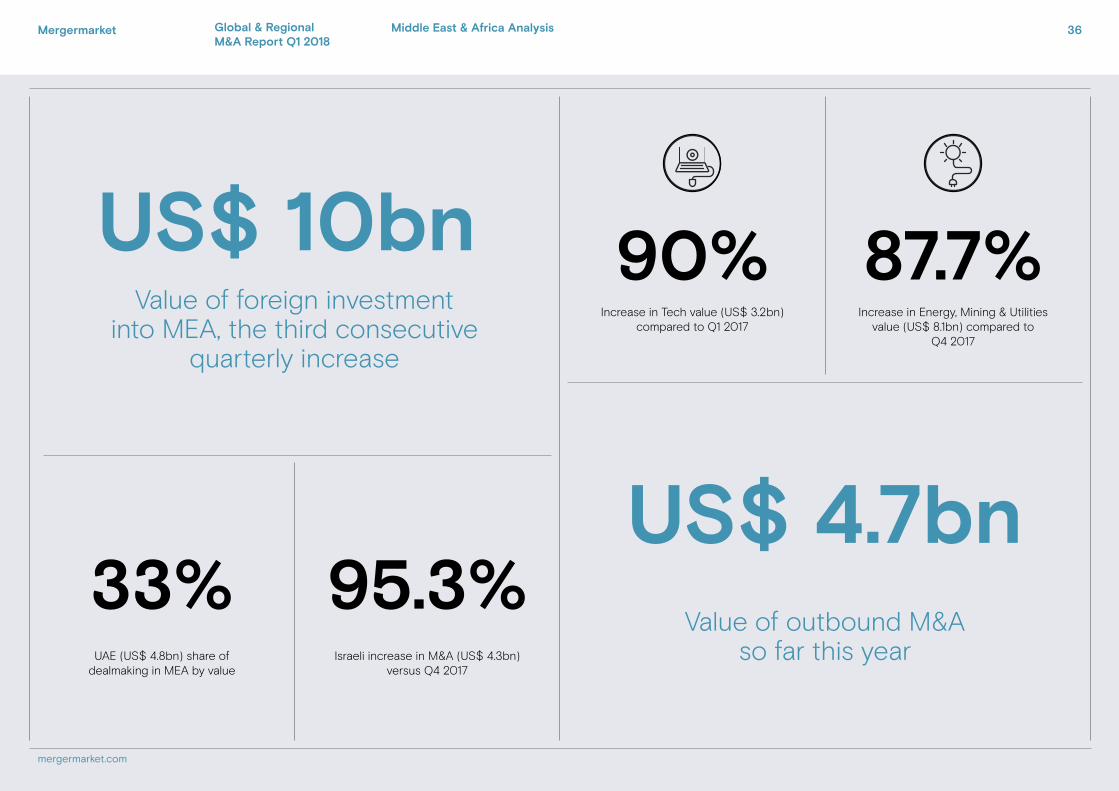
• A flurry of deals in March pushed M&A in the Middle East & Africa (MEA) region to its highest quarterly value since Q1 2017 (US$ 29.4bn). The region received 66 deals worth a total US$ 14.7bn, 22.6% higher than the US$ 12bn (113 deals) seen in Q4 2017, with MEA now seeing its third consecutive quarter with over US$ 10bn invested. There were three deals worth over US$ 1bn targeting MEA so far this year, with the largest being KLA-Tencor’s US$ 3.1bn acquisition of Israeli firm Orbotech. The region accounted for a 1.6% share of global M&A value in Q1, largely on par with the average percentage seen throughout 2017 at 2%.
• Due to higher valued deals into the country, the UAE has seen a tremendous increase in dealmaking so far this year, becoming the most targeted country by value in the region following 11 deals worth US$ 4.8bn. The country has already surpassed its annual total value seen in 2017, when US$ 4.6bn (56 deals) was invested. Israel, which hit its highest annual value on Mergermarket (since 2001) in 2017 with US$ 25.7bn, continues to be active in 2018. The country has once again received the most deals in MEA by deal count, with 17 deals worth US$ 4.3bn announced over the last three months, also almost doubling in value from the US$ 2.2bn (23 deals) seen in Q4 2017. Continued political uncertainty appears to be hitting South African dealmakers and has led to a considerable drop in activity in the first quarter as the country saw just six deals announced on Mergermarket worth a total US$ 177m,.
• Foreign investment into the region was a key component to dealmaking in MEA, with 39 deals worth US$ 10bn announced in the first quarter of 2018, representing the third highest start to the year by value since the financial crisis. The first quarter of 2018 was also the largest quarterly value for inbound M&A since Q1 2017 (US$ 24bn), which included Intel’s US$ 15bn takeover of Mobileye, announced in March 2017. The UK has been the most active investor into MEA by deal count, with nine deals worth US$ 1.1bn so far this year. The number of investments from the US has taken a small downturn with just six deals (US$ 3.2bn) into the region in Q1, the lowest number in a quarter since Q2 2009 (four deals).
• Energy, Mining & Utilities (EMU) has been the most targeted sector by both value and number of deals in the first quarter, receiving US$ 8.1bn. More stability in commodity markets has pushed the sector’s M&A up 27.9% by value in comparison to Q1 2017 (US$ 6.4bn), with Q1 2018 hitting its highest quarterly value in the sector since Q1 2013 (US$ 8.5bn) becoming only the third quarter since the start of 2010 to surpass US$ 8bn. There have been nine deals worth over US$ 500m announced in the EMU sector so far this year, including Total’s investments into the Lower Zakum off-shore field and the Umm Shair and Nasr fields from the Abu Dhabi National Oil Company for a combined US$ 1.45bn, announced in mid-March. Industrials & Chemicals was the second most targeted sector by deal count with nine deals worth US$ 168m.
Mergermarket.com
US$ 4.7bnValue of outbound M&A
so far this yearIsraeli increase in M&A (US$ 4.3bn) versus Q4 2017
95.3%UAE (US$ 4.8bn) share of
dealmaking in MEA by value
33%
Increase in Energy, Mining & Utilities value (US$ 8.1bn) compared to
Q4 2017
Increase in Tech value (US$ 3.2bn) compared to Q1 2017
Value of foreign investment into MEA, the third consecutive
quarterly increase
US$ 10bn 87.7%90%
Mergermarket 36
mergermarket.com
Global & Regional M&A Report Q1 2018
Middle East & Africa Analysis
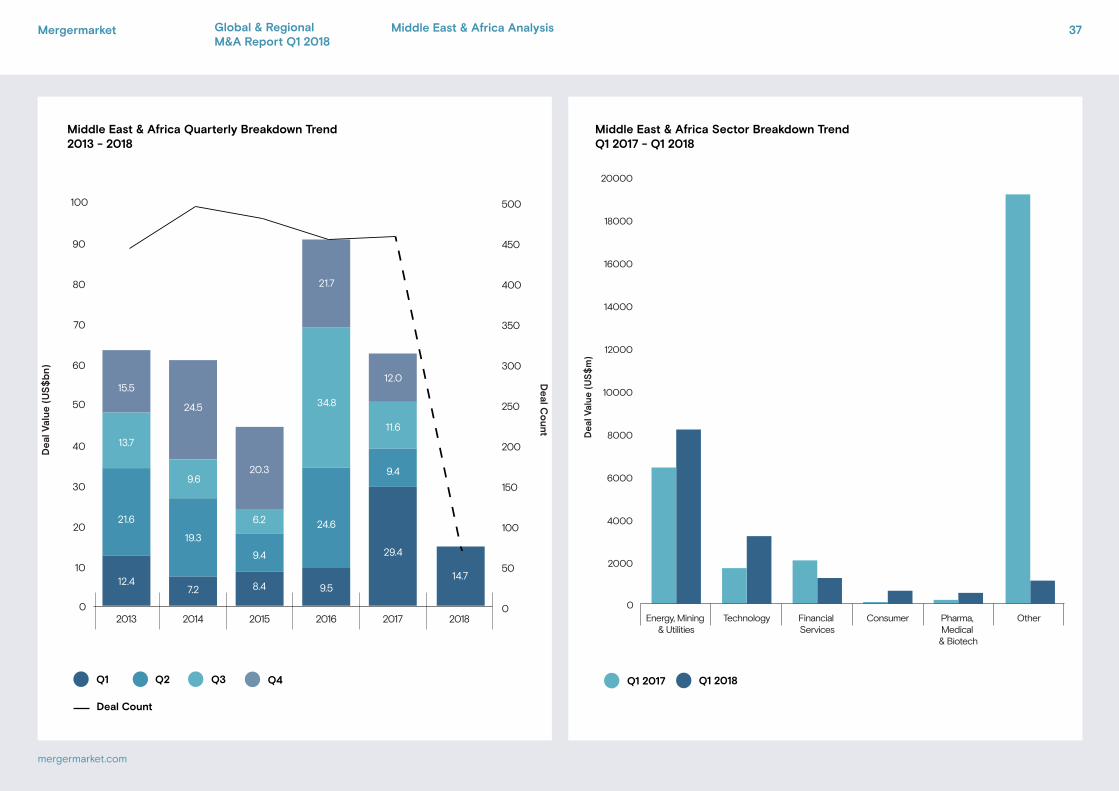
Chart title 1Chart title 2
Chart title 1Chart title 2
0
2000
4000
6000
8000
10000
12000
14000
16000
18000
20000
OtherPharma, Medical & Biotech
ConsumerFinancial Services
TechnologyEnergy, Mining & Utilities
Dea
l Val
ue (
US
$m
)
Q1 2017 Q1 2018
0
10
20
30
40
50
60
70
80
90
100
2018201720162015201420130
50
100
150
200
250
300
350
400
450
500
24.5
19.3
15.5
13.7
29.49.4
6.2
8.4
9.4
34.8
Dea
l Val
ue
(US
$b
n)
Deal C
ount
20.3
21.7
9.5
24.6
7.2
9.6
21.6
12.4
11.6
12.0
14.7
Q3Q2 Q4Q1
Deal Count
Middle East & Africa Quarterly Breakdown Trend2013 - 2018
Middle East & Africa Sector Breakdown TrendQ1 2017 - Q1 2018
37
mergermarket.com
Mergermarket Global & Regional M&A Report Q1 2018
Middle East & Africa Analysis
Middle East & Africa League tables
MEA league table by value MEA league table by deal count
Ranking Q1 2018 Q1 2017
Q1 2018
Q1 2017
Company name Value (US$m)
Deal count
Count change
Deal count
1 10 Goldman Sachs & Co 7,598 5 3 2
2 14 JPMorgan 3,812 4 2 2
3 2 Rothschild 1,352 4 -2 6
4 29 Barclays 3,899 2 1 1
5 21 UBS Investment Bank 2,594 2 1 1
6 6 Bank of America Merrill Lynch 316 2 -1 3
7 36 Rand Merchant Bank 283 2 1 1
8 5 KPMG 35 2 -2 4
9 12 HSBC 2,502 1 -1 2
10 - Kempen & Co 1,727 1 1 -
11 8 Investec 1,050 1 -2 3
12 11 Morgan Stanley 537 1 -1 2
13 7 Lazard 497 1 -2 3
14 - Pangaea Securities 385 1 1 -
15 1 Citi 317 1 -7 8
16 28 Deutsche Bank 316 1 0 1
17= - Standard Bank Group 260 1 1 -
17= - Treadstone Resource Partners 260 1 1 -
19= - DH Consultants 226 1 1 -
19= - Standard Chartered 226 1 1 -
Ranking Q1 2018 Q1 2017
Q1 2018
Q1 2017
Company name Value (US$m)
Deal count
% Value change
Value (US$m)
1 3 Goldman Sachs & Co 7,598 5 -51.2% 15,572
2 26 Barclays 3,899 2 2180.1% 171
3 14 JPMorgan 3,812 4 278.2% 1,008
4 13 UBS Investment Bank 2,594 2 141.5% 1,074
5 8 HSBC 2,502 1 35.5% 1,847
6 - Kempen & Co 1,727 1 - -
7 2 Rothschild 1,352 4 -91.3% 15,579
8 24 Investec 1,050 1 368.8% 224
9 5 Morgan Stanley 537 1 -93.2% 7,900
10 9 Lazard 497 1 -70.6% 1,692
11 - Pangaea Securities 385 1 - -
12 1 Citi 317 1 -98.5% 21,488
13 6 Bank of America Merrill Lynch 316 2 -91.8% 3,871
14 23 Deutsche Bank 316 1 13.3% 279
15 35 Rand Merchant Bank 283 2 434.0% 53
16= - Standard Bank Group 260 1 - -
16= - Treadstone Resource Partners 260 1 - -
18= - DH Consultants 226 1 - -
18= - Standard Chartered 226 1 - -
20 - Duff & Phelps 220 1 - -
Mergermarket 38
mergermarket.com
Global & Regional M&A Report Q1 2018
Middle East & Africa Analysis
M&A Rankings by deal value and deal count for a wide range of regions.
M&A and PE Financial Advisory League Tables
Mergermarket 39
mergermarket.com
Global & Regional M&A Report Q1 2018
League Tables
Global Advisory League tables
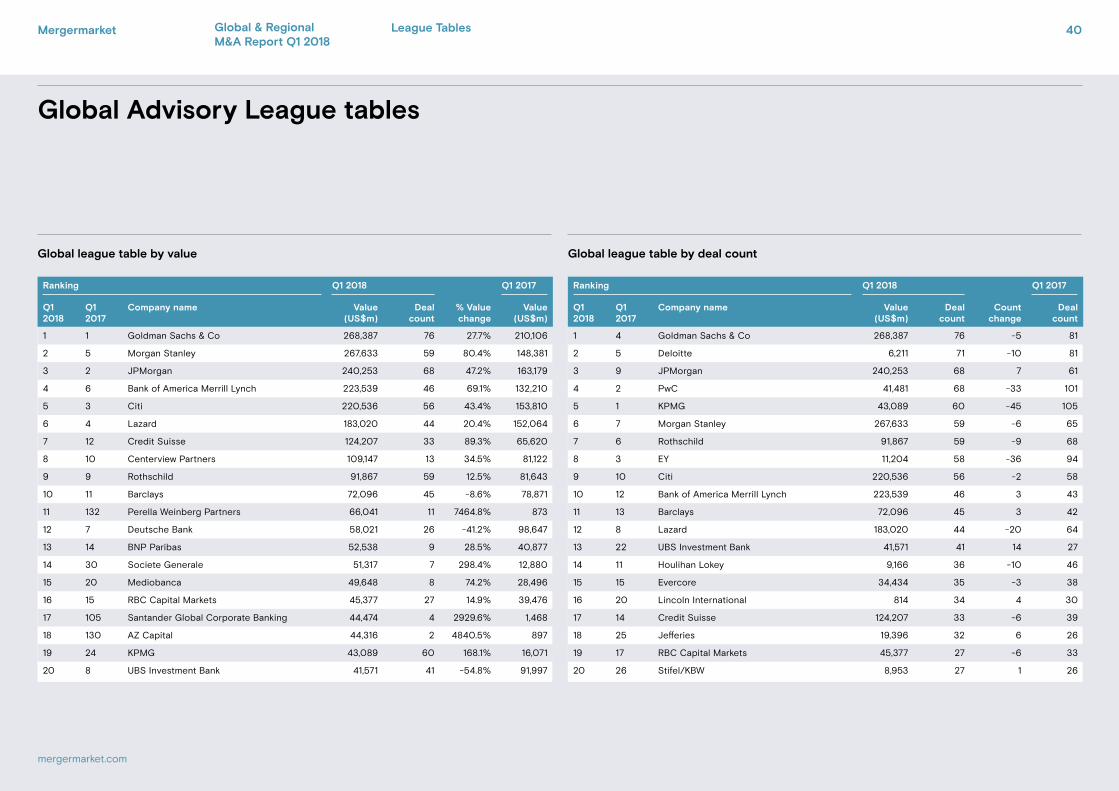
Global league table by value Global league table by deal count
Ranking Q1 2018 Q1 2017
Q1 2018
Q1 2017
Company name Value (US$m)
Deal count
Count change
Deal count
1 4 Goldman Sachs & Co 268,387 76 -5 81
2 5 Deloitte 6,211 71 -10 81
3 9 JPMorgan 240,253 68 7 61
4 2 PwC 41,481 68 -33 101
5 1 KPMG 43,089 60 -45 105
6 7 Morgan Stanley 267,633 59 -6 65
7 6 Rothschild 91,867 59 -9 68
8 3 EY 11,204 58 -36 94
9 10 Citi 220,536 56 -2 58
10 12 Bank of America Merrill Lynch 223,539 46 3 43
11 13 Barclays 72,096 45 3 42
12 8 Lazard 183,020 44 -20 64
13 22 UBS Investment Bank 41,571 41 14 27
14 11 Houlihan Lokey 9,166 36 -10 46
15 15 Evercore 34,434 35 -3 38
16 20 Lincoln International 814 34 4 30
17 14 Credit Suisse 124,207 33 -6 39
18 25 Jefferies 19,396 32 6 26
19 17 RBC Capital Markets 45,377 27 -6 33
20 26 Stifel/KBW 8,953 27 1 26
Ranking Q1 2018 Q1 2017
Q1 2018
Q1 2017
Company name Value (US$m)
Deal count
% Value change
Value (US$m)
1 1 Goldman Sachs & Co 268,387 76 27.7% 210,106
2 5 Morgan Stanley 267,633 59 80.4% 148,381
3 2 JPMorgan 240,253 68 47.2% 163,179
4 6 Bank of America Merrill Lynch 223,539 46 69.1% 132,210
5 3 Citi 220,536 56 43.4% 153,810
6 4 Lazard 183,020 44 20.4% 152,064
7 12 Credit Suisse 124,207 33 89.3% 65,620
8 10 Centerview Partners 109,147 13 34.5% 81,122
9 9 Rothschild 91,867 59 12.5% 81,643
10 11 Barclays 72,096 45 -8.6% 78,871
11 132 Perella Weinberg Partners 66,041 11 7464.8% 873
12 7 Deutsche Bank 58,021 26 -41.2% 98,647
13 14 BNP Paribas 52,538 9 28.5% 40,877
14 30 Societe Generale 51,317 7 298.4% 12,880
15 20 Mediobanca 49,648 8 74.2% 28,496
16 15 RBC Capital Markets 45,377 27 14.9% 39,476
17 105 Santander Global Corporate Banking 44,474 4 2929.6% 1,468
18 130 AZ Capital 44,316 2 4840.5% 897
19 24 KPMG 43,089 60 168.1% 16,071
20 8 UBS Investment Bank 41,571 41 -54.8% 91,997
Mergermarket 40
mergermarket.com
Global & Regional M&A Report Q1 2018
League Tables
EMEA Advisory League tables
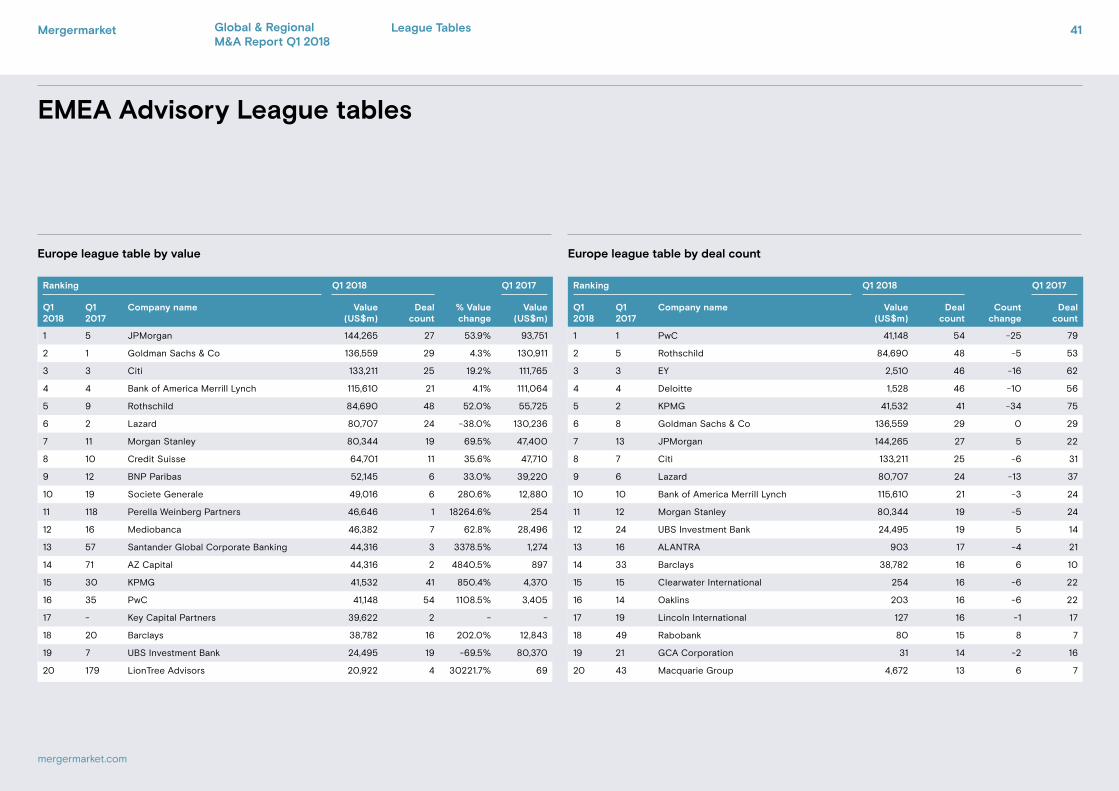
Europe league table by value Europe league table by deal count
Ranking Q1 2018 Q1 2017
Q1 2018
Q1 2017
Company name Value (US$m)
Deal count
Count change
Deal count
1 1 PwC 41,148 54 -25 79
2 5 Rothschild 84,690 48 -5 53
3 3 EY 2,510 46 -16 62
4 4 Deloitte 1,528 46 -10 56
5 2 KPMG 41,532 41 -34 75
6 8 Goldman Sachs & Co 136,559 29 0 29
7 13 JPMorgan 144,265 27 5 22
8 7 Citi 133,211 25 -6 31
9 6 Lazard 80,707 24 -13 37
10 10 Bank of America Merrill Lynch 115,610 21 -3 24
11 12 Morgan Stanley 80,344 19 -5 24
12 24 UBS Investment Bank 24,495 19 5 14
13 16 ALANTRA 903 17 -4 21
14 33 Barclays 38,782 16 6 10
15 15 Clearwater International 254 16 -6 22
16 14 Oaklins 203 16 -6 22
17 19 Lincoln International 127 16 -1 17
18 49 Rabobank 80 15 8 7
19 21 GCA Corporation 31 14 -2 16
20 43 Macquarie Group 4,672 13 6 7
Ranking Q1 2018 Q1 2017
Q1 2018
Q1 2017
Company name Value (US$m)
Deal count
% Value change
Value (US$m)
1 5 JPMorgan 144,265 27 53.9% 93,751
2 1 Goldman Sachs & Co 136,559 29 4.3% 130,911
3 3 Citi 133,211 25 19.2% 111,765
4 4 Bank of America Merrill Lynch 115,610 21 4.1% 111,064
5 9 Rothschild 84,690 48 52.0% 55,725
6 2 Lazard 80,707 24 -38.0% 130,236
7 11 Morgan Stanley 80,344 19 69.5% 47,400
8 10 Credit Suisse 64,701 11 35.6% 47,710
9 12 BNP Paribas 52,145 6 33.0% 39,220
10 19 Societe Generale 49,016 6 280.6% 12,880
11 118 Perella Weinberg Partners 46,646 1 18264.6% 254
12 16 Mediobanca 46,382 7 62.8% 28,496
13 57 Santander Global Corporate Banking 44,316 3 3378.5% 1,274
14 71 AZ Capital 44,316 2 4840.5% 897
15 30 KPMG 41,532 41 850.4% 4,370
16 35 PwC 41,148 54 1108.5% 3,405
17 - Key Capital Partners 39,622 2 - -
18 20 Barclays 38,782 16 202.0% 12,843
19 7 UBS Investment Bank 24,495 19 -69.5% 80,370
20 179 LionTree Advisors 20,922 4 30221.7% 69
Mergermarket 41
mergermarket.com
Global & Regional M&A Report Q1 2018
League Tables
EMEA Advisory League tables
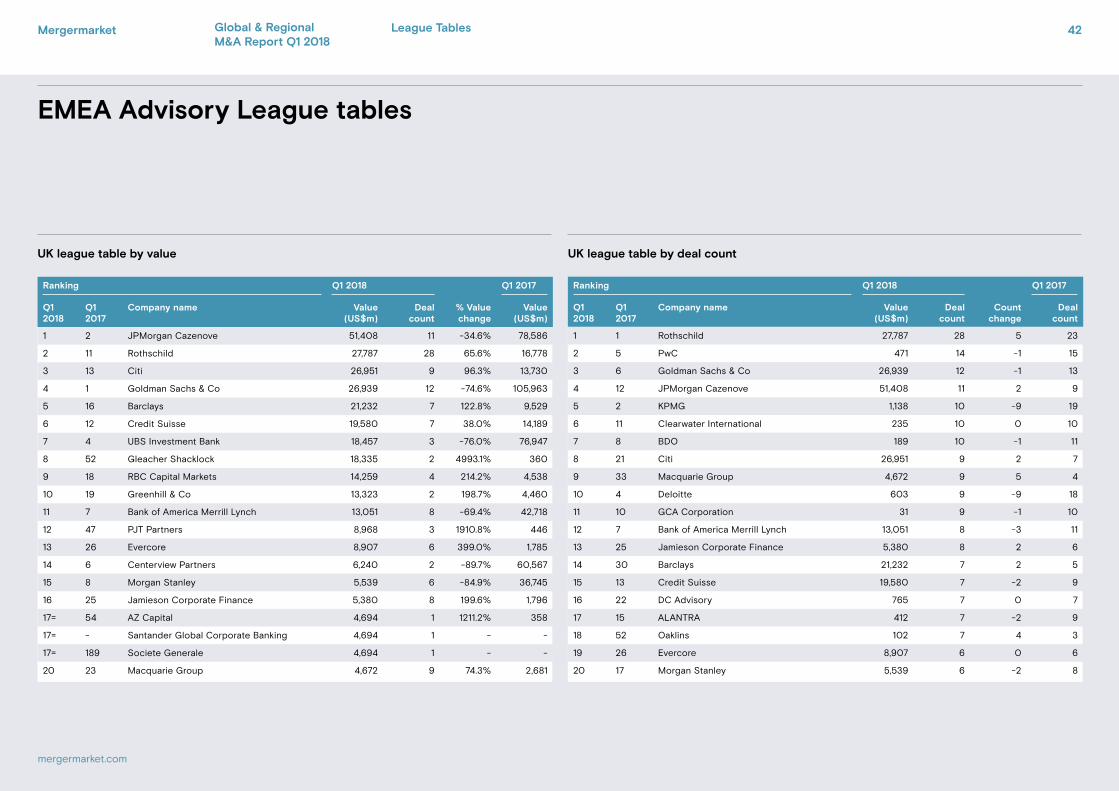
UK league table by value UK league table by deal count
Ranking Q1 2018 Q1 2017
Q1 2018
Q1 2017
Company name Value (US$m)
Deal count
Count change
Deal count
1 1 Rothschild 27,787 28 5 23
2 5 PwC 471 14 -1 15
3 6 Goldman Sachs & Co 26,939 12 -1 13
4 12 JPMorgan Cazenove 51,408 11 2 9
5 2 KPMG 1,138 10 -9 19
6 11 Clearwater International 235 10 0 10
7 8 BDO 189 10 -1 11
8 21 Citi 26,951 9 2 7
9 33 Macquarie Group 4,672 9 5 4
10 4 Deloitte 603 9 -9 18
11 10 GCA Corporation 31 9 -1 10
12 7 Bank of America Merrill Lynch 13,051 8 -3 11
13 25 Jamieson Corporate Finance 5,380 8 2 6
14 30 Barclays 21,232 7 2 5
15 13 Credit Suisse 19,580 7 -2 9
16 22 DC Advisory 765 7 0 7
17 15 ALANTRA 412 7 -2 9
18 52 Oaklins 102 7 4 3
19 26 Evercore 8,907 6 0 6
20 17 Morgan Stanley 5,539 6 -2 8
Ranking Q1 2018 Q1 2017
Q1 2018
Q1 2017
Company name Value (US$m)
Deal count
% Value change
Value (US$m)
1 2 JPMorgan Cazenove 51,408 11 -34.6% 78,586
2 11 Rothschild 27,787 28 65.6% 16,778
3 13 Citi 26,951 9 96.3% 13,730
4 1 Goldman Sachs & Co 26,939 12 -74.6% 105,963
5 16 Barclays 21,232 7 122.8% 9,529
6 12 Credit Suisse 19,580 7 38.0% 14,189
7 4 UBS Investment Bank 18,457 3 -76.0% 76,947
8 52 Gleacher Shacklock 18,335 2 4993.1% 360
9 18 RBC Capital Markets 14,259 4 214.2% 4,538
10 19 Greenhill & Co 13,323 2 198.7% 4,460
11 7 Bank of America Merrill Lynch 13,051 8 -69.4% 42,718
12 47 PJT Partners 8,968 3 1910.8% 446
13 26 Evercore 8,907 6 399.0% 1,785
14 6 Centerview Partners 6,240 2 -89.7% 60,567
15 8 Morgan Stanley 5,539 6 -84.9% 36,745
16 25 Jamieson Corporate Finance 5,380 8 199.6% 1,796
17= 54 AZ Capital 4,694 1 1211.2% 358
17= - Santander Global Corporate Banking 4,694 1 - -
17= 189 Societe Generale 4,694 1 - -
20 23 Macquarie Group 4,672 9 74.3% 2,681
Mergermarket 42
mergermarket.com
Global & Regional M&A Report Q1 2018
League Tables
EMEA Advisory League tables
Ranking Q1 2018 Q1 2017
Q1 2018
Q1 2017
Company name Value (US$m)
Deal count
Count change
Deal count
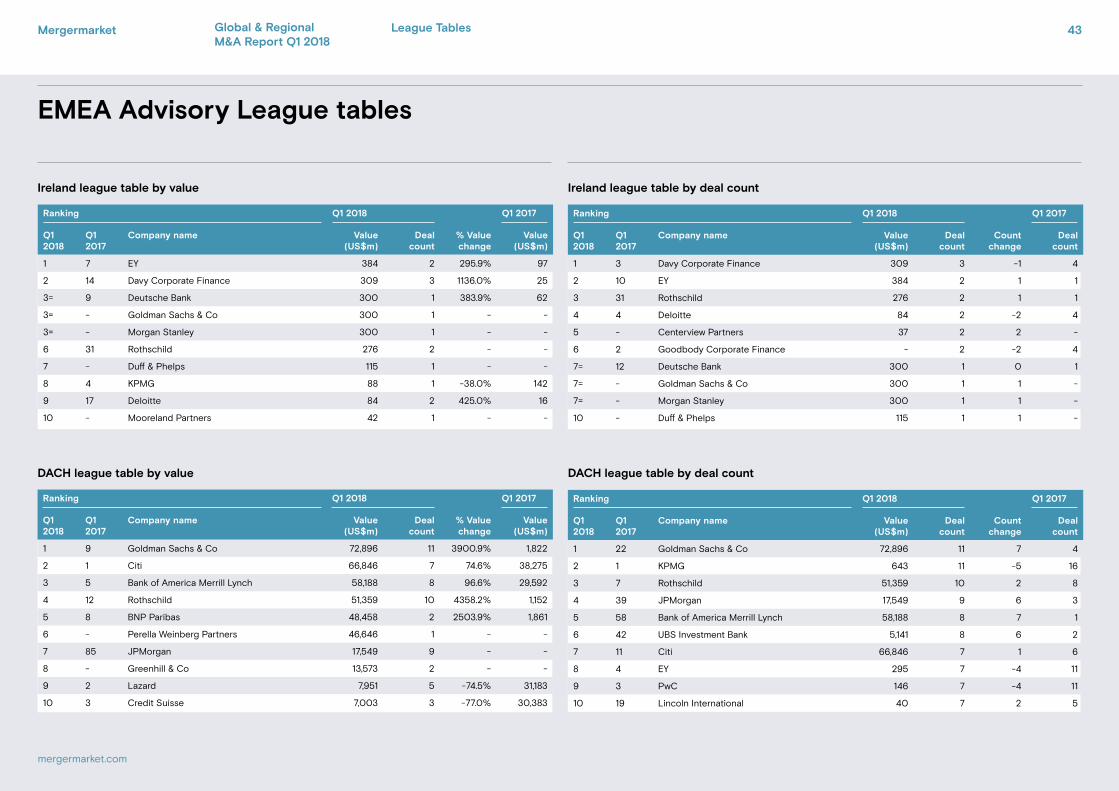
1 22 Goldman Sachs & Co 72,896 11 7 4
2 1 KPMG 643 11 -5 16
3 7 Rothschild 51,359 10 2 8
4 39 JPMorgan 17,549 9 6 3
5 58 Bank of America Merrill Lynch 58,188 8 7 1
6 42 UBS Investment Bank 5,141 8 6 2
7 11 Citi 66,846 7 1 6
8 4 EY 295 7 -4 11
9 3 PwC 146 7 -4 11
10 19 Lincoln International 40 7 2 5
Ranking Q1 2018 Q1 2017
Q1 2018
Q1 2017
Company name Value (US$m)
Deal count
% Value change
Value (US$m)
1 9 Goldman Sachs & Co 72,896 11 3900.9% 1,822
2 1 Citi 66,846 7 74.6% 38,275
3 5 Bank of America Merrill Lynch 58,188 8 96.6% 29,592
4 12 Rothschild 51,359 10 4358.2% 1,152
5 8 BNP Paribas 48,458 2 2503.9% 1,861
6 - Perella Weinberg Partners 46,646 1 - -
7 85 JPMorgan 17,549 9 - -
8 - Greenhill & Co 13,573 2 - -
9 2 Lazard 7,951 5 -74.5% 31,183
10 3 Credit Suisse 7,003 3 -77.0% 30,383
Ranking Q1 2018 Q1 2017
Q1 2018
Q1 2017
Company name Value (US$m)
Deal count
Count change
Deal count
1 3 Davy Corporate Finance 309 3 -1 4
2 10 EY 384 2 1 1
3 31 Rothschild 276 2 1 1
4 4 Deloitte 84 2 -2 4
5 - Centerview Partners 37 2 2 -
6 2 Goodbody Corporate Finance - 2 -2 4
7= 12 Deutsche Bank 300 1 0 1
7= - Goldman Sachs & Co 300 1 1 -
7= - Morgan Stanley 300 1 1 -
10 - Duff & Phelps 115 1 1 -
Ranking Q1 2018 Q1 2017
Q1 2018
Q1 2017
Company name Value (US$m)
Deal count
% Value change
Value (US$m)
1 7 EY 384 2 295.9% 97
2 14 Davy Corporate Finance 309 3 1136.0% 25
3= 9 Deutsche Bank 300 1 383.9% 62
3= - Goldman Sachs & Co 300 1 - -
3= - Morgan Stanley 300 1 - -
6 31 Rothschild 276 2 - -
7 - Duff & Phelps 115 1 - -
8 4 KPMG 88 1 -38.0% 142
9 17 Deloitte 84 2 425.0% 16
10 - Mooreland Partners 42 1 - -
Ireland league table by value Ireland league table by deal count
DACH league table by value DACH league table by deal count
Mergermarket 43
mergermarket.com
Global & Regional M&A Report Q1 2018
League Tables
EMEA Advisory League tables
Germany league table by value Germany league table by deal count
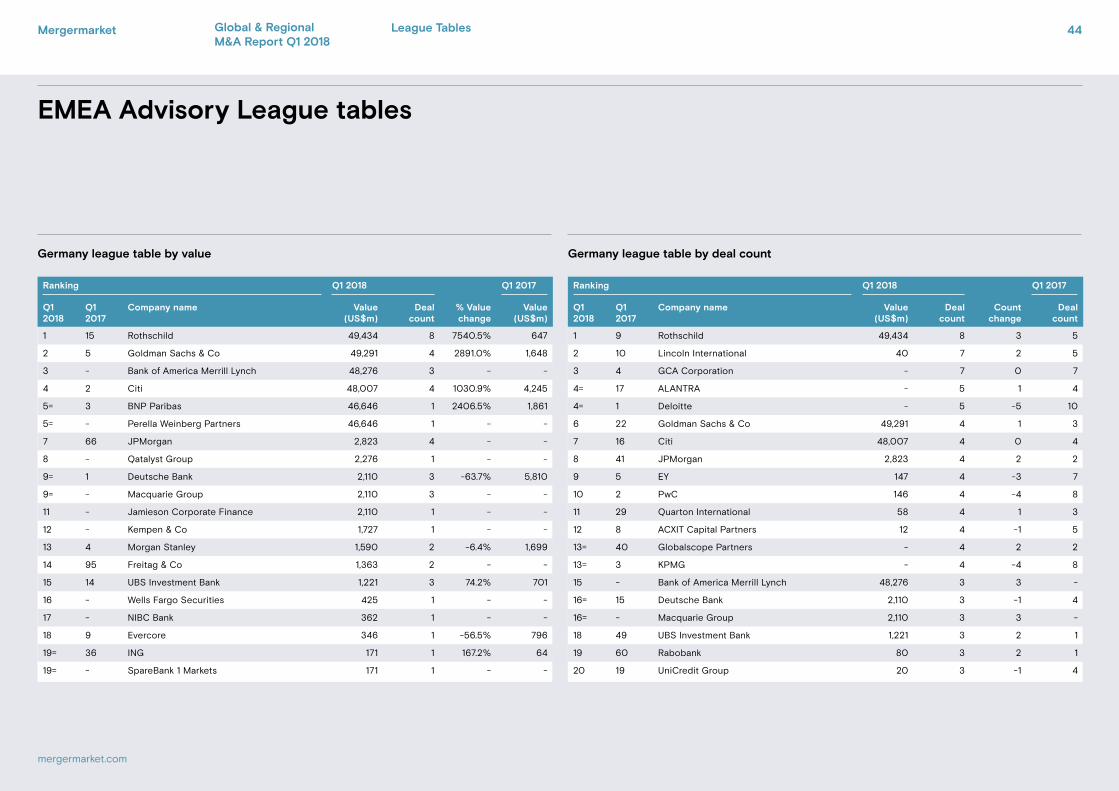
Ranking Q1 2018 Q1 2017
Q1 2018
Q1 2017
Company name Value (US$m)
Deal count
Count change
Deal count
1 9 Rothschild 49,434 8 3 5
2 10 Lincoln International 40 7 2 5
3 4 GCA Corporation - 7 0 7
4= 17 ALANTRA - 5 1 4
4= 1 Deloitte - 5 -5 10
6 22 Goldman Sachs & Co 49,291 4 1 3
7 16 Citi 48,007 4 0 4
8 41 JPMorgan 2,823 4 2 2
9 5 EY 147 4 -3 7
10 2 PwC 146 4 -4 8
11 29 Quarton International 58 4 1 3
12 8 ACXIT Capital Partners 12 4 -1 5
13= 40 Globalscope Partners - 4 2 2
13= 3 KPMG - 4 -4 8
15 - Bank of America Merrill Lynch 48,276 3 3 -
16= 15 Deutsche Bank 2,110 3 -1 4
16= - Macquarie Group 2,110 3 3 -
18 49 UBS Investment Bank 1,221 3 2 1
19 60 Rabobank 80 3 2 1
20 19 UniCredit Group 20 3 -1 4
Ranking Q1 2018 Q1 2017
Q1 2018
Q1 2017
Company name Value (US$m)
Deal count
% Value change
Value (US$m)
1 15 Rothschild 49,434 8 7540.5% 647
2 5 Goldman Sachs & Co 49,291 4 2891.0% 1,648
3 - Bank of America Merrill Lynch 48,276 3 - -
4 2 Citi 48,007 4 1030.9% 4,245
5= 3 BNP Paribas 46,646 1 2406.5% 1,861
5= - Perella Weinberg Partners 46,646 1 - -
7 66 JPMorgan 2,823 4 - -
8 - Qatalyst Group 2,276 1 - -
9= 1 Deutsche Bank 2,110 3 -63.7% 5,810
9= - Macquarie Group 2,110 3 - -
11 - Jamieson Corporate Finance 2,110 1 - -
12 - Kempen & Co 1,727 1 - -
13 4 Morgan Stanley 1,590 2 -6.4% 1,699
14 95 Freitag & Co 1,363 2 - -
15 14 UBS Investment Bank 1,221 3 74.2% 701
16 - Wells Fargo Securities 425 1 - -
17 - NIBC Bank 362 1 - -
18 9 Evercore 346 1 -56.5% 796
19= 36 ING 171 1 167.2% 64
19= - SpareBank 1 Markets 171 1 - -
Mergermarket 44
mergermarket.com
Global & Regional M&A Report Q1 2018
League Tables
EMEA Advisory League tables
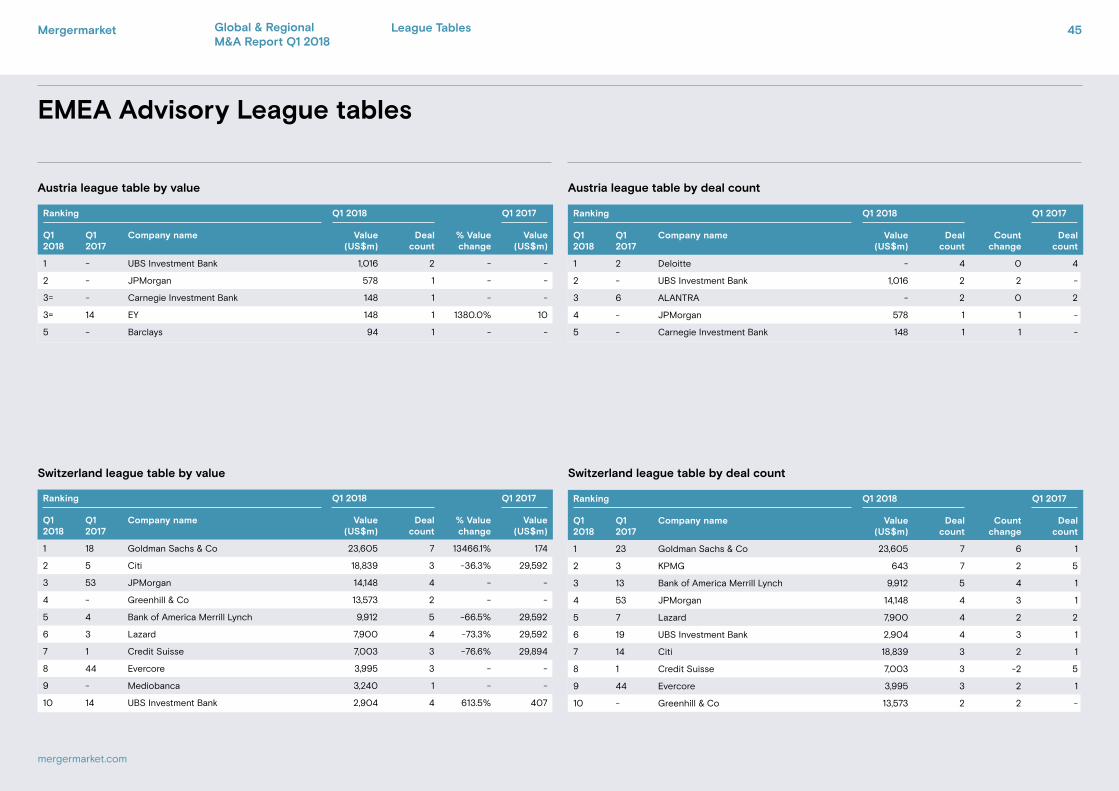
Austria league table by value Austria league table by deal count
Switzerland league table by value Switzerland league table by deal count
Ranking Q1 2018 Q1 2017
Q1 2018
Q1 2017
Company name Value (US$m)
Deal count
% Value change
Value (US$m)
1 - UBS Investment Bank 1,016 2 - -
2 - JPMorgan 578 1 - -
3= - Carnegie Investment Bank 148 1 - -
3= 14 EY 148 1 1380.0% 10
5 - Barclays 94 1 - -
Ranking Q1 2018 Q1 2017
Q1 2018
Q1 2017
Company name Value (US$m)
Deal count
% Value change
Value (US$m)
1 18 Goldman Sachs & Co 23,605 7 13466.1% 174
2 5 Citi 18,839 3 -36.3% 29,592
3 53 JPMorgan 14,148 4 - -
4 - Greenhill & Co 13,573 2 - -
5 4 Bank of America Merrill Lynch 9,912 5 -66.5% 29,592
6 3 Lazard 7,900 4 -73.3% 29,592
7 1 Credit Suisse 7,003 3 -76.6% 29,894
8 44 Evercore 3,995 3 - -
9 - Mediobanca 3,240 1 - -
10 14 UBS Investment Bank 2,904 4 613.5% 407
Ranking Q1 2018 Q1 2017
Q1 2018
Q1 2017
Company name Value (US$m)
Deal count
Count change
Deal count
1 2 Deloitte - 4 0 4
2 - UBS Investment Bank 1,016 2 2 -
3 6 ALANTRA - 2 0 2
4 - JPMorgan 578 1 1 -
5 - Carnegie Investment Bank 148 1 1 -
Ranking Q1 2018 Q1 2017
Q1 2018
Q1 2017
Company name Value (US$m)
Deal count
Count change
Deal count
1 23 Goldman Sachs & Co 23,605 7 6 1
2 3 KPMG 643 7 2 5
3 13 Bank of America Merrill Lynch 9,912 5 4 1
4 53 JPMorgan 14,148 4 3 1
5 7 Lazard 7,900 4 2 2
6 19 UBS Investment Bank 2,904 4 3 1
7 14 Citi 18,839 3 2 1
8 1 Credit Suisse 7,003 3 -2 5
9 44 Evercore 3,995 3 2 1
10 - Greenhill & Co 13,573 2 2 -
Mergermarket 45
mergermarket.com
Global & Regional M&A Report Q1 2018
League Tables
EMEA Advisory League tables
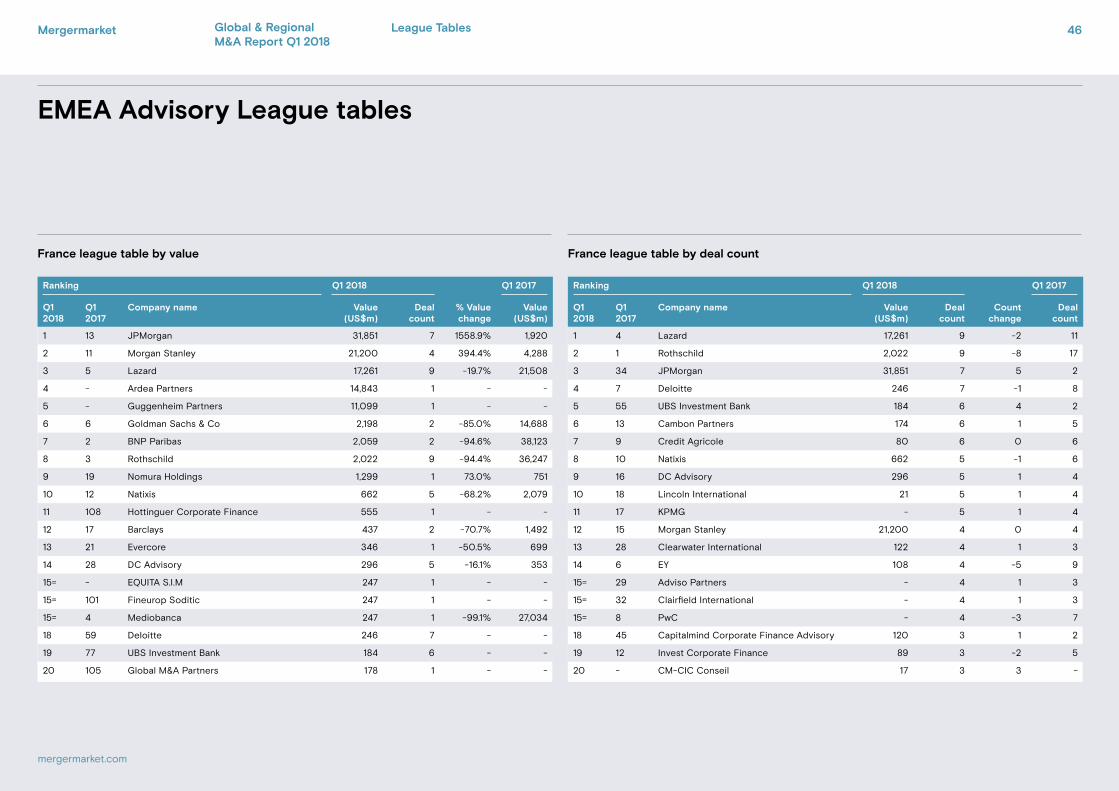
France league table by value France league table by deal count
Ranking Q1 2018 Q1 2017
Q1 2018
Q1 2017
Company name Value (US$m)
Deal count
Count change
Deal count
1 4 Lazard 17,261 9 -2 11
2 1 Rothschild 2,022 9 -8 17
3 34 JPMorgan 31,851 7 5 2
4 7 Deloitte 246 7 -1 8
5 55 UBS Investment Bank 184 6 4 2
6 13 Cambon Partners 174 6 1 5
7 9 Credit Agricole 80 6 0 6
8 10 Natixis 662 5 -1 6
9 16 DC Advisory 296 5 1 4
10 18 Lincoln International 21 5 1 4
11 17 KPMG - 5 1 4
12 15 Morgan Stanley 21,200 4 0 4
13 28 Clearwater International 122 4 1 3
14 6 EY 108 4 -5 9
15= 29 Adviso Partners - 4 1 3
15= 32 Clairfield International - 4 1 3
15= 8 PwC - 4 -3 7
18 45 Capitalmind Corporate Finance Advisory 120 3 1 2
19 12 Invest Corporate Finance 89 3 -2 5
20 - CM-CIC Conseil 17 3 3 -
Ranking Q1 2018 Q1 2017
Q1 2018
Q1 2017
Company name Value (US$m)
Deal count
% Value change
Value (US$m)
1 13 JPMorgan 31,851 7 1558.9% 1,920
2 11 Morgan Stanley 21,200 4 394.4% 4,288
3 5 Lazard 17,261 9 -19.7% 21,508
4 - Ardea Partners 14,843 1 - -
5 - Guggenheim Partners 11,099 1 - -
6 6 Goldman Sachs & Co 2,198 2 -85.0% 14,688
7 2 BNP Paribas 2,059 2 -94.6% 38,123
8 3 Rothschild 2,022 9 -94.4% 36,247
9 19 Nomura Holdings 1,299 1 73.0% 751
10 12 Natixis 662 5 -68.2% 2,079
11 108 Hottinguer Corporate Finance 555 1 - -
12 17 Barclays 437 2 -70.7% 1,492
13 21 Evercore 346 1 -50.5% 699
14 28 DC Advisory 296 5 -16.1% 353
15= - EQUITA S.I.M 247 1 - -
15= 101 Fineurop Soditic 247 1 - -
15= 4 Mediobanca 247 1 -99.1% 27,034
18 59 Deloitte 246 7 - -
19 77 UBS Investment Bank 184 6 - -
20 105 Global M&A Partners 178 1 - -
Mergermarket 46
mergermarket.com
Global & Regional M&A Report Q1 2018
League Tables
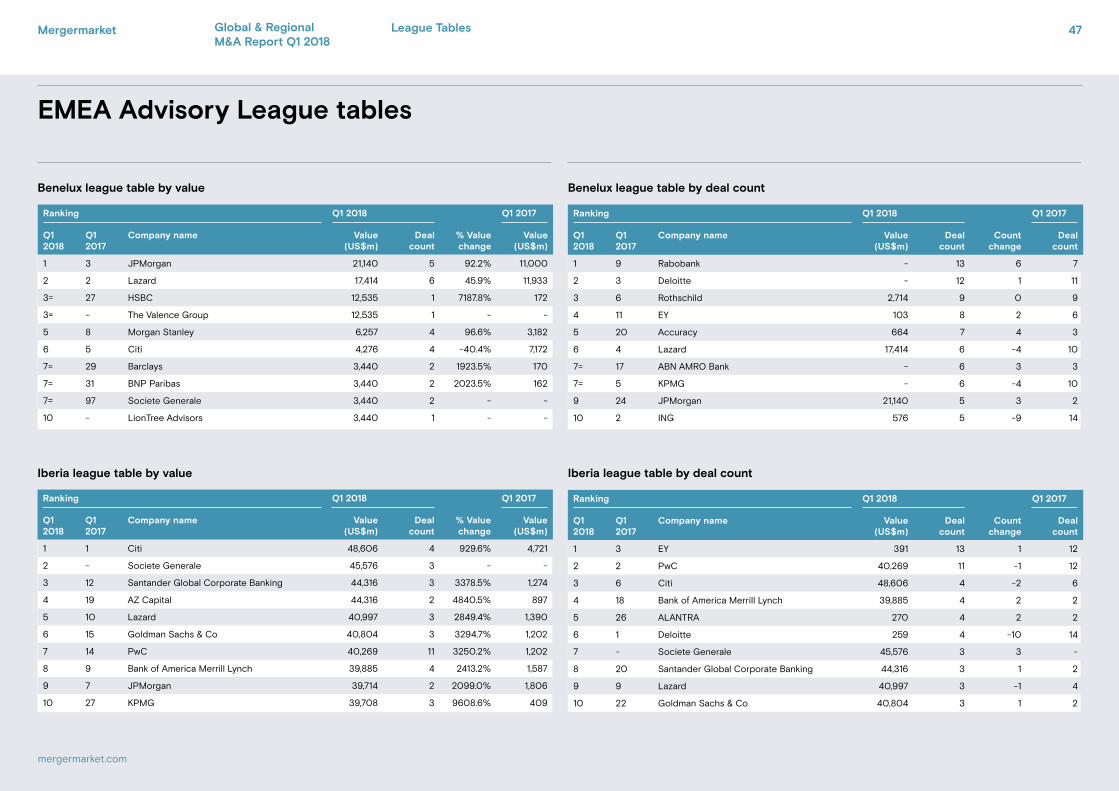
EMEA Advisory League tables
Benelux league table by value Benelux league table by deal count
Iberia league table by value Iberia league table by deal count
Ranking Q1 2018 Q1 2017
Q1 2018
Q1 2017
Company name Value (US$m)
Deal count
% Value change
Value (US$m)
1 3 JPMorgan 21,140 5 92.2% 11,000
2 2 Lazard 17,414 6 45.9% 11,933
3= 27 HSBC 12,535 1 7187.8% 172
3= - The Valence Group 12,535 1 - -
5 8 Morgan Stanley 6,257 4 96.6% 3,182
6 5 Citi 4,276 4 -40.4% 7,172
7= 29 Barclays 3,440 2 1923.5% 170
7= 31 BNP Paribas 3,440 2 2023.5% 162
7= 97 Societe Generale 3,440 2 - -
10 - LionTree Advisors 3,440 1 - -
Ranking Q1 2018 Q1 2017
Q1 2018
Q1 2017
Company name Value (US$m)
Deal count
% Value change
Value (US$m)
1 1 Citi 48,606 4 929.6% 4,721
2 - Societe Generale 45,576 3 - -
3 12 Santander Global Corporate Banking 44,316 3 3378.5% 1,274
4 19 AZ Capital 44,316 2 4840.5% 897
5 10 Lazard 40,997 3 2849.4% 1,390
6 15 Goldman Sachs & Co 40,804 3 3294.7% 1,202
7 14 PwC 40,269 11 3250.2% 1,202
8 9 Bank of America Merrill Lynch 39,885 4 2413.2% 1,587
9 7 JPMorgan 39,714 2 2099.0% 1,806
10 27 KPMG 39,708 3 9608.6% 409
Ranking Q1 2018 Q1 2017
Q1 2018
Q1 2017
Company name Value (US$m)
Deal count
Count change
Deal count
1 9 Rabobank - 13 6 7
2 3 Deloitte - 12 1 11
3 6 Rothschild 2,714 9 0 9
4 11 EY 103 8 2 6
5 20 Accuracy 664 7 4 3
6 4 Lazard 17,414 6 -4 10
7= 17 ABN AMRO Bank - 6 3 3
7= 5 KPMG - 6 -4 10
9 24 JPMorgan 21,140 5 3 2
10 2 ING 576 5 -9 14
Ranking Q1 2018 Q1 2017
Q1 2018
Q1 2017
Company name Value (US$m)
Deal count
Count change
Deal count
1 3 EY 391 13 1 12
2 2 PwC 40,269 11 -1 12
3 6 Citi 48,606 4 -2 6
4 18 Bank of America Merrill Lynch 39,885 4 2 2
5 26 ALANTRA 270 4 2 2
6 1 Deloitte 259 4 -10 14
7 - Societe Generale 45,576 3 3 -
8 20 Santander Global Corporate Banking 44,316 3 1 2
9 9 Lazard 40,997 3 -1 4
10 22 Goldman Sachs & Co 40,804 3 1 2
Mergermarket 47
mergermarket.com
Global & Regional M&A Report Q1 2018
League Tables
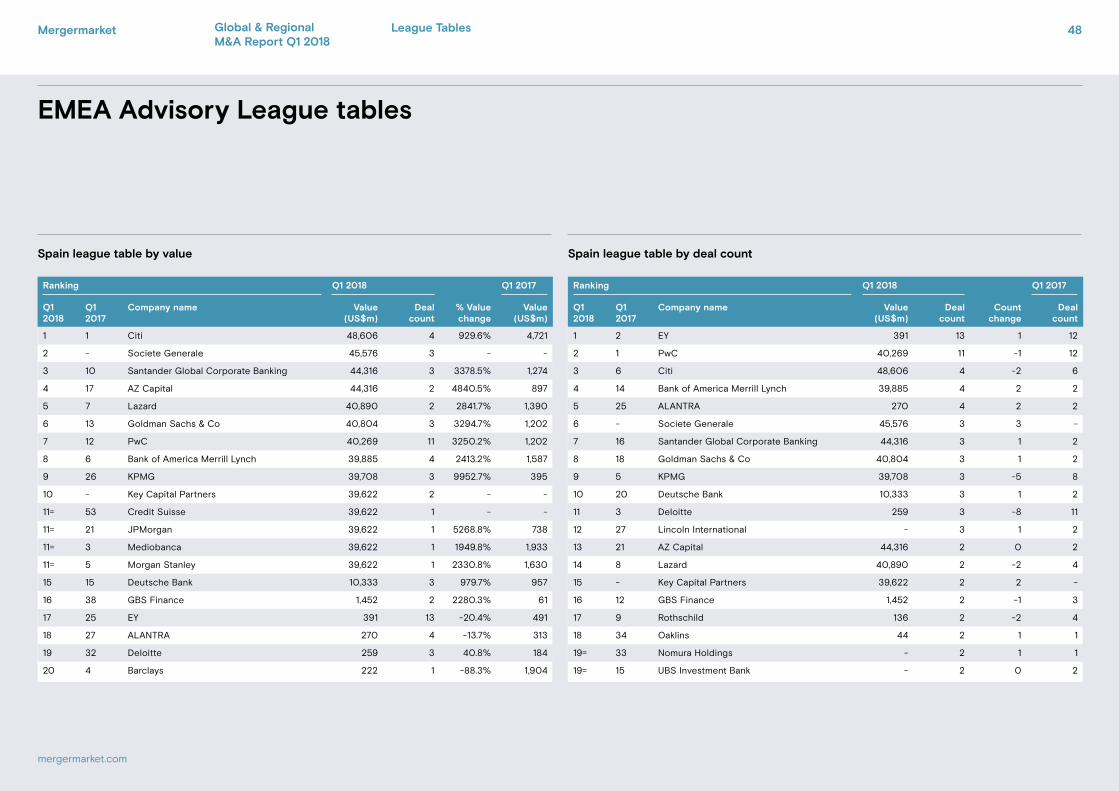
EMEA Advisory League tables
Spain league table by value Spain league table by deal count
Ranking Q1 2018 Q1 2017
Q1 2018
Q1 2017
Company name Value (US$m)
Deal count
Count change
Deal count
1 2 EY 391 13 1 12
2 1 PwC 40,269 11 -1 12
3 6 Citi 48,606 4 -2 6
4 14 Bank of America Merrill Lynch 39,885 4 2 2
5 25 ALANTRA 270 4 2 2
6 - Societe Generale 45,576 3 3 -
7 16 Santander Global Corporate Banking 44,316 3 1 2
8 18 Goldman Sachs & Co 40,804 3 1 2
9 5 KPMG 39,708 3 -5 8
10 20 Deutsche Bank 10,333 3 1 2
11 3 Deloitte 259 3 -8 11
12 27 Lincoln International - 3 1 2
13 21 AZ Capital 44,316 2 0 2
14 8 Lazard 40,890 2 -2 4
15 - Key Capital Partners 39,622 2 2 -
16 12 GBS Finance 1,452 2 -1 3
17 9 Rothschild 136 2 -2 4
18 34 Oaklins 44 2 1 1
19= 33 Nomura Holdings - 2 1 1
19= 15 UBS Investment Bank - 2 0 2
Ranking Q1 2018 Q1 2017
Q1 2018
Q1 2017
Company name Value (US$m)
Deal count
% Value change
Value (US$m)
1 1 Citi 48,606 4 929.6% 4,721
2 - Societe Generale 45,576 3 - -
3 10 Santander Global Corporate Banking 44,316 3 3378.5% 1,274
4 17 AZ Capital 44,316 2 4840.5% 897
5 7 Lazard 40,890 2 2841.7% 1,390
6 13 Goldman Sachs & Co 40,804 3 3294.7% 1,202
7 12 PwC 40,269 11 3250.2% 1,202
8 6 Bank of America Merrill Lynch 39,885 4 2413.2% 1,587
9 26 KPMG 39,708 3 9952.7% 395
10 - Key Capital Partners 39,622 2 - -
11= 53 Credit Suisse 39,622 1 - -
11= 21 JPMorgan 39,622 1 5268.8% 738
11= 3 Mediobanca 39,622 1 1949.8% 1,933
11= 5 Morgan Stanley 39,622 1 2330.8% 1,630
15 15 Deutsche Bank 10,333 3 979.7% 957
16 38 GBS Finance 1,452 2 2280.3% 61
17 25 EY 391 13 -20.4% 491
18 27 ALANTRA 270 4 -13.7% 313
19 32 Deloitte 259 3 40.8% 184
20 4 Barclays 222 1 -88.3% 1,904
Mergermarket 48
mergermarket.com
Global & Regional M&A Report Q1 2018
League Tables
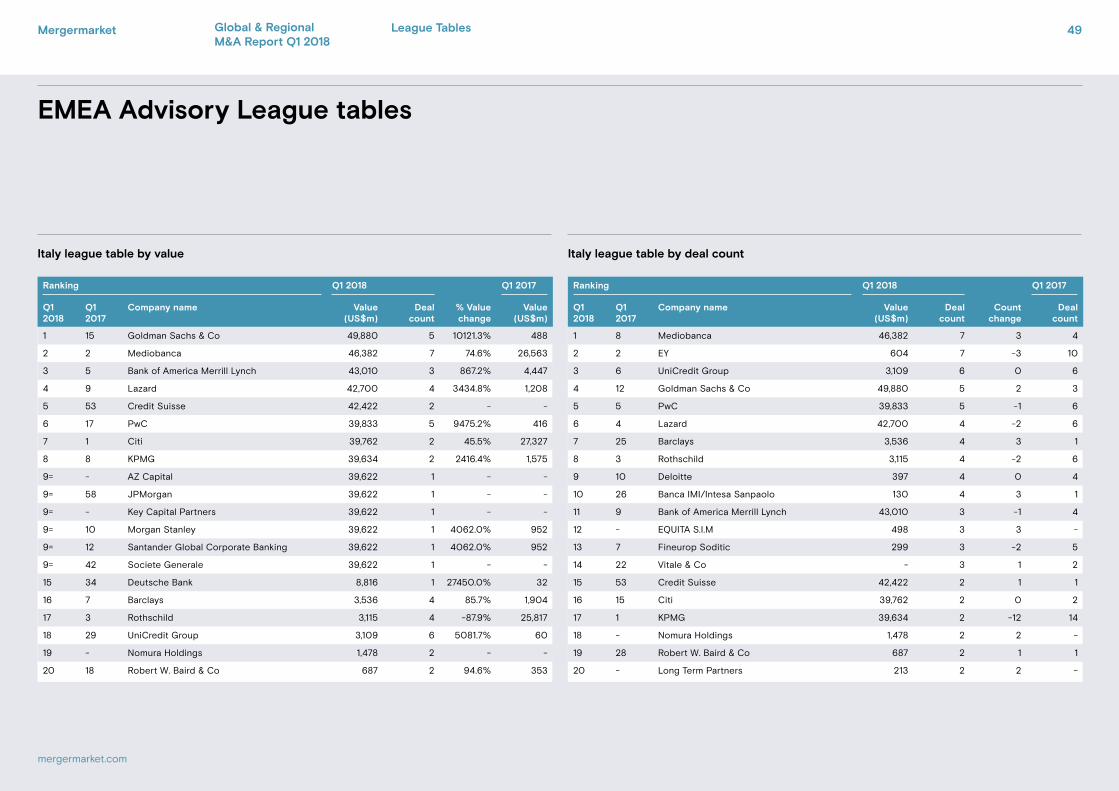
EMEA Advisory League tables
Italy league table by value Italy league table by deal count
Ranking Q1 2018 Q1 2017
Q1 2018
Q1 2017
Company name Value (US$m)
Deal count
Count change
Deal count
1 8 Mediobanca 46,382 7 3 4
2 2 EY 604 7 -3 10
3 6 UniCredit Group 3,109 6 0 6
4 12 Goldman Sachs & Co 49,880 5 2 3
5 5 PwC 39,833 5 -1 6
6 4 Lazard 42,700 4 -2 6
7 25 Barclays 3,536 4 3 1
8 3 Rothschild 3,115 4 -2 6
9 10 Deloitte 397 4 0 4
10 26 Banca IMI/Intesa Sanpaolo 130 4 3 1
11 9 Bank of America Merrill Lynch 43,010 3 -1 4
12 - EQUITA S.I.M 498 3 3 -
13 7 Fineurop Soditic 299 3 -2 5
14 22 Vitale & Co - 3 1 2
15 53 Credit Suisse 42,422 2 1 1
16 15 Citi 39,762 2 0 2
17 1 KPMG 39,634 2 -12 14
18 - Nomura Holdings 1,478 2 2 -
19 28 Robert W. Baird & Co 687 2 1 1
20 - Long Term Partners 213 2 2 -
Ranking Q1 2018 Q1 2017
Q1 2018
Q1 2017
Company name Value (US$m)
Deal count
% Value change
Value (US$m)
1 15 Goldman Sachs & Co 49,880 5 10121.3% 488
2 2 Mediobanca 46,382 7 74.6% 26,563
3 5 Bank of America Merrill Lynch 43,010 3 867.2% 4,447
4 9 Lazard 42,700 4 3434.8% 1,208
5 53 Credit Suisse 42,422 2 - -
6 17 PwC 39,833 5 9475.2% 416
7 1 Citi 39,762 2 45.5% 27,327
8 8 KPMG 39,634 2 2416.4% 1,575
9= - AZ Capital 39,622 1 - -
9= 58 JPMorgan 39,622 1 - -
9= - Key Capital Partners 39,622 1 - -
9= 10 Morgan Stanley 39,622 1 4062.0% 952
9= 12 Santander Global Corporate Banking 39,622 1 4062.0% 952
9= 42 Societe Generale 39,622 1 - -
15 34 Deutsche Bank 8,816 1 27450.0% 32
16 7 Barclays 3,536 4 85.7% 1,904
17 3 Rothschild 3,115 4 -87.9% 25,817
18 29 UniCredit Group 3,109 6 5081.7% 60
19 - Nomura Holdings 1,478 2 - -
20 18 Robert W. Baird & Co 687 2 94.6% 353
Mergermarket 49
mergermarket.com
Global & Regional M&A Report Q1 2018
League Tables
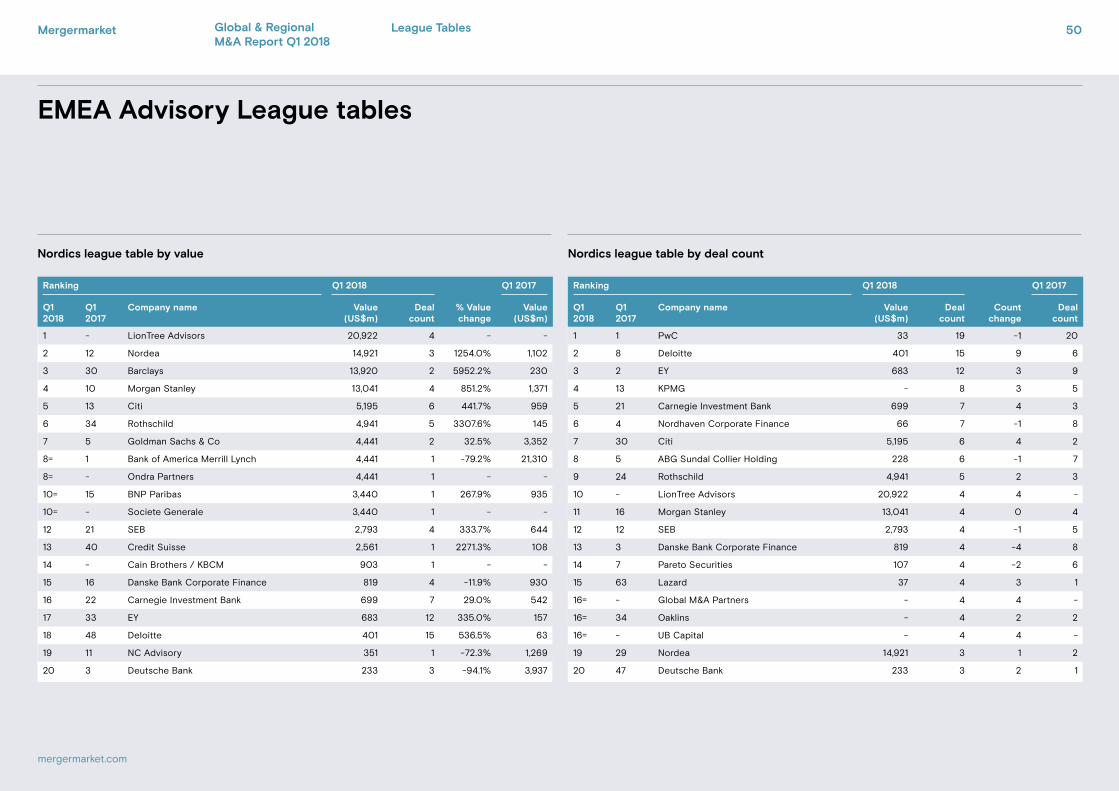
EMEA Advisory League tables
Nordics league table by value Nordics league table by deal count
Ranking Q1 2018 Q1 2017
Q1 2018
Q1 2017
Company name Value (US$m)
Deal count
Count change
Deal count
1 1 PwC 33 19 -1 20
2 8 Deloitte 401 15 9 6
3 2 EY 683 12 3 9
4 13 KPMG - 8 3 5
5 21 Carnegie Investment Bank 699 7 4 3
6 4 Nordhaven Corporate Finance 66 7 -1 8
7 30 Citi 5,195 6 4 2
8 5 ABG Sundal Collier Holding 228 6 -1 7
9 24 Rothschild 4,941 5 2 3
10 - LionTree Advisors 20,922 4 4 -
11 16 Morgan Stanley 13,041 4 0 4
12 12 SEB 2,793 4 -1 5
13 3 Danske Bank Corporate Finance 819 4 -4 8
14 7 Pareto Securities 107 4 -2 6
15 63 Lazard 37 4 3 1
16= - Global M&A Partners - 4 4 -
16= 34 Oaklins - 4 2 2
16= - UB Capital - 4 4 -
19 29 Nordea 14,921 3 1 2
20 47 Deutsche Bank 233 3 2 1
Ranking Q1 2018 Q1 2017
Q1 2018
Q1 2017
Company name Value (US$m)
Deal count
% Value change
Value (US$m)
1 - LionTree Advisors 20,922 4 - -
2 12 Nordea 14,921 3 1254.0% 1,102
3 30 Barclays 13,920 2 5952.2% 230
4 10 Morgan Stanley 13,041 4 851.2% 1,371
5 13 Citi 5,195 6 441.7% 959
6 34 Rothschild 4,941 5 3307.6% 145
7 5 Goldman Sachs & Co 4,441 2 32.5% 3,352
8= 1 Bank of America Merrill Lynch 4,441 1 -79.2% 21,310
8= - Ondra Partners 4,441 1 - -
10= 15 BNP Paribas 3,440 1 267.9% 935
10= - Societe Generale 3,440 1 - -
12 21 SEB 2,793 4 333.7% 644
13 40 Credit Suisse 2,561 1 2271.3% 108
14 - Cain Brothers / KBCM 903 1 - -
15 16 Danske Bank Corporate Finance 819 4 -11.9% 930
16 22 Carnegie Investment Bank 699 7 29.0% 542
17 33 EY 683 12 335.0% 157
18 48 Deloitte 401 15 536.5% 63
19 11 NC Advisory 351 1 -72.3% 1,269
20 3 Deutsche Bank 233 3 -94.1% 3,937
Mergermarket 50
mergermarket.com
Global & Regional M&A Report Q1 2018
League Tables
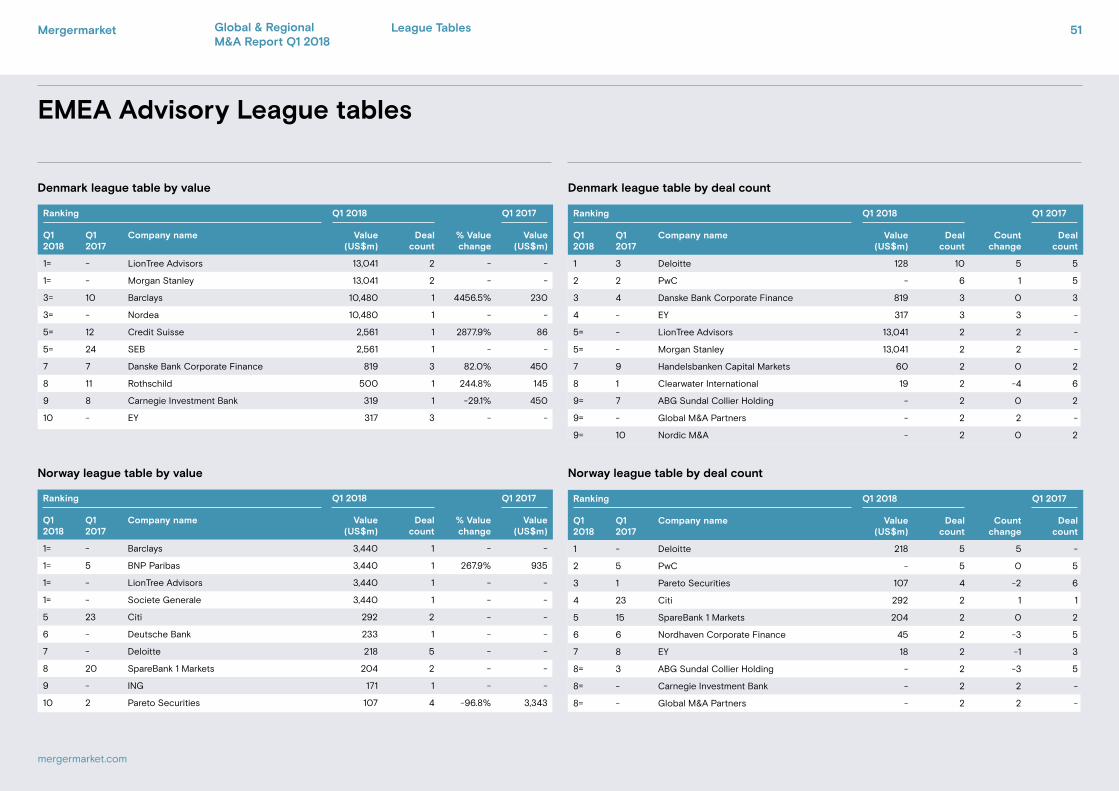
EMEA Advisory League tables
Denmark league table by value Denmark league table by deal count
Norway league table by value Norway league table by deal count
Ranking Q1 2018 Q1 2017
Q1 2018
Q1 2017
Company name Value (US$m)
Deal count
% Value change
Value (US$m)
1= - LionTree Advisors 13,041 2 - -
1= - Morgan Stanley 13,041 2 - -
3= 10 Barclays 10,480 1 4456.5% 230
3= - Nordea 10,480 1 - -
5= 12 Credit Suisse 2,561 1 2877.9% 86
5= 24 SEB 2,561 1 - -
7 7 Danske Bank Corporate Finance 819 3 82.0% 450
8 11 Rothschild 500 1 244.8% 145
9 8 Carnegie Investment Bank 319 1 -29.1% 450
10 - EY 317 3 - -
Ranking Q1 2018 Q1 2017
Q1 2018
Q1 2017
Company name Value (US$m)
Deal count
% Value change
Value (US$m)
1= - Barclays 3,440 1 - -
1= 5 BNP Paribas 3,440 1 267.9% 935
1= - LionTree Advisors 3,440 1 - -
1= - Societe Generale 3,440 1 - -
5 23 Citi 292 2 - -
6 - Deutsche Bank 233 1 - -
7 - Deloitte 218 5 - -
8 20 SpareBank 1 Markets 204 2 - -
9 - ING 171 1 - -
10 2 Pareto Securities 107 4 -96.8% 3,343
Ranking Q1 2018 Q1 2017
Q1 2018
Q1 2017
Company name Value (US$m)
Deal count
Count change
Deal count
1 3 Deloitte 128 10 5 5
2 2 PwC - 6 1 5
3 4 Danske Bank Corporate Finance 819 3 0 3
4 - EY 317 3 3 -
5= - LionTree Advisors 13,041 2 2 -
5= - Morgan Stanley 13,041 2 2 -
7 9 Handelsbanken Capital Markets 60 2 0 2
8 1 Clearwater International 19 2 -4 6
9= 7 ABG Sundal Collier Holding - 2 0 2
9= - Global M&A Partners - 2 2 -
9= 10 Nordic M&A - 2 0 2
Ranking Q1 2018 Q1 2017
Q1 2018
Q1 2017
Company name Value (US$m)
Deal count
Count change
Deal count
1 - Deloitte 218 5 5 -
2 5 PwC - 5 0 5
3 1 Pareto Securities 107 4 -2 6
4 23 Citi 292 2 1 1
5 15 SpareBank 1 Markets 204 2 0 2
6 6 Nordhaven Corporate Finance 45 2 -3 5
7 8 EY 18 2 -1 3
8= 3 ABG Sundal Collier Holding - 2 -3 5
8= - Carnegie Investment Bank - 2 2 -
8= - Global M&A Partners - 2 2 -
Mergermarket 51
mergermarket.com
Global & Regional M&A Report Q1 2018
League Tables
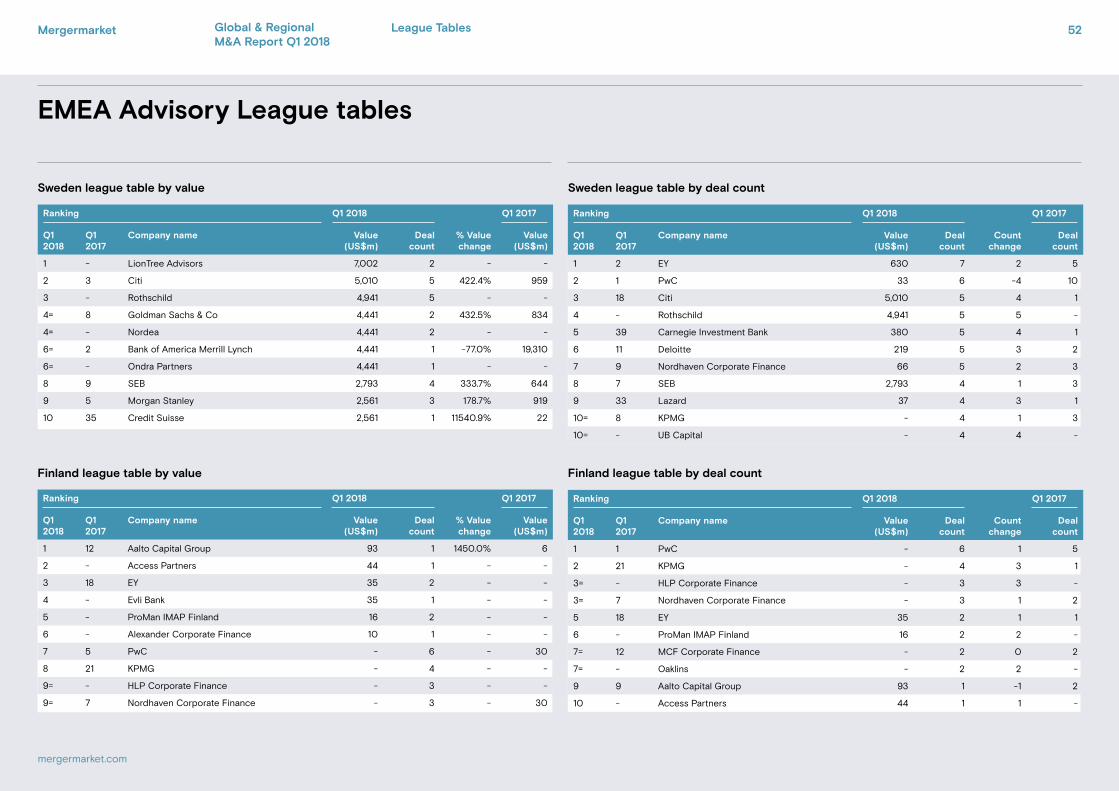
EMEA Advisory League tables
Sweden league table by value Sweden league table by deal count
Finland league table by value Finland league table by deal count
Ranking Q1 2018 Q1 2017
Q1 2018
Q1 2017
Company name Value (US$m)
Deal count
% Value change
Value (US$m)
1 - LionTree Advisors 7,002 2 - -
2 3 Citi 5,010 5 422.4% 959
3 - Rothschild 4,941 5 - -
4= 8 Goldman Sachs & Co 4,441 2 432.5% 834
4= - Nordea 4,441 2 - -
6= 2 Bank of America Merrill Lynch 4,441 1 -77.0% 19,310
6= - Ondra Partners 4,441 1 - -
8 9 SEB 2,793 4 333.7% 644
9 5 Morgan Stanley 2,561 3 178.7% 919
10 35 Credit Suisse 2,561 1 11540.9% 22
Ranking Q1 2018 Q1 2017
Q1 2018
Q1 2017
Company name Value (US$m)
Deal count
% Value change
Value (US$m)
1 12 Aalto Capital Group 93 1 1450.0% 6
2 - Access Partners 44 1 - -
3 18 EY 35 2 - -
4 - Evli Bank 35 1 - -
5 - ProMan IMAP Finland 16 2 - -
6 - Alexander Corporate Finance 10 1 - -
7 5 PwC - 6 - 30
8 21 KPMG - 4 - -
9= - HLP Corporate Finance - 3 - -
9= 7 Nordhaven Corporate Finance - 3 - 30
Ranking Q1 2018 Q1 2017
Q1 2018
Q1 2017
Company name Value (US$m)
Deal count
Count change
Deal count
1 2 EY 630 7 2 5
2 1 PwC 33 6 -4 10
3 18 Citi 5,010 5 4 1
4 - Rothschild 4,941 5 5 -
5 39 Carnegie Investment Bank 380 5 4 1
6 11 Deloitte 219 5 3 2
7 9 Nordhaven Corporate Finance 66 5 2 3
8 7 SEB 2,793 4 1 3
9 33 Lazard 37 4 3 1
10= 8 KPMG - 4 1 3
10= - UB Capital - 4 4 -
Ranking Q1 2018 Q1 2017
Q1 2018
Q1 2017
Company name Value (US$m)
Deal count
Count change
Deal count
1 1 PwC - 6 1 5
2 21 KPMG - 4 3 1
3= - HLP Corporate Finance - 3 3 -
3= 7 Nordhaven Corporate Finance - 3 1 2
5 18 EY 35 2 1 1
6 - ProMan IMAP Finland 16 2 2 -
7= 12 MCF Corporate Finance - 2 0 2
7= - Oaklins - 2 2 -
9 9 Aalto Capital Group 93 1 -1 2
10 - Access Partners 44 1 1 -
Mergermarket 52
mergermarket.com
Global & Regional M&A Report Q1 2018
League Tables
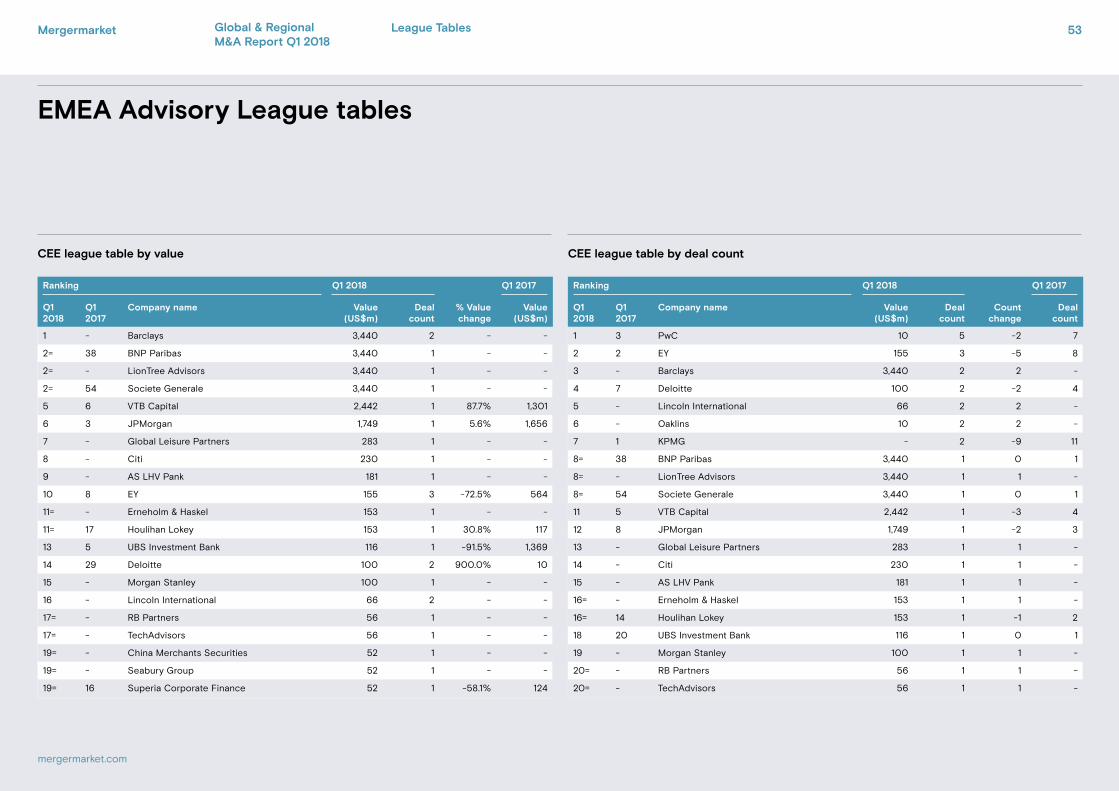
EMEA Advisory League tables
CEE league table by value CEE league table by deal count
Ranking Q1 2018 Q1 2017
Q1 2018
Q1 2017
Company name Value (US$m)
Deal count
Count change
Deal count
1 3 PwC 10 5 -2 7
2 2 EY 155 3 -5 8
3 - Barclays 3,440 2 2 -
4 7 Deloitte 100 2 -2 4
5 - Lincoln International 66 2 2 -
6 - Oaklins 10 2 2 -
7 1 KPMG - 2 -9 11
8= 38 BNP Paribas 3,440 1 0 1
8= - LionTree Advisors 3,440 1 1 -
8= 54 Societe Generale 3,440 1 0 1
11 5 VTB Capital 2,442 1 -3 4
12 8 JPMorgan 1,749 1 -2 3
13 - Global Leisure Partners 283 1 1 -
14 - Citi 230 1 1 -
15 - AS LHV Pank 181 1 1 -
16= - Erneholm & Haskel 153 1 1 -
16= 14 Houlihan Lokey 153 1 -1 2
18 20 UBS Investment Bank 116 1 0 1
19 - Morgan Stanley 100 1 1 -
20= - RB Partners 56 1 1 -
20= - TechAdvisors 56 1 1 -
Ranking Q1 2018 Q1 2017
Q1 2018
Q1 2017
Company name Value (US$m)
Deal count
% Value change
Value (US$m)
1 - Barclays 3,440 2 - -
2= 38 BNP Paribas 3,440 1 - -
2= - LionTree Advisors 3,440 1 - -
2= 54 Societe Generale 3,440 1 - -
5 6 VTB Capital 2,442 1 87.7% 1,301
6 3 JPMorgan 1,749 1 5.6% 1,656
7 - Global Leisure Partners 283 1 - -
8 - Citi 230 1 - -
9 - AS LHV Pank 181 1 - -
10 8 EY 155 3 -72.5% 564
11= - Erneholm & Haskel 153 1 - -
11= 17 Houlihan Lokey 153 1 30.8% 117
13 5 UBS Investment Bank 116 1 -91.5% 1,369
14 29 Deloitte 100 2 900.0% 10
15 - Morgan Stanley 100 1 - -
16 - Lincoln International 66 2 - -
17= - RB Partners 56 1 - -
17= - TechAdvisors 56 1 - -
19= - China Merchants Securities 52 1 - -
19= - Seabury Group 52 1 - -
19= 16 Superia Corporate Finance 52 1 -58.1% 124
Mergermarket 53
mergermarket.com
Global & Regional M&A Report Q1 2018
League Tables
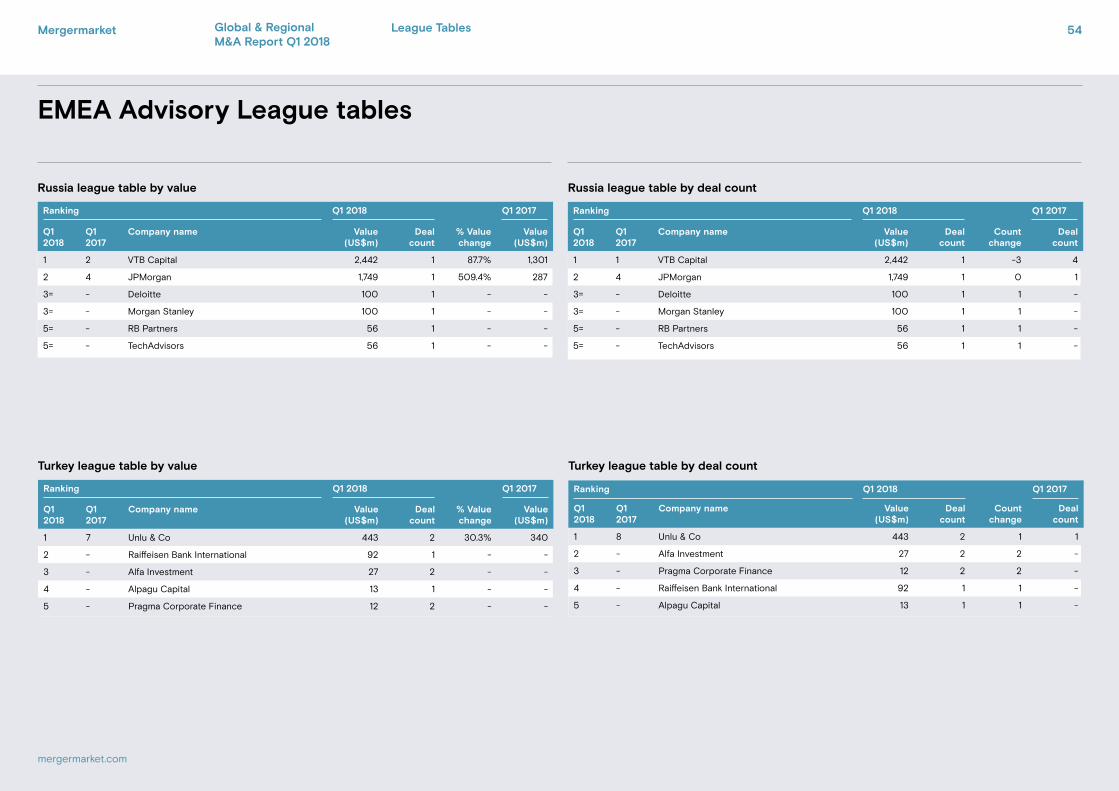
EMEA Advisory League tables
Russia league table by value Russia league table by deal count
Ranking Q1 2018 Q1 2017
Q1 2018
Q1 2017
Company name Value (US$m)
Deal count
% Value change
Value (US$m)
1 2 VTB Capital 2,442 1 87.7% 1,301
2 4 JPMorgan 1,749 1 509.4% 287
3= - Deloitte 100 1 - -
3= - Morgan Stanley 100 1 - -
5= - RB Partners 56 1 - -
5= - TechAdvisors 56 1 - -
Ranking Q1 2018 Q1 2017
Q1 2018
Q1 2017
Company name Value (US$m)
Deal count
Count change
Deal count
1 1 VTB Capital 2,442 1 -3 4
2 4 JPMorgan 1,749 1 0 1
3= - Deloitte 100 1 1 -
3= - Morgan Stanley 100 1 1 -
5= - RB Partners 56 1 1 -
5= - TechAdvisors 56 1 1 -
Turkey league table by value
Ranking Q1 2018 Q1 2017
Q1 2018
Q1 2017
Company name Value (US$m)
Deal count
% Value change
Value (US$m)
1 7 Unlu & Co 443 2 30.3% 340
2 - Raiffeisen Bank International 92 1 - -
3 - Alfa Investment 27 2 - -
4 - Alpagu Capital 13 1 - -
5 - Pragma Corporate Finance 12 2 - -
Turkey league table by deal count
Ranking Q1 2018 Q1 2017
Q1 2018
Q1 2017
Company name Value (US$m)
Deal count
Count change
Deal count
1 8 Unlu & Co 443 2 1 1
2 - Alfa Investment 27 2 2 -
3 - Pragma Corporate Finance 12 2 2 -
4 - Raiffeisen Bank International 92 1 1 -
5 - Alpagu Capital 13 1 1 -
Mergermarket 54
mergermarket.com
Global & Regional M&A Report Q1 2018
League Tables
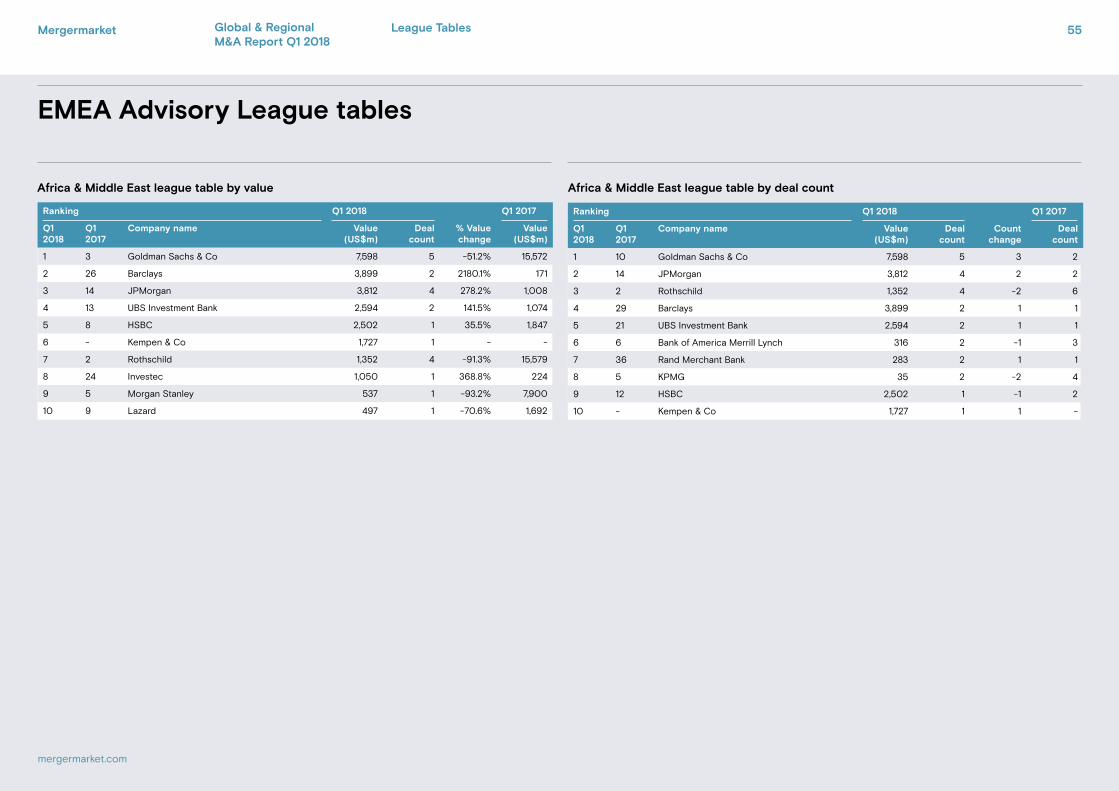
EMEA Advisory League tables
Africa & Middle East league table by deal count
Ranking Q1 2018 Q1 2017
Q1 2018
Q1 2017
Company name Value (US$m)
Deal count
% Value change
Value (US$m)
1 3 Goldman Sachs & Co 7,598 5 -51.2% 15,572
2 26 Barclays 3,899 2 2180.1% 171
3 14 JPMorgan 3,812 4 278.2% 1,008
4 13 UBS Investment Bank 2,594 2 141.5% 1,074
5 8 HSBC 2,502 1 35.5% 1,847
6 - Kempen & Co 1,727 1 - -
7 2 Rothschild 1,352 4 -91.3% 15,579
8 24 Investec 1,050 1 368.8% 224
9 5 Morgan Stanley 537 1 -93.2% 7,900
10 9 Lazard 497 1 -70.6% 1,692
Ranking Q1 2018 Q1 2017
Q1 2018
Q1 2017
Company name Value (US$m)
Deal count
Count change
Deal count
1 10 Goldman Sachs & Co 7,598 5 3 2
2 14 JPMorgan 3,812 4 2 2
3 2 Rothschild 1,352 4 -2 6
4 29 Barclays 3,899 2 1 1
5 21 UBS Investment Bank 2,594 2 1 1
6 6 Bank of America Merrill Lynch 316 2 -1 3
7 36 Rand Merchant Bank 283 2 1 1
8 5 KPMG 35 2 -2 4
9 12 HSBC 2,502 1 -1 2
10 - Kempen & Co 1,727 1 1 -
Africa & Middle East league table by value
Mergermarket 55
mergermarket.com
Global & Regional M&A Report Q1 2018
League Tables
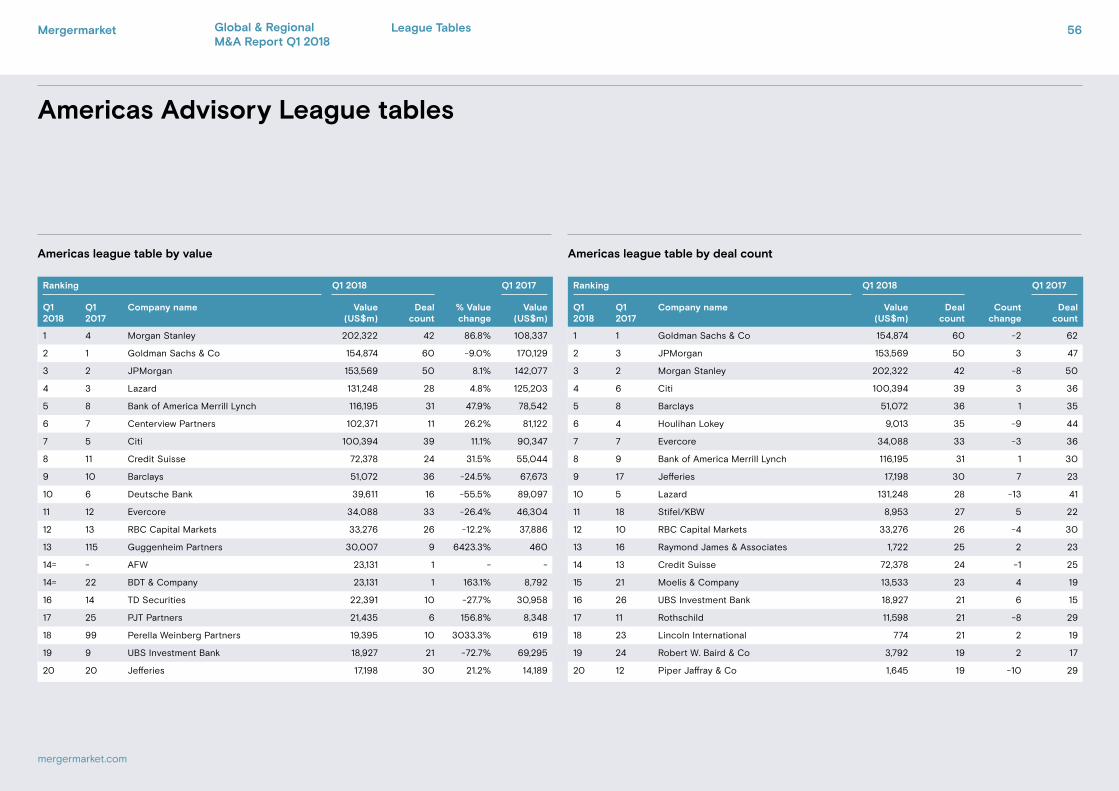
Americas Advisory League tables
Americas league table by value Americas league table by deal count
Ranking Q1 2018 Q1 2017
Q1 2018
Q1 2017
Company name Value (US$m)
Deal count
Count change
Deal count
1 1 Goldman Sachs & Co 154,874 60 -2 62
2 3 JPMorgan 153,569 50 3 47
3 2 Morgan Stanley 202,322 42 -8 50
4 6 Citi 100,394 39 3 36
5 8 Barclays 51,072 36 1 35
6 4 Houlihan Lokey 9,013 35 -9 44
7 7 Evercore 34,088 33 -3 36
8 9 Bank of America Merrill Lynch 116,195 31 1 30
9 17 Jefferies 17,198 30 7 23
10 5 Lazard 131,248 28 -13 41
11 18 Stifel/KBW 8,953 27 5 22
12 10 RBC Capital Markets 33,276 26 -4 30
13 16 Raymond James & Associates 1,722 25 2 23
14 13 Credit Suisse 72,378 24 -1 25
15 21 Moelis & Company 13,533 23 4 19
16 26 UBS Investment Bank 18,927 21 6 15
17 11 Rothschild 11,598 21 -8 29
18 23 Lincoln International 774 21 2 19
19 24 Robert W. Baird & Co 3,792 19 2 17
20 12 Piper Jaffray & Co 1,645 19 -10 29
Ranking Q1 2018 Q1 2017
Q1 2018
Q1 2017
Company name Value (US$m)
Deal count
% Value change
Value (US$m)
1 4 Morgan Stanley 202,322 42 86.8% 108,337
2 1 Goldman Sachs & Co 154,874 60 -9.0% 170,129
3 2 JPMorgan 153,569 50 8.1% 142,077
4 3 Lazard 131,248 28 4.8% 125,203
5 8 Bank of America Merrill Lynch 116,195 31 47.9% 78,542
6 7 Centerview Partners 102,371 11 26.2% 81,122
7 5 Citi 100,394 39 11.1% 90,347
8 11 Credit Suisse 72,378 24 31.5% 55,044
9 10 Barclays 51,072 36 -24.5% 67,673
10 6 Deutsche Bank 39,611 16 -55.5% 89,097
11 12 Evercore 34,088 33 -26.4% 46,304
12 13 RBC Capital Markets 33,276 26 -12.2% 37,886
13 115 Guggenheim Partners 30,007 9 6423.3% 460
14= - AFW 23,131 1 - -
14= 22 BDT & Company 23,131 1 163.1% 8,792
16 14 TD Securities 22,391 10 -27.7% 30,958
17 25 PJT Partners 21,435 6 156.8% 8,348
18 99 Perella Weinberg Partners 19,395 10 3033.3% 619
19 9 UBS Investment Bank 18,927 21 -72.7% 69,295
20 20 Jefferies 17,198 30 21.2% 14,189
Mergermarket 56
mergermarket.com
Global & Regional M&A Report Q1 2018
League Tables
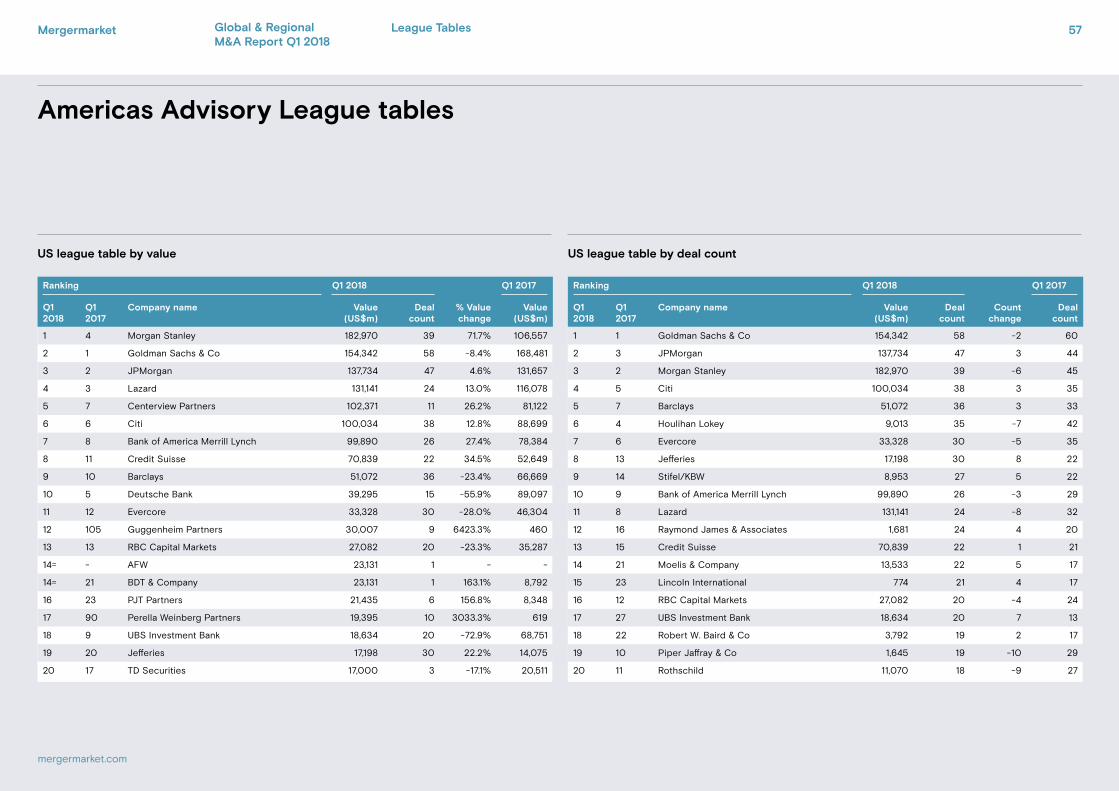
Americas Advisory League tables
US league table by value US league table by deal count
Ranking Q1 2018 Q1 2017
Q1 2018
Q1 2017
Company name Value (US$m)
Deal count
Count change
Deal count
1 1 Goldman Sachs & Co 154,342 58 -2 60
2 3 JPMorgan 137,734 47 3 44
3 2 Morgan Stanley 182,970 39 -6 45
4 5 Citi 100,034 38 3 35
5 7 Barclays 51,072 36 3 33
6 4 Houlihan Lokey 9,013 35 -7 42
7 6 Evercore 33,328 30 -5 35
8 13 Jefferies 17,198 30 8 22
9 14 Stifel/KBW 8,953 27 5 22
10 9 Bank of America Merrill Lynch 99,890 26 -3 29
11 8 Lazard 131,141 24 -8 32
12 16 Raymond James & Associates 1,681 24 4 20
13 15 Credit Suisse 70,839 22 1 21
14 21 Moelis & Company 13,533 22 5 17
15 23 Lincoln International 774 21 4 17
16 12 RBC Capital Markets 27,082 20 -4 24
17 27 UBS Investment Bank 18,634 20 7 13
18 22 Robert W. Baird & Co 3,792 19 2 17
19 10 Piper Jaffray & Co 1,645 19 -10 29
20 11 Rothschild 11,070 18 -9 27
Ranking Q1 2018 Q1 2017
Q1 2018
Q1 2017
Company name Value (US$m)
Deal count
% Value change
Value (US$m)
1 4 Morgan Stanley 182,970 39 71.7% 106,557
2 1 Goldman Sachs & Co 154,342 58 -8.4% 168,481
3 2 JPMorgan 137,734 47 4.6% 131,657
4 3 Lazard 131,141 24 13.0% 116,078
5 7 Centerview Partners 102,371 11 26.2% 81,122
6 6 Citi 100,034 38 12.8% 88,699
7 8 Bank of America Merrill Lynch 99,890 26 27.4% 78,384
8 11 Credit Suisse 70,839 22 34.5% 52,649
9 10 Barclays 51,072 36 -23.4% 66,669
10 5 Deutsche Bank 39,295 15 -55.9% 89,097
11 12 Evercore 33,328 30 -28.0% 46,304
12 105 Guggenheim Partners 30,007 9 6423.3% 460
13 13 RBC Capital Markets 27,082 20 -23.3% 35,287
14= - AFW 23,131 1 - -
14= 21 BDT & Company 23,131 1 163.1% 8,792
16 23 PJT Partners 21,435 6 156.8% 8,348
17 90 Perella Weinberg Partners 19,395 10 3033.3% 619
18 9 UBS Investment Bank 18,634 20 -72.9% 68,751
19 20 Jefferies 17,198 30 22.2% 14,075
20 17 TD Securities 17,000 3 -17.1% 20,511
Mergermarket 57
mergermarket.com
Global & Regional M&A Report Q1 2018
League Tables

Americas Advisory League tables
US North East league table by value US North East league table by deal count
US Mid West league table by value US Mid West league table by deal count
Ranking Q1 2018 Q1 2017
Q1 2018
Q1 2017
Company name Value (US$m)
Deal count
% Value change
Value (US$m)
1 7 Morgan Stanley 154,158 29 446.9% 28,186
2 5 Goldman Sachs & Co 120,977 38 247.9% 34,771
3 4 Lazard 103,422 14 146.5% 41,962
4 12 Centerview Partners 101,584 8 1128.0% 8,272
5 8 JPMorgan 87,292 28 359.9% 18,979
6 2 Bank of America Merrill Lynch 83,797 15 75.4% 47,764
7 1 Citi 73,084 24 31.9% 55,426
8 3 Credit Suisse 40,879 13 -6.8% 43,852
9 14 Deutsche Bank 31,671 8 486.3% 5,402
10 85 Guggenheim Partners 28,972 5 12776.4% 225
Ranking Q1 2018 Q1 2017
Q1 2018
Q1 2017
Company name Value (US$m)
Deal count
% Value change
Value (US$m)
1 1 Morgan Stanley 107,449 12 216.2% 33,983
2 36 Lazard 78,535 6 9227.2% 842
3 8 Centerview Partners 75,834 3 797.6% 8,449
4 3 Goldman Sachs & Co 46,651 11 104.5% 22,810
5 7 Citi 41,755 5 270.5% 11,271
6 4 Bank of America Merrill Lynch 40,264 9 111.1% 19,073
7 2 Deutsche Bank 27,953 3 16.5% 23,996
8 9 JPMorgan 24,605 9 193.6% 8,380
9 11 Barclays 21,815 11 260.8% 6,046
10 13 Credit Suisse 13,698 6 140.6% 5,694
Ranking Q1 2018 Q1 2017
Q1 2018
Q1 2017
Company name Value (US$m)
Deal count
Count change
Deal count
1 1 Goldman Sachs & Co 120,977 38 7 31
2 2 Morgan Stanley 154,158 29 6 23
3 8 JPMorgan 87,292 28 12 16
4 5 Citi 73,084 24 6 18
5 7 Barclays 15,602 22 5 17
6 4 Houlihan Lokey 8,206 19 0 19
7 3 Bank of America Merrill Lynch 83,797 15 -4 19
8 6 Lazard 103,422 14 -3 17
9 11 Credit Suisse 40,879 13 0 13
10 18 Moelis & Company 8,318 13 3 10
Ranking Q1 2018 Q1 2017
Q1 2018
Q1 2017
Company name Value (US$m)
Deal count
Count change
Deal count
1 2 Morgan Stanley 107,449 12 -2 14
2 1 Houlihan Lokey 1,155 12 -9 21
3 3 Goldman Sachs & Co 46,651 11 -1 12
4 6 Barclays 21,815 11 1 10
5 58 Stifel/KBW 223 11 9 2
6 14 Evercore 11,541 10 4 6
7 13 Jefferies 2,604 10 4 6
8 4 Robert W. Baird & Co 1,185 10 -2 12
9 17 Lincoln International 604 10 4 6
10 19 Bank of America Merrill Lynch 40,264 9 4 5
Mergermarket 58
mergermarket.com
Global & Regional M&A Report Q1 2018
League Tables
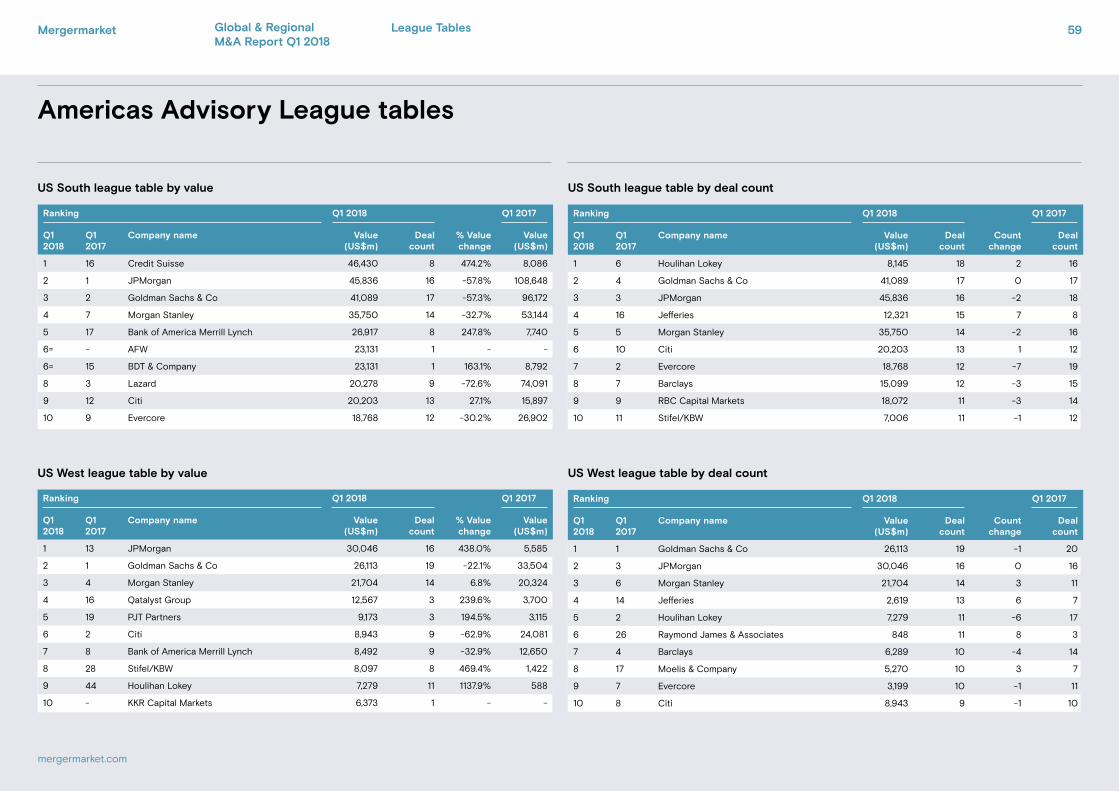
Americas Advisory League tables
US South league table by value US South league table by deal count
US West league table by value US West league table by deal count
Ranking Q1 2018 Q1 2017
Q1 2018
Q1 2017
Company name Value (US$m)
Deal count
% Value change
Value (US$m)
1 16 Credit Suisse 46,430 8 474.2% 8,086
2 1 JPMorgan 45,836 16 -57.8% 108,648
3 2 Goldman Sachs & Co 41,089 17 -57.3% 96,172
4 7 Morgan Stanley 35,750 14 -32.7% 53,144
5 17 Bank of America Merrill Lynch 26,917 8 247.8% 7,740
6= - AFW 23,131 1 - -
6= 15 BDT & Company 23,131 1 163.1% 8,792
8 3 Lazard 20,278 9 -72.6% 74,091
9 12 Citi 20,203 13 27.1% 15,897
10 9 Evercore 18,768 12 -30.2% 26,902
Ranking Q1 2018 Q1 2017
Q1 2018
Q1 2017
Company name Value (US$m)
Deal count
% Value change
Value (US$m)
1 13 JPMorgan 30,046 16 438.0% 5,585
2 1 Goldman Sachs & Co 26,113 19 -22.1% 33,504
3 4 Morgan Stanley 21,704 14 6.8% 20,324
4 16 Qatalyst Group 12,567 3 239.6% 3,700
5 19 PJT Partners 9,173 3 194.5% 3,115
6 2 Citi 8,943 9 -62.9% 24,081
7 8 Bank of America Merrill Lynch 8,492 9 -32.9% 12,650
8 28 Stifel/KBW 8,097 8 469.4% 1,422
9 44 Houlihan Lokey 7,279 11 1137.9% 588
10 - KKR Capital Markets 6,373 1 - -
Ranking Q1 2018 Q1 2017
Q1 2018
Q1 2017
Company name Value (US$m)
Deal count
Count change
Deal count
1 6 Houlihan Lokey 8,145 18 2 16
2 4 Goldman Sachs & Co 41,089 17 0 17
3 3 JPMorgan 45,836 16 -2 18
4 16 Jefferies 12,321 15 7 8
5 5 Morgan Stanley 35,750 14 -2 16
6 10 Citi 20,203 13 1 12
7 2 Evercore 18,768 12 -7 19
8 7 Barclays 15,099 12 -3 15
9 9 RBC Capital Markets 18,072 11 -3 14
10 11 Stifel/KBW 7,006 11 -1 12
Ranking Q1 2018 Q1 2017
Q1 2018
Q1 2017
Company name Value (US$m)
Deal count
Count change
Deal count
1 1 Goldman Sachs & Co 26,113 19 -1 20
2 3 JPMorgan 30,046 16 0 16
3 6 Morgan Stanley 21,704 14 3 11
4 14 Jefferies 2,619 13 6 7
5 2 Houlihan Lokey 7,279 11 -6 17
6 26 Raymond James & Associates 848 11 8 3
7 4 Barclays 6,289 10 -4 14
8 17 Moelis & Company 5,270 10 3 7
9 7 Evercore 3,199 10 -1 11
10 8 Citi 8,943 9 -1 10
Mergermarket 59
mergermarket.com
Global & Regional M&A Report Q1 2018
League Tables
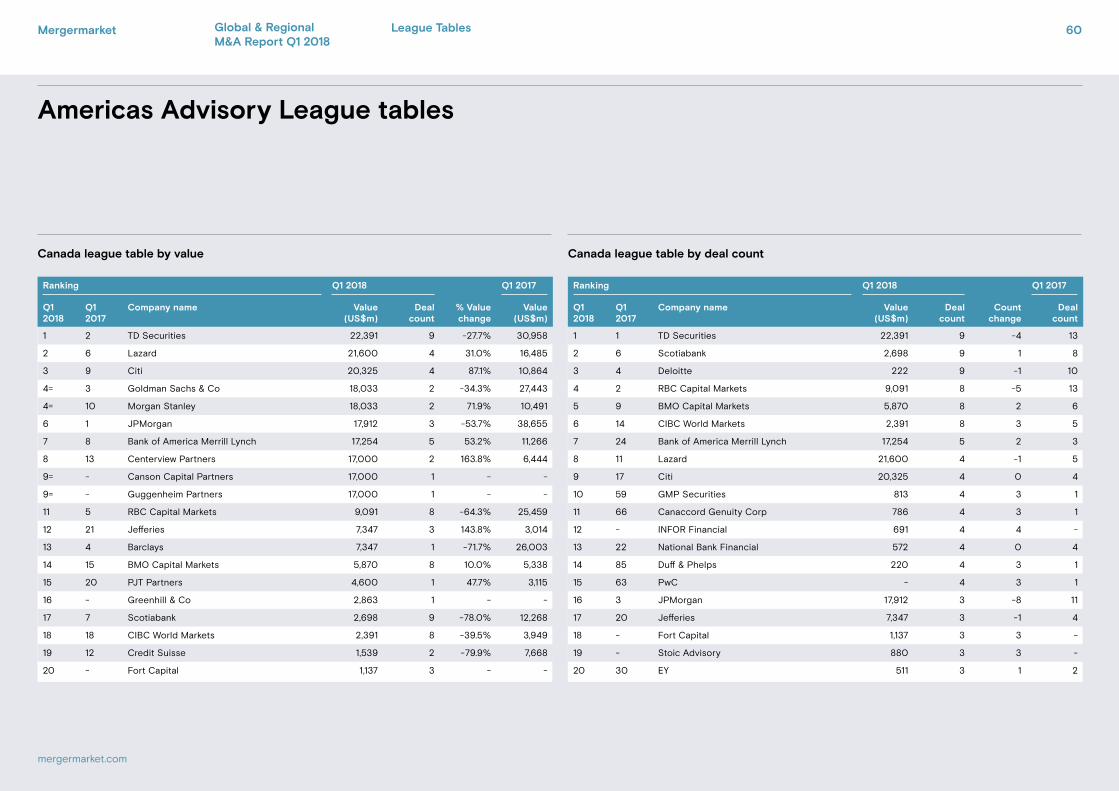
Americas Advisory League tables
Canada league table by value Canada league table by deal count
Ranking Q1 2018 Q1 2017
Q1 2018
Q1 2017
Company name Value (US$m)
Deal count
Count change
Deal count
1 1 TD Securities 22,391 9 -4 13
2 6 Scotiabank 2,698 9 1 8
3 4 Deloitte 222 9 -1 10
4 2 RBC Capital Markets 9,091 8 -5 13
5 9 BMO Capital Markets 5,870 8 2 6
6 14 CIBC World Markets 2,391 8 3 5
7 24 Bank of America Merrill Lynch 17,254 5 2 3
8 11 Lazard 21,600 4 -1 5
9 17 Citi 20,325 4 0 4
10 59 GMP Securities 813 4 3 1
11 66 Canaccord Genuity Corp 786 4 3 1
12 - INFOR Financial 691 4 4 -
13 22 National Bank Financial 572 4 0 4
14 85 Duff & Phelps 220 4 3 1
15 63 PwC - 4 3 1
16 3 JPMorgan 17,912 3 -8 11
17 20 Jefferies 7,347 3 -1 4
18 - Fort Capital 1,137 3 3 -
19 - Stoic Advisory 880 3 3 -
20 30 EY 511 3 1 2
Ranking Q1 2018 Q1 2017
Q1 2018
Q1 2017
Company name Value (US$m)
Deal count
% Value change
Value (US$m)
1 2 TD Securities 22,391 9 -27.7% 30,958
2 6 Lazard 21,600 4 31.0% 16,485
3 9 Citi 20,325 4 87.1% 10,864
4= 3 Goldman Sachs & Co 18,033 2 -34.3% 27,443
4= 10 Morgan Stanley 18,033 2 71.9% 10,491
6 1 JPMorgan 17,912 3 -53.7% 38,655
7 8 Bank of America Merrill Lynch 17,254 5 53.2% 11,266
8 13 Centerview Partners 17,000 2 163.8% 6,444
9= - Canson Capital Partners 17,000 1 - -
9= - Guggenheim Partners 17,000 1 - -
11 5 RBC Capital Markets 9,091 8 -64.3% 25,459
12 21 Jefferies 7,347 3 143.8% 3,014
13 4 Barclays 7,347 1 -71.7% 26,003
14 15 BMO Capital Markets 5,870 8 10.0% 5,338
15 20 PJT Partners 4,600 1 47.7% 3,115
16 - Greenhill & Co 2,863 1 - -
17 7 Scotiabank 2,698 9 -78.0% 12,268
18 18 CIBC World Markets 2,391 8 -39.5% 3,949
19 12 Credit Suisse 1,539 2 -79.9% 7,668
20 - Fort Capital 1,137 3 - -
Mergermarket 60
mergermarket.com
Global & Regional M&A Report Q1 2018
League Tables
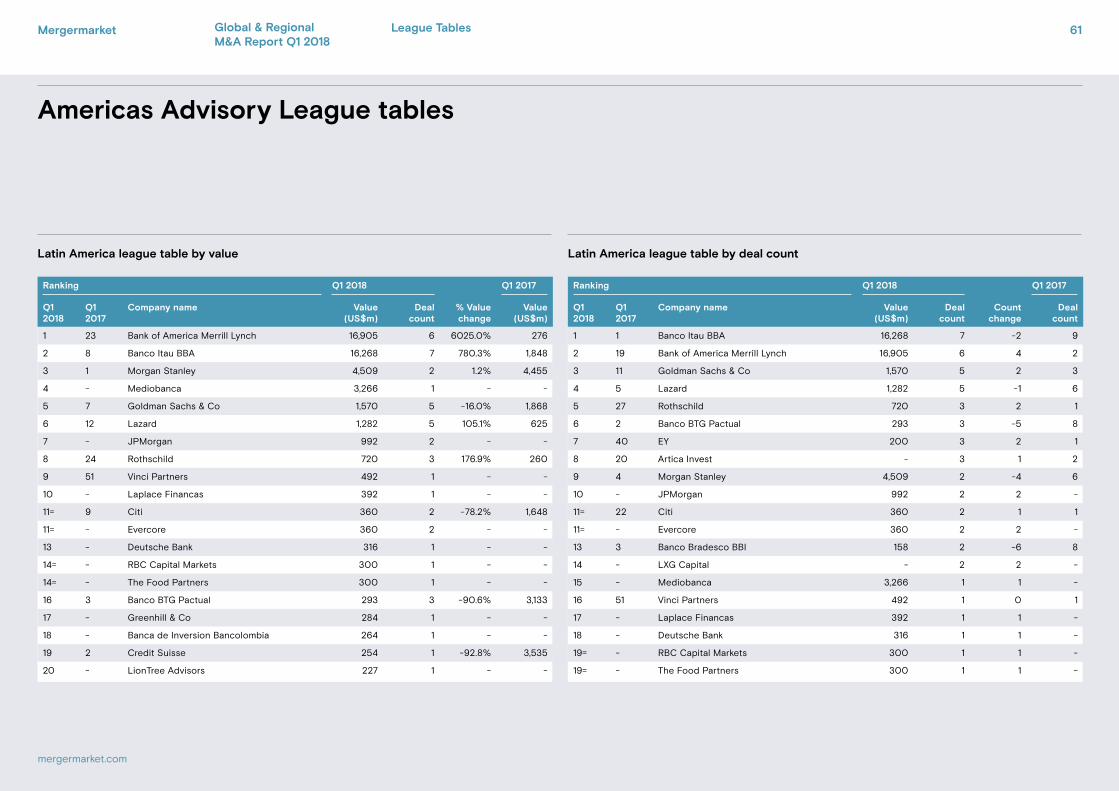
Americas Advisory League tables
Latin America league table by value Latin America league table by deal count
Ranking Q1 2018 Q1 2017
Q1 2018
Q1 2017
Company name Value (US$m)
Deal count
Count change
Deal count
1 1 Banco Itau BBA 16,268 7 -2 9
2 19 Bank of America Merrill Lynch 16,905 6 4 2
3 11 Goldman Sachs & Co 1,570 5 2 3
4 5 Lazard 1,282 5 -1 6
5 27 Rothschild 720 3 2 1
6 2 Banco BTG Pactual 293 3 -5 8
7 40 EY 200 3 2 1
8 20 Artica Invest - 3 1 2
9 4 Morgan Stanley 4,509 2 -4 6
10 - JPMorgan 992 2 2 -
11= 22 Citi 360 2 1 1
11= - Evercore 360 2 2 -
13 3 Banco Bradesco BBI 158 2 -6 8
14 - LXG Capital - 2 2 -
15 - Mediobanca 3,266 1 1 -
16 51 Vinci Partners 492 1 0 1
17 - Laplace Financas 392 1 1 -
18 - Deutsche Bank 316 1 1 -
19= - RBC Capital Markets 300 1 1 -
19= - The Food Partners 300 1 1 -
Ranking Q1 2018 Q1 2017
Q1 2018
Q1 2017
Company name Value (US$m)
Deal count
% Value change
Value (US$m)
1 23 Bank of America Merrill Lynch 16,905 6 6025.0% 276
2 8 Banco Itau BBA 16,268 7 780.3% 1,848
3 1 Morgan Stanley 4,509 2 1.2% 4,455
4 - Mediobanca 3,266 1 - -
5 7 Goldman Sachs & Co 1,570 5 -16.0% 1,868
6 12 Lazard 1,282 5 105.1% 625
7 - JPMorgan 992 2 - -
8 24 Rothschild 720 3 176.9% 260
9 51 Vinci Partners 492 1 - -
10 - Laplace Financas 392 1 - -
11= 9 Citi 360 2 -78.2% 1,648
11= - Evercore 360 2 - -
13 - Deutsche Bank 316 1 - -
14= - RBC Capital Markets 300 1 - -
14= - The Food Partners 300 1 - -
16 3 Banco BTG Pactual 293 3 -90.6% 3,133
17 - Greenhill & Co 284 1 - -
18 - Banca de Inversion Bancolombia 264 1 - -
19 2 Credit Suisse 254 1 -92.8% 3,535
20 - LionTree Advisors 227 1 - -
Mergermarket 61
mergermarket.com
Global & Regional M&A Report Q1 2018
League Tables
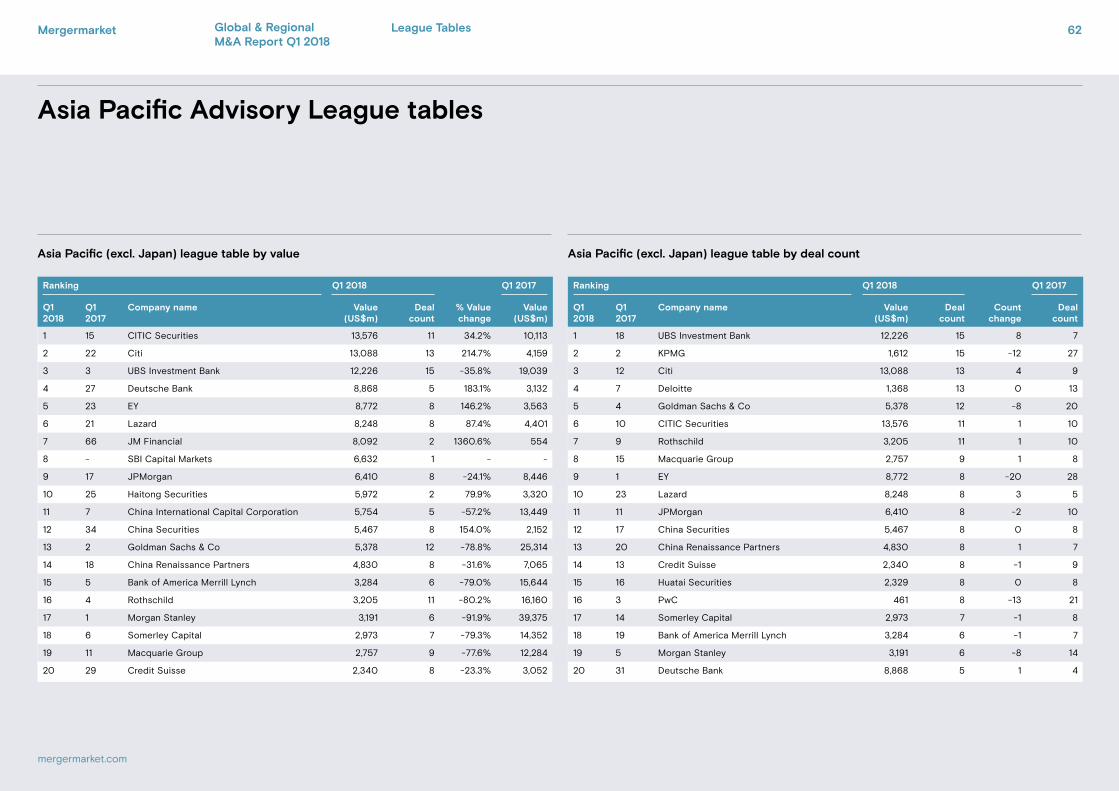
Asia Pacific Advisory League tables
Asia Pacific (excl. Japan) league table by value Asia Pacific (excl. Japan) league table by deal count
Ranking Q1 2018 Q1 2017
Q1 2018
Q1 2017
Company name Value (US$m)
Deal count
Count change
Deal count
1 18 UBS Investment Bank 12,226 15 8 7
2 2 KPMG 1,612 15 -12 27
3 12 Citi 13,088 13 4 9
4 7 Deloitte 1,368 13 0 13
5 4 Goldman Sachs & Co 5,378 12 -8 20
6 10 CITIC Securities 13,576 11 1 10
7 9 Rothschild 3,205 11 1 10
8 15 Macquarie Group 2,757 9 1 8
9 1 EY 8,772 8 -20 28
10 23 Lazard 8,248 8 3 5
11 11 JPMorgan 6,410 8 -2 10
12 17 China Securities 5,467 8 0 8
13 20 China Renaissance Partners 4,830 8 1 7
14 13 Credit Suisse 2,340 8 -1 9
15 16 Huatai Securities 2,329 8 0 8
16 3 PwC 461 8 -13 21
17 14 Somerley Capital 2,973 7 -1 8
18 19 Bank of America Merrill Lynch 3,284 6 -1 7
19 5 Morgan Stanley 3,191 6 -8 14
20 31 Deutsche Bank 8,868 5 1 4
Ranking Q1 2018 Q1 2017
Q1 2018
Q1 2017
Company name Value (US$m)
Deal count
% Value change
Value (US$m)
1 15 CITIC Securities 13,576 11 34.2% 10,113
2 22 Citi 13,088 13 214.7% 4,159
3 3 UBS Investment Bank 12,226 15 -35.8% 19,039
4 27 Deutsche Bank 8,868 5 183.1% 3,132
5 23 EY 8,772 8 146.2% 3,563
6 21 Lazard 8,248 8 87.4% 4,401
7 66 JM Financial 8,092 2 1360.6% 554
8 - SBI Capital Markets 6,632 1 - -
9 17 JPMorgan 6,410 8 -24.1% 8,446
10 25 Haitong Securities 5,972 2 79.9% 3,320
11 7 China International Capital Corporation 5,754 5 -57.2% 13,449
12 34 China Securities 5,467 8 154.0% 2,152
13 2 Goldman Sachs & Co 5,378 12 -78.8% 25,314
14 18 China Renaissance Partners 4,830 8 -31.6% 7,065
15 5 Bank of America Merrill Lynch 3,284 6 -79.0% 15,644
16 4 Rothschild 3,205 11 -80.2% 16,160
17 1 Morgan Stanley 3,191 6 -91.9% 39,375
18 6 Somerley Capital 2,973 7 -79.3% 14,352
19 11 Macquarie Group 2,757 9 -77.6% 12,284
20 29 Credit Suisse 2,340 8 -23.3% 3,052
Mergermarket 62
mergermarket.com
Global & Regional M&A Report Q1 2018
League Tables
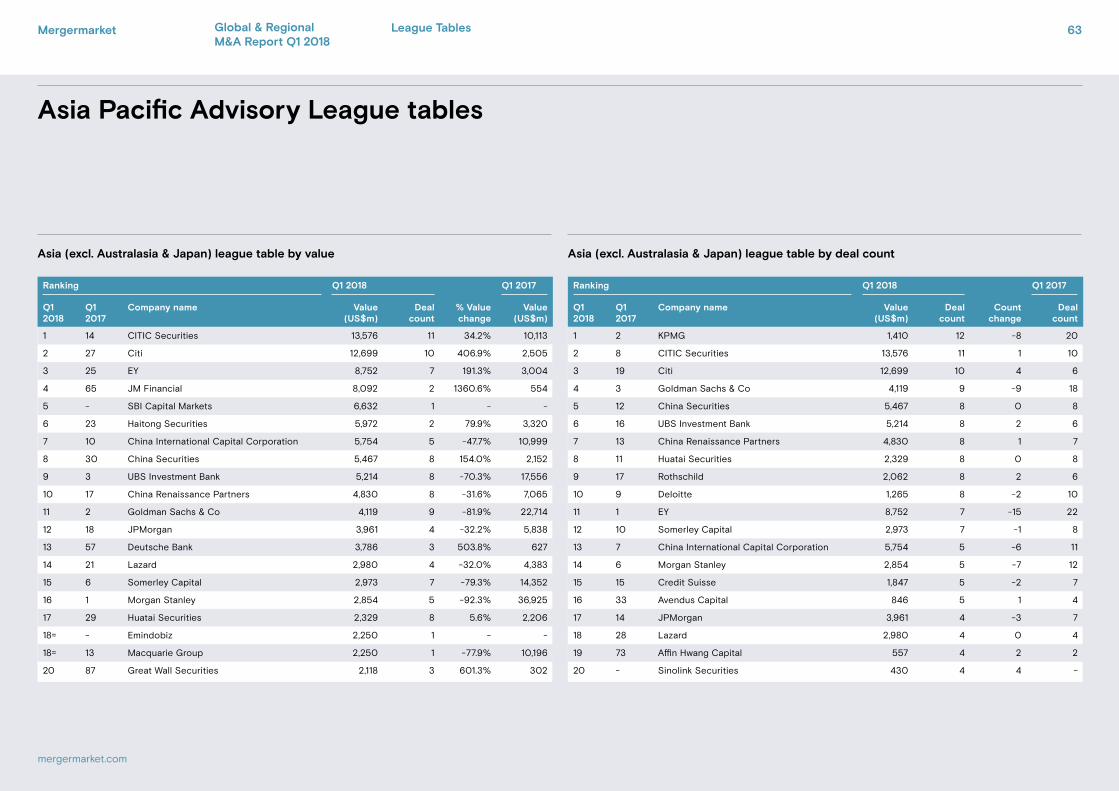
Asia Pacific Advisory League tables
Asia (excl. Australasia & Japan) league table by value Asia (excl. Australasia & Japan) league table by deal count
Ranking Q1 2018 Q1 2017
Q1 2018
Q1 2017
Company name Value (US$m)
Deal count
Count change
Deal count
1 2 KPMG 1,410 12 -8 20
2 8 CITIC Securities 13,576 11 1 10
3 19 Citi 12,699 10 4 6
4 3 Goldman Sachs & Co 4,119 9 -9 18
5 12 China Securities 5,467 8 0 8
6 16 UBS Investment Bank 5,214 8 2 6
7 13 China Renaissance Partners 4,830 8 1 7
8 11 Huatai Securities 2,329 8 0 8
9 17 Rothschild 2,062 8 2 6
10 9 Deloitte 1,265 8 -2 10
11 1 EY 8,752 7 -15 22
12 10 Somerley Capital 2,973 7 -1 8
13 7 China International Capital Corporation 5,754 5 -6 11
14 6 Morgan Stanley 2,854 5 -7 12
15 15 Credit Suisse 1,847 5 -2 7
16 33 Avendus Capital 846 5 1 4
17 14 JPMorgan 3,961 4 -3 7
18 28 Lazard 2,980 4 0 4
19 73 Affin Hwang Capital 557 4 2 2
20 - Sinolink Securities 430 4 4 -
Ranking Q1 2018 Q1 2017
Q1 2018
Q1 2017
Company name Value (US$m)
Deal count
% Value change
Value (US$m)
1 14 CITIC Securities 13,576 11 34.2% 10,113
2 27 Citi 12,699 10 406.9% 2,505
3 25 EY 8,752 7 191.3% 3,004
4 65 JM Financial 8,092 2 1360.6% 554
5 - SBI Capital Markets 6,632 1 - -
6 23 Haitong Securities 5,972 2 79.9% 3,320
7 10 China International Capital Corporation 5,754 5 -47.7% 10,999
8 30 China Securities 5,467 8 154.0% 2,152
9 3 UBS Investment Bank 5,214 8 -70.3% 17,556
10 17 China Renaissance Partners 4,830 8 -31.6% 7,065
11 2 Goldman Sachs & Co 4,119 9 -81.9% 22,714
12 18 JPMorgan 3,961 4 -32.2% 5,838
13 57 Deutsche Bank 3,786 3 503.8% 627
14 21 Lazard 2,980 4 -32.0% 4,383
15 6 Somerley Capital 2,973 7 -79.3% 14,352
16 1 Morgan Stanley 2,854 5 -92.3% 36,925
17 29 Huatai Securities 2,329 8 5.6% 2,206
18= - Emindobiz 2,250 1 - -
18= 13 Macquarie Group 2,250 1 -77.9% 10,196
20 87 Great Wall Securities 2,118 3 601.3% 302
Mergermarket 63
mergermarket.com
Global & Regional M&A Report Q1 2018
League Tables
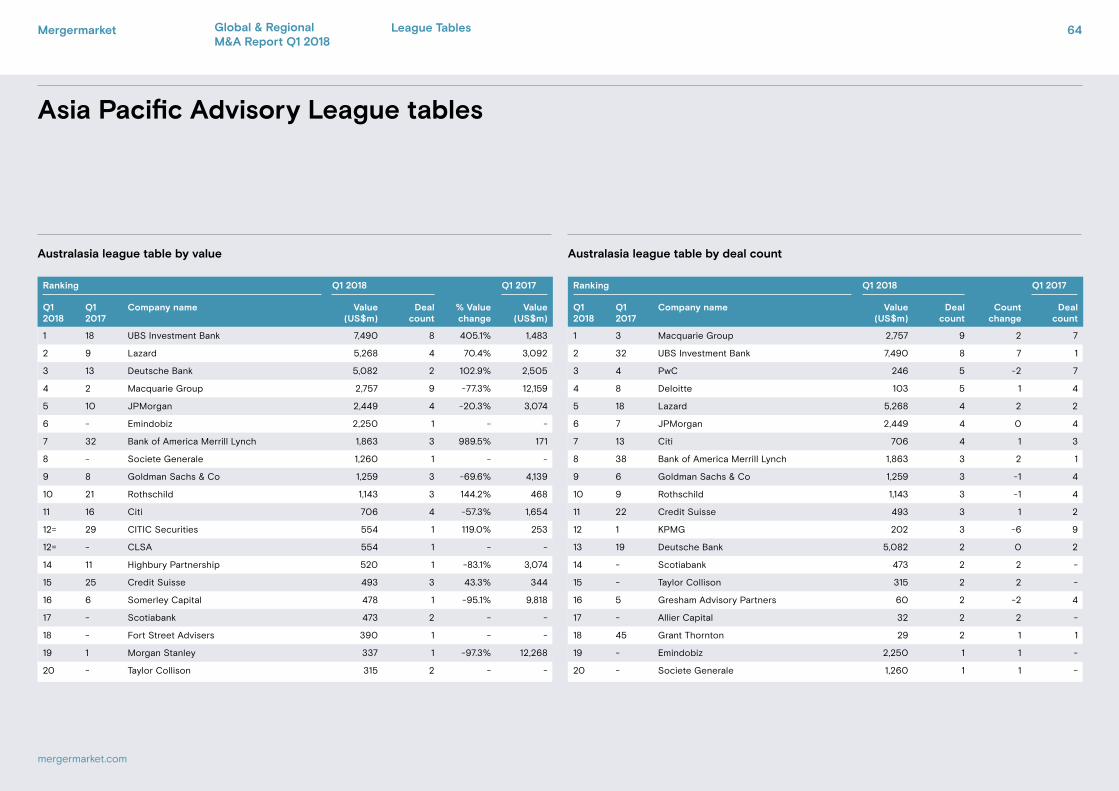
Asia Pacific Advisory League tables
Australasia league table by value Australasia league table by deal count
Ranking Q1 2018 Q1 2017
Q1 2018
Q1 2017
Company name Value (US$m)
Deal count
Count change
Deal count
1 3 Macquarie Group 2,757 9 2 7
2 32 UBS Investment Bank 7,490 8 7 1
3 4 PwC 246 5 -2 7
4 8 Deloitte 103 5 1 4
5 18 Lazard 5,268 4 2 2
6 7 JPMorgan 2,449 4 0 4
7 13 Citi 706 4 1 3
8 38 Bank of America Merrill Lynch 1,863 3 2 1
9 6 Goldman Sachs & Co 1,259 3 -1 4
10 9 Rothschild 1,143 3 -1 4
11 22 Credit Suisse 493 3 1 2
12 1 KPMG 202 3 -6 9
13 19 Deutsche Bank 5,082 2 0 2
14 - Scotiabank 473 2 2 -
15 - Taylor Collison 315 2 2 -
16 5 Gresham Advisory Partners 60 2 -2 4
17 - Allier Capital 32 2 2 -
18 45 Grant Thornton 29 2 1 1
19 - Emindobiz 2,250 1 1 -
20 - Societe Generale 1,260 1 1 -
Ranking Q1 2018 Q1 2017
Q1 2018
Q1 2017
Company name Value (US$m)
Deal count
% Value change
Value (US$m)
1 18 UBS Investment Bank 7,490 8 405.1% 1,483
2 9 Lazard 5,268 4 70.4% 3,092
3 13 Deutsche Bank 5,082 2 102.9% 2,505
4 2 Macquarie Group 2,757 9 -77.3% 12,159
5 10 JPMorgan 2,449 4 -20.3% 3,074
6 - Emindobiz 2,250 1 - -
7 32 Bank of America Merrill Lynch 1,863 3 989.5% 171
8 - Societe Generale 1,260 1 - -
9 8 Goldman Sachs & Co 1,259 3 -69.6% 4,139
10 21 Rothschild 1,143 3 144.2% 468
11 16 Citi 706 4 -57.3% 1,654
12= 29 CITIC Securities 554 1 119.0% 253
12= - CLSA 554 1 - -
14 11 Highbury Partnership 520 1 -83.1% 3,074
15 25 Credit Suisse 493 3 43.3% 344
16 6 Somerley Capital 478 1 -95.1% 9,818
17 - Scotiabank 473 2 - -
18 - Fort Street Advisers 390 1 - -
19 1 Morgan Stanley 337 1 -97.3% 12,268
20 - Taylor Collison 315 2 - -
Mergermarket 64
mergermarket.com
Global & Regional M&A Report Q1 2018
League Tables
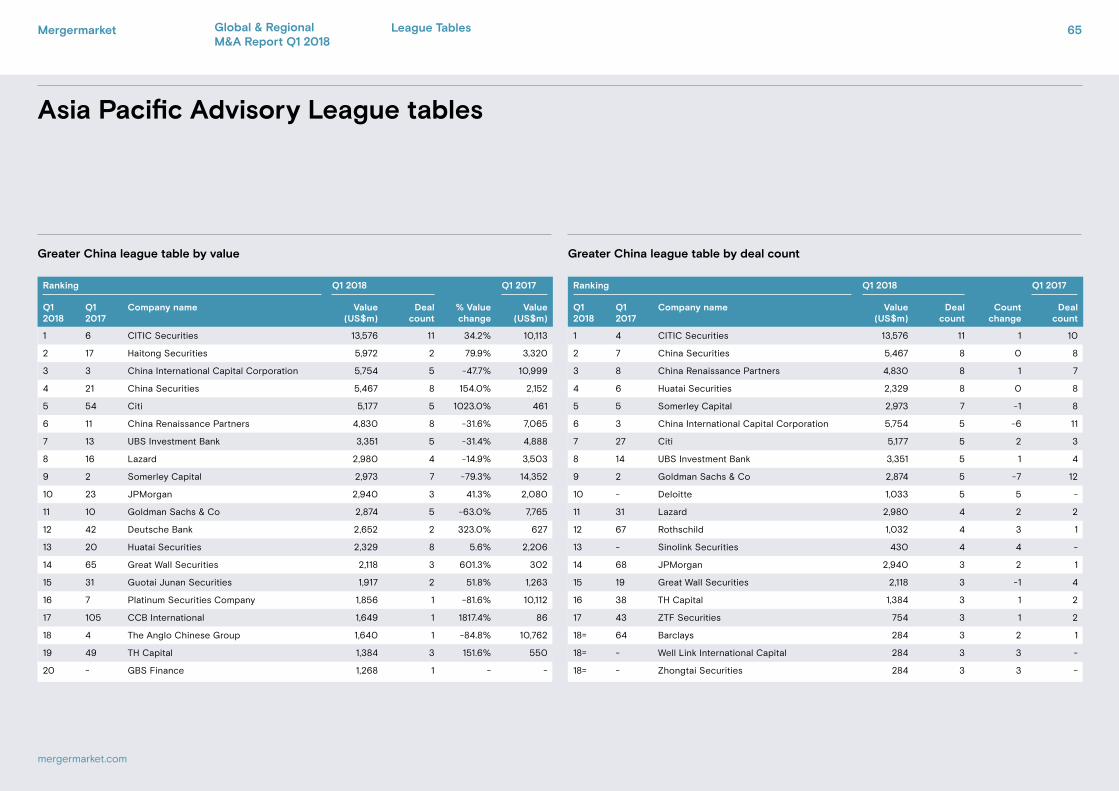
Asia Pacific Advisory League tables
Greater China league table by value Greater China league table by deal count
Ranking Q1 2018 Q1 2017
Q1 2018
Q1 2017
Company name Value (US$m)
Deal count
Count change
Deal count
1 4 CITIC Securities 13,576 11 1 10
2 7 China Securities 5,467 8 0 8
3 8 China Renaissance Partners 4,830 8 1 7
4 6 Huatai Securities 2,329 8 0 8
5 5 Somerley Capital 2,973 7 -1 8
6 3 China International Capital Corporation 5,754 5 -6 11
7 27 Citi 5,177 5 2 3
8 14 UBS Investment Bank 3,351 5 1 4
9 2 Goldman Sachs & Co 2,874 5 -7 12
10 - Deloitte 1,033 5 5 -
11 31 Lazard 2,980 4 2 2
12 67 Rothschild 1,032 4 3 1
13 - Sinolink Securities 430 4 4 -
14 68 JPMorgan 2,940 3 2 1
15 19 Great Wall Securities 2,118 3 -1 4
16 38 TH Capital 1,384 3 1 2
17 43 ZTF Securities 754 3 1 2
18= 64 Barclays 284 3 2 1
18= - Well Link International Capital 284 3 3 -
18= - Zhongtai Securities 284 3 3 -
Ranking Q1 2018 Q1 2017
Q1 2018
Q1 2017
Company name Value (US$m)
Deal count
% Value change
Value (US$m)
1 6 CITIC Securities 13,576 11 34.2% 10,113
2 17 Haitong Securities 5,972 2 79.9% 3,320
3 3 China International Capital Corporation 5,754 5 -47.7% 10,999
4 21 China Securities 5,467 8 154.0% 2,152
5 54 Citi 5,177 5 1023.0% 461
6 11 China Renaissance Partners 4,830 8 -31.6% 7,065
7 13 UBS Investment Bank 3,351 5 -31.4% 4,888
8 16 Lazard 2,980 4 -14.9% 3,503
9 2 Somerley Capital 2,973 7 -79.3% 14,352
10 23 JPMorgan 2,940 3 41.3% 2,080
11 10 Goldman Sachs & Co 2,874 5 -63.0% 7,765
12 42 Deutsche Bank 2,652 2 323.0% 627
13 20 Huatai Securities 2,329 8 5.6% 2,206
14 65 Great Wall Securities 2,118 3 601.3% 302
15 31 Guotai Junan Securities 1,917 2 51.8% 1,263
16 7 Platinum Securities Company 1,856 1 -81.6% 10,112
17 105 CCB International 1,649 1 1817.4% 86
18 4 The Anglo Chinese Group 1,640 1 -84.8% 10,762
19 49 TH Capital 1,384 3 151.6% 550
20 - GBS Finance 1,268 1 - -
Mergermarket 65
mergermarket.com
Global & Regional M&A Report Q1 2018
League Tables
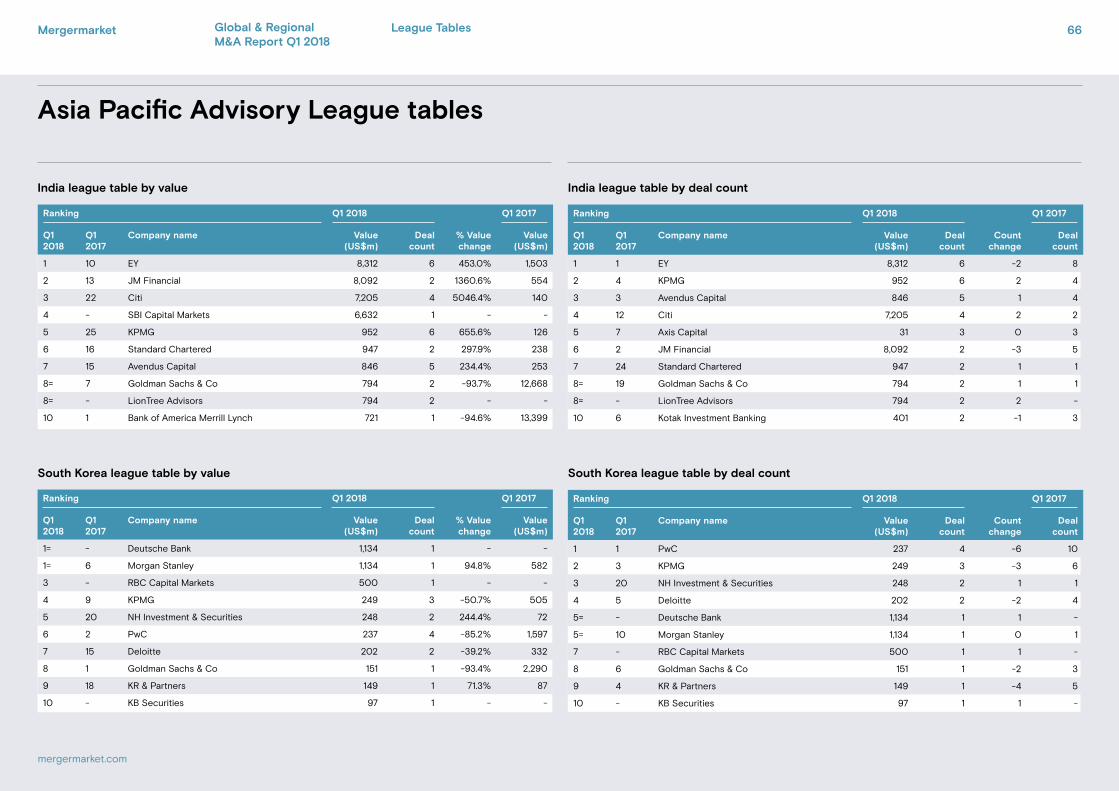
Asia Pacific Advisory League tables
India league table by value India league table by deal count
South Korea league table by value South Korea league table by deal count
Ranking Q1 2018 Q1 2017
Q1 2018
Q1 2017
Company name Value (US$m)
Deal count
% Value change
Value (US$m)
1 10 EY 8,312 6 453.0% 1,503
2 13 JM Financial 8,092 2 1360.6% 554
3 22 Citi 7,205 4 5046.4% 140
4 - SBI Capital Markets 6,632 1 - -
5 25 KPMG 952 6 655.6% 126
6 16 Standard Chartered 947 2 297.9% 238
7 15 Avendus Capital 846 5 234.4% 253
8= 7 Goldman Sachs & Co 794 2 -93.7% 12,668
8= - LionTree Advisors 794 2 - -
10 1 Bank of America Merrill Lynch 721 1 -94.6% 13,399
Ranking Q1 2018 Q1 2017
Q1 2018
Q1 2017
Company name Value (US$m)
Deal count
% Value change
Value (US$m)
1= - Deutsche Bank 1,134 1 - -
1= 6 Morgan Stanley 1,134 1 94.8% 582
3 - RBC Capital Markets 500 1 - -
4 9 KPMG 249 3 -50.7% 505
5 20 NH Investment & Securities 248 2 244.4% 72
6 2 PwC 237 4 -85.2% 1,597
7 15 Deloitte 202 2 -39.2% 332
8 1 Goldman Sachs & Co 151 1 -93.4% 2,290
9 18 KR & Partners 149 1 71.3% 87
10 - KB Securities 97 1 - -
Ranking Q1 2018 Q1 2017
Q1 2018
Q1 2017
Company name Value (US$m)
Deal count
Count change
Deal count
1 1 EY 8,312 6 -2 8
2 4 KPMG 952 6 2 4
3 3 Avendus Capital 846 5 1 4
4 12 Citi 7,205 4 2 2
5 7 Axis Capital 31 3 0 3
6 2 JM Financial 8,092 2 -3 5
7 24 Standard Chartered 947 2 1 1
8= 19 Goldman Sachs & Co 794 2 1 1
8= - LionTree Advisors 794 2 2 -
10 6 Kotak Investment Banking 401 2 -1 3
Ranking Q1 2018 Q1 2017
Q1 2018
Q1 2017
Company name Value (US$m)
Deal count
Count change
Deal count
1 1 PwC 237 4 -6 10
2 3 KPMG 249 3 -3 6
3 20 NH Investment & Securities 248 2 1 1
4 5 Deloitte 202 2 -2 4
5= - Deutsche Bank 1,134 1 1 -
5= 10 Morgan Stanley 1,134 1 0 1
7 - RBC Capital Markets 500 1 1 -
8 6 Goldman Sachs & Co 151 1 -2 3
9 4 KR & Partners 149 1 -4 5
10 - KB Securities 97 1 1 -
Mergermarket 66
mergermarket.com
Global & Regional M&A Report Q1 2018
League Tables
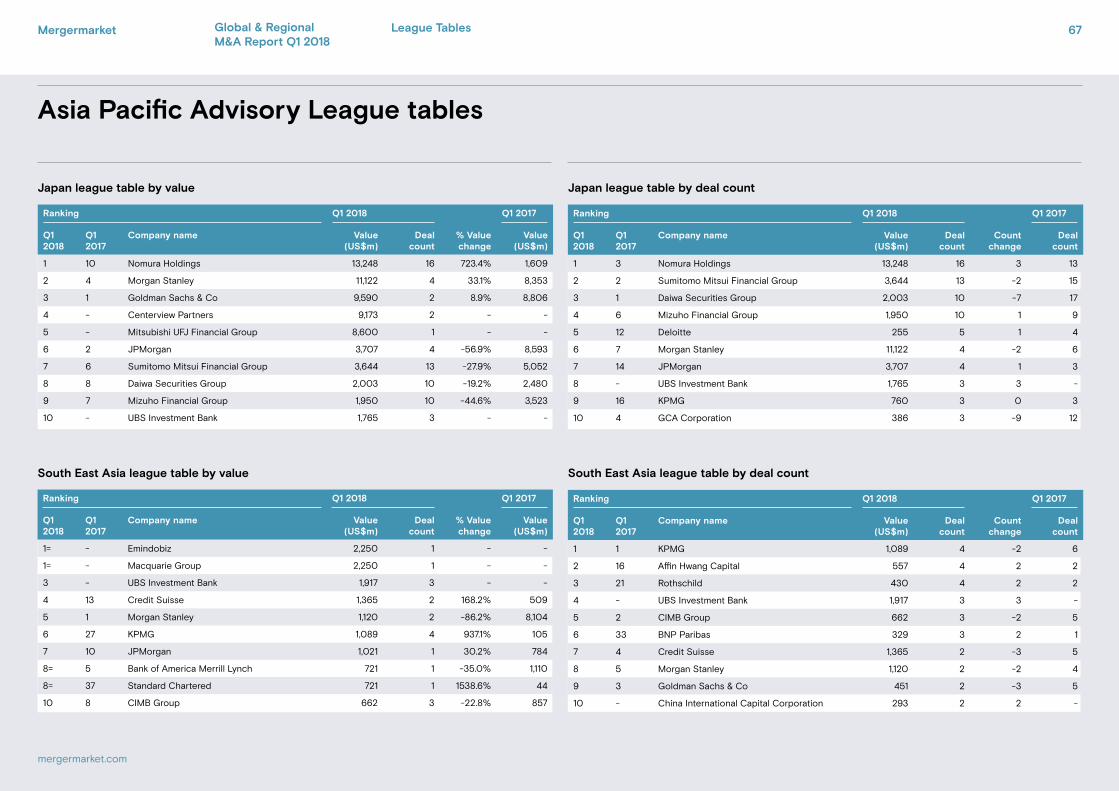
Asia Pacific Advisory League tables
Japan league table by value Japan league table by deal count
South East Asia league table by value South East Asia league table by deal count
Ranking Q1 2018 Q1 2017
Q1 2018
Q1 2017
Company name Value (US$m)
Deal count
% Value change
Value (US$m)
1 10 Nomura Holdings 13,248 16 723.4% 1,609
2 4 Morgan Stanley 11,122 4 33.1% 8,353
3 1 Goldman Sachs & Co 9,590 2 8.9% 8,806
4 - Centerview Partners 9,173 2 - -
5 - Mitsubishi UFJ Financial Group 8,600 1 - -
6 2 JPMorgan 3,707 4 -56.9% 8,593
7 6 Sumitomo Mitsui Financial Group 3,644 13 -27.9% 5,052
8 8 Daiwa Securities Group 2,003 10 -19.2% 2,480
9 7 Mizuho Financial Group 1,950 10 -44.6% 3,523
10 - UBS Investment Bank 1,765 3 - -
Ranking Q1 2018 Q1 2017
Q1 2018
Q1 2017
Company name Value (US$m)
Deal count
% Value change
Value (US$m)
1= - Emindobiz 2,250 1 - -
1= - Macquarie Group 2,250 1 - -
3 - UBS Investment Bank 1,917 3 - -
4 13 Credit Suisse 1,365 2 168.2% 509
5 1 Morgan Stanley 1,120 2 -86.2% 8,104
6 27 KPMG 1,089 4 937.1% 105
7 10 JPMorgan 1,021 1 30.2% 784
8= 5 Bank of America Merrill Lynch 721 1 -35.0% 1,110
8= 37 Standard Chartered 721 1 1538.6% 44
10 8 CIMB Group 662 3 -22.8% 857
Ranking Q1 2018 Q1 2017
Q1 2018
Q1 2017
Company name Value (US$m)
Deal count
Count change
Deal count
1 3 Nomura Holdings 13,248 16 3 13
2 2 Sumitomo Mitsui Financial Group 3,644 13 -2 15
3 1 Daiwa Securities Group 2,003 10 -7 17
4 6 Mizuho Financial Group 1,950 10 1 9
5 12 Deloitte 255 5 1 4
6 7 Morgan Stanley 11,122 4 -2 6
7 14 JPMorgan 3,707 4 1 3
8 - UBS Investment Bank 1,765 3 3 -
9 16 KPMG 760 3 0 3
10 4 GCA Corporation 386 3 -9 12
Ranking Q1 2018 Q1 2017
Q1 2018
Q1 2017
Company name Value (US$m)
Deal count
Count change
Deal count
1 1 KPMG 1,089 4 -2 6
2 16 Affin Hwang Capital 557 4 2 2
3 21 Rothschild 430 4 2 2
4 - UBS Investment Bank 1,917 3 3 -
5 2 CIMB Group 662 3 -2 5
6 33 BNP Paribas 329 3 2 1
7 4 Credit Suisse 1,365 2 -3 5
8 5 Morgan Stanley 1,120 2 -2 4
9 3 Goldman Sachs & Co 451 2 -3 5
10 - China International Capital Corporation 293 2 2 -
Mergermarket 67
mergermarket.com
Global & Regional M&A Report Q1 2018
League Tables
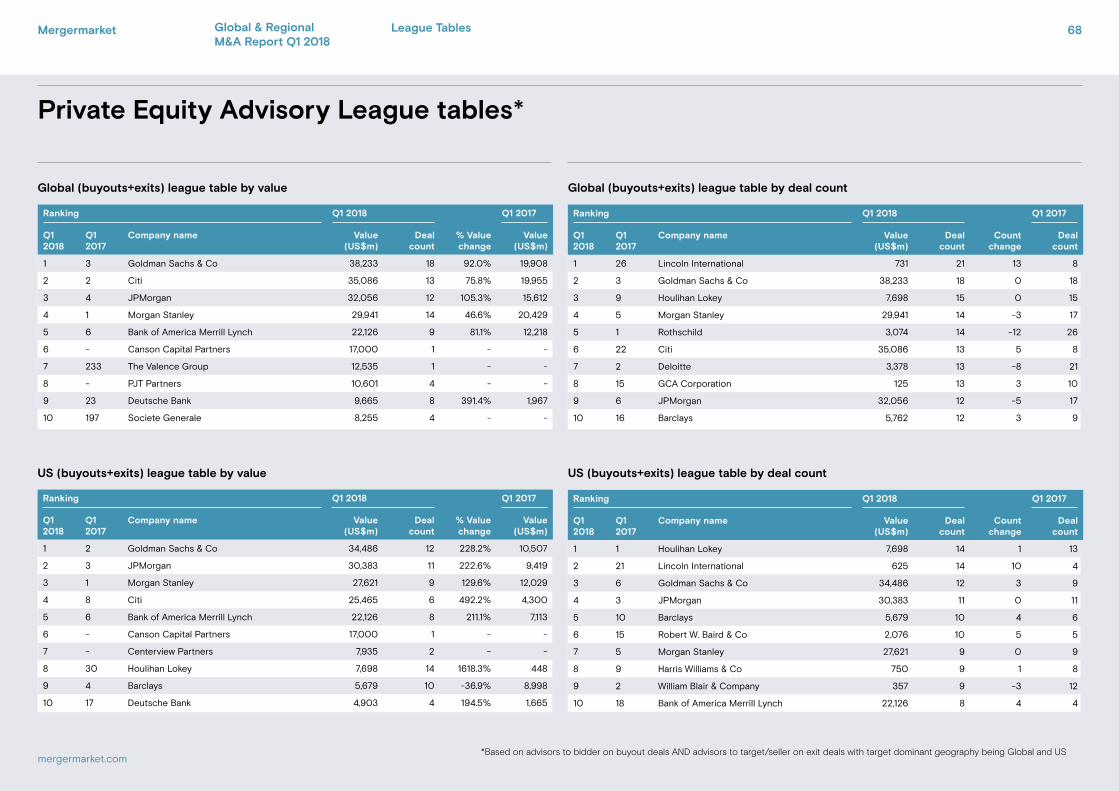
Private Equity Advisory League tables*
Global (buyouts+exits) league table by value Global (buyouts+exits) league table by deal count
US (buyouts+exits) league table by value US (buyouts+exits) league table by deal count
*Based on advisors to bidder on buyout deals AND advisors to target/seller on exit deals with target dominant geography being Global and US
Ranking Q1 2018 Q1 2017
Q1 2018
Q1 2017
Company name Value (US$m)
Deal count
% Value change
Value (US$m)
1 3 Goldman Sachs & Co 38,233 18 92.0% 19,908
2 2 Citi 35,086 13 75.8% 19,955
3 4 JPMorgan 32,056 12 105.3% 15,612
4 1 Morgan Stanley 29,941 14 46.6% 20,429
5 6 Bank of America Merrill Lynch 22,126 9 81.1% 12,218
6 - Canson Capital Partners 17,000 1 - -
7 233 The Valence Group 12,535 1 - -
8 - PJT Partners 10,601 4 - -
9 23 Deutsche Bank 9,665 8 391.4% 1,967
10 197 Societe Generale 8,255 4 - -
Ranking Q1 2018 Q1 2017
Q1 2018
Q1 2017
Company name Value (US$m)
Deal count
% Value change
Value (US$m)
1 2 Goldman Sachs & Co 34,486 12 228.2% 10,507
2 3 JPMorgan 30,383 11 222.6% 9,419
3 1 Morgan Stanley 27,621 9 129.6% 12,029
4 8 Citi 25,465 6 492.2% 4,300
5 6 Bank of America Merrill Lynch 22,126 8 211.1% 7,113
6 - Canson Capital Partners 17,000 1 - -
7 - Centerview Partners 7,935 2 - -
8 30 Houlihan Lokey 7,698 14 1618.3% 448
9 4 Barclays 5,679 10 -36.9% 8,998
10 17 Deutsche Bank 4,903 4 194.5% 1,665
Ranking Q1 2018 Q1 2017
Q1 2018
Q1 2017
Company name Value (US$m)
Deal count
Count change
Deal count
1 26 Lincoln International 731 21 13 8
2 3 Goldman Sachs & Co 38,233 18 0 18
3 9 Houlihan Lokey 7,698 15 0 15
4 5 Morgan Stanley 29,941 14 -3 17
5 1 Rothschild 3,074 14 -12 26
6 22 Citi 35,086 13 5 8
7 2 Deloitte 3,378 13 -8 21
8 15 GCA Corporation 125 13 3 10
9 6 JPMorgan 32,056 12 -5 17
10 16 Barclays 5,762 12 3 9
Ranking Q1 2018 Q1 2017
Q1 2018
Q1 2017
Company name Value (US$m)
Deal count
Count change
Deal count
1 1 Houlihan Lokey 7,698 14 1 13
2 21 Lincoln International 625 14 10 4
3 6 Goldman Sachs & Co 34,486 12 3 9
4 3 JPMorgan 30,383 11 0 11
5 10 Barclays 5,679 10 4 6
6 15 Robert W. Baird & Co 2,076 10 5 5
7 5 Morgan Stanley 27,621 9 0 9
8 9 Harris Williams & Co 750 9 1 8
9 2 William Blair & Company 357 9 -3 12
10 18 Bank of America Merrill Lynch 22,126 8 4 4
Mergermarket 68
mergermarket.com
Global & Regional M&A Report Q1 2018
League Tables
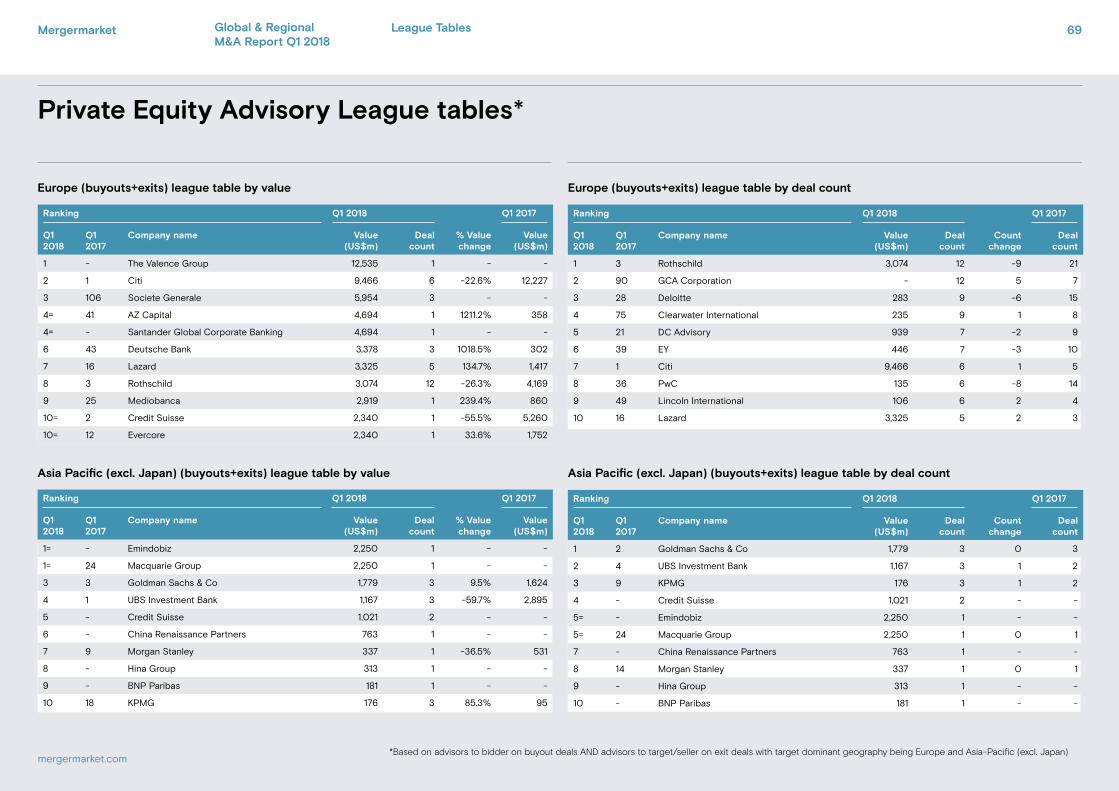
Private Equity Advisory League tables*
Europe (buyouts+exits) league table by value Europe (buyouts+exits) league table by deal count
Asia Pacific (excl. Japan) (buyouts+exits) league table by value Asia Pacific (excl. Japan) (buyouts+exits) league table by deal count
*Based on advisors to bidder on buyout deals AND advisors to target/seller on exit deals with target dominant geography being Europe and Asia-Pacific (excl. Japan)
Ranking Q1 2018 Q1 2017
Q1 2018
Q1 2017
Company name Value (US$m)
Deal count
% Value change
Value (US$m)
1 - The Valence Group 12,535 1 - -
2 1 Citi 9,466 6 -22.6% 12,227
3 106 Societe Generale 5,954 3 - -
4= 41 AZ Capital 4,694 1 1211.2% 358
4= - Santander Global Corporate Banking 4,694 1 - -
6 43 Deutsche Bank 3,378 3 1018.5% 302
7 16 Lazard 3,325 5 134.7% 1,417
8 3 Rothschild 3,074 12 -26.3% 4,169
9 25 Mediobanca 2,919 1 239.4% 860
10= 2 Credit Suisse 2,340 1 -55.5% 5,260
10= 12 Evercore 2,340 1 33.6% 1,752
Ranking Q1 2018 Q1 2017
Q1 2018
Q1 2017
Company name Value (US$m)
Deal count
% Value change
Value (US$m)
1= - Emindobiz 2,250 1 - -
1= 24 Macquarie Group 2,250 1 - -
3 3 Goldman Sachs & Co 1,779 3 9.5% 1,624
4 1 UBS Investment Bank 1,167 3 -59.7% 2,895
5 - Credit Suisse 1,021 2 - -
6 - China Renaissance Partners 763 1 - -
7 9 Morgan Stanley 337 1 -36.5% 531
8 - Hina Group 313 1 - -
9 - BNP Paribas 181 1 - -
10 18 KPMG 176 3 85.3% 95
Ranking Q1 2018 Q1 2017
Q1 2018
Q1 2017
Company name Value (US$m)
Deal count
Count change
Deal count
1 3 Rothschild 3,074 12 -9 21
2 90 GCA Corporation - 12 5 7
3 28 Deloitte 283 9 -6 15
4 75 Clearwater International 235 9 1 8
5 21 DC Advisory 939 7 -2 9
6 39 EY 446 7 -3 10
7 1 Citi 9,466 6 1 5
8 36 PwC 135 6 -8 14
9 49 Lincoln International 106 6 2 4
10 16 Lazard 3,325 5 2 3
Ranking Q1 2018 Q1 2017
Q1 2018
Q1 2017
Company name Value (US$m)
Deal count
Count change
Deal count
1 2 Goldman Sachs & Co 1,779 3 0 3
2 4 UBS Investment Bank 1,167 3 1 2
3 9 KPMG 176 3 1 2
4 - Credit Suisse 1,021 2 - -
5= - Emindobiz 2,250 1 - -
5= 24 Macquarie Group 2,250 1 0 1
7 - China Renaissance Partners 763 1 - -
8 14 Morgan Stanley 337 1 0 1
9 - Hina Group 313 1 - -
10 - BNP Paribas 181 1 - -
Mergermarket 69
mergermarket.com
Global & Regional M&A Report Q1 2018
League Tables
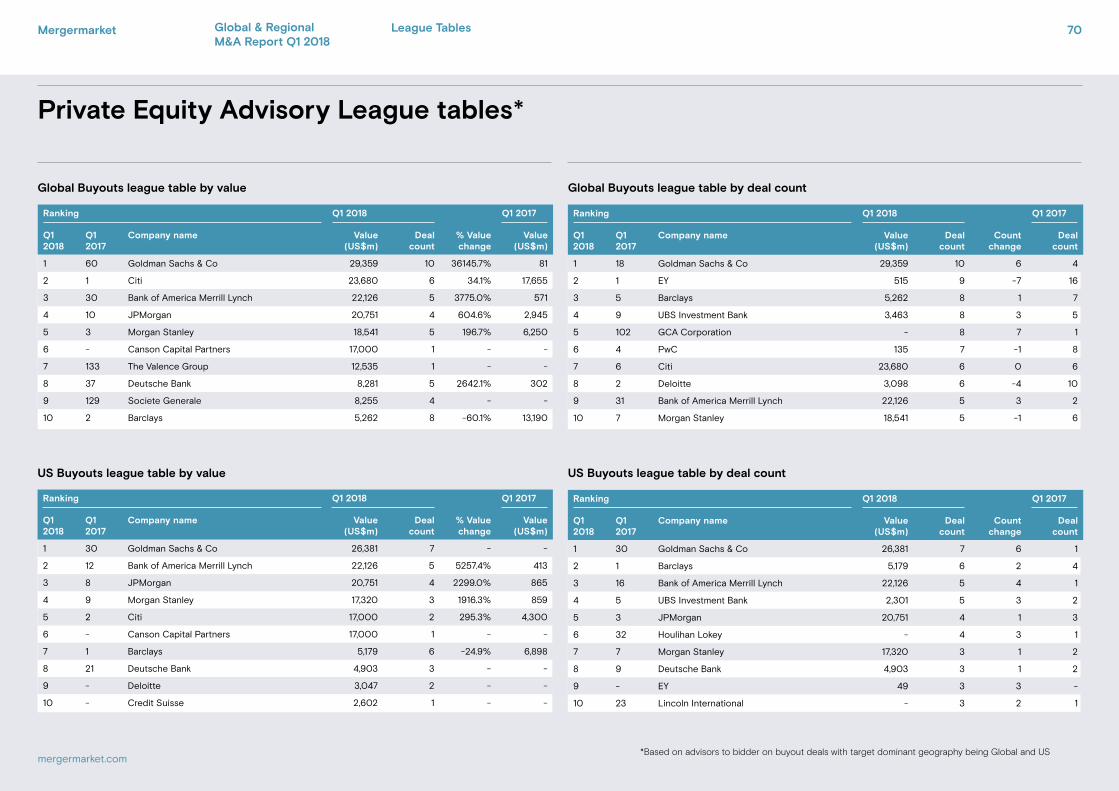
Private Equity Advisory League tables*
Global Buyouts league table by value Global Buyouts league table by deal count
US Buyouts league table by value US Buyouts league table by deal count
*Based on advisors to bidder on buyout deals with target dominant geography being Global and US
Ranking Q1 2018 Q1 2017
Q1 2018
Q1 2017
Company name Value (US$m)
Deal count
% Value change
Value (US$m)
1 60 Goldman Sachs & Co 29,359 10 36145.7% 81
2 1 Citi 23,680 6 34.1% 17,655
3 30 Bank of America Merrill Lynch 22,126 5 3775.0% 571
4 10 JPMorgan 20,751 4 604.6% 2,945
5 3 Morgan Stanley 18,541 5 196.7% 6,250
6 - Canson Capital Partners 17,000 1 - -
7 133 The Valence Group 12,535 1 - -
8 37 Deutsche Bank 8,281 5 2642.1% 302
9 129 Societe Generale 8,255 4 - -
10 2 Barclays 5,262 8 -60.1% 13,190
Ranking Q1 2018 Q1 2017
Q1 2018
Q1 2017
Company name Value (US$m)
Deal count
% Value change
Value (US$m)
1 30 Goldman Sachs & Co 26,381 7 - -
2 12 Bank of America Merrill Lynch 22,126 5 5257.4% 413
3 8 JPMorgan 20,751 4 2299.0% 865
4 9 Morgan Stanley 17,320 3 1916.3% 859
5 2 Citi 17,000 2 295.3% 4,300
6 - Canson Capital Partners 17,000 1 - -
7 1 Barclays 5,179 6 -24.9% 6,898
8 21 Deutsche Bank 4,903 3 - -
9 - Deloitte 3,047 2 - -
10 - Credit Suisse 2,602 1 - -
Ranking Q1 2018 Q1 2017
Q1 2018
Q1 2017
Company name Value (US$m)
Deal count
Count change
Deal count
1 18 Goldman Sachs & Co 29,359 10 6 4
2 1 EY 515 9 -7 16
3 5 Barclays 5,262 8 1 7
4 9 UBS Investment Bank 3,463 8 3 5
5 102 GCA Corporation - 8 7 1
6 4 PwC 135 7 -1 8
7 6 Citi 23,680 6 0 6
8 2 Deloitte 3,098 6 -4 10
9 31 Bank of America Merrill Lynch 22,126 5 3 2
10 7 Morgan Stanley 18,541 5 -1 6
Ranking Q1 2018 Q1 2017
Q1 2018
Q1 2017
Company name Value (US$m)
Deal count
Count change
Deal count
1 30 Goldman Sachs & Co 26,381 7 6 1
2 1 Barclays 5,179 6 2 4
3 16 Bank of America Merrill Lynch 22,126 5 4 1
4 5 UBS Investment Bank 2,301 5 3 2
5 3 JPMorgan 20,751 4 1 3
6 32 Houlihan Lokey - 4 3 1
7 7 Morgan Stanley 17,320 3 1 2
8 9 Deutsche Bank 4,903 3 1 2
9 - EY 49 3 3 -
10 23 Lincoln International - 3 2 1
Mergermarket 70
mergermarket.com
Global & Regional M&A Report Q1 2018
League Tables
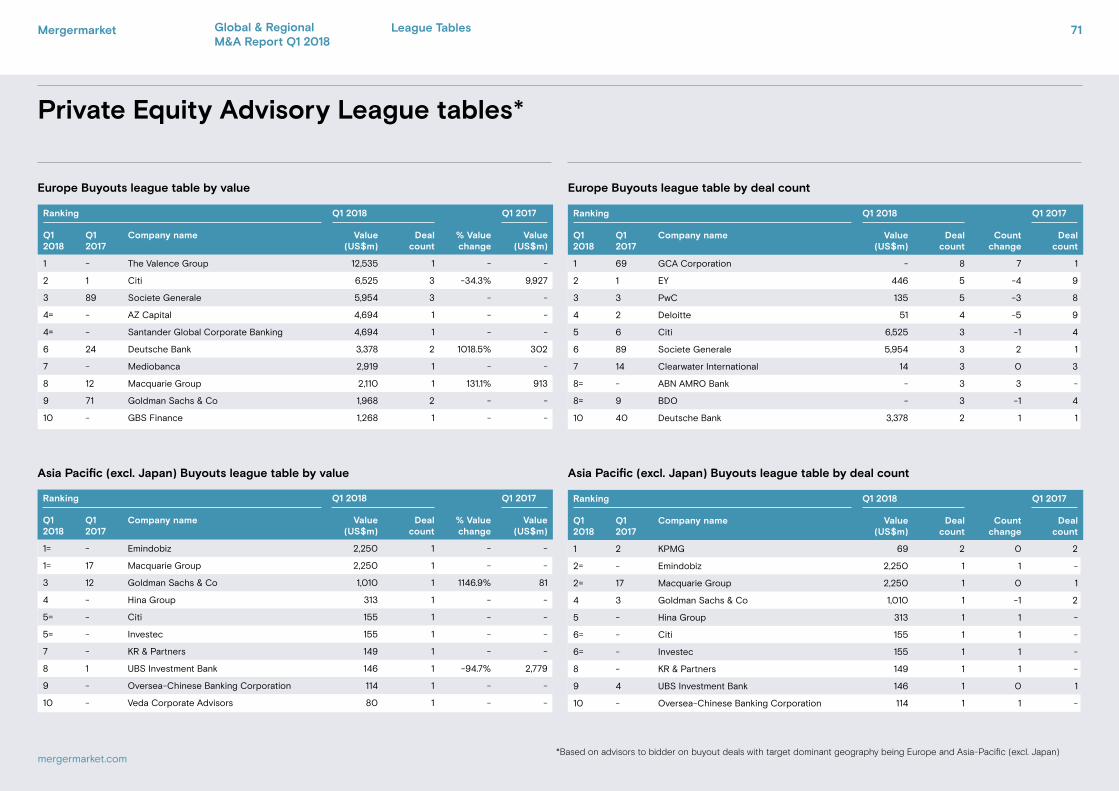
Private Equity Advisory League tables*
Europe Buyouts league table by value Europe Buyouts league table by deal count
Asia Pacific (excl. Japan) Buyouts league table by value Asia Pacific (excl. Japan) Buyouts league table by deal count
*Based on advisors to bidder on buyout deals with target dominant geography being Europe and Asia-Pacific (excl. Japan)
Ranking Q1 2018 Q1 2017
Q1 2018
Q1 2017
Company name Value (US$m)
Deal count
% Value change
Value (US$m)
1 - The Valence Group 12,535 1 - -
2 1 Citi 6,525 3 -34.3% 9,927
3 89 Societe Generale 5,954 3 - -
4= - AZ Capital 4,694 1 - -
4= - Santander Global Corporate Banking 4,694 1 - -
6 24 Deutsche Bank 3,378 2 1018.5% 302
7 - Mediobanca 2,919 1 - -
8 12 Macquarie Group 2,110 1 131.1% 913
9 71 Goldman Sachs & Co 1,968 2 - -
10 - GBS Finance 1,268 1 - -
Ranking Q1 2018 Q1 2017
Q1 2018
Q1 2017
Company name Value (US$m)
Deal count
% Value change
Value (US$m)
1= - Emindobiz 2,250 1 - -
1= 17 Macquarie Group 2,250 1 - -
3 12 Goldman Sachs & Co 1,010 1 1146.9% 81
4 - Hina Group 313 1 - -
5= - Citi 155 1 - -
5= - Investec 155 1 - -
7 - KR & Partners 149 1 - -
8 1 UBS Investment Bank 146 1 -94.7% 2,779
9 - Oversea-Chinese Banking Corporation 114 1 - -
10 - Veda Corporate Advisors 80 1 - -
Ranking Q1 2018 Q1 2017
Q1 2018
Q1 2017
Company name Value (US$m)
Deal count
Count change
Deal count
1 69 GCA Corporation - 8 7 1
2 1 EY 446 5 -4 9
3 3 PwC 135 5 -3 8
4 2 Deloitte 51 4 -5 9
5 6 Citi 6,525 3 -1 4
6 89 Societe Generale 5,954 3 2 1
7 14 Clearwater International 14 3 0 3
8= - ABN AMRO Bank - 3 3 -
8= 9 BDO - 3 -1 4
10 40 Deutsche Bank 3,378 2 1 1
Ranking Q1 2018 Q1 2017
Q1 2018
Q1 2017
Company name Value (US$m)
Deal count
Count change
Deal count
1 2 KPMG 69 2 0 2
2= - Emindobiz 2,250 1 1 -
2= 17 Macquarie Group 2,250 1 0 1
4 3 Goldman Sachs & Co 1,010 1 -1 2
5 - Hina Group 313 1 1 -
6= - Citi 155 1 1 -
6= - Investec 155 1 1 -
8 - KR & Partners 149 1 1 -
9 4 UBS Investment Bank 146 1 0 1
10 - Oversea-Chinese Banking Corporation 114 1 1 -
Mergermarket 71
mergermarket.com
Global & Regional M&A Report Q1 2018
League Tables
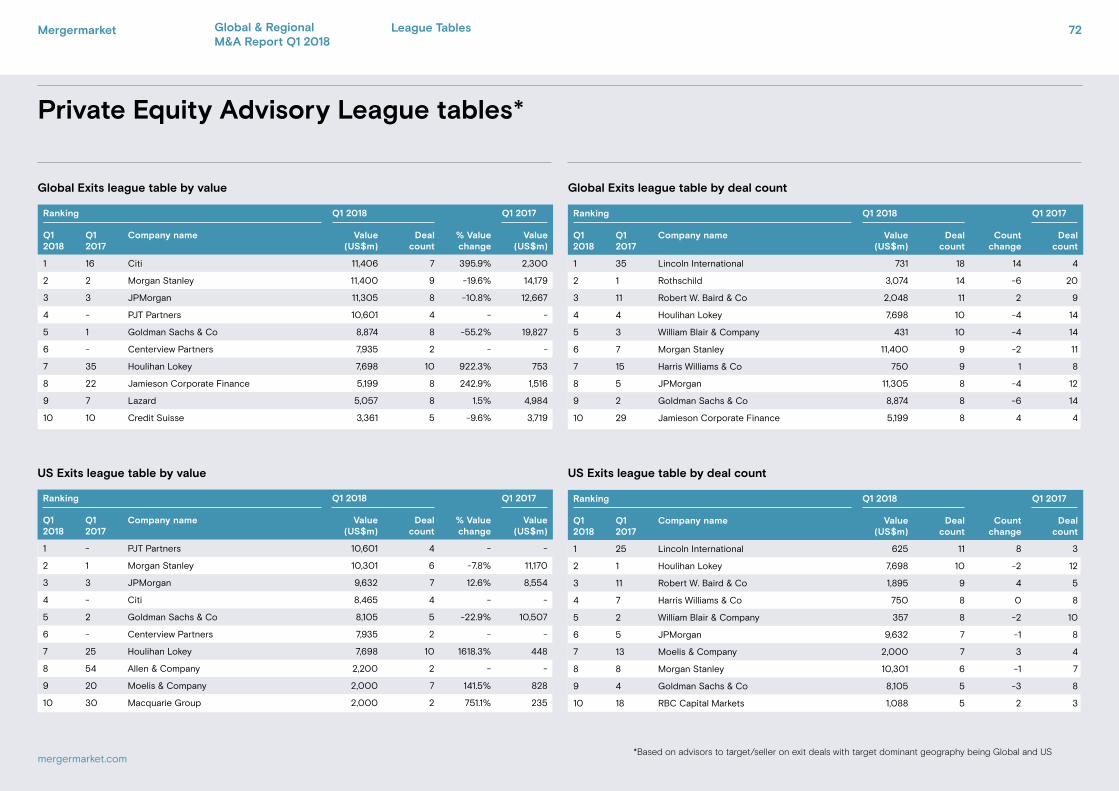
Private Equity Advisory League tables*
Global Exits league table by value Global Exits league table by deal count
US Exits league table by value US Exits league table by deal count
*Based on advisors to target/seller on exit deals with target dominant geography being Global and US
Ranking Q1 2018 Q1 2017
Q1 2018
Q1 2017
Company name Value (US$m)
Deal count
% Value change
Value (US$m)
1 16 Citi 11,406 7 395.9% 2,300
2 2 Morgan Stanley 11,400 9 -19.6% 14,179
3 3 JPMorgan 11,305 8 -10.8% 12,667
4 - PJT Partners 10,601 4 - -
5 1 Goldman Sachs & Co 8,874 8 -55.2% 19,827
6 - Centerview Partners 7,935 2 - -
7 35 Houlihan Lokey 7,698 10 922.3% 753
8 22 Jamieson Corporate Finance 5,199 8 242.9% 1,516
9 7 Lazard 5,057 8 1.5% 4,984
10 10 Credit Suisse 3,361 5 -9.6% 3,719
Ranking Q1 2018 Q1 2017
Q1 2018
Q1 2017
Company name Value (US$m)
Deal count
% Value change
Value (US$m)
1 - PJT Partners 10,601 4 - -
2 1 Morgan Stanley 10,301 6 -7.8% 11,170
3 3 JPMorgan 9,632 7 12.6% 8,554
4 - Citi 8,465 4 - -
5 2 Goldman Sachs & Co 8,105 5 -22.9% 10,507
6 - Centerview Partners 7,935 2 - -
7 25 Houlihan Lokey 7,698 10 1618.3% 448
8 54 Allen & Company 2,200 2 - -
9 20 Moelis & Company 2,000 7 141.5% 828
10 30 Macquarie Group 2,000 2 751.1% 235
Ranking Q1 2018 Q1 2017
Q1 2018
Q1 2017
Company name Value (US$m)
Deal count
Count change
Deal count
1 35 Lincoln International 731 18 14 4
2 1 Rothschild 3,074 14 -6 20
3 11 Robert W. Baird & Co 2,048 11 2 9
4 4 Houlihan Lokey 7,698 10 -4 14
5 3 William Blair & Company 431 10 -4 14
6 7 Morgan Stanley 11,400 9 -2 11
7 15 Harris Williams & Co 750 9 1 8
8 5 JPMorgan 11,305 8 -4 12
9 2 Goldman Sachs & Co 8,874 8 -6 14
10 29 Jamieson Corporate Finance 5,199 8 4 4
Ranking Q1 2018 Q1 2017
Q1 2018
Q1 2017
Company name Value (US$m)
Deal count
Count change
Deal count
1 25 Lincoln International 625 11 8 3
2 1 Houlihan Lokey 7,698 10 -2 12
3 11 Robert W. Baird & Co 1,895 9 4 5
4 7 Harris Williams & Co 750 8 0 8
5 2 William Blair & Company 357 8 -2 10
6 5 JPMorgan 9,632 7 -1 8
7 13 Moelis & Company 2,000 7 3 4
8 8 Morgan Stanley 10,301 6 -1 7
9 4 Goldman Sachs & Co 8,105 5 -3 8
10 18 RBC Capital Markets 1,088 5 2 3
Mergermarket 72
mergermarket.com
Global & Regional M&A Report Q1 2018
League Tables
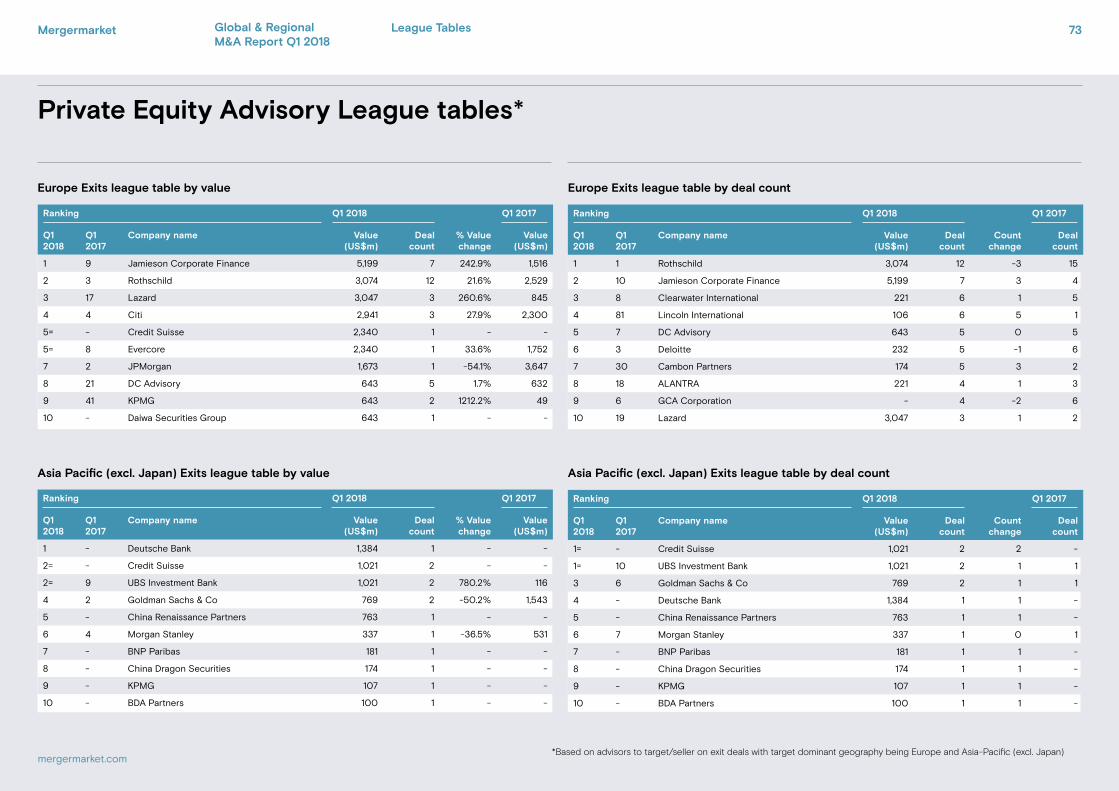
Private Equity Advisory League tables*
Europe Exits league table by value Europe Exits league table by deal count
Asia Pacific (excl. Japan) Exits league table by value Asia Pacific (excl. Japan) Exits league table by deal count
*Based on advisors to target/seller on exit deals with target dominant geography being Europe and Asia-Pacific (excl. Japan)
Ranking Q1 2018 Q1 2017
Q1 2018
Q1 2017
Company name Value (US$m)
Deal count
% Value change
Value (US$m)
1 9 Jamieson Corporate Finance 5,199 7 242.9% 1,516
2 3 Rothschild 3,074 12 21.6% 2,529
3 17 Lazard 3,047 3 260.6% 845
4 4 Citi 2,941 3 27.9% 2,300
5= - Credit Suisse 2,340 1 - -
5= 8 Evercore 2,340 1 33.6% 1,752
7 2 JPMorgan 1,673 1 -54.1% 3,647
8 21 DC Advisory 643 5 1.7% 632
9 41 KPMG 643 2 1212.2% 49
10 - Daiwa Securities Group 643 1 - -
Ranking Q1 2018 Q1 2017
Q1 2018
Q1 2017
Company name Value (US$m)
Deal count
% Value change
Value (US$m)
1 - Deutsche Bank 1,384 1 - -
2= - Credit Suisse 1,021 2 - -
2= 9 UBS Investment Bank 1,021 2 780.2% 116
4 2 Goldman Sachs & Co 769 2 -50.2% 1,543
5 - China Renaissance Partners 763 1 - -
6 4 Morgan Stanley 337 1 -36.5% 531
7 - BNP Paribas 181 1 - -
8 - China Dragon Securities 174 1 - -
9 - KPMG 107 1 - -
10 - BDA Partners 100 1 - -
Ranking Q1 2018 Q1 2017
Q1 2018
Q1 2017
Company name Value (US$m)
Deal count
Count change
Deal count
1 1 Rothschild 3,074 12 -3 15
2 10 Jamieson Corporate Finance 5,199 7 3 4
3 8 Clearwater International 221 6 1 5
4 81 Lincoln International 106 6 5 1
5 7 DC Advisory 643 5 0 5
6 3 Deloitte 232 5 -1 6
7 30 Cambon Partners 174 5 3 2
8 18 ALANTRA 221 4 1 3
9 6 GCA Corporation - 4 -2 6
10 19 Lazard 3,047 3 1 2
Ranking Q1 2018 Q1 2017
Q1 2018
Q1 2017
Company name Value (US$m)
Deal count
Count change
Deal count
1= - Credit Suisse 1,021 2 2 -
1= 10 UBS Investment Bank 1,021 2 1 1
3 6 Goldman Sachs & Co 769 2 1 1
4 - Deutsche Bank 1,384 1 1 -
5 - China Renaissance Partners 763 1 1 -
6 7 Morgan Stanley 337 1 0 1
7 - BNP Paribas 181 1 1 -
8 - China Dragon Securities 174 1 1 -
9 - KPMG 107 1 1 -
10 - BDA Partners 100 1 1 -
Mergermarket 73
mergermarket.com
Global & Regional M&A Report Q1 2018
League Tables
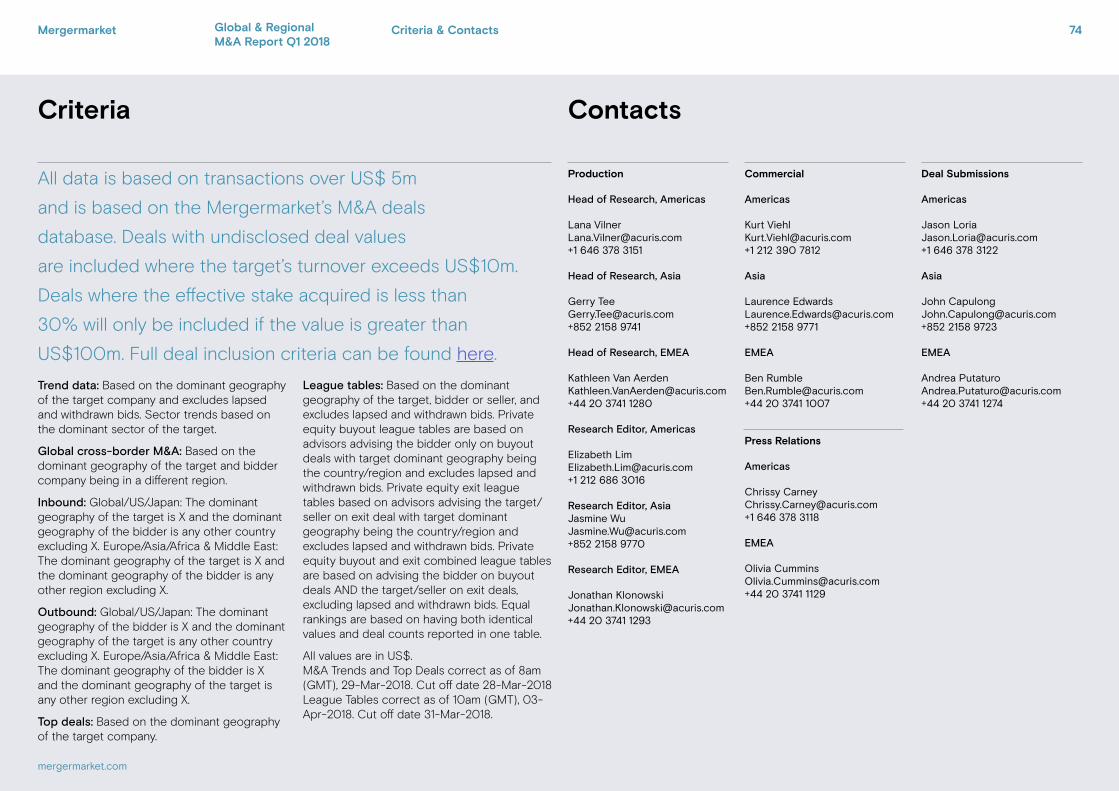
Mergermarket 74Criteria & ContactsGlobal & Regional M&A Report Q1 2018
Criteria Contacts
mergermarket.com
All data is based on transactions over US$ 5m
and is based on the Mergermarket’s M&A deals
database. Deals with undisclosed deal values
are included where the target’s turnover exceeds US$10m.
Deals where the effective stake acquired is less than
30% will only be included if the value is greater than
US$100m. Full deal inclusion criteria can be found here.
Trend data: Based on the dominant geography of the target company and excludes lapsed and withdrawn bids. Sector trends based on the dominant sector of the target.
Global cross-border M&A: Based on the dominant geography of the target and bidder company being in a different region.
Inbound: Global/US/Japan: The dominant geography of the target is X and the dominant geography of the bidder is any other country excluding X. Europe/Asia/Africa & Middle East: The dominant geography of the target is X and the dominant geography of the bidder is any other region excluding X.
Outbound: Global/US/Japan: The dominant geography of the bidder is X and the dominant geography of the target is any other country excluding X. Europe/Asia/Africa & Middle East: The dominant geography of the bidder is X and the dominant geography of the target is any other region excluding X.
Top deals: Based on the dominant geography of the target company.
League tables: Based on the dominant geography of the target, bidder or seller, and excludes lapsed and withdrawn bids. Private equity buyout league tables are based on advisors advising the bidder only on buyout deals with target dominant geography being the country/region and excludes lapsed and withdrawn bids. Private equity exit league tables based on advisors advising the target/seller on exit deal with target dominant geography being the country/region and excludes lapsed and withdrawn bids. Private equity buyout and exit combined league tables are based on advising the bidder on buyout deals AND the target/seller on exit deals, excluding lapsed and withdrawn bids. Equal rankings are based on having both identical values and deal counts reported in one table.
All values are in US$. M&A Trends and Top Deals correct as of 8am (GMT), 29-Mar-2018. Cut off date 28-Mar-2018 League Tables correct as of 10am (GMT), 03-Apr-2018. Cut off date 31-Mar-2018.
Deal Submissions
Americas Jason [email protected]+1 646 378 3122
Asia John [email protected]+852 2158 9723
EMEA Andrea [email protected]+44 20 3741 1274
Commercial
Americas Kurt [email protected]+1 212 390 7812
Asia Laurence [email protected]+852 2158 9771
EMEA Ben [email protected]+44 20 3741 1007
Production
Head of Research, Americas Lana [email protected]+1 646 378 3151
Head of Research, Asia Gerry [email protected]+852 2158 9741
Head of Research, EMEA Kathleen Van [email protected]+44 20 3741 1280
Research Editor, Americas Elizabeth [email protected]+1 212 686 3016
Research Editor, AsiaJasmine [email protected]+852 2158 9770
Research Editor, EMEA Jonathan [email protected]+44 20 3741 1293
Press Relations
Americas Chrissy [email protected]+1 646 378 3118
EMEA Olivia [email protected]+44 20 3741 1129
In M&A, information is the most valuable currency. Mergermarket reports on deals 6-24 months before they become public knowledge, giving our subscribers a powerful competitive advantage. With the largest network of dedicated M&A journalists and analysts, Mergermarket offers the most comprehensive M&A intelligence service available today. Our reporters are based in 67 locations across the Americas, Europe, Asia-Pacific, the Middle East and Africa.
Mergermarket is an Acuris company
EMEA10 Queen Street Place
London
EC4R 1BE
United Kingdom
+44 203 741 1000
Americas330 Hudson St.
4th Floor
New York, NY 10013
USA
+1 212 500 7537
Asia16/F, Grand Millennium Plaza
181 Queen’s Road Central
Hong Kong
+ 852 2158 9790
Mergermarket 75
mergermarket.commergermarket.com
Global & Regional M&A Report Q1 2018