global topography. continental & oceanic lithosphere
TRANSCRIPT

GLOBAL TOPOGRAPHY

CONTINENTAL & OCEANIC LITHOSPHERE
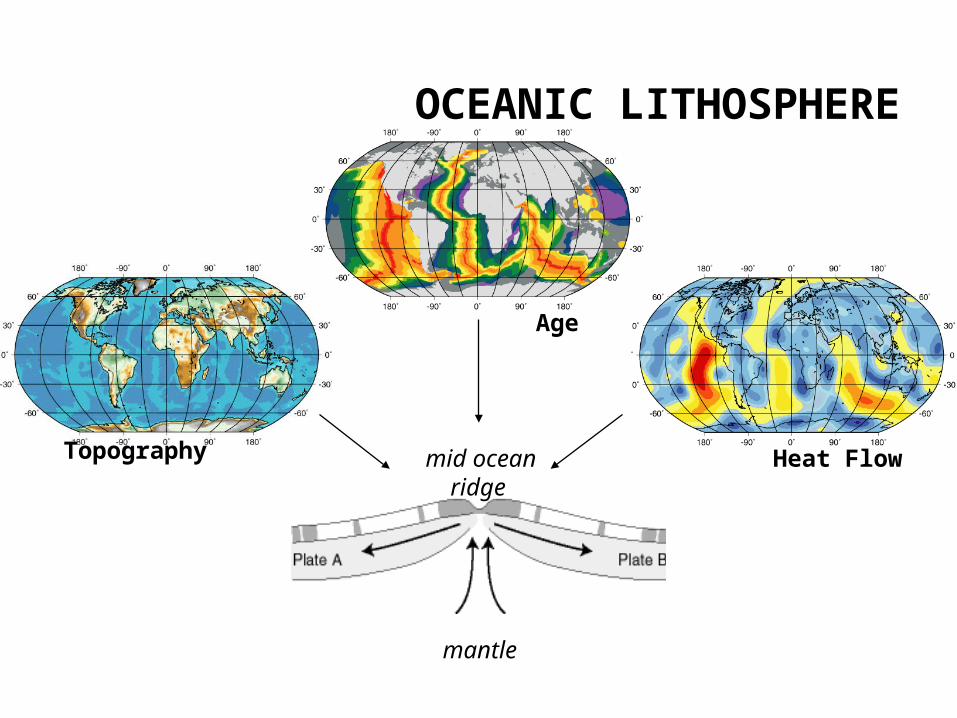
Age
Topography Heat Flowmid ocean ridge
mantle
CONTINENTAL & OCEANIC LITHOSPHERE

tectothermal age of plate (ta)
mantle heat loss (q )mantle flow
t
MOR
thermal Thermal boundary layer of mantle convection
t
T Ts o
t=0
t=0
_
+
z
T Ts o
time
z
Region of T gradient is a Thermal Boundary Layer

m
mantle heat loss (q )mantle flow
MOR
thermal Thermal boundary layer of mantle convection
t
mechanical : Layer of long term strengthm
c
chemical/mechanical : Dehydrated Layer (dry=hi viscsoity)m
(cold=hi viscosity)
t
tectothermal age of plate (ta)

Oceanic Thermal Lithosphere defines convection pattern - it is the cold, overturning boundary layer. Continental Chemical Lithosphere does not
participate in convective mantle overturn (inherently buoyant).
Continent
Oceanic Chemical Lithosphere subducts - overturning portions of the Earth see a constant temperature boundary condition.
Provides a more complex thermal coupling condition for covecting mantle below.

““subducting” lithospheresubducting” lithosphere viscosity = 10 Pa sviscosity = 10 Pa s 2525
warm mantleviscosity = 10 Pa s warm mantleviscosity = 10 Pa s2121
hothothothotcoldcoldcoldcoldconvecting mantle
failed region failed region extensionextensionfailed region failed region extensionextension
failed region failed region compressioncompression failed region failed region compressioncompression
cratonic rootlower crustupper crust
bulk mantle
local local geothermgeotherm
Cooper et al. 2004

Cooper et al. 2004
cChemical/Mechanical Lithosphere
tThermal Lithosphere
Dynamic Mantle Sub-Layer

ct
mantle heat flow
surface heat flowUpper CrustLower Crust
Chemical Lithosphere
Average Thermal Lithosphere
Temperature (Celsius)0 200 400 600 800 1000 1200 1400
Dep
th (
km
) 0
50
100
150
200
250
300

Th
erm
al/
Ch
em
ical B
L T
hic
kn
ess R
ati
o 4.5
4
3
3.5
2
2.5
1
1.5
Chemical Boundary Layer Thickness (km)
40 60 80 100 120 140 160 180 200
Tem
pera
ture
Dro
p A
cro
ss S
ub
-Layer (C
) 700
600
500
400
300
200
100
Radiogenically Depleted Root
Radiogenically Enriched Root

QuickTime™ and a decompressor
are needed to see this picture.
Yuan & Romanowicz 2010
Therm
Chem
Chemical Lithosphere (km)Latitude
dept
h (k
m)
50 100 150 200
4
3
2
400 Therm
al/C
hem
ical R
ati
o
300
200
100
0
65 35
55 4560 50 40
Preserving & Destroying Cratonic Lithosphere
The Structure of

Preserving & Destroying Cratonic Lithosphere
CRATON STABILITYCRATON INSTABILITY
UNDERSTAND STABILITY TO UNDERSTAND INSTABILITY

MODELING CRATON STABILITY
chemically light chemically light material - root material - root (own rheology)(own rheology)
chemically real light material - crust (has own rheology)chemically real light material - crust (has own rheology)
cold cold hothotmantlemantle
base of thermal lithospherebase of thermal lithospherecontinental lithosphere is cool & more viscous than bulk mantle
failed regionsfailed regions
cold cold viscosity 10 Pa s viscosity 10 Pa s
2626hot hot viscosity 10 Pa sviscosity 10 Pa s2121

Send Continent into Model Subduction Zone See What it Takes to Save Root & Keep Crust Stable
MODELING CRATON STABILITYMODELING CRATON STABILITY
300+ Simulations Later …
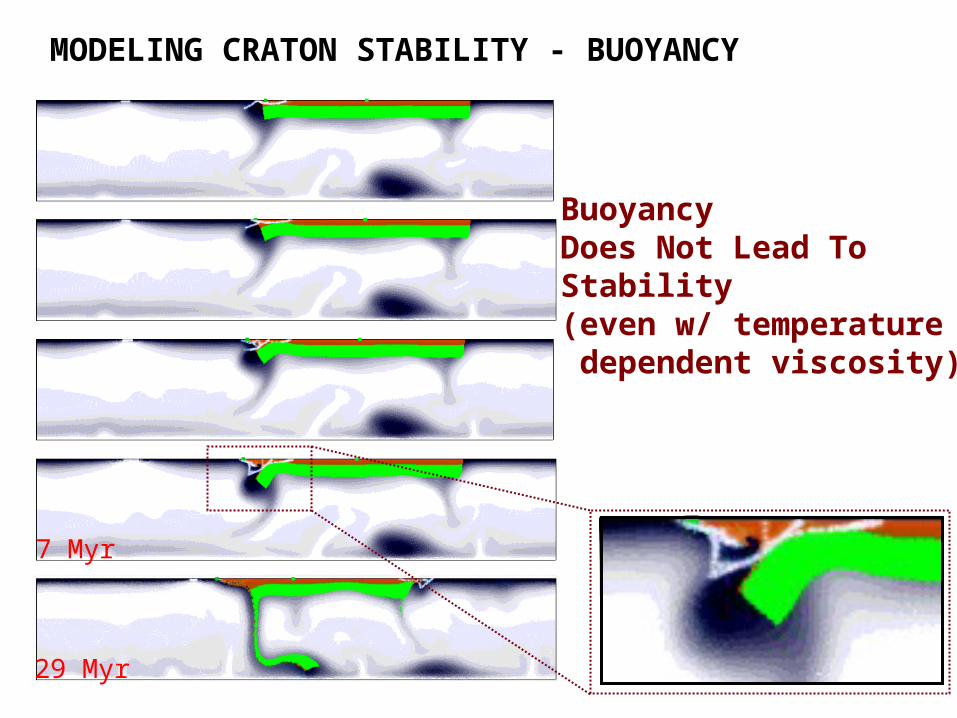
7 Myr
MODELING CRATON STABILITY - BUOYANCY
29 Myr
Buoyancy Does Not Lead To Stability(even w/ temperature dependent viscosity)
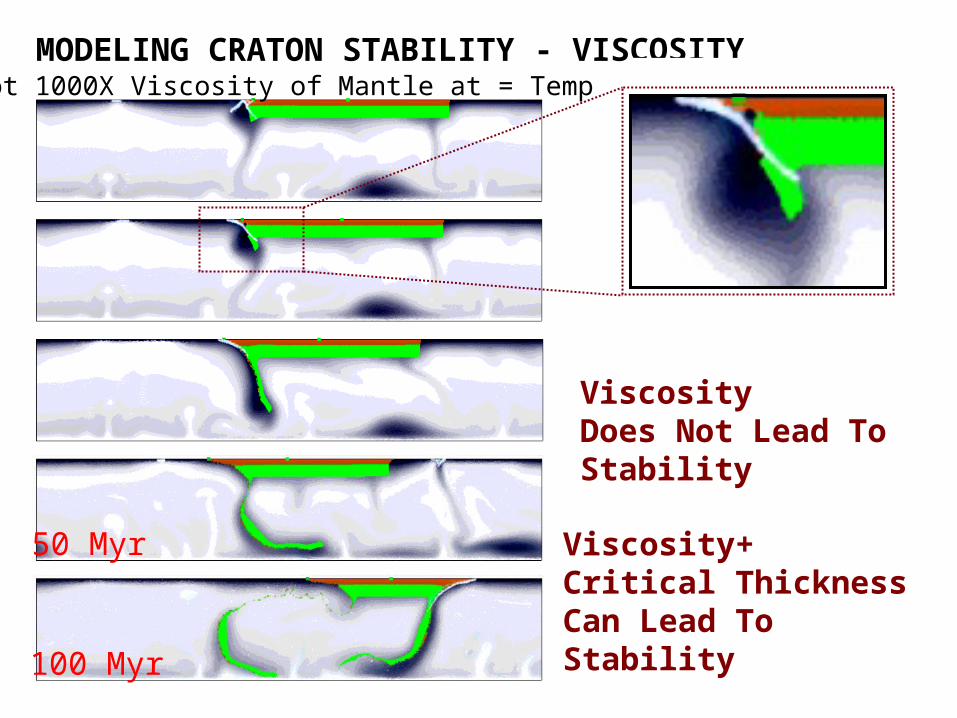
MODELING CRATON STABILITY - VISCOSITY
Viscosity Does Not Lead To Stability
Viscosity+Critical Thickness Can Lead To Stability
50 Myr
100 Myr
Root 1000X Viscosity of Mantle at = Temp

MODELING CRATON STABILITY - VISCOSITY
Nor
mal
ized
Roo
t Ext
ent
Root Thickness (km)
50 Myr100 Myr150 Myr
0.2
0.4
0.6
0.8
1.0
120 140 160 180 200 250
Root/Mantle Viscosity Ratio = 1000
Extreme De-Hydration
Lower Ratio (>100) Can Not Prevent Viscous Root Deformation

MODELING CRATON STABILITY - VISCOSITY
Viscosity Does Not Lead To Stability
Viscosity+High Craton Yield StressCan Lead To Stability
50 Myr
100 Myr
Root 1000X Viscosity of Mantle at = Temp

MODELING CRATON STABILITY - YIELD STRESS
0.2
0.4
0.6
0.8
1.0
0.1 0.15 0.2 0.25 0.3 0.35 0.4
Root & Crust; 50myrRoot & Crust; 100myrRoot Only; 50MyrRoot Only; 100Myr
Normalized Root Extent
Continent/Mantle Yield Ratio1.0 1.5 2.0 2.5 3.0 3.5 4.0
Craton Does Not Fail Under Stress Due to High Yield Strength
Buffer Cratons from High Stress and They Will Not Yield

Auto makers consider it impractical to make drivers heads stronger so ……...
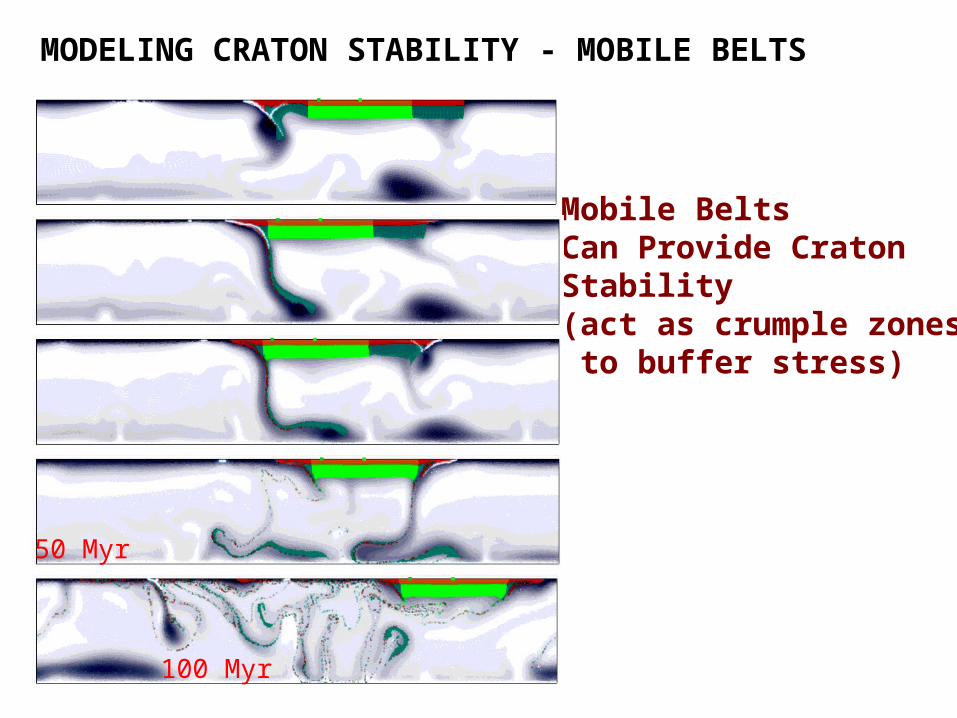
MODELING CRATON STABILITY - MOBILE BELTS
Mobile Belts Can Provide Craton Stability(act as crumple zones to buffer stress)
50 Myr
100 Myr

Die
tz [1
963]
if subduction starts offshore, forms island arc, then migrates on shore - craton will be buffered
REGENERATING MOBILE BELTS (Crumple Zones)
if subduction starts at time B - craton will be stressed

mobile belt (deep green) yield stress relative to craton (pale green) yield = 0.5
crumple zone model
yield ratio = 1.0no crumple zone
craton
craton
yield ratio = 0.5

STABILITYSTABILITYININ Dry Viscosity/ThicknessDry Viscosity/Thickness
High Yield StressHigh Yield Stress
Mobile Belt Stress Buffers Mobile Belt Stress Buffers
Rehydrate/Thin from BelowRehydrate/Thin from Below
RehydrateRehydrate
Lack of BufferLack of Buffer

crustcrust
cratonic rootcratonic root
removed cratonic root
removed cratonic root
Precambrian Palaeozoic Mesozoic Cenozoic Silurian volcanism
Basin development/volcanism Volcanism and extension barren kimberlite
diamondkimberlite
Asthenosphere (1300 C)
Asthenosphere (1300 C)
Asthenosphere (1300 C)
Asthenosphere (1300 C)
Archean crust (3800 Ma)
S-K C
Loss of > 120 km of Archaean lithosphere, Sino-Korean craton

S-K CLow Angle Subduction Would Allow Low Angle Subduction Would Allow For Rehydration WeakeningFor Rehydration Weakening
Why Geologically RecentWhy Geologically RecentInstability ? WeakeningInstability ? WeakeningElements in Place in PastElements in Place in Past

STABILITYSTABILITYININ
Increasing Mantle StressIncreasing Mantle Stress

Subducting Slab Failure Zone
Horizontal Surface Velocity
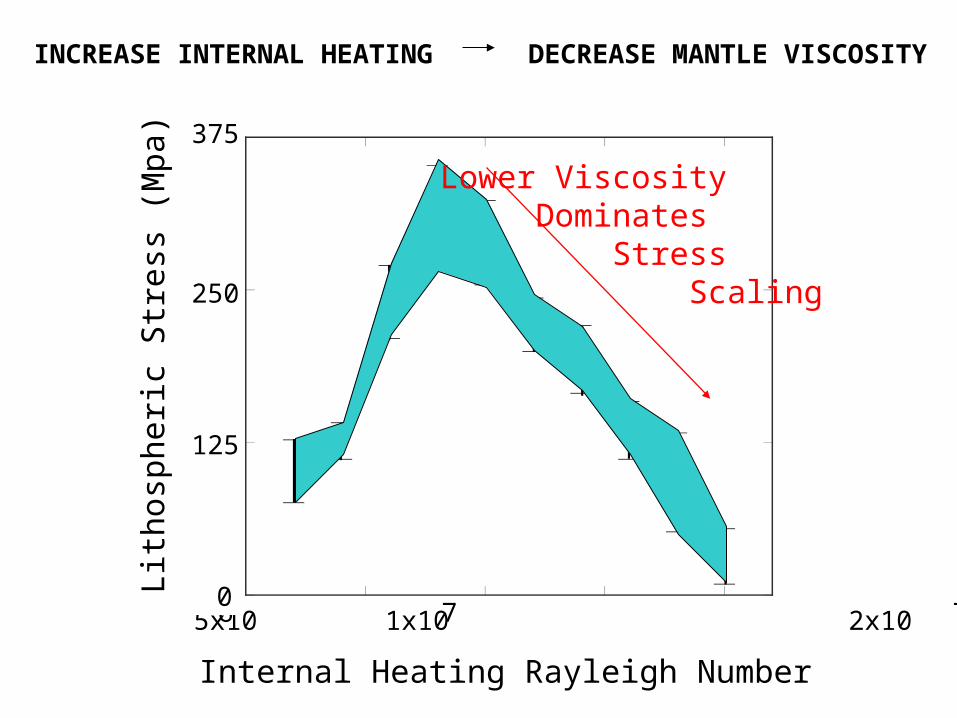
Track Temperature, Strain Rate, and Stress ProfilesTo Get Average Lithospheric StressGives a Measure of Convective Mantle Stress
Vary Internal Heating To See How Mantle Stress Varies With Convective Vigor
0
5000
1 104
1.5 104
0 5 10 15 20
Lith
osph
eric
Str
ess
(Mpa
)
Internal Heating Rayleigh Number
5x10 1x10 2x10 6 7 7
250
125
0
375
INCREASE INTERNAL HEATING DECREASE MANTLE VISCOSITY
Lower Viscosity Dominates Stress Scaling

MODELING CRATON STABILITYMODELING CRATON STABILITY
Vary Cratonic Properties: Viscosity, Yield Stress, Buoyancy
O’Neill et al., Lithos (2010)
Vary Mantle Properties: Clayperon Slope, Upper/Lower Mantle Viscosity, Convective Vigor (increases in past)

Weakened (Hydrated) CratonSmall Disruption, No Recycling
Weakened (Hydrated) CratonLarge Disruption, Recycling
Deh
ydra
ted
Cra
ton
Str
ess
(Mpa
)
Mantle Heat Production

0
5000
1 104
1.5 104
0 5 10 15 20
Geologic Time
Past Present Future
Craton Y
ield Stress (M
pa)
Man
tle S
tres
s (M
pa)
Reference (dry)
Weakened (rehydrated)

Mantle Stress Can Increase Over Time Due To Increasing Mantle Viscosity
Greater Potential for INSTABILITY in Geologic Present Vs. Ancient Past
High Craton Viscosity Leads to Stability in Thick Root Limit.
INSTABILITY: Rehydrate to Lower Viscosity
High Yield Stress Relative to Ocean & Peripheral Continental Lithosphere Leads to Stability
INSTABILITY: Lower Yield Stress (water) or No Peripheral Buffer