golar lng ltd. - hugin onlinereports.huginonline.com/895839/114858.pdfus natural g as price (prci e...
TRANSCRIPT
Golar LNG Ltd.”Well positioned in a high growth shipping market”
Lehman Brothers European Oil Company Seminar, 17th March 2003
Tor Olav Trøim, CEO

GAS/LNG – A Growth Commodity
0
20
40
60
80
100
120
140
160
180
Trill
ion
Cub
ic F
eet
1990 1998 1999 2005 2010 2015 2020N. America W. Europe Ind. Asia EE/FSU Developing
72.981.9 84.2
101.7
119
140.2
161.8Average Annual Change in
Gas Consumption 1999 - 2020 = 3.2%
Source : Energy Information Administration : International Energy Outlook 2002
0
50
100
150
200
250
300
350
2001 2002 2003 2004 2005 2006 2007 2008 2009 2010
Wor
ld L
NG
Tra
de (M
TPA
BP Case for LNG Growth (7%) High LNG Growth Case
The U.S. Gas Problem
- 4 -
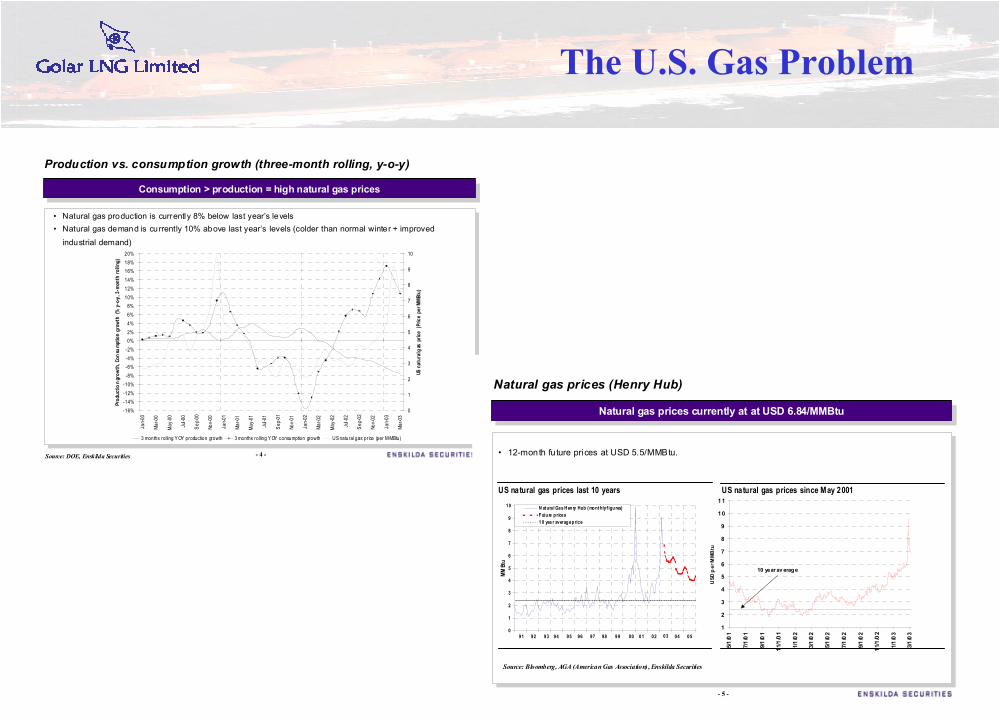
Production vs. consumption growth (three-month rolling, y-o-y)
Consumption > production = high natural gas pricesConsumption > production = high natural gas prices
• Natural gas production is currently 8% below last year’s levels• Natural gas demand is currently 10% above last year’s levels (colder than normal winter + improved
industrial demand)
Source: DOE, Enskilda Securities
-16%-14%-12%-10%
-8%-6%-4%-2%0%2%4%6%8%
10%12%14%16%18%20%
Jan-0
0
Mar-0
0
May-0
0
Jul-0
0
Sep-0
0
Nov-0
0
Jan-0
1
Mar-0
1
May-0
1
Jul-0
1
Sep-0
1
Nov-0
1
Jan-0
2
Mar-0
2
May-0
2
Jul-0
2
Sep-0
2
Nov-0
2
Jan-0
3
Mar-0
3
Prod
uctio
n gro
wth,
Cons
umpt
ion g
rowt
h (%
y-o-y
, 3-m
onth
rollin
g)
0
1
2
3
4
5
6
7
8
9
10
US n
atur
al ga
s pr
ice (
Price
per
MMB
tu)
3 months rolling YOY production growth 3 months rolling YOY consumption growth US natural gas price (per M MBtu)
- 5 -
Natural gas prices currently at at USD 6.84/MMBtuNatural gas prices currently at at USD 6.84/MMBtu
Natural gas prices (Henry Hub)
US natural gas prices last 10 years US natural gas prices since May 2001
Source: Bloomberg, AGA (American Gas Association) , Enskilda Securities
• 12-month future prices at USD 5.5/MMBtu.
0
1
2
3
4
5
6
7
8
9
10MM
Btu
N atural Gas Henry Hub ( monthly f igures)Fut ure p rices1 0 yea r average price
91 010099989796949392 04030295 051
2
3
4
5
6
7
8
9
10
11
5/1/0
1
7/1/0
1
9/1/0
1
11/1
/01
1/1/0
2
3/1/0
2
5/1/0
2
7/1/0
2
9/1/0
2
11/1
/02
1/1/0
3
3/1/0
3
USD
per
MM
Btu
10 year av erage
The Solution - LNG
0.00
1.00
2.00
3.00
4.00
5.00
6.00
7.00
8.00
9.00
10.00
Trinid
ad II
& II
INig
eria
IV &
VVen
ezue
la
Alger
iaIn
done
sia A
run
Qat
arEg
ypt L
NGAla
ska
PL
Snoh
vit
Curre
nt H
enry
Hub
LNG Projects
USD
/M
mB
tu
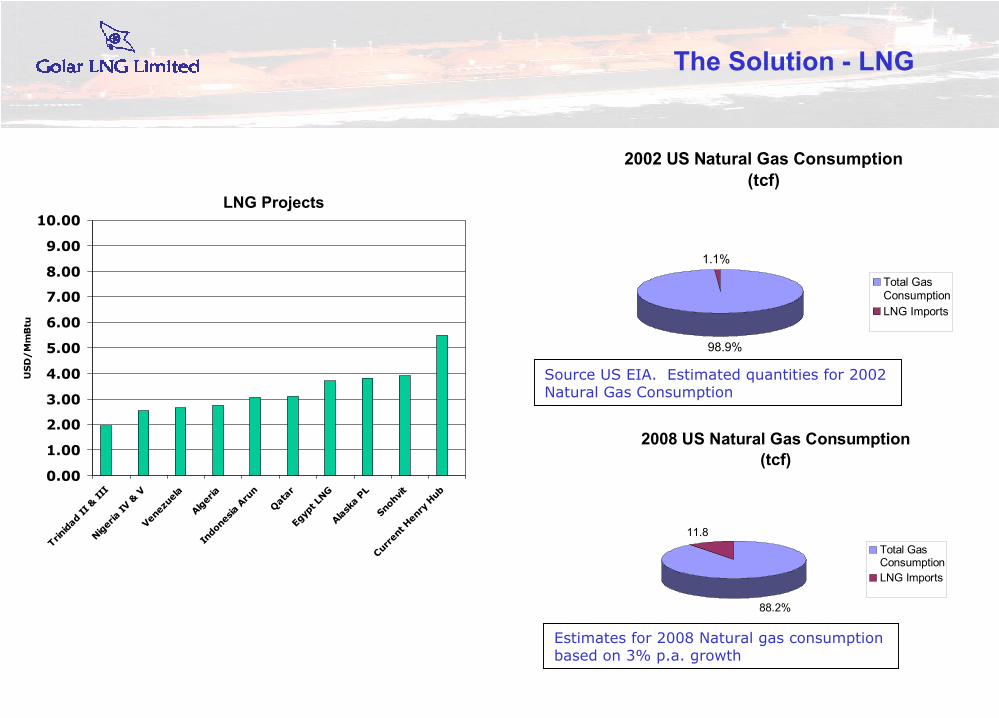
LNG Projects
2002 US Natural Gas Consumption (tcf)
98.9%
1.1%
Total GasConsumptionLNG Imports
2008 US Natural Gas Consumption (tcf)
88.2%
11.8Total GasConsumptionLNG Imports
Source US EIA. Estimated quantities for 2002 Natural Gas Consumption
Estimates for 2008 Natural gas consumption based on 3% p.a. growth
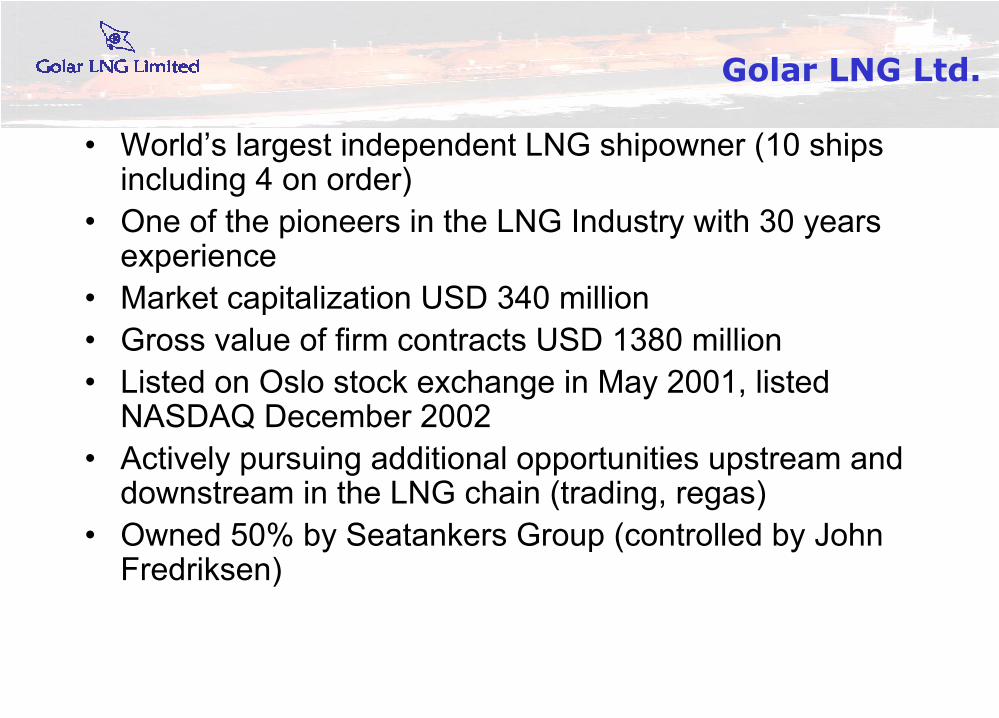
• World’s largest independent LNG shipowner (10 ships including 4 on order)
• One of the pioneers in the LNG Industry with 30 years experience
• Market capitalization USD 340 million• Gross value of firm contracts USD 1380 million• Listed on Oslo stock exchange in May 2001, listed
NASDAQ December 2002• Actively pursuing additional opportunities upstream and
downstream in the LNG chain (trading, regas)• Owned 50% by Seatankers Group (controlled by John
Fredriksen)
Golar LNG Ltd.

The Business
• Gas transported in Liquid form @ -1630C
• Expensive part of the chain• Ships built to high standards• Double Hulls with high containment
integrity• Three basic types of containment
system• High demand for operational
Reliability• Crew - proficient in normal marine
skills and LNG specific skills• LNG - One of the fastest growing
parts of the energy business
Kværner Moss LNG Tank System
Source: Golar LNG
2025
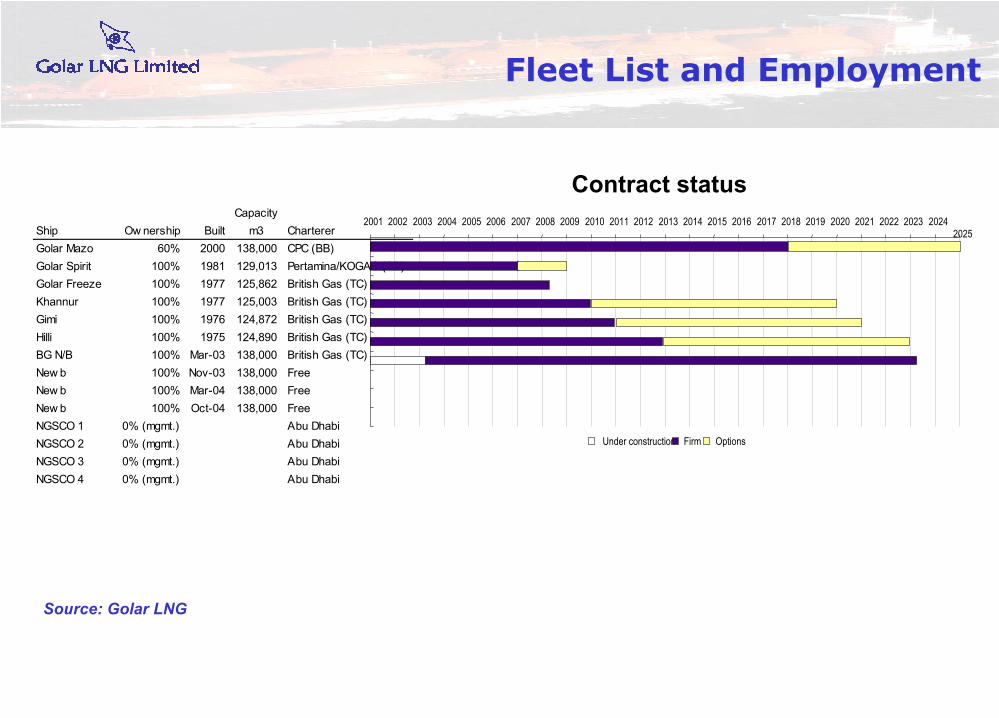
CapacityShip Ow nership Built m3 ChartererGolar Mazo 60% 2000 138,000 CPC (BB)Golar Spirit 100% 1981 129,013 Pertamina/KOGAS (BB)Golar Freeze 100% 1977 125,862 British Gas (TC)Khannur 100% 1977 125,003 British Gas (TC)Gimi 100% 1976 124,872 British Gas (TC)Hilli 100% 1975 124,890 British Gas (TC)BG N/B 100% Mar-03 138,000 British Gas (TC)New b 100% Nov-03 138,000 FreeNew b 100% Mar-04 138,000 FreeNew b 100% Oct-04 138,000 FreeNGSCO 1 0% (mgmt.) Abu DhabiNGSCO 2 0% (mgmt.) Abu DhabiNGSCO 3 0% (mgmt.) Abu DhabiNGSCO 4 0% (mgmt.) Abu Dhabi
Contract status2001 2002 2003 2004 2005 2006 2007 2008 2009 2010 2011 2012 2013 2014 2015 2016 2017 2018 2019 2020 2021 2022 2023 2024
Under construction Firm Options
Fleet List and Employment

Fixed Contracts Build Value
0
50
100
150
200
250
2002 2003 2004 2005 2006
Annu
al R
evnu
e ($
M)
Spirit Mazo Freeze Khannur Gimi Hilli Methane Princess Uncommitted NBs
($4,0)
($2,0)
$0,0
$2,0
$4,0
$6,0
$8,0
$10,0
$12,0
$14,0
$16,0
5 % 6 % 7 % 8 % 9 % 10 % 11 % 12 %
Discount FactorU
SD
per
sha
reFixed Contracts Options & Remaining Life Residual Value Tax Lease
% 6 % 7 % 8 % 9 % 10 % 11 % 12

Golar Project Participation
Floating Storage & Regasification Unit
• Unincorporated Joint Venture established with Saipem to provide floating regasification facility in Italian waters using a Moss type LNG Carrier
• Currently investigating commercial viability of 2 sites in the North via leasing arrangement
• Framework Agreement signed with Crossenergy re. development of LNG supplies to FSRU
• Import Capacity = 6MTPA
• 2 X 140,000M3 LNG Storage Tanks
• Total Send-out = 1000 MMCFD
• Power Plant up to 1000MW
• Need up to 8 ships
Baja California LNG Import Terminal
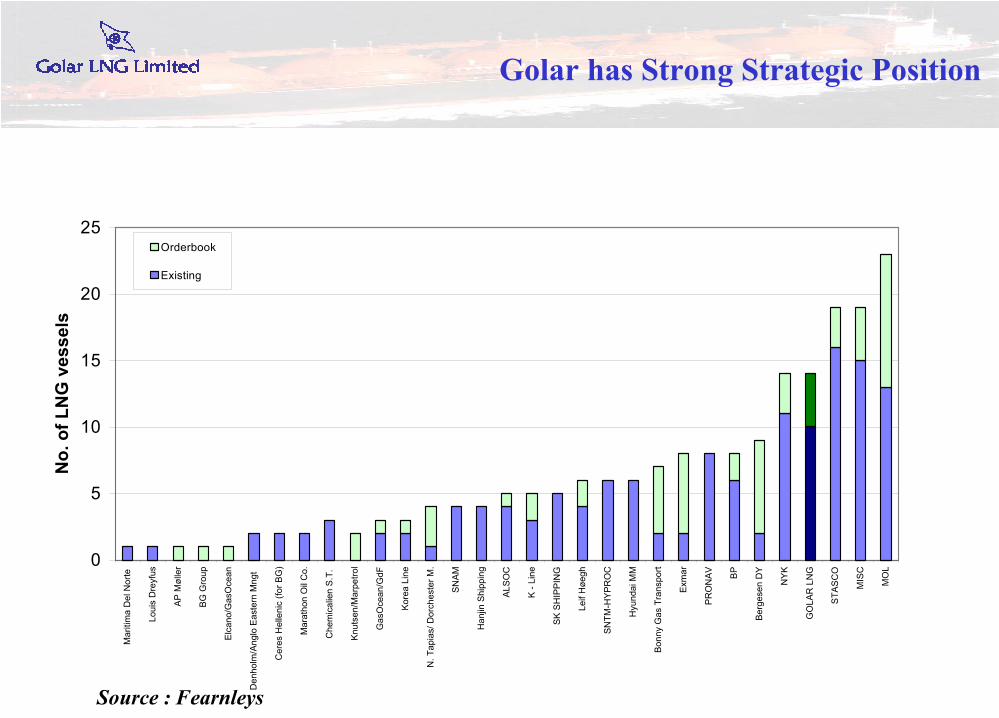
Golar has Strong Strategic Position
Source : Fearnleys
0
5
10
15
20
25
Mar
itim
a D
el N
orte
Loui
s D
reyf
us
AP M
ølle
r
BG G
roup
Elca
no/G
asO
cean
Den
holm
/Ang
lo E
aste
rn M
ngt
Cer
es H
elle
nic
(for B
G)
Mar
atho
n O
il C
o.
Che
mic
alie
n S.
T.
Knut
sen/
Mar
petro
l
Gas
Oce
an/G
dF
Kore
a Li
ne
N. T
apia
s/ D
orch
este
r M.
SNAM
Han
jin S
hipp
ing
ALSO
C
K - L
ine
SK S
HIP
PIN
G
Leif
Høe
gh
SNTM
-HYP
RO
C
Hyu
ndai
MM
Bonn
y G
as T
rans
port
Exm
ar
PRO
NAV BP
Berg
esen
DY
NYK
GO
LAR
LN
G
STAS
CO
MIS
C
MO
L
No.
of L
NG
ves
sels
Orderbook
Existing

Limited Open Capacity 2003-2004
Ship / Hull Owner Charterer Duration(Yrs)
Trade
IZAR 319 Naviera Tapias Repsol 20 Trinidad - SpainIZAR 087 Elcano Repsol 20 Trinidad – SpainIZAR 321 Knutsen
AOS/MarpetrolEnagas 20 Trinidad - Spain
DAEW OO 2207 Bergesen Tractebel 20 Trinidad - EverrettMethane Princess GOLAR BG 20 Trinidad –
US/EuropeDAEW OO 2212 Bergesen Tractebel 20 Trinidad – EverettDAEW OO 2213 Exmar/MOL El Paso 20DAEW OO 2216 Shell Bermuda Shell N/A Shell PortfolioDAEW OO 2210 MOSK/NYK/K-L Petronet 20 Oman - IndiaKAW ASAKI 1520 Tokyo Gas Tokyo Gas N/A Australia - JapanLNG Bayelsa BGT Nigeria LNG 20 Nigeria - EuropeHYUNDAI 1444 GOLAR Uncomm ittedMITSUBISHI 2173 Shell Bermuda Shell N/A Shell PortfolioMITSUBISHI 2169 MISC MLNG III 20 MLNG T1 - JapanMITSUBISHI 2176 Toyo Electric Tokyo Electric N/A LNG to JapanBritish Innovator BP BP 4 Abu Dhabi - SpainSAMSUNG 1405 IINO KAIUN KOGAS/SK Shipping 20 LNG to KoreaBritish Merchant BP BP 3 Qatar - SpainSAMSUNG 1428 Exmar/MOL RasGas 25 Qatar – Italy/Spot
Deliveries 2003Ship / Hull
Owner Charterer Duration
(Yrs) Trade
IZAR 103 Knutsen AOS/Marpetrol
Union Fenosa 20 Egypt - Spain
IZAR 105 Naviera Tapias Enagas 20 Trinidad - Spain De L’Atlantique Gaz de France Gaz de France N/A Algeria – France DAEW OO 2220 GOLAR Uncommitted DAEW OO 2214 North W est Shelf North W est Shelf N/A Australia - Asia DAEW OO 2209 Naviera Tapias Union Fenosa 20 Egypt – Spain DAEW OO 2217 Bergesen/Sonatrach Sonatrach 20 Algeria - US DAEW OO 2208 Exmar/MOL El Paso 20 Energybridge DAEW OO 2217 MOSK/NYK/K-L Petronet 20 Oman - India KAW ASAKI 1527 MOL/Oman Oman N/A Oman – Spain MITSUI 1507 MISC MLNG III T2 20 MLNG III - Asia, but
as yet unsupported by sales
MITSUI 1561 QS/MOL/NYK/K-L RasGas 20 Qatar – Japan HYUNDAI 1460 GOLAR Uncommitted HYUNDAI 1469 BGT Nigeria LNG 20 Nigeria – Europe MITSUBISHI 2183 Shell Bermuda Shell N/A Shell Portfolio MITSUBISHI 2177 MISC MLNG III T2 20 MLNG III Export,
but as yet unsupported by sales
SAMSUNG 1425 A. P. Moller RasGas Qatar - Italy SAMSUNG 1428 BG Group BG N/A Trinidad - US
Deliveries 2004
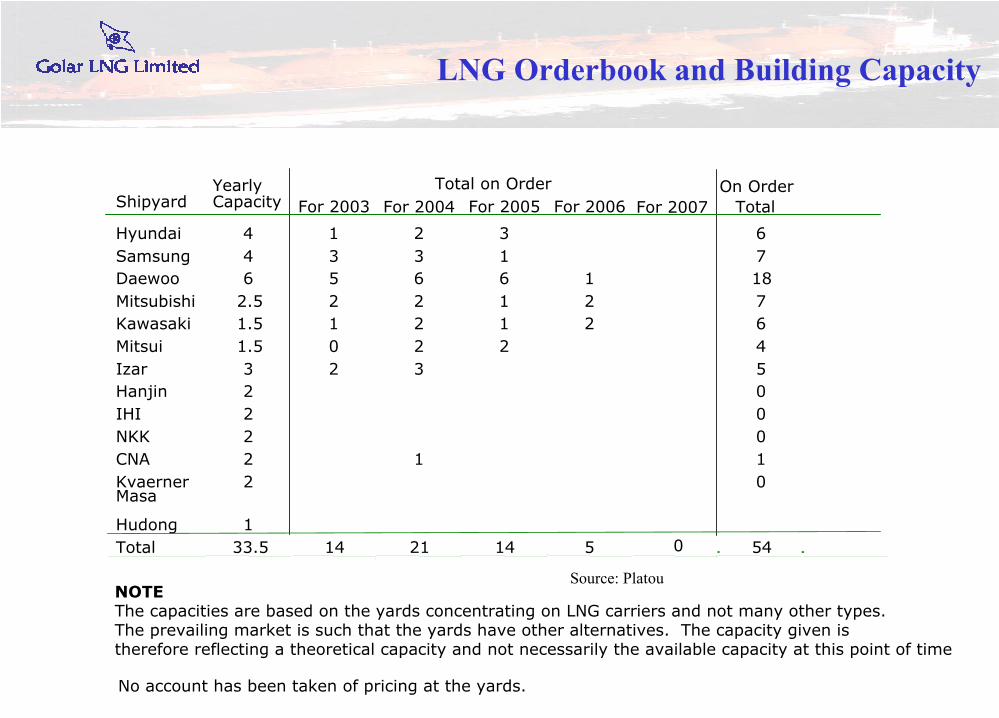
LNG Orderbook and Building Capacity
No account has been taken of pricing at the yards.
ShipyardYearlyCapacity
Total on Order On OrderTotalFor 2003 For 2004 For 2005 For 2006
Hyundai 4 1 2 3 6Samsung 4 3 3 1 7Daewoo 6 5 6 6 1 18Mitsubishi 2.5 2 2 1 2 7Kawasaki 1.5 1 2 1 2 6Mitsui 1.5 0 2 2 4Izar 3 2 3 5Hanjin 2 0IHI 2 0NKK 2 0CNA 2 1 1KvaernerMasa
Hudong
2
1
0
Total 33.5 14 21 14 5 54
NOTEThe capacities are based on the yards concentrating on LNG carriers and not many other types.The prevailing market is such that the yards have other alternatives. The capacity given is therefore reflecting a theoretical capacity and not necessarily the available capacity at this point of time
For 2007
0
Source: Platou

Orderbook/Capacity v Demand
LNG Orderbook and Building Capacity
No account has been taken of pricing at the yards.
ShipyardYearlyCapacity
Total on Order On OrderTotalFor 2003 For 2004 For 2005 For 2006
Hyundai 4 1 2 3 6Samsung 4 3 3 1 7Daewoo 6 5 6 6 1 18Mitsubishi 2.5 2 2 1 2 7Kawasaki 1.5 1 2 1 2 6Mitsui 1.5 0 2 2 4Izar 3 2 3 5Hanjin 2 0IHI 2 0NKK 2 0CNA 2 1 1KvaernerMasa
Hudong
2
1
0
Total 33.5 14 21 14 5 54
NOTEThe capacities are based on the yards concentrating on LNG carriers and not many other types.The prevailing market is such that the yards have other alternatives. The capacity given is therefore reflecting a theoretical capacity and not necessarily the available capacity at this point of time
For 2007
0
*LNG Berths Open 2006 : 16LNG berths Open 2007 : 21Total : 37Shipping Requirements to Q4 2007 : 59 ships
•For yard capacity, assume full capacity represented by 2004 orderbook (21)
•The Boom in other shipping markets may change the pendulum back in the shipowners’ favour.
LNG Shipping Requirements toend 2007
Project Shipping RequirementIn Progress(2006)Trinidad IV 4Tangguh 4NLNG VI 5Qatargas 6Rasgas 10Total 29
Proposed (2007)Peru/Bolivia 4Indonesia/Bontang 4Australia/Timor 4Sakhalin 6Venezuela 4Brass River/Nigeria 4Angola 4Total 30

Large LNG Rate Flexibility
• Assumptions: Nymex = 5.14 usd/Mmbtu February 2003 delivery
• Size of Ship = 138000 sm3• Trade = Nigeria to Lake Charles, US• Price ex. Ship = 4.37 usd/Mmbtu (Nymex-basis diff-
regas cost)• Plant opex = 0.07 usd/Mmbtu (cost of running plant)• Cost Upstream = 0.60 usd/Mmbtu (cost of gas into plant)• Net before trsp.= 3.70 usd/Mmbtu• Marginal trsp. = 0.30 usd Mmbtu (fuel, port charges,
boil-off)• Net available = 3.40 usd/Mmbtu• Value from 1 cargo = 9.86 mill/usd• Equivalent TC rate for Bonny/L.C. Trade = 328000
usd/day
0
2
4
6
8
10
12
14
MT
PA
Un
co
mm
itte
d C
ap
ac
ity
2003 2004 2005 2006 2007
Qatar Abu Dhabi Oman Algeria ALNG NLNG
Uncommited LNG Capacity
Source: Poten

A Good Margin Business
• Based on L.T. Contract– Vessel Cost = $170M– Hire Rate = $65,000/day– Opex = $10,000/day– Drydocking Cost = $2,300/Day– Period of Hire = 20 years- Interest rate = 5,9 % incl. margin
• Equity IRR = 19.1% @ 80% Debt funding• Equity IRR = 27.5% @ 90% Debt funding• The Actual IRR is likely to improve further as a function
of tax lease financing, higher degree of leverage and longer life.
The Financials
Golar LNG Limited Fourth Quarter 2002 Report (Unaudited)
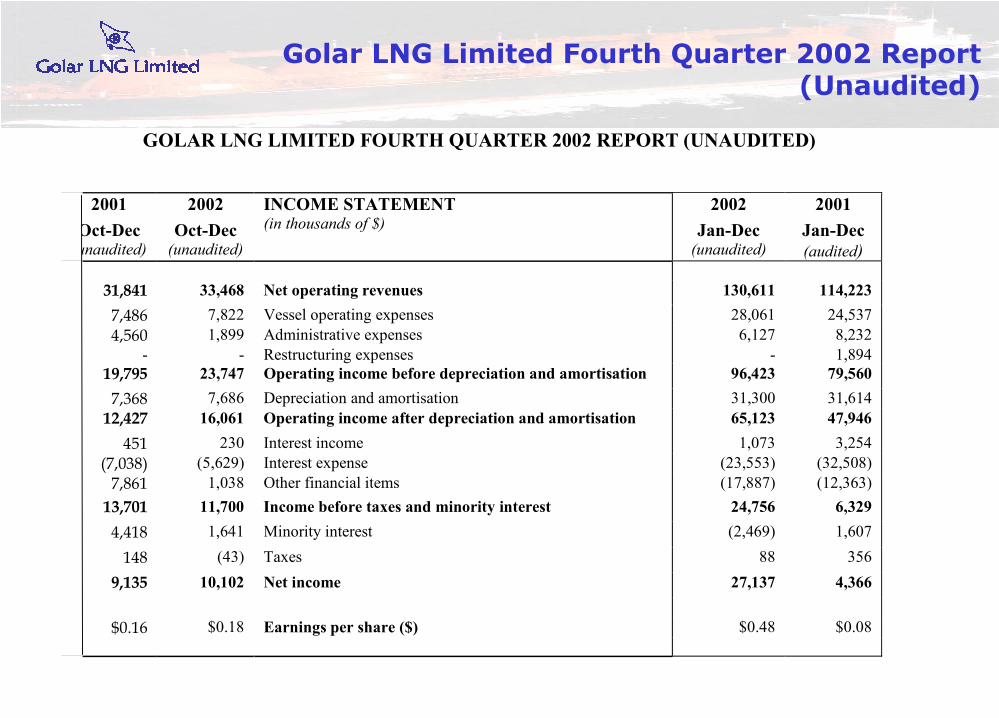
GOLAR LNG LIMITED FOURTH QUARTER 2002 REPORT (UNAUDITED)
2001Oct-Decunaudited)
2002Oct-Dec
(unaudited)
INCOME STATEMENT(in thousands of $)
2002Jan-Dec
(unaudited)
2001Jan-Dec(audited)
31,841 33,468 Net operating revenues 130,611 114,2237,486 7,822 Vessel operating expenses 28,061 24,5374,560 1,899 Administrative expenses 6,127 8,232
- - Restructuring expenses - 1,89419,795 23,747 Operating income before depreciation and amortisation 96,423 79,5607,368 7,686 Depreciation and amortisation 31,300 31,61412,427 16,061 Operating income after depreciation and amortisation 65,123 47,946451 230 Interest income 1,073 3,254
(7,038) (5,629) Interest expense (23,553) (32,508)7,861 1,038 Other financial items (17,887) (12,363)13,701 11,700 Income before taxes and minority interest 24,756 6,3294,418 1,641 Minority interest (2,469) 1,607148 (43) Taxes 88 3569,135 10,102 Net income 27,137 4,366
$0.16 $0.18 Earnings per share ($) $0.48 $0.08
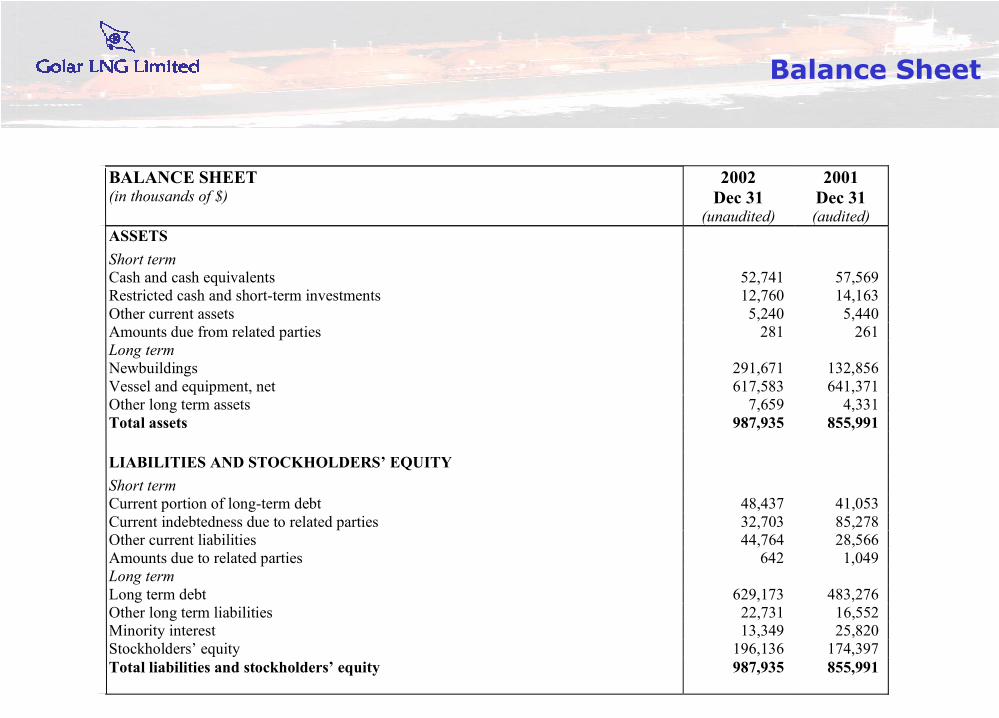
Balance Sheet
BALANCE SHEET(in thousands of $)
2002Dec 31
(unaudited)
2001Dec 31(audited)
ASSETSShort termCash and cash equivalents 52,741 57,569Restricted cash and short-term investments 12,760 14,163Other current assets 5,240 5,440Amounts due from related parties 281 261Long termNewbuildings 291,671 132,856Vessel and equipment, net 617,583 641,371Other long term assets 7,659 4,331Total assets 987,935 855,991
LIABILITIES AND STOCKHOLDERS’ EQUITYShort termCurrent portion of long-term debt 48,437 41,053Current indebtedness due to related parties 32,703 85,278Other current liabilities 44,764 28,566Amounts due to related parties 642 1,049Long termLong term debt 629,173 483,276Other long term liabilities 22,731 16,552Minority interest 13,349 25,820Stockholders’ equity 196,136 174,397Total liabilities and stockholders’ equity 987,935 855,991

Statement of Cash Flows
STATEMENT OF CASH FLOWS(in thousands of $)
2002Oct-Dec
(unaudited)
2002Jan-Dec
(unaudited)
2001Jan-Dec(audited)
OPERATING ACTIVITIESNet income 10,102 27,137 4,366Adjustments to reconcile net income to net cashProvided by operating activities:Depreciation and amortisation 7,686 31,300 31,680Amortisation of deferred charges 291 972 2,097Income (loss) attributable to minority interests 1,641 (2,469) 1,607Drydocking expenditure - (1,600) (10,222)Change in market value of interest rate derivatives (1,435) 16,459 10,838Change in operating assets and liabilities (808) (583) 1,677Net cash provided by operating activities 17,477 71,216 42,043
INVESTING ACTIVITIESCash paid for Osprey’s LNG interests, net of cash acquired - - (530,945)Additions to newbuildings (45,797) (158,815) (132,856)Additions to vessels and equipment (1,762) (5,912) (7,258)Restricted cash and short short-term investments 6,662 1,403 (1,072)Proceeds from maturity of short term investments - - 14,231Net cash used in investing activities (40,897) (163,324) (657,900)
FINANCING ACTIVITIESProceeds from long-term debt 60,061 194,335 325,000Proceeds from long-term debt due to related parties - 16,259 85,278Repayments of long-term debt (13,142) (41,054) (15,170)Repayments of long-term debt due to related parties (16,259) (68,834) -Financing costs paid (887) (3,424) (3,231)Dividends paid to minority shareholders - (10,002) -Proceeds from issuance of equity - - 275,808Net cash provided by financing activities 29,773 87,280 667,685
Net increase (decrease) in cash and cash equivalents 6,353 (4,828) 51,828Cash and cash equivalents at beginning of period 46,388 57,569 5,741Cash and cash equivalents at end of period 52,741 52,741 57,569