result update emamibreport.myiris.com/es1/himani_20130208.pdf · · 2013-02-11antiseptic cream...
TRANSCRIPT
Edelweiss Research is also available on www.edelresearch.com,
Bloomberg EDEL <GO>, Thomson First Call, Reuters and Factset.
Edelweiss Securities Limited
Emami’s Q3FY13 sales and PAT came bang in line with our estimates. Key
positives were: (i) sustained 16% YoY volume growth in domestic market;
(ii) continued improvement in international business while a few
companies have reported slowdown (up 25% YoY against 3% YoY in
Q2FY13 and 30% YoY decline in Q1FY13); (iii) 30% YoY growth in Boroplus
with 28-30% YoY volume growth and 270bps YoY market share gains (to
78%); (iv) 300bps YoY market share gain in Navratna oil to 58%, with
market leadership in UP and Bihar; and (v) robust CSD, modern trade and
rural growth (12%, 30% and 31% YoY respectively). The only negative was
3-4% YoY growth in Himani Fast Relief. Emami will benefit from
correction in mentha oil in FY14. Maintain ‘BUY’.
This report also contains Q3FY13 earnings call highlights
Volume growth robust; higher expenses nip margins
Emami’s Q3FY13 net sales rose 21.3% YoY to INR5.5bn led by 16% YoY domestic
volume growth backed by early onset of winter (led by power brands). International
business surged 25% YoY with robust spurt in SAARC, particularly Bangladesh (up 90%
YoY) and Africa (up 30% YoY); CIS continues to face problems. EBITDA margin declined
110bps YoY owing to rise in staff cost (up 63bps YoY) and ad spending (up 82bps YoY)
despite lower other costs (down 18bps YoY). PAT before exceptional increased 16.4%
YoY. Bangladesh unit commenced operations during the quarter.
Navratna well oiled; resurgence of Fair and Handsome
The company reported robust 21.7% YoY growth in domestic market. Boroplus
Antiseptic Cream grew 30% plus YoY, Zandu Pancharishta grew 3x YoY, balm category
grew 17% YoY, Fair and Handsome grew 19% YoY and OTC, ethicals grew 25% YoY.
Navratna portfolio rose 13% YoY with 300bps YoY market share gain (to 58%).
Outlook and valuations: Positive; maintain ‘BUY’
We like Emami’s focus on strengthening its brand equity, mass market product
portfolio and enhancing rural penetration. At CMP, the stock is trading at P/E of 27.9x
and 23.0x on FY13E and FY14E EPS, respectively. We maintain ‘BUY/Sector Performer’.
RESULT UPDATE
EMAMI Double delight: Domestic, global businesses shine
EDELWEISS 4D RATINGS
Absolute Rating BUY
Rating Relative to Sector Performer
Risk Rating Relative to Sector High
Sector Relative to Market Underweight
MARKET DATA (R: EMAM.BO, B: HMN IN)
CMP : INR 576
Target Price : INR 675
52-week range (INR) : 658 / 358
Share in issue (mn) : 151.3
M cap (INR bn/USD mn) : 87 / 1,625
Avg. Daily Vol.BSE/NSE(‘000) : 98.5
SHARE HOLDING PATTERN (%)
Current Q2FY13 Q1FY13
Promoters *
72.7 72.7 72.7
MF's, FI's & BK’s 4.0 3.6 4.0
FII's 14.3 14.6 14.7
Others 8.9 9.0 8.6
* Promoters pledged shares
(% of share in issue)
: 8.0
PRICE PERFORMANCE (%)
Stock Nifty
EW Consumer
Goods Index
1 month (0.1) (1.0) 4.9
3 months 1.6 4.4 13.5
12 months 59.1 11.8 45.0
Abneesh Roy
+91 22 6620 3141
Hemang Gandhi
+91 22 6620 3148
Pooja Lath
+91 22 6620 3075
India Equity Research| Consumer Goods
February 8, 2013
Financials (INR mn)
Year to March Q3FY13 Q3FY12 % change Q2FY13 % change FY12 FY13E FY14E
Net sales 5,487 4,524 21.3 3,607 52.1 14,535 17,174 20,566
EBITDA 1,369 1,178 16.2 641 113.6 2,968 3,521 4,268
PAT 1,150 945 21.6 592 94.2 2,588 3,127 3,782
Dil. EPS (INR) 7.6 6.2 21.6 3.9 94.2 17.1 20.7 25.0
Diluted P/E (x) 33.7 27.9 23.0
EV/EBITDA (x) 28.7 23.9 19.2
ROAE (%) 37.1 41.7 44.3
Consumer Goods
2 Edelweiss Securities Limited
Q3FY13 Conference call: Key highlights
Sales growth: Sales surged 21.3% YoY to ~INR5.5bn; international business growth
improved significantly at 25% YoY (against 3% growth in Q2FY13 and 30% YoY decline in
Q1FY13). Domestic business revenue grew 21.7% YoY backed by strong volume growth of
16% YoY (16% YoY in Q2FY13) due to robust surge across portfolio (aided by early winters).
Rural sales: Rural India contributed 52-53% to total revenue. Direct route in rural markets
grew an impressive 31% YoY. 25% of total direct reach is dedicated to rural areas.
International business: International portfolio grew 25% YoY (against 3% in Q2FY13 and
30% YoY decline in Q1FY13).
Growth was robust in SAARC, particularly Bangladesh (up 90% YoY; 60% YoY in Q2FY13).
The manufacturing plant in Bangladesh will be operational from FY14 which will lead to
huge tax savings as Bangladesh has import duties which range from 70-100%. The plant will
help reduce 90% of imports. Bangladesh offers huge scope for growth and management
expects to garner sales of INR550-600mn in FY13E and INR900mn in FY14E.
Africa business grew a strong 30% YoY. However, CIS continued to disappoint with a 10%
YoY decline in revenue. Management will be focusing more on SAARC, Africa and Middle
East business.
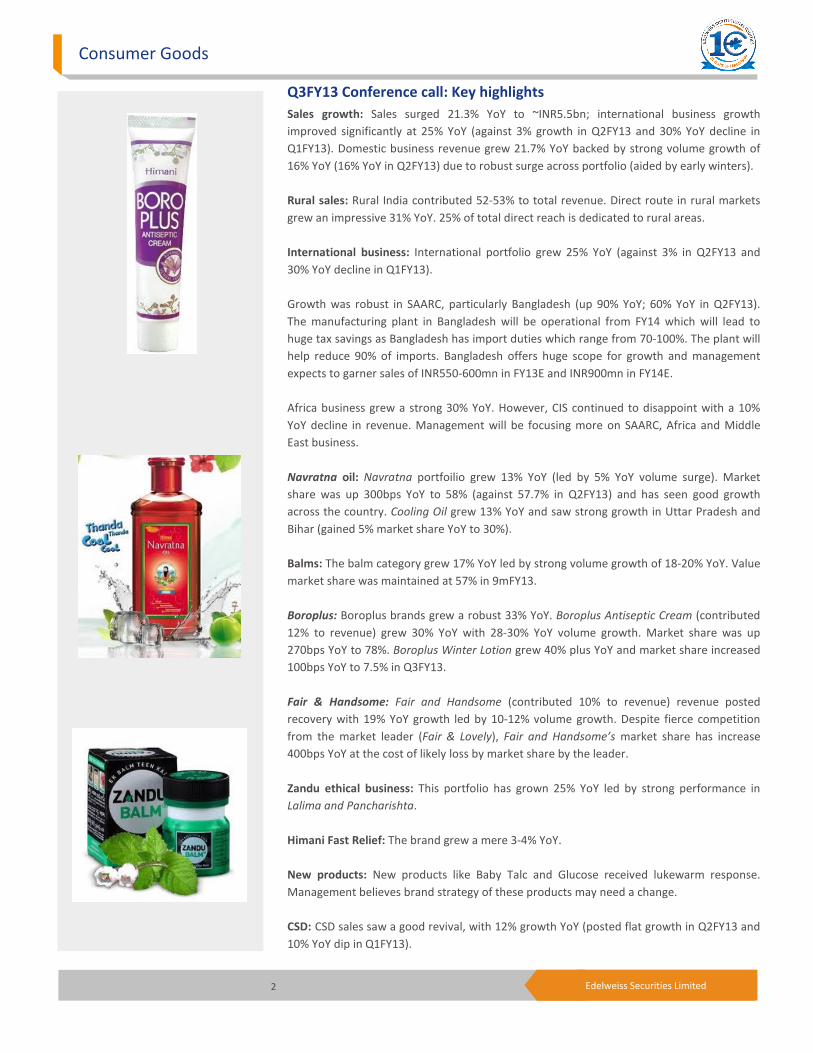
Navratna oil: Navratna portfoilio grew 13% YoY (led by 5% YoY volume surge). Market
share was up 300bps YoY to 58% (against 57.7% in Q2FY13) and has seen good growth
across the country. Cooling Oil grew 13% YoY and saw strong growth in Uttar Pradesh and
Bihar (gained 5% market share YoY to 30%).
Balms: The balm category grew 17% YoY led by strong volume growth of 18-20% YoY. Value
market share was maintained at 57% in 9mFY13.
Boroplus: Boroplus brands grew a robust 33% YoY. Boroplus Antiseptic Cream (contributed
12% to revenue) grew 30% YoY with 28-30% YoY volume growth. Market share was up
270bps YoY to 78%. Boroplus Winter Lotion grew 40% plus YoY and market share increased
100bps YoY to 7.5% in Q3FY13.
Fair & Handsome: Fair and Handsome (contributed 10% to revenue) revenue posted
recovery with 19% YoY growth led by 10-12% volume growth. Despite fierce competition
from the market leader (Fair & Lovely), Fair and Handsome’s market share has increase
400bps YoY at the cost of likely loss by market share by the leader.
Zandu ethical business: This portfolio has grown 25% YoY led by strong performance in
Lalima and Pancharishta.
Himani Fast Relief: The brand grew a mere 3-4% YoY.
New products: New products like Baby Talc and Glucose received lukewarm response.
Management believes brand strategy of these products may need a change.
CSD: CSD sales saw a good revival, with 12% growth YoY (posted flat growth in Q2FY13 and
10% YoY dip in Q1FY13).

Emami
3 Edelweiss Securities Limited
Modern trade: Modern trade grew 50% YoY and LTL growth stood at 30% YoY (on a small
base). Management expects 35% plus growth to sustain in modern trade.
Raw material: Gross margin expanded 18bps YoY to 62% helped by efficient cost
management and price hikes. Mentha oil prices have seen some cooling off QoQ, but
remained higher YoY. Market price for Mentha oil is ~INR1,550-1,600; cost for Emami was
INR1,900 till March 2013 due to contracts signed earlier. Average mentha oil price for the
year is ~INR1,700-1,800. Management believes that if current prices persist, gross margin
will improve in from Q1FY14.
Ad spends: Ad spends were up 82bps YoY to 18.6% as percentage of sales. Management
has maintained that ad spending will be around 17.0-17.5% of sales in FY13E (Q4FY13 will
not see aggressive ad spending).
Employee costs: Employee costs increased 63bps YoY to 5.7% as percentage of sales on
back of recruitment in the international business and in R&D team.
Tax rate: Management has guided for a tax rate of 17% for FY14, which will increase going
forward (20% FY15 onwards).
Distribution network: Emami has 1,600 frontline people with direct reach 600,000 (500,000
in Q3FY12).
Capex: Total capex will be in the INR500-600mn range in FY14E and FY15E.
Outlook and valuations: Positive; maintain ‘BUY’
We like Emami’s focus on continuous strengthening of its brand equity, focus on the mass-
market product portfolio, scale up of Zandu brands, and increasing rural penetration, and
believe commissioning of new plant in Bangladesh will boost volume. We maintain target
PE multiple of 27x arriving at target price of INR675. At CMP, the stock is trading at P/E of
27.9x and 23.0x on FY13E and FY14E EPS, respectively. We maintain ‘BUY’ with ‘Sector
Performer’ rating on the stock
Consumer Goods
4 Edelweiss Securities Limited
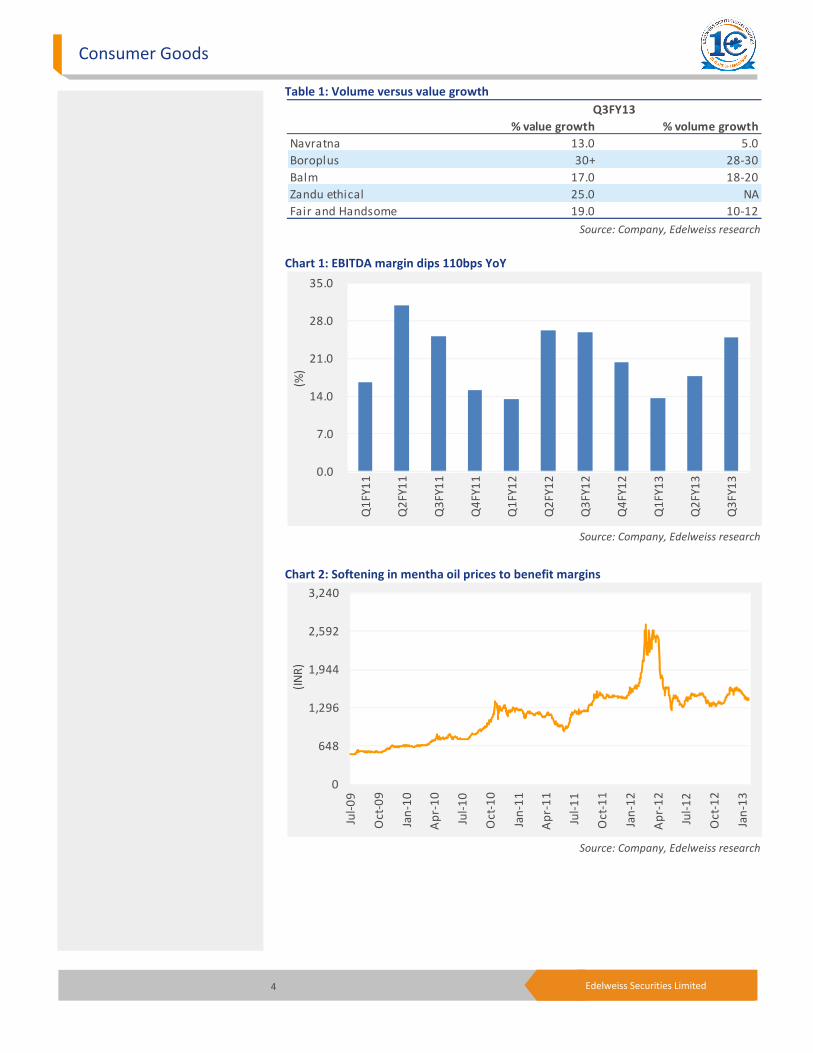
Table 1: Volume versus value growth
Source: Company, Edelweiss research
Chart 1: EBITDA margin dips 110bps YoY
Source: Company, Edelweiss research
Chart 2: Softening in mentha oil prices to benefit margins
Source: Company, Edelweiss research
% value growth % volume growth
Navratna 13.0 5.0
Boroplus 30+ 28-30
Balm 17.0 18-20
Zandu ethical 25.0 NA
Fair and Handsome 19.0 10-12
Q3FY13
0.0
7.0
14.0
21.0
28.0
35.0
Q1
FY
11
Q2
FY
11
Q3
FY
11
Q4
FY
11
Q1
FY
12
Q2
FY
12
Q3
FY
12
Q4
FY
12
Q1
FY
13
Q2
FY
13
Q3
FY
13
(%)
0
648
1,296
1,944
2,592
3,240
Jul-
09
Oc
t-0
9
Jan
-10
Ap
r-1
0
Jul-
10
Oc
t-1
0
Jan
-11
Ap
r-1
1
Jul-
11
Oc
t-1
1
Jan
-12
Ap
r-1
2
Jul-
12
Oc
t-1
2
Jan
-13
(IN
R)
Emami
5 Edelweiss Securities Limited
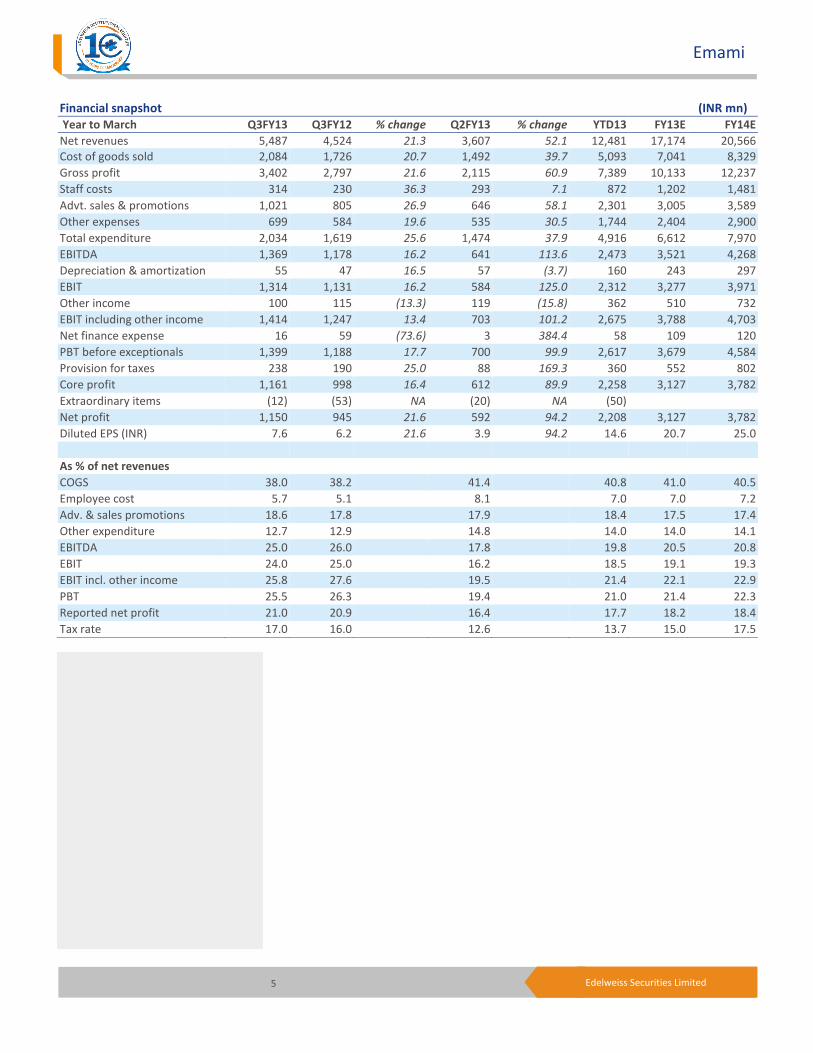
Financial snapshot (INR mn)
Year to March Q3FY13 Q3FY12 % change Q2FY13 % change YTD13 FY13E FY14E
Net revenues 5,487 4,524 21.3 3,607 52.1 12,481 17,174 20,566
Cost of goods sold 2,084 1,726 20.7 1,492 39.7 5,093 7,041 8,329
Gross profit 3,402 2,797 21.6 2,115 60.9 7,389 10,133 12,237
Staff costs 314 230 36.3 293 7.1 872 1,202 1,481
Advt. sales & promotions 1,021 805 26.9 646 58.1 2,301 3,005 3,589
Other expenses 699 584 19.6 535 30.5 1,744 2,404 2,900
Total expenditure 2,034 1,619 25.6 1,474 37.9 4,916 6,612 7,970
EBITDA 1,369 1,178 16.2 641 113.6 2,473 3,521 4,268
Depreciation & amortization 55 47 16.5 57 (3.7) 160 243 297
EBIT 1,314 1,131 16.2 584 125.0 2,312 3,277 3,971
Other income 100 115 (13.3) 119 (15.8) 362 510 732
EBIT including other income 1,414 1,247 13.4 703 101.2 2,675 3,788 4,703
Net finance expense 16 59 (73.6) 3 384.4 58 109 120
PBT before exceptionals 1,399 1,188 17.7 700 99.9 2,617 3,679 4,584
Provision for taxes 238 190 25.0 88 169.3 360 552 802
Core profit 1,161 998 16.4 612 89.9 2,258 3,127 3,782
Extraordinary items (12) (53) NA (20) NA (50)
Net profit 1,150 945 21.6 592 94.2 2,208 3,127 3,782
Diluted EPS (INR) 7.6 6.2 21.6 3.9 94.2 14.6 20.7 25.0
As % of net revenues
COGS 38.0 38.2 41.4 40.8 41.0 40.5
Employee cost 5.7 5.1 8.1 7.0 7.0 7.2
Adv. & sales promotions 18.6 17.8 17.9 18.4 17.5 17.4
Other expenditure 12.7 12.9 14.8 14.0 14.0 14.1
EBITDA 25.0 26.0 17.8 19.8 20.5 20.8
EBIT 24.0 25.0 16.2 18.5 19.1 19.3
EBIT incl. other income 25.8 27.6 19.5 21.4 22.1 22.9
PBT 25.5 26.3 19.4 21.0 21.4 22.3
Reported net profit 21.0 20.9 16.4 17.7 18.2 18.4
Tax rate 17.0 16.0 12.6 13.7 15.0 17.5
Consumer Goods
6 Edelweiss Securities Limited
Company Description
Emami is the flagship company of Emami group. It is a leading FMCG player in India,
operating in certain attractive segments such as skin care and hair oil. The company is
promoted by Kolkata-based industrialists, Mr. R.S. Agarwal and Mr. R. S. Goenka. The
company has been operating in health, beauty and personal care products for the past 30
years and has sustained a prominent position in therapeutic and Ayurvedic based products,
ensuring strong entry barriers for competition.
Over the years, Emami has innovated and built block-buster brands such as Navratna,
Boroplus, and Fair and Handsome. With the acquisition of ‘Zandu’, another strong Ayurvedic
brand was added to the portfolio. ~80% of the business is from wellness categories,
ensuring strong brand loyalty and ~80% of the company’s production is in tax exempt zones.
Recently, the Emami Group Company announced plans to enter the edible oil business as
well as a tie up with Disney for making toys. Since margins in both of these businesses are
very different from the listed Emami business, these businesses are launched through
different legal entities with no impact on the listed FMCG business.
Investment Theme
Emami’s product portfolio provides a play on Indian FMCG spend by virtue of its strong
presence in less penetrated and high growth categories. More than 80% of Emami’s
products have Ayurvedic base. The therapeutic usage gives customer loyalty leading to high
gross margins, high barriers to entry, strong brand equity, mass acceptance and superior
growth opportunities. Emami has a superior track record of launching new brands (Fair &
Handsome, first fairness cream for men in India) and transforming them into blockbusters.
Emami does not compete with any large multinational or domestic player in its key
segments (except skin creams). Introduction of lower SKUs for Zandu balm and rejuvenating
more than 200 of Zandu’s Ayurvedic-based prescription products will be another growth
driver for Emami.
Key Risks
Seasonality risk is one of the biggest risks to Emami. Summer products (like Talc) and winter
products (like Boroplus) sales depend upon the weather conditions. Any disruption in
weather conditions can result in volatile sales of some of these products. With the
popularisation and increase in mass consumption of herbal products, several key ingredients
might be difficult to source.
Ayurvedic products are produced by more than a thousand small companies in India,
though only about a dozen are big national players. Given Emami’s success, entry of new
competitors cannot be ruled out. Hence, Emami, like other FMCG players, will need to
continuously invest in A&P to build superior brand equity and gain customer loyalty.
7 Edelweiss Securities Limited
Emami
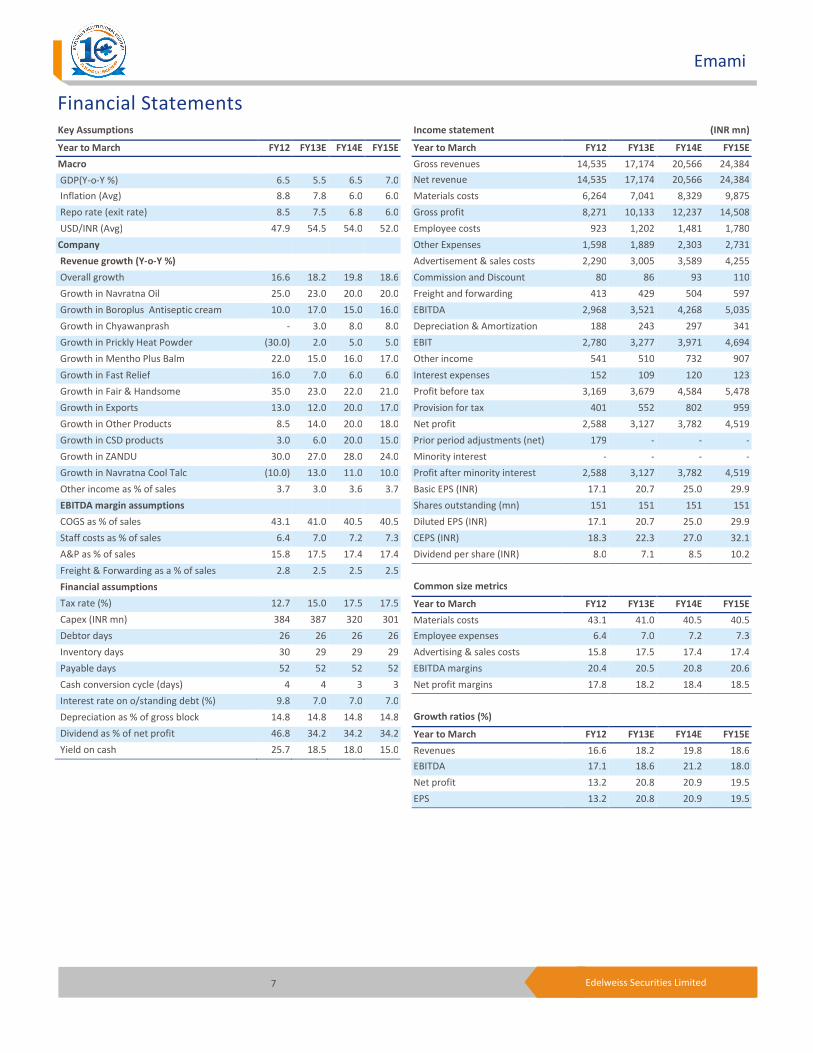
Financial Statements
Income statement (INR mn)
Year to March FY12 FY13E FY14E FY15E
Gross revenues 14,535 17,174 20,566 24,384
Net revenue 14,535 17,174 20,566 24,384
Materials costs 6,264 7,041 8,329 9,875
Gross profit 8,271 10,133 12,237 14,508
Employee costs 923 1,202 1,481 1,780
Other Expenses 1,598 1,889 2,303 2,731
Advertisement & sales costs 2,290 3,005 3,589 4,255
Commission and Discount 80 86 93 110
Freight and forwarding 413 429 504 597
EBITDA 2,968 3,521 4,268 5,035
Depreciation & Amortization 188 243 297 341
EBIT 2,780 3,277 3,971 4,694
Other income 541 510 732 907
Interest expenses 152 109 120 123
Profit before tax 3,169 3,679 4,584 5,478
Provision for tax 401 552 802 959
Net profit 2,588 3,127 3,782 4,519
Prior period adjustments (net) 179 - - -
Minority interest - - - -
Profit after minority interest 2,588 3,127 3,782 4,519
Basic EPS (INR) 17.1 20.7 25.0 29.9
Shares outstanding (mn) 151 151 151 151
Diluted EPS (INR) 17.1 20.7 25.0 29.9
CEPS (INR) 18.3 22.3 27.0 32.1
Dividend per share (INR) 8.0 7.1 8.5 10.2
Common size metrics
Year to March FY12 FY13E FY14E FY15E
Materials costs 43.1 41.0 40.5 40.5
Employee expenses 6.4 7.0 7.2 7.3
Advertising & sales costs 15.8 17.5 17.4 17.4
EBITDA margins 20.4 20.5 20.8 20.6
Net profit margins 17.8 18.2 18.4 18.5
Growth ratios (%)
Year to March FY12 FY13E FY14E FY15E
Revenues 16.6 18.2 19.8 18.6
EBITDA 17.1 18.6 21.2 18.0
Net profit 13.2 20.8 20.9 19.5
EPS 13.2 20.8 20.9 19.5
Key Assumptions
Year to March FY12 FY13E FY14E FY15E
Macro
GDP(Y-o-Y %) 6.5 5.5 6.5 7.0
Inflation (Avg) 8.8 7.8 6.0 6.0
Repo rate (exit rate) 8.5 7.5 6.8 6.0
USD/INR (Avg) 47.9 54.5 54.0 52.0
Company
Revenue growth (Y-o-Y %)
Overall growth 16.6 18.2 19.8 18.6
Growth in Navratna Oil 25.0 23.0 20.0 20.0
Growth in Boroplus Antiseptic cream 10.0 17.0 15.0 16.0
Growth in Chyawanprash - 3.0 8.0 8.0
Growth in Prickly Heat Powder (30.0) 2.0 5.0 5.0
Growth in Mentho Plus Balm 22.0 15.0 16.0 17.0
Growth in Fast Relief 16.0 7.0 6.0 6.0
Growth in Fair & Handsome 35.0 23.0 22.0 21.0
Growth in Exports 13.0 12.0 20.0 17.0
Growth in Other Products 8.5 14.0 20.0 18.0
Growth in CSD products 3.0 6.0 20.0 15.0
Growth in ZANDU 30.0 27.0 28.0 24.0
Growth in Navratna Cool Talc (10.0) 13.0 11.0 10.0
Other income as % of sales 3.7 3.0 3.6 3.7
EBITDA margin assumptions
COGS as % of sales 43.1 41.0 40.5 40.5
Staff costs as % of sales 6.4 7.0 7.2 7.3
A&P as % of sales 15.8 17.5 17.4 17.4
Freight & Forwarding as a % of sales 2.8 2.5 2.5 2.5
Financial assumptions
Tax rate (%) 12.7 15.0 17.5 17.5
Capex (INR mn) 384 387 320 301
Debtor days 26 26 26 26
Inventory days 30 29 29 29
Payable days 52 52 52 52
Cash conversion cycle (days) 4 4 3 3
Interest rate on o/standing debt (%) 9.8 7.0 7.0 7.0
Depreciation as % of gross block 14.8 14.8 14.8 14.8
Dividend as % of net profit 46.8 34.2 34.2 34.2
Yield on cash 25.7 18.5 18.0 15.0

8 Edelweiss Securities Limited
Consumer Goods
Peer comparison valuation
Market cap Diluted PE (X) EV/EBITDA (X) ROAE (%)
Name (USD mn) FY13E FY14E FY13E FY14E FY13E FY14E
Emami 1,625 27.9 23.0 23.9 19.2 41.7 44.3
Asian Paints 8,095 37.1 30.2 23.7 19.6 38.8 39.9
Bajaj Corp 632 20.3 16.8 20.0 16.6 37.1 39.7
Colgate 3,381 35.3 30.1 26.1 21.9 109.9 112.6
Dabur 4,263 30.3 25.4 22.1 18.2 39.0 37.1
Godrej Consumer 4,580 35.7 29.4 25.1 21.0 20.8 21.8
Hindustan Unilever 18,261 30.5 27.7 22.8 20.4 75.0 64.9
ITC 44,375 31.3 26.8 20.4 17.4 36.8 38.6
Marico 2,628 33.1 26.5 21.0 17.0 30.9 30.0
AVERAGE 37.8 29.5 23.6 19.6 46.0 45.6
Source: Edelweiss research
Cash flow metrics
Year to March FY12 FY13E FY14E FY15E
Operating cash flow 3,688 2,907 3,877 4,639
Investing cash flow (384) (387) (320) (301)
Financing cash flow (1,557) (1,210) (1,583) (1,881)
Net cash flow 1,747 1,310 1,974 2,457
Capex (384) (387) (320) (301)
Dividends paid (1,405) (1,251) (1,513) (1,808)
Profitability & efficiency ratios
Year to March FY12 FY13E FY14E FY15E
ROAE (%) 37.1 41.7 44.3 45.1
ROACE (%) 32.4 37.1 39.8 40.8
Inventory day 30 29 29 29
Debtors days 26 26 26 26
Payable days 52 52 52 52
Cash conversion cycle (days) 4 4 3 3
Current ratio 1.1 1.3 1.4 1.5
Debt/Equity 0.2 0.2 0.2 0.2
Interest coverage 18.3 30.0 33.2 38.1
Operating ratios
Year to March FY12 FY13E FY14E FY15E
Total asset turnover 1.6 1.9 2.0 2.0
Fixed asset turnover 3.0 3.9 6.0 10.2
Equity turnover 2.1 2.3 2.4 2.4
Valuation parameters
Year to March FY12 FY13E FY14E FY15E
Diluted EPS (INR) 17.1 20.7 25.0 29.9
Y-o-Y growth (%) 13.2 20.8 20.9 19.5
CEPS (INR) 18.3 22.3 27.0 32.1
Diluted PE (x) 33.7 27.9 23.0 19.3
Price/BV (x) 12.3 11.0 9.5 8.0
EV/Sales (x) 5.9 4.9 4.0 3.3
EV/EBITDA (x) 28.7 23.9 19.2 15.8
Dividend yield (%) 1.4 1.2 1.5 1.8
Balance sheet (INR mn)
As on 31st March FY12 FY13E FY14E FY15E
Equity capital 151 151 151 151
Reserves & surplus 6,915 7,770 9,017 10,707
Shareholders funds 7,066 7,921 9,169 10,859
Minority interest (BS) 1 1 1 1
Short term debt 555 598 615 633
Long term debt 1,003 1,110 1,142 1,175
Borrowings 1,558 1,708 1,758 1,808
Deferred tax liability 145 145 145 145
Sources of funds 8,771 9,775 11,073 12,813
Tangible assets 2,366 1,977 1,459 398
Intangible assets 1,669 1,169 669 669
CWIP (incl. intangible) 768 780 800 800
Total net fixed assets 4,803 3,926 2,929 1,868
Goodwill on consolidation 42 42 42 42
Non current investments 68 68 68 68
Current Investments 736 736 736 736
Cash and equivalents 2,759 4,069 6,043 8,501
Inventories 1,122 1,387 1,655 1,956
Sundry debtors 1,005 1,232 1,469 1,735
Other current assets 1,239 1,239 1,239 1,239
Total current assets (ex cash) 3,366 3,857 4,363 4,929
Total current liabilities & 3,003 2,921 3,107 3,330
Net current assets (ex cash) 363 935 1,256 1,600
Uses of funds 8,771 9,775 11,073 12,813
Book value per share (INR) 46.7 52.4 60.6 71.8
Free cash flow (INR mn)
Year to March FY12 FY13E FY14E FY15E
Net profit 2,588 3,127 3,782 4,519
Add : Non cash charge 519 352 416 464
Gross cash flow 3,108 3,479 4,198 4,983
Less: Changes in WC (581) 572 321 344
Operating cash flow 3,688 2,907 3,877 4,639
Less: Capex 384 387 320 301
Free cash flow 3,304 2,520 3,557 4,338
9 Edelweiss Securities Limited
Emami
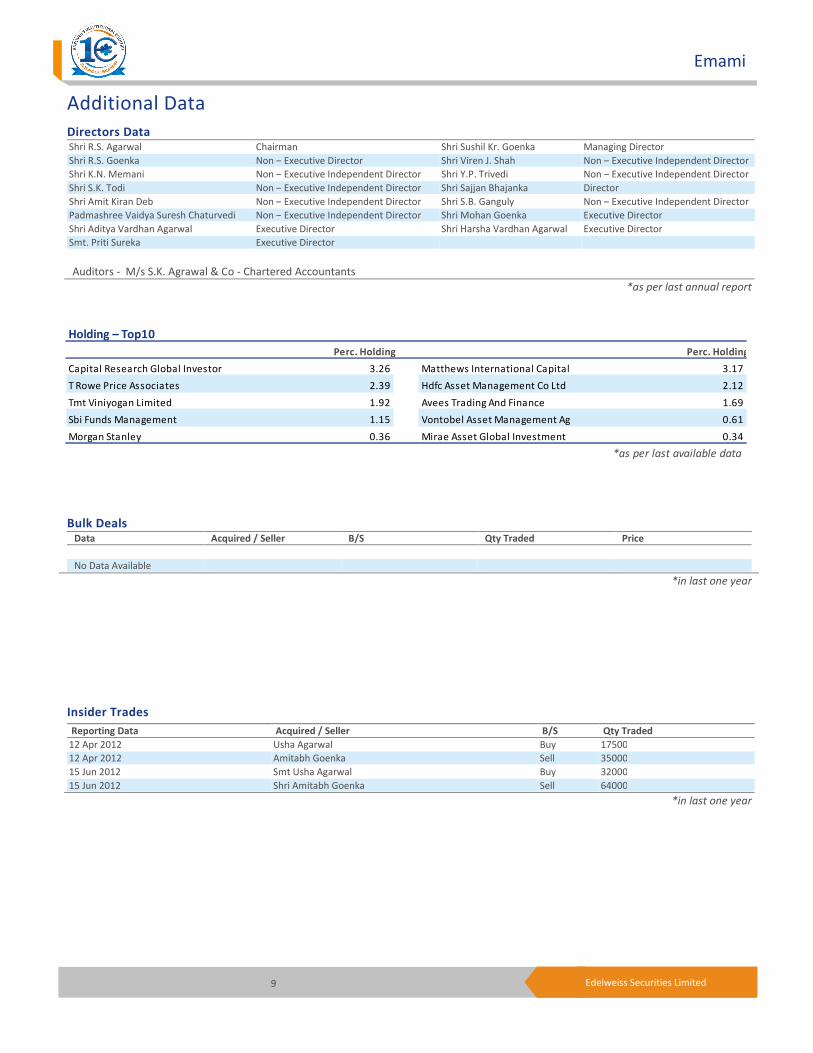
Holding – Top10
Perc. Holding Perc. Holding
Capital Research Global Investor 3.26 Matthews International Capital 3.17
T Rowe Price Associates 2.39 Hdfc Asset Management Co Ltd 2.12
Tmt Viniyogan Limited 1.92 Avees Trading And Finance 1.69
Sbi Funds Management 1.15 Vontobel Asset Management Ag 0.61
Morgan Stanley 0.36 Mirae Asset Global Investment 0.34
*as per last available data
Insider Trades Reporting Data Acquired / Seller B/S Qty Traded
12 Apr 2012 Usha Agarwal Buy 17500
12 Apr 2012 Amitabh Goenka Sell 35000
15 Jun 2012 Smt Usha Agarwal Buy 32000
15 Jun 2012 Shri Amitabh Goenka Sell 64000
*in last one year
Bulk Deals Data Acquired / Seller B/S Qty Traded Price
No Data Available
*in last one year
Additional Data
Directors Data
Shri R.S. Agarwal Chairman Shri Sushil Kr. Goenka Managing Director
Shri R.S. Goenka Non – Executive Director Shri Viren J. Shah Non – Executive Independent Director
Shri K.N. Memani Non – Executive Independent Director Shri Y.P. Trivedi Non – Executive Independent Director
Shri S.K. Todi Non – Executive Independent Director Shri Sajjan Bhajanka Director
Shri Amit Kiran Deb Non – Executive Independent Director Shri S.B. Ganguly Non – Executive Independent Director
Padmashree Vaidya Suresh Chaturvedi Non – Executive Independent Director Shri Mohan Goenka Executive Director
Shri Aditya Vardhan Agarwal Executive Director Shri Harsha Vardhan Agarwal Executive Director
Smt. Priti Sureka Executive Director
Auditors - M/s S.K. Agrawal & Co - Chartered Accountants
*as per last annual report
10 Edelweiss Securities Limited
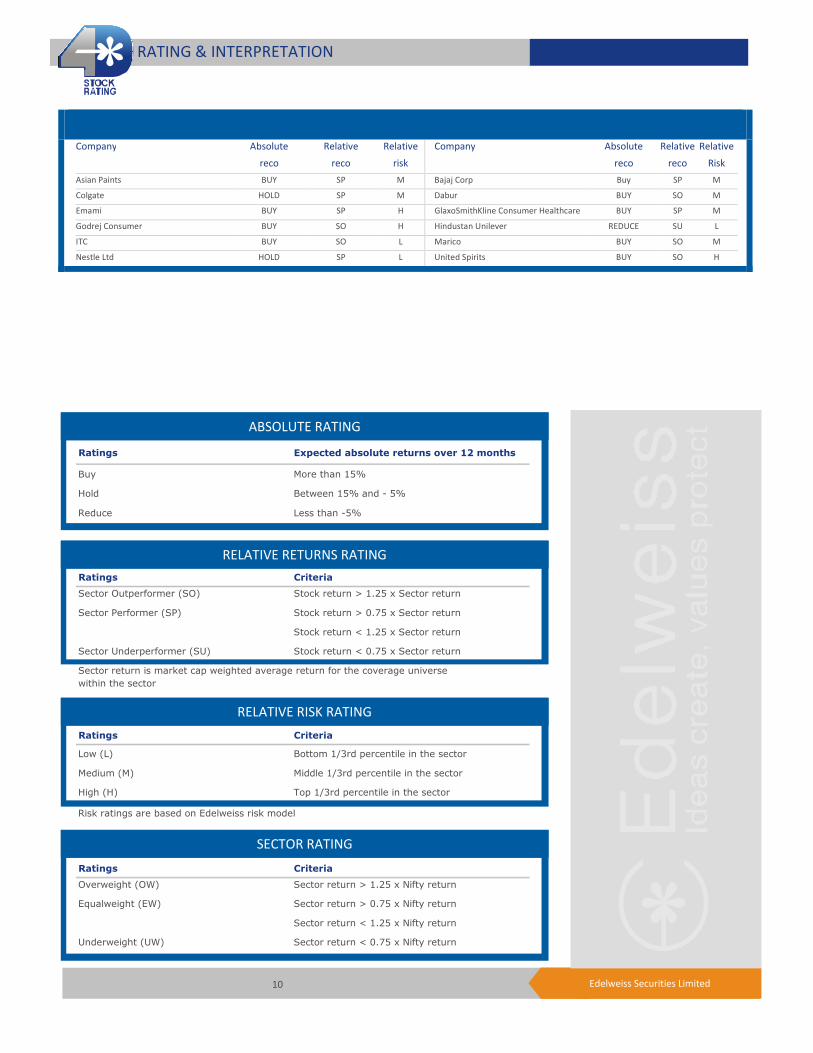
Company Absolute
reco
Relative
reco
Relative
risk
Company Absolute
reco
Relative
reco
Relative
Risk
Asian Paints BUY SP M Bajaj Corp Buy SP M
Colgate HOLD SP M Dabur BUY SO M
Emami BUY SP H GlaxoSmithKline Consumer Healthcare BUY SP M
Godrej Consumer BUY SO H Hindustan Unilever REDUCE SU L
ITC BUY SO L Marico BUY SO M
Nestle Ltd HOLD SP L United Spirits BUY SO H
RATING & INTERPRETATION
ABSOLUTE RATING
Ratings Expected absolute returns over 12 months
Buy More than 15%
Hold Between 15% and - 5%
Reduce Less than -5%
RELATIVE RETURNS RATING
Ratings Criteria
Sector Outperformer (SO) Stock return > 1.25 x Sector return
Sector Performer (SP) Stock return > 0.75 x Sector return
Stock return < 1.25 x Sector return
Sector Underperformer (SU) Stock return < 0.75 x Sector return
Sector return is market cap weighted average return for the coverage universe
within the sector
RELATIVE RISK RATING
Ratings Criteria
Low (L) Bottom 1/3rd percentile in the sector
Medium (M) Middle 1/3rd percentile in the sector
High (H) Top 1/3rd percentile in the sector
Risk ratings are based on Edelweiss risk model
SECTOR RATING
Ratings Criteria
Overweight (OW) Sector return > 1.25 x Nifty return
Equalweight (EW) Sector return > 0.75 x Nifty return
Sector return < 1.25 x Nifty return
Underweight (UW) Sector return < 0.75 x Nifty return
11 Edelweiss Securities Limited
Emami
Edelweiss Securities Limited, Edelweiss House, off C.S.T. Road, Kalina, Mumbai – 400 098.
Board: (91-22) 4009 4400, Email: [email protected]
Vikas Khemani Head Institutional Equities [email protected] +91 22 2286 4206
Nischal Maheshwari Co-Head Institutional Equities & Head Research [email protected] +91 22 4063 5476
Nirav Sheth Head Sales [email protected] +91 22 4040 7499
Coverage group(s) of stocks by primary analyst(s): Consumer Goods
Asian Paints, Bajaj Corp, Colgate, Dabur, Emami, GlaxoSmithKline Consumer Healthcare, Godrej Consumer, Hindustan Unilever, ITC, Marico, Nestle Ltd,
United Spirits
Distribution of Ratings / Market Cap
Edelweiss Research Coverage Universe
Rating Distribution* 118 46 17 181
* - stocks under review
Market Cap (INR) 117 57 7
Date Company Title Price (INR) Recos
Recent Research
07-Feb-13 Bajaj Corp Nourishing growth;
Initiating Coverage
234 Buy
05-Feb-13 United Spirits Robust volumes bring cheer;
Result Update
1858 Buy
01-Feb-13 Marico Margins surge; international
biz disappoints;
Result Update
230 Buy
> 50bn Between 10bn and 50 bn < 10bn
Buy Hold Reduce Total
Rating Interpretation
Buy appreciate more than 15% over a 12-month period
Hold appreciate up to 15% over a 12-month period
Reduce depreciate more than 5% over a 12-month period
Rating Expected to
12 Edelweiss Securities Limited
Consumer Goods
Access the entire repository of Edelweiss Research on www.edelresearch.com
DISCLAIMER
General Disclaimer:
This document has been prepared by Edelweiss Securities Limited (Edelweiss). Edelweiss, its holding company and associate companies are a full service, integrated investment banking, portfolio
management and brokerage group. Our research analysts and sales persons provide important input into our investment banking activities. This document does not constitute an offer or solicitation for the
purchase or sale of any financial instrument or as an official confirmation of any transaction. The information contained herein is from publicly available data or other sources believed to be reliable, but we
do not represent that it is accurate or complete and it should not be relied on as such. Edelweiss or any of its affiliates/ group companies shall not be in any way responsible for any loss or damage that may
arise to any person from any inadvertent error in the information contained in this report. This document is provided for assistance only and is not intended to be and must not alone be taken as the basis
for an investment decision. The user assumes the entire risk of any use made of this information. Each recipient of this document should make such investigation as it deems necessary to arrive at an
independent evaluation of an investment in the securities of companies referred to in this document (including the merits and risks involved), and should consult his own advisors to determine the merits
and risks of such investment. The investment discussed or views expressed may not be suitable for all investors. We and our affiliates, group companies, officers, directors, and employees may: (a) from time
to time, have long or short positions in, and buy or sell the securities thereof, of company (ies) mentioned herein or (b) be engaged in any other transaction involving such securities and earn brokerage or
other compensation or act as advisor or lender/borrower to such company (ies) or have other potential conflict of interest with respect to any recommendation and related information and opinions. This
information is strictly confidential and is being furnished to you solely for your information. This information should not be reproduced or redistributed or passed on directly or indirectly in any form to any
other person or published, copied, in whole or in part, for any purpose. This report is not directed or intended for distribution to, or use by, any person or entity who is a citizen or resident of or located in
any locality, state, country or other jurisdiction, where such distribution, publication, availability or use would be contrary to law, regulation or which would subject Edelweiss and affiliates/ group companies
to any registration or licensing requirements within such jurisdiction. The distribution of this document in certain jurisdictions may be restricted by law, and persons in whose possession this document
comes, should inform themselves about and observe, any such restrictions. The information given in this document is as of the date of this report and there can be no assurance that future results or events
will be consistent with this information. This information is subject to change without any prior notice. Edelweiss reserves the right to make modifications and alterations to this statement as may be
required from time to time. However, Edelweiss is under no obligation to update or keep the information current. Nevertheless, Edelweiss is committed to providing independent and transparent
recommendation to its client and would be happy to provide any information in response to specific client queries. Neither Edelweiss nor any of its affiliates, group companies, directors, employees, agents
or representatives shall be liable for any damages whether direct, indirect, special or consequential including lost revenue or lost profits that may arise from or in connection with the use of the information.
Past performance is not necessarily a guide to future performance. The disclosures of interest statements incorporated in this document are provided solely to enhance the transparency and should not be
treated as endorsement of the views expressed in the report. Edelweiss Securities Limited generally prohibits its analysts, persons reporting to analysts and their dependents from maintaining a financial
interest in the securities or derivatives of any companies that the analysts cover. The information provided in these reports remains, unless otherwise stated, the copyright of Edelweiss. All layout, design,
original artwork, concepts and other Intellectual Properties, remains the property and copyright Edelweiss and may not be used in any form or for any purpose whatsoever by any party without the express
written permission of the copyright holders.
Analyst Certification:
The analyst for this report certifies that all of the views expressed in this report accurately reflect his or her personal views about the subject company or companies and its or their securities, and no part of
his or her compensation was, is or will be, directly or indirectly related to specific recommendations or views expressed in this report.
Analyst holding in the stock: No.
Additional Disclaimer for U.S. Persons
This research report is a product of Edelweiss Securities Limited, which is the employer of the research analyst(s) who has prepared the research report. The research analyst(s) preparing the research report
is/are resident outside the United States (U.S.) and are not associated persons of any U.S. regulated broker-dealer and therefore the analyst(s) is/are not subject to supervision by a U.S. broker-dealer, and
is/are not required to satisfy the regulatory licensing requirements of FINRA or required to otherwise comply with U.S. rules or regulations regarding, among other things, communications with a subject
company, public appearances and trading securities held by a research analyst account.
This report is intended for distribution by Edelweiss Securities Limited only to "Major Institutional Investors" as defined by Rule 15a-6(b)(4) of the U.S. Securities and Exchange Act, 1934 (the Exchange Act)
and interpretations thereof by U.S. Securities and Exchange Commission (SEC) in reliance on Rule 15a 6(a)(2). If the recipient of this report is not a Major Institutional Investor as specified above, then it
should not act upon this report and return the same to the sender. Further, this report may not be copied, duplicated and/or transmitted onward to any U.S. person, which is not the Major Institutional
Investor.
In reliance on the exemption from registration provided by Rule 15a-6 of the Exchange Act and interpretations thereof by the SEC in order to conduct certain business with Major Institutional Investors,
Edelweiss Securities Limited has entered into an agreement with a U.S. registered broker-dealer, Enclave Capital, LLC ("Enclave").
Transactions in securities discussed in this research report should be effected through Enclave or another U.S. registered broker dealer.
Additional Disclaimer for U.K. Persons
The contents of this research report have not been approved by an authorised person within the meaning of the Financial Services and Markets Act 2000 ("FSMA").
In the United Kingdom, this research report is being distributed only to and is directed only at (a) persons who have professional experience in matters relating to investments falling within Article 19(5) of
the FSMA (Financial Promotion) Order 2005 (the “Order”); (b) persons falling within Article 49(2)(a) to (d) of the Order (including high net worth companies and unincorporated associations); and (c) any
other persons to whom it may otherwise lawfully be communicated (all such persons together being referred to as “relevant persons”).
This research report must not be acted on or relied on by persons who are not relevant persons. Any investment or investment activity to which this research report relates is available only to relevant
persons and will be engaged in only with relevant persons. Any person who is not a relevant person should not act or rely on this research report nor any of its contents. This research report must not be
distributed, published, reproduced or disclosed (in whole or in part) by recipients to any other person.
Edelweiss shall not be liable for any delay or any other interruption which may occur in presenting the data due to any reason including network (Internet) reasons or snags in the system, break down of the
system or any other equipment, server breakdown, maintenance shutdown, breakdown of communication services or inability of the Edelweiss to present the data. In no event shall the Edelweiss be liable
for any damages, including without limitation direct or indirect, special, incidental, or consequential damages, losses or expenses arising in connection with the data presented by the Edelweiss through this
report.
Copyright 2009 Edelweiss Research (Edelweiss Securities Ltd). All rights reserved