golf carts – profit center or not?gsr.lib.msu.edu/article/moeller-golf-4-4-14.pdf · golf carts...
TRANSCRIPT
Disclaimer: This article applies to golf facilities throughout the U.S. and suggests a generalized maintenance and course use calendar of six and 12 months. There will be exceptions to these suggestions relative to the main- tenance budget, facility mission, or member expectations that affect final costs. Hourly wages are estimated at $9 for a general employee and $11 for a skilled employee and do not account for benefits or taxes. Fuel costs are based on the national average at the time of publication, $3.30 per gallon for gasoline and $3.80 per gallon for diesel.
Golf carts first became commer- cially available in the late 1940s and have since become invalu-
able for players who find it too difficult to walk while playing golf. Over time, carts have slowly shifted from being a golfer aid to a major revenue source for golf courses. Some golf facilities even suggest that cart revenue is what keeps them in business. Carts bring money in, but does the net revenue outweigh the negative effect their use has on course conditions, maintenance inputs, and pace of play?
GOLF CART USE AND MALADIES Golf cart use has steadily increased over time. The National Golf Foundation reported that 69 percent of all rounds in 2006 were played with carts (Figure 1). The percentage of rounds played by those carrying their own bag, down 14 percent, or using pull carts, down 10 percent, has steadily declined while cart use, up 24 percent, has increased significantly since 1994. Golf in the U.S. has transformed from a walking game to a riding game for many. This trend may be the result of an aging
Golf Carts – Profit Center or Not?Golf carts can be a source of revenue, but there are many costs associated with their use that directly and indirectly impact turf conditions, management inputs, and pace of play that cannot be ignored.BY ADAM MOELLER
Page 1TGIF Record Number 238128
Green Section Record Vol. 52 (7)April 4, 2014
©2014 by United States Golf Association. All rights reserved. Please see Policies for the Reuse of USGA Green Section Publications. Subscribe to the USGA Green Section Record.
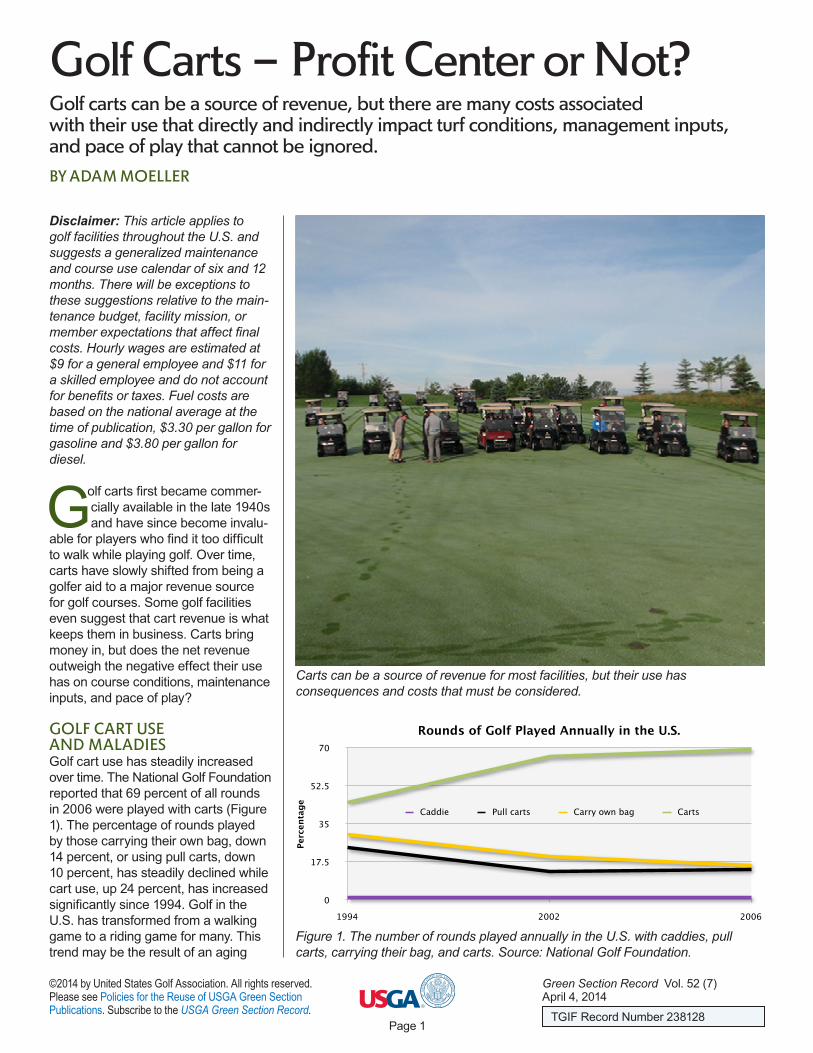
Carts can be a source of revenue for most facilities, but their use has consequences and costs that must be considered.
0
17.5
35
52.5
70
1994 2002 2006
Rounds of Golf Played Annually in the U.S.
Perc
enta
ge
Caddie Pull carts Carry own bag Carts
Figure 1. The number of rounds played annually in the U.S. with caddies, pull carts, carrying their bag, and carts. Source: National Golf Foundation.

golfer population, but could also be a change in golfer’s perception of what defines a good golf experience.
An increasing number of golf facili- ties mandate cart use, while others are so walker-unfriendly that using a cart is the only option due to the topography or distance between holes. Therefore, a survey was conducted by the USGA Green Section to identify cart use and course maintenance interaction trends at golf facilities throughout the U.S. The survey was completed by 180 representatives from the golf industry consisting of superintendents, golf professionals, and general managers. The survey results indicated that carts were mandatory at 16 percent of the
represented facilities (data not shown). This information, along with NGF data, is alarming because carts create numerous short- and long-term turf- related problems, including physical damage to the turf and soil compaction. However, unless the soil is extremely wet or the turf is suffering from heat/drought stress, a single cart with two averaged-sized passengers is not damaging to the turf or the soil struc- ture (Wienecke, 2004). However, the long-term effects of repeated cart traffic across the same area can be catastrophic. In some cases, the turf cannot outgrow the chronic wear and tear. Heavy-textured soils (e.g., clay soils) are particularly susceptible to
cart damage and soil compaction, which will limit turf performance and root development over time.
Superintendents develop agronomic programs to manage cart traffic, but resources and course expectations often dictate their implementation. These agronomic programs have associated costs, but it is difficult to put a quantifiable value on turf quality. The quantifiable costs associated with agronomic programs to manage both cart traffic and a fleet of carts should be compared with gross cart revenue, with the caveat being course expecta- tions. These factors will indicate if carts are a profit center or not at your facility.
GROSS CART REVENUEQuantifying average gross cart revenue for all of the facilities in the U.S. is difficult. Fee structures, use patterns, and weather all impact gross cart revenue. In 2012, the NGF reported that the average rounds of golf played in the U.S. was 24,800 at private courses, 36,000 at public courses, and 33,900 at resort courses. Utilizing a range of rounds played annually, the NGF cart data from 2006 stated that 69 percent of all rounds were played with a cart, and a typical cart fee, calculating the estimated gross cart revenue for an average 18-hole facility, is possible with the following equation.
Gross cart revenue =# of rounds played % rounds with a cart $ cart fee
Two general assumptions will be made to calculate predicted gross revenue based on NGF data and industry feedback. First, we will assume $15 is the typical cart fee. Second, annual cart use will be estimated at 69 percent of all rounds played, which may have changed slightly since the NGF data were col- lected in 2006. With these assumptions, a course receiving 20,000 to 25,000 rounds annually would expect gross cart revenue of $207,000 to $258,750 (Figure 2). This is a generalized example, yet it provides an accurate estimate for many courses. Gross cart
Page 2
Green Section Record Vol. 52 (7)April 4, 2014
©2014 by United States Golf Association. All rights reserved. Please see Policies for the Reuse of USGA Green Section Publications. Subscribe to the USGA Green Section Record.
The Impact of Golf Carts on Pace of Play
The USGA is leading efforts to identify solutions to slow play, which is a serious threat to the health and sustainability of golf. Players walking or
riding in a cart both impact pace of play. Although carts can move you along faster, their use does not always improve pace of play. In fact, restricting carts to paths significantly increases playing time. The pace rating survey conducted in 1993 (Knuth) reported that an average round will take 8 percent longer when carts are restricted to paths only. For example, if your course has a pace rating of four hours and 10 minutes, this will result in a round of golf being completed in four hours and 30 minutes. The extra time needed to walk from the cart to a golf ball is significant and creates an unpleasant golf experience for many. This is particularly true when you are unsure of what club is needed prior to hitting your next shot.
If a golf course has identified the most appropriate tee time intervals for its facility and all groups are using carts with no restrictions, pace of play can be improved with carts. However, it is uncommon at most facilities that all groups on the course use carts, so once again pace of play becomes impacted negatively. In this scenario, the interaction of the different speeds of groups with walkers and groups with no walkers can cause the perception of slow play to those riding in carts. Quite simply, many times the carts get the players to their next shot too quickly, which causes players in carts to wait on the group with one or more walkers in front of them. As a result, the waiting adds time to their round and a smooth-flowing round is not experienced.
The effect of the 90-degree rule on pace of play, where carts are driven on paths until they reach a 90-degree angle from their ball and then turn onto the fairway, has not been separately studied. However, the same interaction between groups walking and those not walking may still exist, and in most cases that does not improve the pace of play. Also, it is logical to assume that the 90-degree rule will slow play to some small degree when compared to those times when carts have full access to the fairways.
It is expected that the use of carts will continue to impact the pace of play, given the demand for and dependence on carts today. Again, it is important to remember that carts do not necessarily improve pace of play, and at those times when they are restricted to paths, they have a negative impact on the pace and flow of play.

revenue may be different at your facility, given the different fee structures that courses utilize. For instance, some private courses charge an annual fee for cart usage. Similarly, courses that allow access for privately owned carts almost always charge a trail fee that typically ranges between $650 and
$2,000 per year. Most golf operations charge a cart fee with each round; therefore, this fee structure is used for predicting gross revenue in this article.
GOLF CART FLEET COSTSThe USGA Green Section Cart Use and Course Maintenance Interaction
survey indicated that 44 percent of golf facilities have a fleet consisting of 50- 75 carts, while 30 percent of facilities have 75 carts or more (data not shown). This article will calculate costs based on a fleet size of 60 carts for an 18- hole facility. Assuming that each cart costs $5,000, a new golf course would pay $300,000 to purchase 60 carts. Leasing options are also available. However, very few new courses are opening each year, so information pertaining to annual maintenance costs of an existing cart fleet is more relevant (Table 1).
Cart replacement/turnover is the biggest expense associated with main- taining a reliable fleet. Most facilities replace 15-25 percent of their fleet each year, which may cost $45,000 to $75,000 annually. This turnover rate will replace the entire fleet in four to five years, which is common for most courses. Annual leasing payments are similar to replacement costs for courses that own carts. Some courses with financial concerns have ceased replac- ing heavily used carts unless absolutely necessary to save costs. Annual cart maintenance costs are likely higher, and diminishing cart performance is expected for these facilities.
Electric carts appear to be rising in popularity when compared with gas- powered carts, perhaps because of the rising cost of gas and lower noise output. Electricity costs for charging a fleet of 60 carts is estimated at $10,000 to $20,000 for facilities with six- and 12-month seasons, respectively. Electricity costs are based on a six- or 12-month season because daily charging is not necessary if the carts are not being used. Fuel costs for a similarly sized fleet would range from $12,870 to $17,160 annually. These expenses are based on an annual consumption of 3,900 to 5,200 gallons of fuel (65-85 gallons per cart annually) at $3.30 per gallon.
Many facilities rotate a few employees each day to manage the cart fleet, which includes cleaning after use, moving the carts to charging stations or filling them with gas, and bringing them near the clubhouse for easy golfer access. An estimated eight labor hours per day is dedicated to
Page 3
Green Section Record Vol. 52 (7)April 4, 2014
©2014 by United States Golf Association. All rights reserved. Please see Policies for the Reuse of USGA Green Section Publications. Subscribe to the USGA Green Section Record.
$0
$150,000
$300,000
$450,000
$600,000
10,000 15,000 20,000 25,000 30,000 35,000 40,000 45,000 50,000
Projected Gross Cart Revenue
Rounds of Golf Played Annually
Figure 2. Projected revenue from golf cart use at 18-hole facilities, assuming 69 percent of all rounds are played with carts at a cart fee of $15 per person.
Table 1Generalized Golf Cart Fleet Costs
Cart Expenses Annual Cost
Cart replacement $45,000-$75,000
6-Month Season $10,000Electricity 12-Month Season $20,000
Fuel $12,870-$17,160
6-Month Season $13,104Daily management 12-Month Season $26,208
Cleaning supplies $200-$400
Routine maintenance $4,000-$8,000
Cart storage costs $2,000-$3,000
Additional cart rentals $10,000-$20,000
Insurance Variable
Cart replacement costs are based on a 60-cart fleet for an 18-hole course. Most facilities replace between 15% and 25% of their fleet (9-15 carts) annually at $5,000 per cart.
Fuel costs are estimated at $3.30 per gallon, with annual consumption of 3,900-5,200 gallons.
Daily management costs based on 8 labors per day at $9 per hour
Cart storage costs include heating and air conditioning costs, electricity for lighting, and general building maintenance.
Additional cart rentals are often needed a few times annually to accom- modate large golf outings. These costs may be deferred to the outing costs.

managing the cart fleet. This results in a cost (one general employee paid $9 per hour) of $13,104 and $26,208 for courses with six- and 12-month sea- sons, respectively. Some courses have a full-time employee responsible for everyday cart management and incur an estimated annual cost of between $17,000 and $30,000. Furthermore, specialized cleaning supplies typically cost $200 to $400 annually, and most
facilities utilize a power washer that may cost hundreds of dollars to purchase and maintain annually.
In addition to managing and daily cart cleaning, routine maintenance and repair costs for carts are also common. These costs are variable and often dependent upon the age and use of the fleet, but they often include the replacement of various cart parts such as broken steering wheels, damaged
seat cushions, flat tires, bent roof covers, etc. Spending between $4,000 and $8,000 annually for normal main- tenance inputs and occasional repair is common.
Cart fleets are most often stored indoors, either in a standalone building or the clubhouse basement, making the costs associated with storage difficult to quantify. However, for stand- alone cart storage buildings, the elec- tricity costs for lighting along with heating and/or air conditioning can range from $2,000 to $3,000 annually.
At many golf courses, certain large events and/or outings require more carts than the course owns. These are usually shotgun events with full fields. Renting additional carts is common for these events, with the costs averaging $10,000 to $20,000 annually. These costs do not always impact gross cart revenue or the costs associated with carts because they are often incorpo- rated in the event or outing fee.
In addition to purchase and turnover costs, golf facilities pay for insurance that covers cart use and accidents. Insurance expenses are course spe- cific, and the costs directly associated with carts are not easily separated within the policy. Nonetheless, it is important to acknowledge that a portion of the insurance costs paid annually are cart related.
CART PATH MAINTENANCE COSTSCart paths are often disliked by golfers, but they are an important component at virtually every facility because they reduce cart traffic on turf when designed and installed properly (Oatis, 1994). Cart paths may form a continu- ous network from the tee to green, or they may be isolated around high- traffic areas like greens, tees, and par-3 holes. Cart paths help alleviate some of the problems associated with concentrated traffic, but they are not perfect, nor are they maintenance free (Table 2).
Cart path maintenance expenses are site-specific, but some basic costs can be generalized. For maintenance purposes, cart paths should be grouped into two categories: pavement and unbound aggregates. Asphalt and con-
Page 4
Green Section Record Vol. 52 (7)April 4, 2014
©2014 by United States Golf Association. All rights reserved. Please see Policies for the Reuse of USGA Green Section Publications. Subscribe to the USGA Green Section Record.
Table 2Generalized Cart Path Maintenance Costs
Maintenance Practice Annual Cost
Washout repairs for cart paths $825-$1,100built with loose materials
Routine maintenance of cart paths $275-$550built with loose materials
Re-paving asphalt cart paths $5,500-$13,750
Replacing concrete paths $4,800-$8,000
Asphalt $1,200Cart path curbing Belgian block $2,000
6-Month Season $1,887Blowing debris off cart paths 12-Month Season $3,775
Kentucky bluegrass $360Cart path edging Bermudagrass or $1,800-$3,600 seashore paspalum
Repairing cart path washout requires 15-20 labor hours per event from a skilled employee ($11 per hour). Five washout events were estimated each season.
Paths built with loose materials require 25-50 labor hours per season to redistribute materials that migrate. A skilled employee ($11 per hour) is needed for these labor hours.
An estimated 2,000-5,000 square feet of re-paving asphalt paths is needed annually at $2.75 per square foot.
Replacing concrete cart paths is performed less often because of a longer life expectancy compared to asphalt. Costs are estimated for replacing 3,000-5,000 square feet every 5 years at $8.00 per square foot.
Annual curb installation or replacement was estimated at 100 linear feet at $12 per linear foot for asphalt and $20 per linear foot for Belgian block.
Blowing cart paths is estimated at 3 labor hours per week. One skilled employee is needed at $11 per hour, consuming 12 gallons of fuel per week at $3.30 per gallon.
Edging of cart paths is cost based on the adjacent turf species. Bermudagrass or seashore paspalum courses may need to edge paths 5-10 times per year while courses with Kentucky bluegrass roughs may only edge paths once annually. Forty total labor hours is required to edge paths from general employees at $9 per hour.

crete are the most common materials used for paved paths, while gravel, rock or brick dust, decomposed granite, crushed shells, pine straw, and wood chips are common unbound aggregates used for paths.
Unbound aggregate materials are less expensive than pavement, but they often require more in-season maintenance. For instance, when heavy rain causes erosion of paths built with unbound aggregates, it often takes 15-20 labor hours from skilled employees ($11 per hour) to repair when using a box-blade or specialized equipment and hand shovel work. Every season is different, but budgeting for at least five severe washouts and erosion events annually is prudent. The estimated annual-labor costs alone total $825 to $1,100 if five wash- out events occur. Furthermore, depend- ing on the severity of the weather event, the cost to replace lost unbound aggregate materials may range from $500 to $1,000. Additionally, 25-50 labor hours annually are often needed for path maintenance activities like pushing loose material into place that moves from dry weather and cart traffic, totaling a cost of $275 to $550. Steep terrain and loose cart path material are not a good combination, and the costs associated with frequent repair from erosion will be significant for courses with these features.
Pavement also has associated maintenance costs. Given the short life-expectancy of asphalt paths (five to 10 years), which arguably are the most common type of path on courses in the U.S., it is important to recognize these costs. Repaving sections of an asphalt cart path network is a common annual project, especially when trees with destructive surface roots are located close to paths. Assuming a network of 8-foot-wide paths, annual repaving of 2,000 to 5,000 square feet of asphalt is a conservative estimate for many facilities. This would equate to a cost of $5,500 to $13,750 with a baseline repaving cost of $2.75 per square foot. Many facilities do large-scale repaving every few years, with costs ranging from $50,000 to $80,000 or more.
Concrete paths are more expensive to install but have a longer life expect-
ancy, often 15-30 years. Because replacement needs are less frequent for concrete paths, it is difficult to discuss annual repair costs. However, if we assume that 3,000 to 5,000 square feet of 8-foot-wide concrete paths needs to be replaced every five years, and it costs $8 per square foot for materials and installation, an annual cost totaling $4,800 to $8,000 is easily calculated. The cost of replacing asphalt and concrete paths is highly dependent upon the size of the project, so costs could be lower or higher depending upon the situation. Keep in mind, regardless of the material (i.e., concrete, asphalt, Belgian block, railroad ties, etc.); it is necessary to replace small sections of cart path every few years. Furthermore, the cost of materials and the amount of cart path replaced or installed are highly variable annually.
Curbing cart path edges around greens, tees, and other high-traffic areas is very helpful in reducing wear on the adjacent turf (Oatis, 1994). Asphalt and Belgian-block curbs are common and often cost $12 and $20 per linear foot, respectively. If we assume that facilities need to install or replace 100 linear feet of curbing annually, the total cost for curb replace-
ment is $1,200 for asphalt and $2,000 for Belgian block.
Blowing debris off cart paths is an- other small, yet common maintenance practice associated with carts. Grass clippings from mowing adjacent turf often collect on paths. Furthermore, cart and maintenance equipment traffic can track clippings onto cart paths. Blowing the debris off paths may not be a daily task, but a modest amount of time is needed for this task when the turf is growing rapidly. An estimated three labor hours per week from a skilled employee ($11 per hour) is needed to blow off cart paths. This process will consume roughly 12 gal- lons of fuel at $3.30 per gallon every week. The total cost of $1,887 and $3,775 is needed to blow debris off paths for six- and 12-month seasons, respectively.
Edging cart paths is another forgotten maintenance practice that is indirectly associated with cart use. Edging is more important for facilities with aggressive, laterally growing turf, such as bermudagrass or seashore paspalum, adjacent to cart paths. At most facilities, edging cart paths is performed at least once annually, consuming an estimated 40 labor hours from general employees at $9
Page 5
Green Section Record Vol. 52 (7)April 4, 2014
©2014 by United States Golf Association. All rights reserved. Please see Policies for the Reuse of USGA Green Section Publications. Subscribe to the USGA Green Section Record.
Energy inputs to power carts are a significant cost over the course of a season.

per hour. Courses with aggressively growing turf may perform cart path edging five to 10 times annually. Facili- ties that edge paths once annually will spend approximately $360 in labor, while facilities that edge five to 10 times will spend $1,800 to $3,600 annually.
Another component to cart path maintenance costs is bridges, which are essential at many facilities. Main- tenance equipment travels across bridges; therefore, these costs cannot be entirely directed to cart use. How- ever, if cart-only bridges exist, their costs can be subtracted from gross cart revenue. The cost to install and maintain bridges is highly variable due to their size, design, and construction materials. Given the cost ranges and the fact that not every golf course has bridges, these costs were not included in the article. However, these expenses may be significant at your facility.
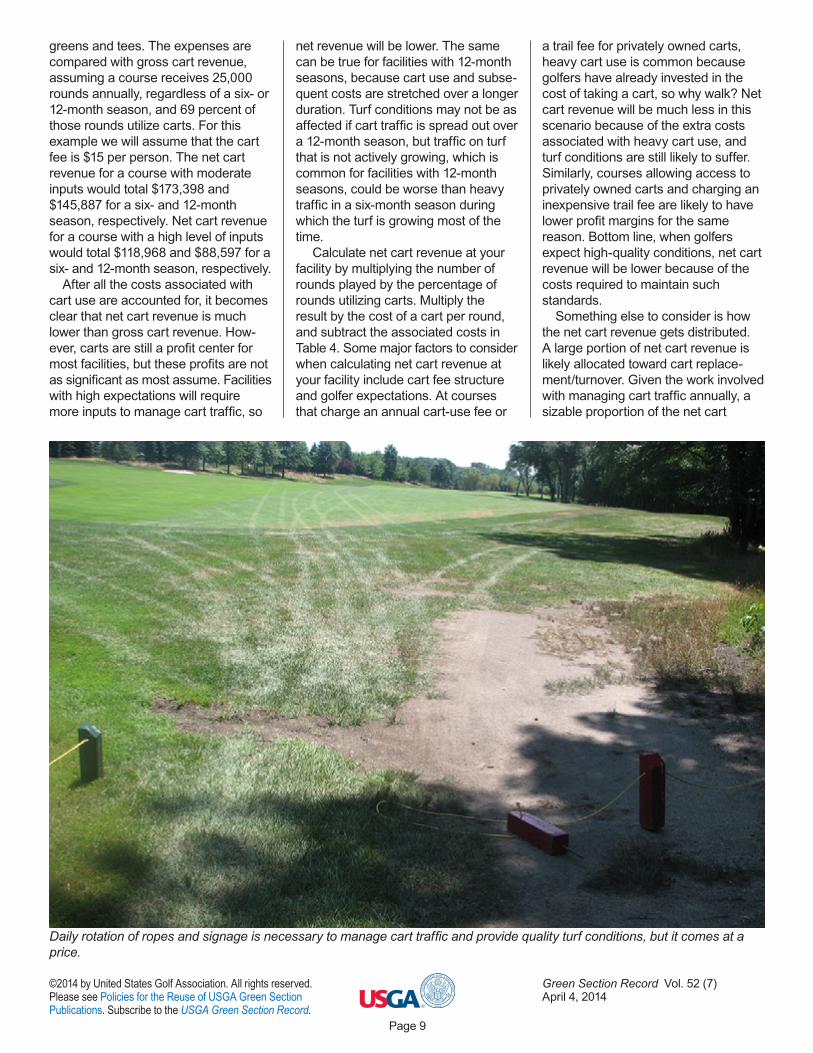
HIDDEN MAINTENANCE COSTSThere are many hidden maintenance costs that can be directly and indirectly linked to carts (Table 3). Ropes and signage are commonly used to help direct cart traffic. Diligent rotation of ropes and signage will result in evenly distributed wear patterns and better turf quality. The USGA Green Section Cart Use and Course Maintenance Interaction survey revealed that 58 and 40 percent of responding courses spent from six to more than 15 labor hours and one to five labor hours per week managing traffic patterns by moving ropes and signage, respectively (data not shown). For facilities spend- ing five labor hours per week to man- age traffic patterns at an estimated labor cost of $11 per hour (skilled employee), this equates to a cost of $1,430 and $2,860 for a six- and 12- month season, respectively. For facili- ties spending 10 labor hours per week, this equates to a cost of $2,860 and $5,720 for six- and 12-month seasons, respectively. On the high end, facilities spending 15 or more labor hours per week, this equates to a minimum cost of $4,290 and $8,580 for six- and 12-month seasons, respectively.
Page 6
Green Section Record Vol. 52 (7)April 4, 2014
©2014 by United States Golf Association. All rights reserved. Please see Policies for the Reuse of USGA Green Section Publications. Subscribe to the USGA Green Section Record.
Table 3Generalized Hidden Maintenance Costs Associated With Cart Traffic
Maintenance Practice Annual Cost 6-Month 12-Month Season Season
5 labor hours per week $1,430 $2,860Rope and signage 10 labor hours per week $2,860 $5,720management 15 labor hours per week $4,290 $8,580
Additional diesel fuel used to move ropes and $741 $1,820signage during rough and fairway mowing operations
Refurbishing and/or purchasing of new signage $1,500-$3,000
Sodding high-traffic Kentucky bluegrass or $2,966areas damaged by turf-type tall fescue cart traffic Bermudagrass $2,716
Site-specific management for high traffic areas $1,294
Rope and signage management is commonly performed by a skilled employee being paid on average $11 per hour.
It is estimated that 10% of the time to mow fairways and rough each week (75-100 labor hours) is dedicated to moving ropes and signage. Weekly diesel fuel consumption for most 18-hole facilities is ≈75 gallons per week for rough and fairway mowing. Diesel fuel price of $3.80 per gallon.
Purchasing new signage, ropes, and sanding and painting existing signage is common annually.
Sodding 5,000 square feet with bermudagrass ($0.20 per square foot) or Kentucky bluegrass or turf-type tall fescue ($0.25 per square foot) — 72 labor hours (3 skilled employees at $11 per hour, 3 days of work) is required.
Site-specific management for 5,000-square-foot high-traffic areas includes an extra hand-watering, fertilizer, aeration, and overseeding, requiring 112 labor hours from a skilled employee ($11 per hour). An 18-4-12 fertilizer applied at 1 pound of nitrogen per 1,000 square feet at $35 per 50-pound bag. Overseeding at 6 pounds per 1,000 square feet with perennial ryegrass or turf-type tall fescue at $70 per 50-pound bag.
Sodding damaged cart path entry/exit locations is a common project, even if it is a short-term fix.

Also, it takes additional time to mow fairways and rough when ropes and signage need to be moved by the operators independent of the normal rotation mentioned above. This impacts diesel fuel costs because equipment is often left idling while these items are moved. It is estimated that 10 percent of the time to mow fairways and rough each week (75-100 labor hours) is dedicated to moving ropes and sign- age. Weekly diesel fuel consumption for most 18-hole facilities is approxi- mately 75 gallons per week for rough and fairway mowing. The national average for diesel fuel is $3.80 per gallon, totaling an estimated annual diesel fuel cost of $7,410 and $14,820 for courses with six- and 12-month seasons, respectively. The 10 percent of diesel fuel linked to the extra mow- ing time associated with moving ropes
and signage accounts for $741 to $1,482 annually. It should also be noted that the increased engaging/disengaging of the cutting units after an operator moves the ropes and signage adds unquantifiable strain on the equipment engines and reduces performance as the equipment ages.
Ropes and signage must also be replaced and maintained on a routine schedule. Wooden posts are commonly used for directing cart traffic. The costs related to maintaining wooden posts, such as sanding and painting, can easily cost from $1,500 to in excess of $3,000 every year.
The primary cart path entry/exit points receive an extreme amount of traffic and, in many cases, turf in these areas declines regardless of the species selected, agronomic inputs, and traffic management efforts. As a
result, resodding several worn areas at the end of each season is common. Bermudagrass, Kentucky bluegrass, and turf-type tall fescue are the most commonly sodded species for high-traffic areas in the U.S. For this article we will assume that Kentucky bluegrass and turf-type tall fescue sod cost $0.25 per square foot and bermudagrass sod costs $0.20 per square foot, three skilled employees working 72 labor hours at $11 per hour are needed to complete 5,000 square feet of sod work, and one skilled employee making $11 per hour and working four labor hours per day for 21 days is needed to hand-water the sod. Therefore, if 5,000 square feet of sod work is needed annually to repair worn areas near cart paths, an estimated annual cost of $2,716 for bermudagrass and $2,966 for Kentucky bluegrass and turf-type
Page 7
Green Section Record Vol. 52 (7)April 4, 2014
©2014 by United States Golf Association. All rights reserved. Please see Policies for the Reuse of USGA Green Section Publications. Subscribe to the USGA Green Section Record.
Repairing cart path washouts is an expense associated with cart use that is often overlooked.

tall fescue can be expected. However, keep in mind that the final cost for sod- ding these areas may be substantially higher based on delivery expenses.
Highly trafficked turf adjacent to cart path entry/exit areas often receives site-specific hand-watering, fertilizer, aeration, and overseeding to improve vigor and resiliency. As with the example above, assume a minimum of 5,000 square feet of highly trafficked turf requires these additional inputs. Therefore, annual hand-watering inputs, such as one skilled employee working 80 labor hours at $11 per hour, would cost $880. An estimated 32 labor hours for two skilled employees at $11 per hour are needed for aeration, over- seeding, and fertilizing 5,000 square feet, costing an additional $352. The estimated fertilizer cost for a 1-pound application of nitrogen per 1,000 square feet using a product containing 18 percent nitrogen, 4 percent phos- phorus, and 12 percent potassium, and costing $35 per 50 lb. bag is an additional $20. Assuming seed costs $70 per 50 lb. bag, overseeding 5,000 square feet of high-traffic areas with traffic-tolerant species, such as peren- nial ryegrass or turf-type tall fescue, at 6 pounds per 1,000 square feet is estimated to cost $42. Sodding and site-specific hand-watering, fertilizing, aerating, and overseeding high-traffic areas requires a significant amount of additional labor hours because the sites are typically scattered throughout the course rather than in a unified area.
NET CART REVENUENow that all of the costs associated with carts, cart paths, and hidden maintenance programs to manage cart traffic are tallied, net cart revenue can be calculated. Net cart revenue is the difference between gross cart revenue and the costs mentioned above. An example of common costs of a cart fleet, cart path maintenance, and hidden maintenance associated with carts is included in Table 4, which separates courses with moderate and high levels of inputs with six- and 12-month seasons. These expenses assume a well-maintained fleet of 60 electric carts and asphalt paths around
Page 8
Green Section Record Vol. 52 (7)April 4, 2014
©2014 by United States Golf Association. All rights reserved. Please see Policies for the Reuse of USGA Green Section Publications. Subscribe to the USGA Green Section Record.
Table 4Total Cost of the Golf Cart Fleet, Cart Path Maintenance,
and Hidden Maintenance Costs Associated with Golf Carts
Expense Annual Cost 6-Month Season 12-Month Season Moderate High Moderate High Input Input Input InputGolf Cart Fleet CostsCart replacement $45,000 $75,000 $45,000 $75,000Routine maintenance $4,000 $8,000 $4,000 $8,000Electricity $10,000 $20,000Daily management $13,104 $26,208Cleaning supplies $200 $400 $200 $400Cart storage $2,000 $3,000 $2,000 $3,000
Cart Path Maintenance CostsRe-paving of asphalt cart paths $5,500 $13,750 $5,500 $13,750Cart path curbing with $0 $2,000 $0 $2,000Belgian blockCart path edging with Kentucky $0 $360 $0 $360bluegrass roughBlowing debris off cart paths $1,877 $3,775
Hidden Maintenance CostsRope and signage management $1,430 $4,290 $2,860 $8,580Refurbishing and/or purchasing $1,500 $3,000 $1,500 $3,000new signageAdditional diesel fuel used to move $741 $1,820ropes and signage during rough andfairway mowing operationsSodding high-traffic areas $0 $2,966 $0 $2,966damaged from cart trafficSite-specific management $0 $1,294 $0 $1,294for high-traffic areas
Total Expenses $85,352 $139,782 $112,863 $170,153
Gross Cart Revenue $258,750 $258,750 $258,750 $258,750
Net Cart Revenue $173,398 $118,968 $145,887 $88,597
These costs are based on the following assumptions:
1. The fleet is comprised of 60 electric carts.
2. Only asphalt paths exist, so in-season maintenance (e.g. washout repair) is not necessary.
3. General and skilled employee wages of $9 per hour and $11 per hour, respectively.
4. Gas and diesel fuel costs of $3.30 per gallon and $3.80 per gallon, respectively.
5. 25,000 rounds of golf are played annually, with 69% of those rounds utilizing carts with a cart fee of $15 per person.
6. Moderate input translates into lower expectations for course conditions compared to high input.
greens and tees. The expenses are compared with gross cart revenue, assuming a course receives 25,000 rounds annually, regardless of a six- or 12-month season, and 69 percent of those rounds utilize carts. For this example we will assume that the cart fee is $15 per person. The net cart revenue for a course with moderate inputs would total $173,398 and $145,887 for a six- and 12-month season, respectively. Net cart revenue for a course with a high level of inputs would total $118,968 and $88,597 for a six- and 12-month season, respectively.
After all the costs associated with cart use are accounted for, it becomes clear that net cart revenue is much lower than gross cart revenue. How- ever, carts are still a profit center for most facilities, but these profits are not as significant as most assume. Facilities with high expectations will require more inputs to manage cart traffic, so
net revenue will be lower. The same can be true for facilities with 12-month seasons, because cart use and subse- quent costs are stretched over a longer duration. Turf conditions may not be as affected if cart traffic is spread out over a 12-month season, but traffic on turf that is not actively growing, which is common for facilities with 12-month seasons, could be worse than heavy traffic in a six-month season during which the turf is growing most of the time.
Calculate net cart revenue at your facility by multiplying the number of rounds played by the percentage of rounds utilizing carts. Multiply the result by the cost of a cart per round, and subtract the associated costs in Table 4. Some major factors to consider when calculating net cart revenue at your facility include cart fee structure and golfer expectations. At courses that charge an annual cart-use fee or
a trail fee for privately owned carts, heavy cart use is common because golfers have already invested in the cost of taking a cart, so why walk? Net cart revenue will be much less in this scenario because of the extra costs associated with heavy cart use, and turf conditions are still likely to suffer. Similarly, courses allowing access to privately owned carts and charging an inexpensive trail fee are likely to have lower profit margins for the same reason. Bottom line, when golfers expect high-quality conditions, net cart revenue will be lower because of the costs required to maintain such standards.
Something else to consider is how the net cart revenue gets distributed. A large portion of net cart revenue is likely allocated toward cart replace- ment/turnover. Given the work involved with managing cart traffic annually, a sizable proportion of the net cart
Page 9
Green Section Record Vol. 52 (7)April 4, 2014
©2014 by United States Golf Association. All rights reserved. Please see Policies for the Reuse of USGA Green Section Publications. Subscribe to the USGA Green Section Record.
Daily rotation of ropes and signage is necessary to manage cart traffic and provide quality turf conditions, but it comes at a price.

revenue should be distributed to the maintenance department.
Another thought-provoking question is what happens if cart use is reduced. Would fewer golfers play if carts are not as readily available? During a severe drought in the Southern and Midwestern states, fewer rounds played were reported at facilities that limited cart use to paths only. It is impossible to predict how significantly rounds played will be affected by re- duced cart use, but given the fact that golf has transformed from a walking to a riding game for many, it is a concern that cannot be ignored. With less cart use, gross cart revenue will be less, but net cart revenue may not be impacted because of the costs associated with their use. Superintendents fertilize and irrigate fairways and rough partially based on how much traffic the turf experiences and the desires of the clientele. The USGA Green Section Cart Use and Course Maintenance Interaction survey revealed that 75 percent of the participating facilities felt they would be able to reduce fertility inputs and water usage if cart use was reduced by 50 percent. The availability and cost of water is regionally depend- ent, but annual fees for municipal water could range from $50,000 to $75,000 in the Northeast to $850,000 or more in the Southwest. A small reduction in water use can result in significant long-term savings. The same is true with fertility inputs. Many courses spend $25,000 or more to fertilize fairways and roughs annually. A reduction in cart traffic can pay dividends over time by dramatically improving turf conditions while reducing irrigation and fertilizer inputs.
CONCLUSIONGiven the net cart revenue at many facilities, it will not be surprising if there is no change in cart use in the near future. However, it is important to quantify all of the associated costs of carts and their impact on turf condi- tions. It is impossible to put a value on high-quality turf, but good conditions are a driving factor of where golfers play. The Country Club in Massachu- setts, Merion Golf Club in Pennsylvania, Course No. 2 at the Pinehurst Resort,
Seminole Golf Club in Florida, Shoal Creek in Alabama, Erin Hills Golf Course in Wisconsin, Cypress Point Club in California, and Bandon Dunes Golf Resort in Oregon are highly successful golf courses with excellent turf conditions in the fairways and rough. Each of these facilities has very limited cart use. If the conditions are not meeting expectations in the fair- ways or rough at your facility, look closely at cart use. Less cart traffic will improve turf conditions. Golf was born as a walking sport and, although carts are a major part of the game, they are not necessary for the majority. The net revenue from carts is important for many facilities, but it does not need to be the foundation for success.
ACKNOWLEDGEMENTSSpecial thanks to all those who filled out the USGA Green Section Cart Use and Maintenance Interactions survey, as well as the superintendents who
provided personal feedback and examples related to carts and their associated costs.
LITERATURE CITEDKnuth. D. 1993. Pace Rating Survey. USGA.
National Golf Foundation. Personal Communication.
Oatis, D.A. 1994. Common Sense Cart Paths. USGA Green Section Record. January/February. 32(1): p.1-5.
Wienecke, D. L. 2004. Letting the Numbers Tell the Story on Cart Damage. USGA Green Section Record. November/December. 42(6): p. 11-14.
USGA. 1995. A Call to Feet.
ADAM MOELLER is an agronomist in the Northeast region.
Page 10
Green Section Record Vol. 52 (7)April 4, 2014
©2014 by United States Golf Association. All rights reserved. Please see Policies for the Reuse of USGA Green Section Publications. Subscribe to the USGA Green Section Record.
Golf at St. Andrews Links, along with many others in the U.S., has limited cart use to preserve turf conditions and the traditions of the game.