google analytics training book - now free
DESCRIPTION
You can download my book just by sending a Tweet: To download visit my blog: http://www antoniogarciaperez.blogspot.comTRANSCRIPT

Training Book by Antonio Garcia
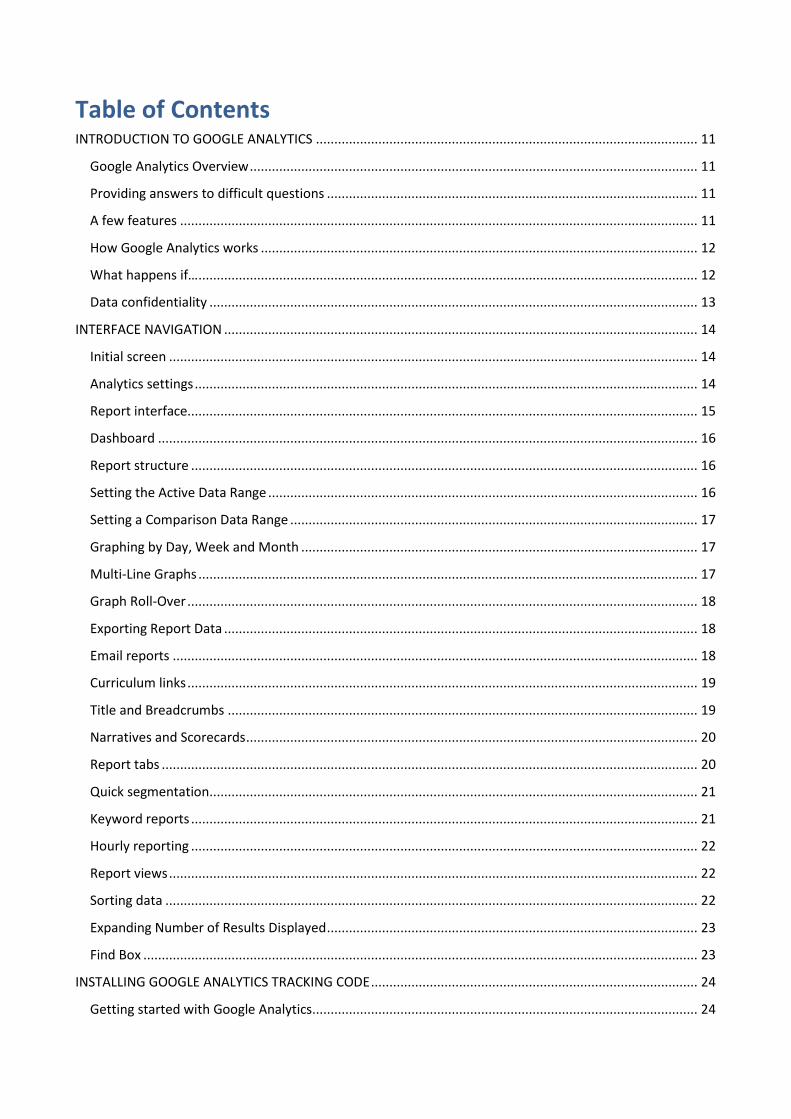
Table of Contents INTRODUCTION TO GOOGLE ANALYTICS ........................................................................................................ 11
Google Analytics Overview .......................................................................................................................... 11
Providing answers to difficult questions ..................................................................................................... 11
A few features ............................................................................................................................................. 11
How Google Analytics works ....................................................................................................................... 12
What happens if… ........................................................................................................................................ 12
Data confidentiality ..................................................................................................................................... 13
INTERFACE NAVIGATION ................................................................................................................................. 14
Initial screen ................................................................................................................................................ 14
Analytics settings ......................................................................................................................................... 14
Report interface........................................................................................................................................... 15
Dashboard ................................................................................................................................................... 16
Report structure .......................................................................................................................................... 16
Setting the Active Data Range ..................................................................................................................... 16
Setting a Comparison Data Range ............................................................................................................... 17
Graphing by Day, Week and Month ............................................................................................................ 17
Multi-Line Graphs ........................................................................................................................................ 17
Graph Roll-Over ........................................................................................................................................... 18
Exporting Report Data ................................................................................................................................. 18
Email reports ............................................................................................................................................... 18
Curriculum links ........................................................................................................................................... 19
Title and Breadcrumbs ................................................................................................................................ 19
Narratives and Scorecards ........................................................................................................................... 20
Report tabs .................................................................................................................................................. 20
Quick segmentation..................................................................................................................................... 21
Keyword reports .......................................................................................................................................... 21
Hourly reporting .......................................................................................................................................... 22
Report views ................................................................................................................................................ 22
Sorting data ................................................................................................................................................. 22
Expanding Number of Results Displayed ..................................................................................................... 23
Find Box ....................................................................................................................................................... 23
INSTALLING GOOGLE ANALYTICS TRACKING CODE ......................................................................................... 24
Getting started with Google Analytics ......................................................................................................... 24

Create a New Account ................................................................................................................................. 24
Google Analytics Tracking Code (GATC) ...................................................................................................... 24
Finding your Tracking Code ......................................................................................................................... 25
Understanding the Tracking Code ............................................................................................................... 25
Custom Website Setups .............................................................................................................................. 26
Installing the JavaScript ............................................................................................................................... 26
Using GA with Adwords and Other Products .............................................................................................. 26
Verifying Installation ........................................................................................................................................ 27
Checking reports for Data ............................................................................................................................ 27
Checking Source Code ................................................................................................................................. 27
INTERPRETING REPORTS.................................................................................................................................. 28
Guidelines ........................................................................................................................................................ 28
Contextual Help Resources .......................................................................................................................... 28
Create Context for your Data ...................................................................................................................... 28
Creating Context with Visualizations ........................................................................................................... 29
Looking for trends ....................................................................................................................................... 29
Investigating Changes in Trends .................................................................................................................. 30
Data Driven Decision Making ...................................................................................................................... 30
Pageviews, Visits and Visitors .......................................................................................................................... 31
Pageview ...................................................................................................................................................... 31
Visit .............................................................................................................................................................. 31
Visitor........................................................................................................................................................... 31
Pageviews, Visits and Visitors – The basics ................................................................................................. 31
Pageviews vs. Unique Pageviews ................................................................................................................ 32
“Absolute Unique” vs. “New vs. Returning” ................................................................................................ 33
Pageviews, Visits and Visitors in Your Reports ............................................................................................ 33
Time metrics .................................................................................................................................................... 34
Time on page ............................................................................................................................................... 34
Time on Site ................................................................................................................................................. 34
“Avg. Time on Page” vs. “Avg. Time on Site” .............................................................................................. 35
Flash-based sites .......................................................................................................................................... 35
“Length of Visit” vs. “Average Time on Site” ............................................................................................... 35
Traffic Sources ................................................................................................................................................. 36
Traffic Sources Reports ................................................................................................................................ 36

Traffic Sources Explained ............................................................................................................................. 36
What Makes a Good Source of Traffic? ....................................................................................................... 36
All Traffic Sources ........................................................................................................................................ 37
Revenue and Conversion Drivers ................................................................................................................ 38
Keyword Report ........................................................................................................................................... 38
Campaign Attribution .................................................................................................................................. 40
Content Reports .............................................................................................................................................. 41
Top Content, Content by Title, Content Drilldown ...................................................................................... 41
Why I am seeing “/” in my reports? ............................................................................................................ 41
Top Landing Pages ....................................................................................................................................... 42
Navigation Analysis .......................................................................................................................................... 42
Navigation Summary ................................................................................................................................... 42
Why Are “Previous Page” and “Next Page” the same? ............................................................................... 43
Entrance Paths Reports ............................................................................................................................... 43
Additional Content Reports & Drill-Down ................................................................................................... 44
ACCOUNTS AND PROFILES ............................................................................................................................... 45
The Analytics Settings Screen ...................................................................................................................... 45
Analytics Accounts ....................................................................................................................................... 45
Creating a New Account .............................................................................................................................. 46
User Manager .............................................................................................................................................. 46
“Administrators” and “Users” ..................................................................................................................... 47
Add/Delete Users and Edit User Info .......................................................................................................... 47
Adding a New User ...................................................................................................................................... 47
Granting Access to a User ............................................................................................................................ 47
Modifying Access ......................................................................................................................................... 47
Managing Access and Accounts .................................................................................................................. 48
Changing for Login Email Address ............................................................................................................... 48
Profiles ......................................................................................................................................................... 48
Using Profiles ............................................................................................................................................... 49
Profile definition .......................................................................................................................................... 49
Adding a New Profile ................................................................................................................................... 50
Edit Profile ................................................................................................................................................... 50
Removing Profiles ........................................................................................................................................ 51
CAMPAIGN TRACKING AND ADWORDS INTEGRATION ................................................................................... 52
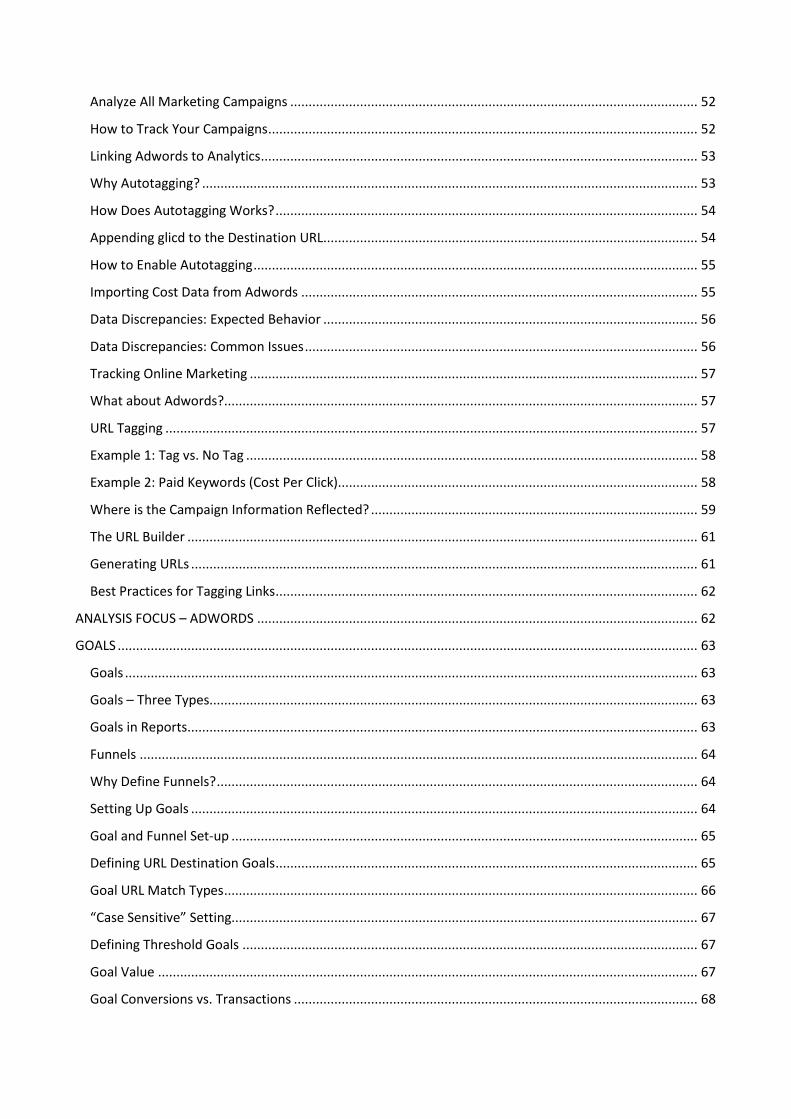
Analyze All Marketing Campaigns ............................................................................................................... 52
How to Track Your Campaigns ..................................................................................................................... 52
Linking Adwords to Analytics ....................................................................................................................... 53
Why Autotagging? ....................................................................................................................................... 53
How Does Autotagging Works? ................................................................................................................... 54
Appending glicd to the Destination URL...................................................................................................... 54
How to Enable Autotagging ......................................................................................................................... 55
Importing Cost Data from Adwords ............................................................................................................ 55
Data Discrepancies: Expected Behavior ...................................................................................................... 56
Data Discrepancies: Common Issues ........................................................................................................... 56
Tracking Online Marketing .......................................................................................................................... 57
What about Adwords?................................................................................................................................. 57
URL Tagging ................................................................................................................................................. 57
Example 1: Tag vs. No Tag ........................................................................................................................... 58
Example 2: Paid Keywords (Cost Per Click).................................................................................................. 58
Where is the Campaign Information Reflected? ......................................................................................... 59
The URL Builder ........................................................................................................................................... 61
Generating URLs .......................................................................................................................................... 61
Best Practices for Tagging Links ................................................................................................................... 62
ANALYSIS FOCUS – ADWORDS ........................................................................................................................ 62
GOALS .............................................................................................................................................................. 63
Goals ............................................................................................................................................................ 63
Goals – Three Types..................................................................................................................................... 63
Goals in Reports ........................................................................................................................................... 63
Funnels ........................................................................................................................................................ 64
Why Define Funnels? ................................................................................................................................... 64
Setting Up Goals .......................................................................................................................................... 64
Goal and Funnel Set-up ............................................................................................................................... 65
Defining URL Destination Goals ................................................................................................................... 65
Goal URL Match Types ................................................................................................................................. 66
“Case Sensitive” Setting............................................................................................................................... 67
Defining Threshold Goals ............................................................................................................................ 67
Goal Value ................................................................................................................................................... 67
Goal Conversions vs. Transactions .............................................................................................................. 68

Filter & Goal Tracking .................................................................................................................................. 68
Funnel Reporting ......................................................................................................................................... 68
Reverse Goal Path Reporting ....................................................................................................................... 69
ANALYSIS FOCUS – FUNNEL VISUALIZATION ................................................................................................... 71
Funnel Visualization Report ......................................................................................................................... 71
Finding the Report and Selecting a Goal ..................................................................................................... 72
Funnel Entrance Pages ................................................................................................................................ 72
Funnel Exit Pages ......................................................................................................................................... 73
Progressing Through the Funnel ................................................................................................................. 73
Understanding the Numbers ....................................................................................................................... 74
FILTERS ............................................................................................................................................................. 75
Overview ...................................................................................................................................................... 75
How Do Filters Work? .................................................................................................................................. 76
How to Set-up Filters ................................................................................................................................... 76
Predefined Filters ........................................................................................................................................ 77
Best Practices for Filters .............................................................................................................................. 77
Creating Custom Filters ............................................................................................................................... 77
Filter Types .................................................................................................................................................. 78
Example: Search and Replace Filter ............................................................................................................ 79
Filters and Profiles ....................................................................................................................................... 80
Customize Data Views ................................................................................................................................. 80
How to Include Only Google Adwords Traffic ............................................................................................. 81
Tracking Subdomains ................................................................................................................................... 81
Best Practices for Filters & Profiles ............................................................................................................. 82
Best Practices for Include and Exclude Filters ............................................................................................. 82
Filtering AdWords Data ............................................................................................................................... 82
One AdWords Account, Multiple URLs ........................................................................................................ 83
Filters for Cost Sources ................................................................................................................................ 83
REGULAR EXPRESSIONS ................................................................................................................................... 84
Regular Expressions (RegEx) ........................................................................................................................ 84
Dot . ............................................................................................................................................................. 84
Backslash \ ................................................................................................................................................... 84
Character Sets and Ranges [] ....................................................................................................................... 85
Quantifiers and Repetition ? + * .................................................................................................................. 85
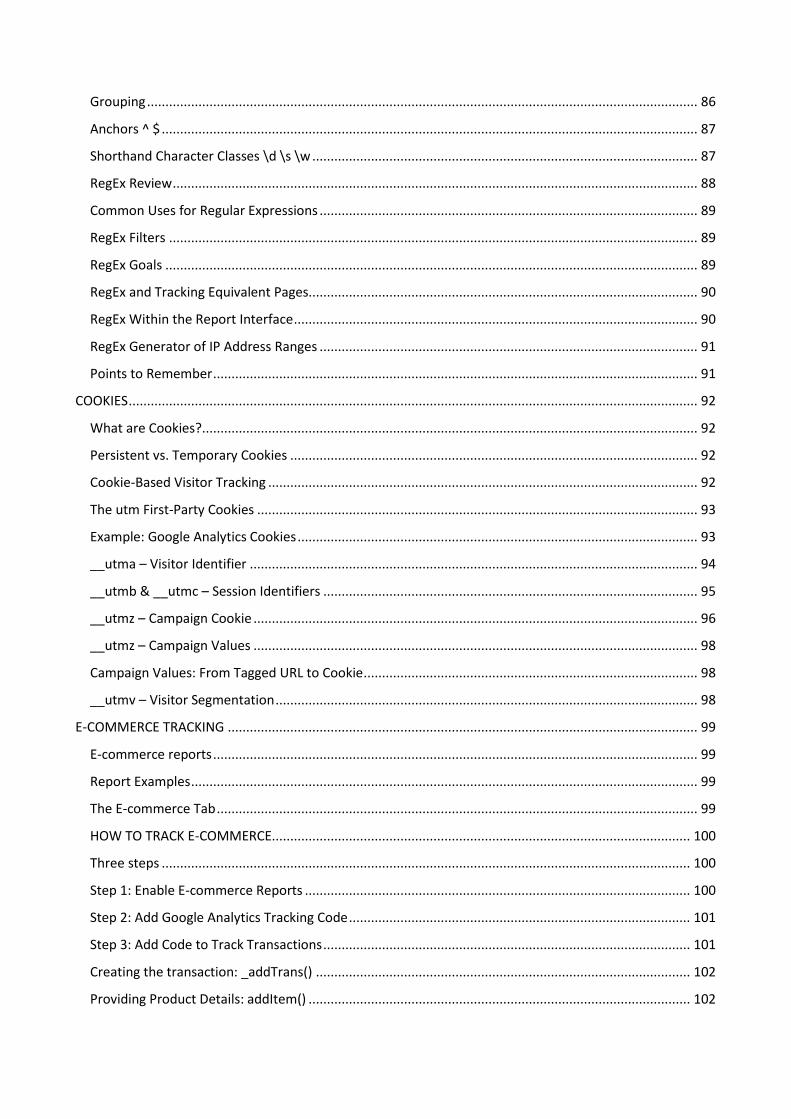
Grouping ...................................................................................................................................................... 86
Anchors ^ $ .................................................................................................................................................. 87
Shorthand Character Classes \d \s \w ......................................................................................................... 87
RegEx Review ............................................................................................................................................... 88
Common Uses for Regular Expressions ....................................................................................................... 89
RegEx Filters ................................................................................................................................................ 89
RegEx Goals ................................................................................................................................................. 89
RegEx and Tracking Equivalent Pages.......................................................................................................... 90
RegEx Within the Report Interface .............................................................................................................. 90
RegEx Generator of IP Address Ranges ....................................................................................................... 91
Points to Remember .................................................................................................................................... 91
COOKIES ........................................................................................................................................................... 92
What are Cookies? ....................................................................................................................................... 92
Persistent vs. Temporary Cookies ............................................................................................................... 92
Cookie-Based Visitor Tracking ..................................................................................................................... 92
The utm First-Party Cookies ........................................................................................................................ 93
Example: Google Analytics Cookies ............................................................................................................. 93
__utma – Visitor Identifier .......................................................................................................................... 94
__utmb & __utmc – Session Identifiers ...................................................................................................... 95
__utmz – Campaign Cookie ......................................................................................................................... 96
__utmz – Campaign Values ......................................................................................................................... 98
Campaign Values: From Tagged URL to Cookie ........................................................................................... 98
__utmv – Visitor Segmentation ................................................................................................................... 98
E-COMMERCE TRACKING ................................................................................................................................ 99
E-commerce reports .................................................................................................................................... 99
Report Examples .......................................................................................................................................... 99
The E-commerce Tab ................................................................................................................................... 99
HOW TO TRACK E-COMMERCE.................................................................................................................. 100
Three steps ................................................................................................................................................ 100
Step 1: Enable E-commerce Reports ......................................................................................................... 100
Step 2: Add Google Analytics Tracking Code ............................................................................................. 101
Step 3: Add Code to Track Transactions .................................................................................................... 101
Creating the transaction: _addTrans() ...................................................................................................... 102
Providing Product Details: addItem() ........................................................................................................ 102

Recording the Transaction: _trackTrans() ................................................................................................. 103
Secure Pages .............................................................................................................................................. 103
Shopping Carts on Other Domains or Subdomains ................................................................................... 104
REVENUE METRICS ........................................................................................................................................ 105
Goal Value ................................................................................................................................................. 105
Revenue ..................................................................................................................................................... 105
Goal Value + Revenue ................................................................................................................................ 106
What is $ Index? ........................................................................................................................................ 106
$ Index Calculation .................................................................................................................................... 106
Important Points about $ Index ................................................................................................................ 107
TRACKING DOMAINS AND SUBDOMAINS ..................................................................................................... 108
Understanding Domains ............................................................................................................................ 108
Tracking Across Domains Doesn´t Happen Automatically ........................................................................ 108
The _link() Method .................................................................................................................................... 108
Tracking Across Domains (Step 1) ............................................................................................................. 109
Tracking Across Domains (Step 2) ............................................................................................................. 109
Forms and _linkByPost() Method .............................................................................................................. 110
Subdomains ............................................................................................................................................... 110
Tracking Subdomains Using _setDomainName() ...................................................................................... 111
Best Practice #1 for Tracking Subdomains ................................................................................................ 111
Best Practice #2 for Tracking Subdomains ................................................................................................ 112
Multiple Domains with Subdomains (Step 1) ............................................................................................ 112
Multiple Domains with Subdomains (Step 2) ............................................................................................ 113
CUSTOM REPORTING ..................................................................................................................................... 114
Designing a Custom Report ....................................................................................................................... 114
Creating a Custom Report ......................................................................................................................... 114
Adding a Title and Tabs ............................................................................................................................. 115
Adding Metrics .......................................................................................................................................... 115
Adding Dimensions .................................................................................................................................... 116
Previewing and Saving the Report............................................................................................................. 116
Viewing and Accessing the Report ............................................................................................................ 117
Deleting a Report ....................................................................................................................................... 117
Editing a Report ......................................................................................................................................... 118
ADVANCED SEGMENTATION ......................................................................................................................... 119
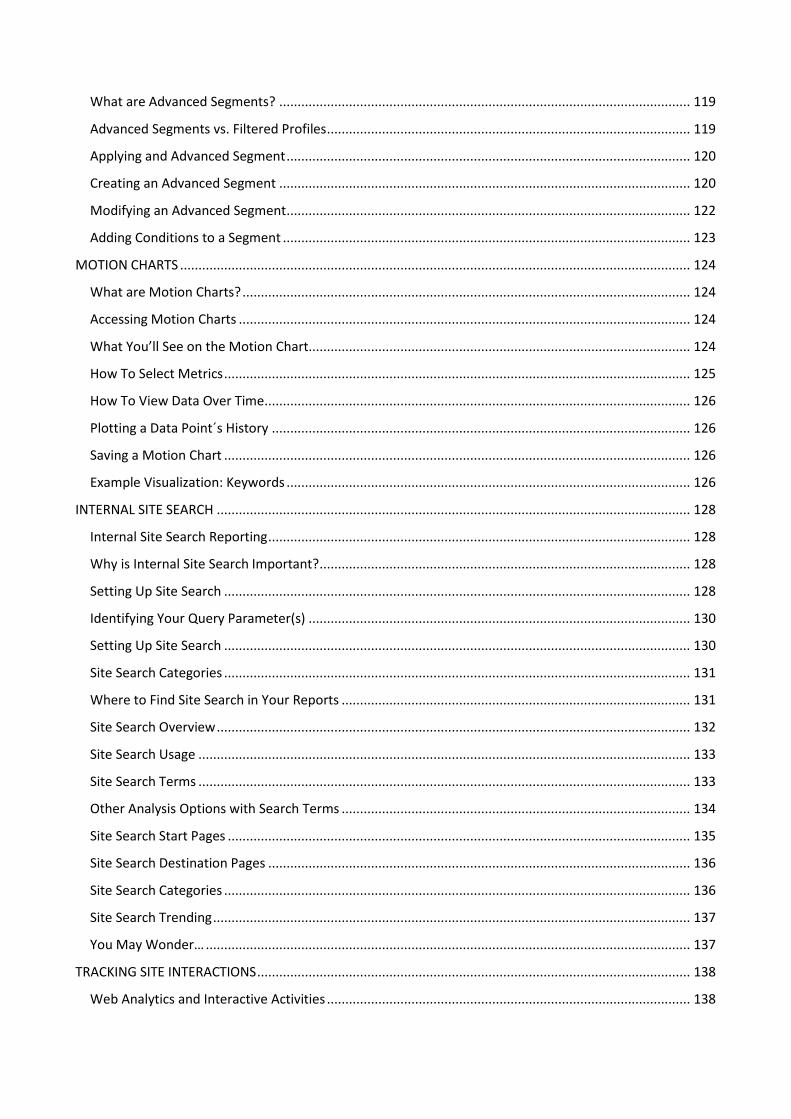
What are Advanced Segments? ................................................................................................................ 119
Advanced Segments vs. Filtered Profiles ................................................................................................... 119
Applying and Advanced Segment .............................................................................................................. 120
Creating an Advanced Segment ................................................................................................................ 120
Modifying an Advanced Segment .............................................................................................................. 122
Adding Conditions to a Segment ............................................................................................................... 123
MOTION CHARTS ........................................................................................................................................... 124
What are Motion Charts? .......................................................................................................................... 124
Accessing Motion Charts ........................................................................................................................... 124
What You’ll See on the Motion Chart........................................................................................................ 124
How To Select Metrics ............................................................................................................................... 125
How To View Data Over Time .................................................................................................................... 126
Plotting a Data Point´s History .................................................................................................................. 126
Saving a Motion Chart ............................................................................................................................... 126
Example Visualization: Keywords .............................................................................................................. 126
INTERNAL SITE SEARCH ................................................................................................................................. 128
Internal Site Search Reporting ................................................................................................................... 128
Why is Internal Site Search Important? ..................................................................................................... 128
Setting Up Site Search ............................................................................................................................... 128
Identifying Your Query Parameter(s) ........................................................................................................ 130
Setting Up Site Search ............................................................................................................................... 130
Site Search Categories ............................................................................................................................... 131
Where to Find Site Search in Your Reports ............................................................................................... 131
Site Search Overview ................................................................................................................................. 132
Site Search Usage ...................................................................................................................................... 133
Site Search Terms ...................................................................................................................................... 133
Other Analysis Options with Search Terms ............................................................................................... 134
Site Search Start Pages .............................................................................................................................. 135
Site Search Destination Pages ................................................................................................................... 136
Site Search Categories ............................................................................................................................... 136
Site Search Trending .................................................................................................................................. 137
You May Wonder… .................................................................................................................................... 137
TRACKING SITE INTERACTIONS ...................................................................................................................... 138
Web Analytics and Interactive Activities ................................................................................................... 138

Virtual Pageviews ...................................................................................................................................... 138
Example Code ............................................................................................................................................ 139
Use of Virtual Pageviews ........................................................................................................................... 139
Best Practices for Creating Virtual Pageviews ........................................................................................... 140
Event Tracking ........................................................................................................................................... 140
Call _trackEvent() to Register an Event ..................................................................................................... 141
Example: Tracking a Flash Video Player .................................................................................................... 141
Categories .................................................................................................................................................. 142
Actions ....................................................................................................................................................... 143
Labels ......................................................................................................................................................... 143
Values ........................................................................................................................................................ 144
Total Events vs. Unique Events .................................................................................................................. 144
Best Practices for Setting Up Event Tracking ............................................................................................ 145
Advantages of Event Tracking over Virtual Pageviews .............................................................................. 145
ADDITIONAL CUSTOMIZATIONS .................................................................................................................... 146
How to Change Session Timeout Value ..................................................................................................... 146
How to Change Campaign Expiration ........................................................................................................ 146
How to Change Campaign Precedence ..................................................................................................... 147
How to Add Search Engines ....................................................................................................................... 147
How to Treat Certain Keywords as Direct ................................................................................................. 148
Treat Certain Referring Sites as Direct ...................................................................................................... 149
INTRODUCTION TO GOOGLE ANALYTICS
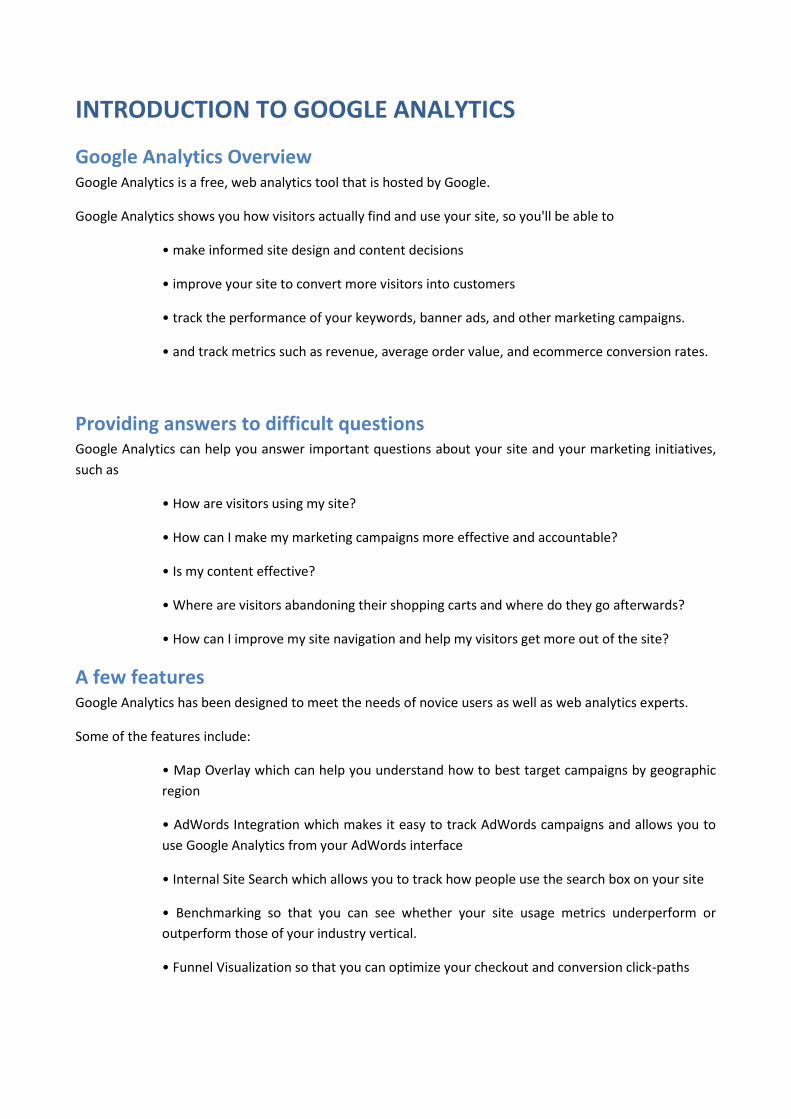
Google Analytics Overview Google Analytics is a free, web analytics tool that is hosted by Google.
Google Analytics shows you how visitors actually find and use your site, so you'll be able to
• make informed site design and content decisions
• improve your site to convert more visitors into customers
• track the performance of your keywords, banner ads, and other marketing campaigns.
• and track metrics such as revenue, average order value, and ecommerce conversion rates.
Providing answers to difficult questions Google Analytics can help you answer important questions about your site and your marketing initiatives,
such as
• How are visitors using my site?
• How can I make my marketing campaigns more effective and accountable?
• Is my content effective?
• Where are visitors abandoning their shopping carts and where do they go afterwards?
• How can I improve my site navigation and help my visitors get more out of the site?
A few features Google Analytics has been designed to meet the needs of novice users as well as web analytics experts.
Some of the features include:
• Map Overlay which can help you understand how to best target campaigns by geographic
region
• AdWords Integration which makes it easy to track AdWords campaigns and allows you to
use Google Analytics from your AdWords interface
• Internal Site Search which allows you to track how people use the search box on your site
• Benchmarking so that you can see whether your site usage metrics underperform or
outperform those of your industry vertical.
• Funnel Visualization so that you can optimize your checkout and conversion click-paths
How Google Analytics works Here’s how Google Analytics works.
When a visitor accesses a page on your site, a request is made to the webserver to display the
page.
The page is served and the Google Analytics Tracking Code JavaScript is executed.
The Google Analytics Tracking Code, which is a snippet of code that you place on each page of your
site, calls the trackPageView() method.
At this point, the Google Analytics first-party cookies are read and/or written.
The webpage then sends an invisible gif request containing all the data to the secure Google
Analytics reporting server, where the data is captured and processed.
Data is processed regularly throughout the day and you can see the results in your reports.
What happens if… Google Analytics uses only first-party cookies, which are considered safe and non-intrusive by most internet
users today.
Although many people block third-party cookies from being set by their web browsers, this won’t affect
Google Analytics.
Someone who blocks all cookies, however, won’t be tracked by Google Analytics since all the data is passed
to the Google Analytics servers via the first-party cookies.
Someone who deletes their cookies will still be tracked, but they’ll be identified as a new visitor to the site
and Google Analytics won’t be able to attribute their conversions to a prior referring campaign.
People delete cookies for many reasons, one of which is to prevent personal data from being captured or
reported. But, note that Google Analytics does not report on personally identifiable information. You’ll
learn more about cookies as they relate to Google Analytics in a later module.
A much less common scenario is that a visitor to your site has disabled JavaScript on his or her browser. A
visitor who disables JavaScript won’t be tracked since the Google Analytics Tracking Code cannot be
executed.
Cached pages are saved on a visitor’s local machine and so they’re not served by the webserver. Google
Analytics will still track visits to cached pages as long as the visitor is connected to the internet.
JavaScript errors occur when an element of a web page’s script contains an error or fails to execute
correctly. If an error occurs before the Google Analytics Tracking Code is executed, the visit to the page
won’t be tracked.
In general, no reporting tool can ever be 100% accurate. You’ll get the most out of web analytics if you
focus on trends. Knowing that 20% more visitors converted following a marketing campaign is more
powerful than knowing that exactly 10 people visited your site today.

Data confidentiality All data collected by Google Analytics is anonymous, including where visitors comes from, how the visitors
navigate through the site, and other actions they may perform.
No personally identifiable information is collected.
Google does not share Analytics data with any 3rd parties.
Furthermore, Google optimization, support, and sales staff may only access a client’s data with the client’s
permission. You can give permission verbally, over email or through a support ticket that asks for help with
a problem or asks a question about your data.
You may elect to share your Google Analytics data “with other Google products”, and Google will use the
data to improve the products and services we provide you. Electing to share your data “Anonymously with
Google and others” allows you to use benchmarking. To provide benchmarking, Google removes all
identifiable information about your website, then combines the data with hundreds of other anonymous
sites in comparable industries and reports them in an aggregate form.
If you select "do not share my Google Analytics data", you will not be able to use benchmarking and may
not have access to specific ads-related features such as Conversion Optimizer.
Again, regardless of your Data Sharing selections, Google does not share Analytics data with any 3rd
parties.
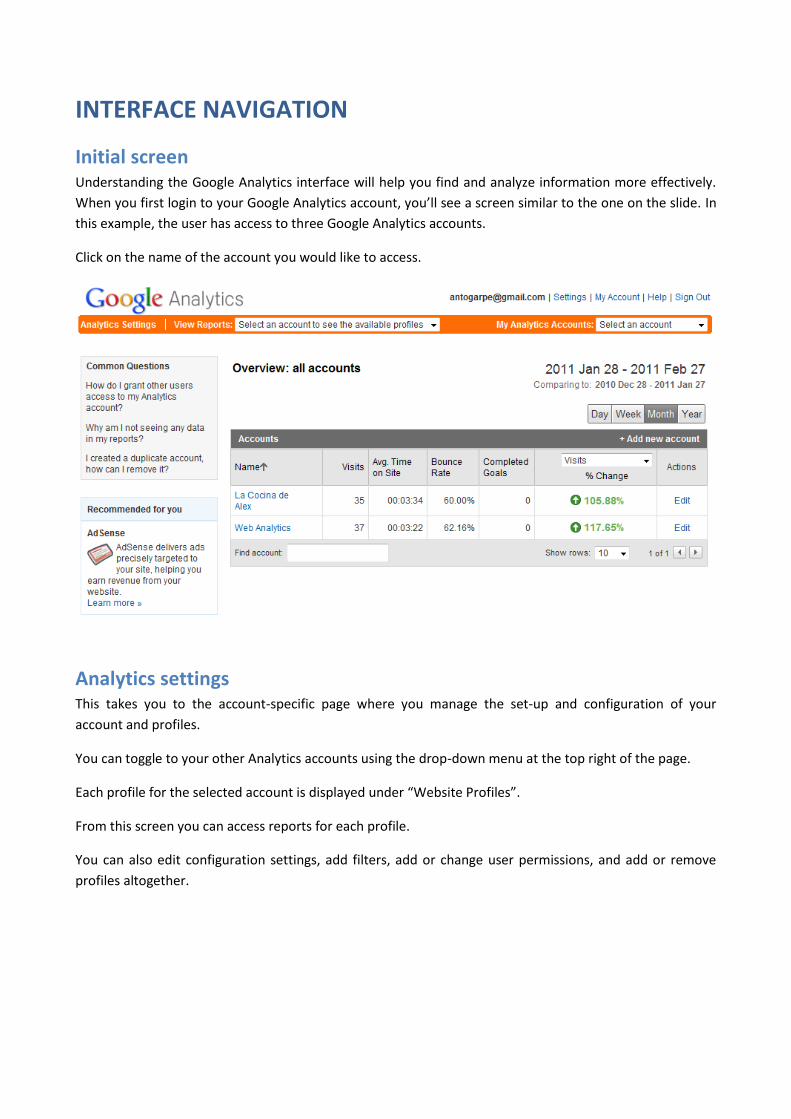
INTERFACE NAVIGATION
Initial screen Understanding the Google Analytics interface will help you find and analyze information more effectively.
When you first login to your Google Analytics account, you’ll see a screen similar to the one on the slide. In
this example, the user has access to three Google Analytics accounts.
Click on the name of the account you would like to access.
Analytics settings This takes you to the account-specific page where you manage the set-up and configuration of your
account and profiles.
You can toggle to your other Analytics accounts using the drop-down menu at the top right of the page.
Each profile for the selected account is displayed under “Website Profiles”.
From this screen you can access reports for each profile.
You can also edit configuration settings, add filters, add or change user permissions, and add or remove
profiles altogether.
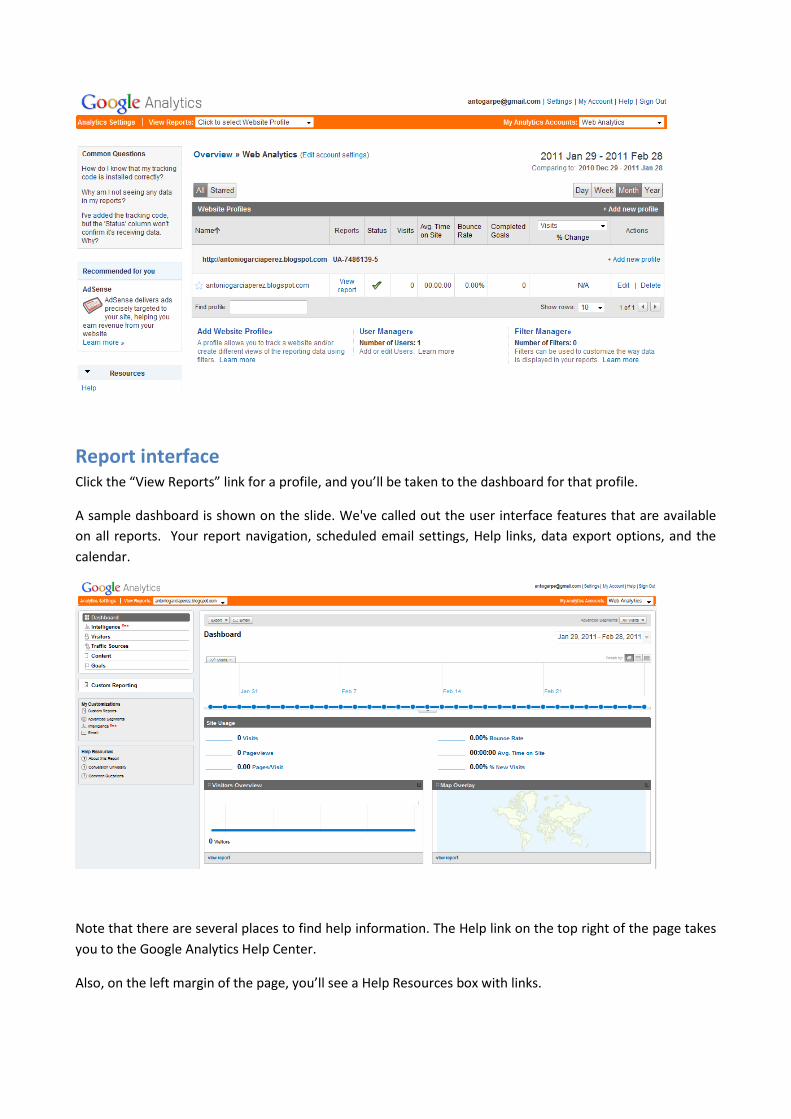
Report interface Click the “View Reports” link for a profile, and you’ll be taken to the dashboard for that profile.
A sample dashboard is shown on the slide. We've called out the user interface features that are available
on all reports. Your report navigation, scheduled email settings, Help links, data export options, and the
calendar.
Note that there are several places to find help information. The Help link on the top right of the page takes
you to the Google Analytics Help Center.
Also, on the left margin of the page, you’ll see a Help Resources box with links.
Dashboard The dashboard is where you put all the summary information about your site that you want to see at a
glance.
To add a report to the dashboard, just go to the report you want to add and then click Add to Dashboard.
On the dashboard itself, you can position the report summaries however you like and delete the ones you
don't need.
Report structure In the left hand navigation, you'll see that your reports are organized into categories: Visitors, Traffic
Sources, Content, Goals, and Ecommerce.
If you don’t have an ecommerce site or don’t have ecommerce reporting enabled, you
won’t see the ecommerce section in your navigation.
To view reports, click on any of the categories and the reports available within that
category will appear.
Some reports contain additional sub-reports, like the AdWords report under Traffic
Sources.
Click the arrow to see the sub-reports.
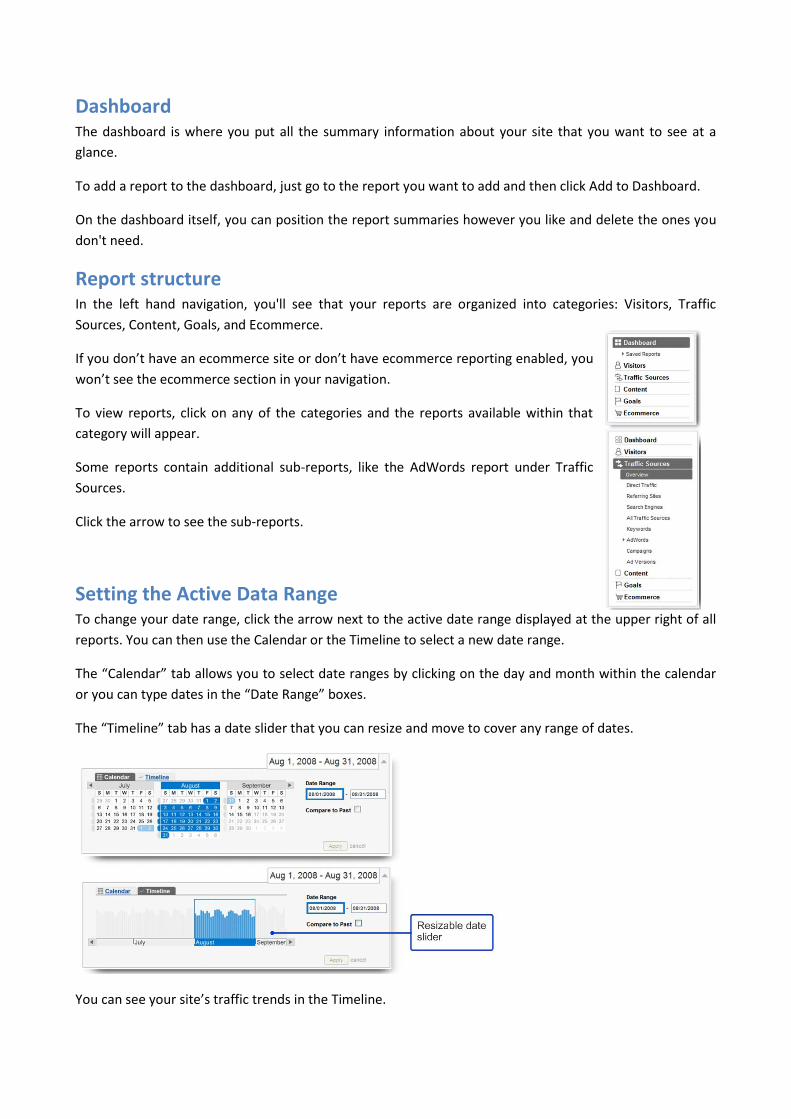
Setting the Active Data Range To change your date range, click the arrow next to the active date range displayed at the upper right of all
reports. You can then use the Calendar or the Timeline to select a new date range.
The “Calendar” tab allows you to select date ranges by clicking on the day and month within the calendar
or you can type dates in the “Date Range” boxes.
The “Timeline” tab has a date slider that you can resize and move to cover any range of dates.
You can see your site’s traffic trends in the Timeline.

Setting a Comparison Data Range You can select a date range to compare to the current selected date range.
When using the Timeline to set a comparison date range, you’ll see two date sliders instead of just one.
You can use a comparison date range to see how your site is performing month over month, year over year
or even from one day to another.
The date range and comparison date ranges you select will apply to all your reports and graphs.
Graphing by Day, Week and Month Most reports include an over-time graph at the top. You can make this graph display data by day, week, or
month.
Multi-Line Graphs You can also compare two metrics on the same graph to see how they are correlated.
Click the arrow in the top left of the graph.
Then, click the Compare Two Metrics link and select which two metrics you want to compare.
In this example, we’re graphing visitors versus average time on site.
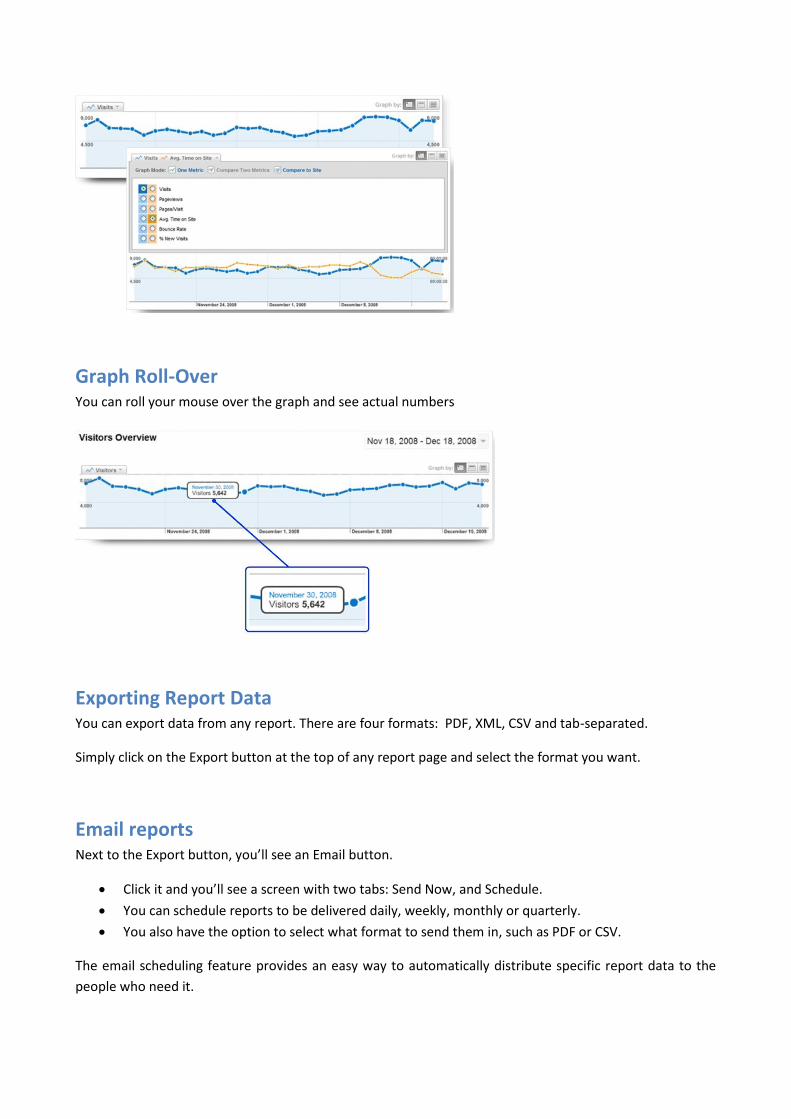
Graph Roll-Over You can roll your mouse over the graph and see actual numbers
Exporting Report Data You can export data from any report. There are four formats: PDF, XML, CSV and tab-separated.
Simply click on the Export button at the top of any report page and select the format you want.
Email reports Next to the Export button, you’ll see an Email button.
Click it and you’ll see a screen with two tabs: Send Now, and Schedule.
You can schedule reports to be delivered daily, weekly, monthly or quarterly.
You also have the option to select what format to send them in, such as PDF or CSV.
The email scheduling feature provides an easy way to automatically distribute specific report data to the
people who need it.
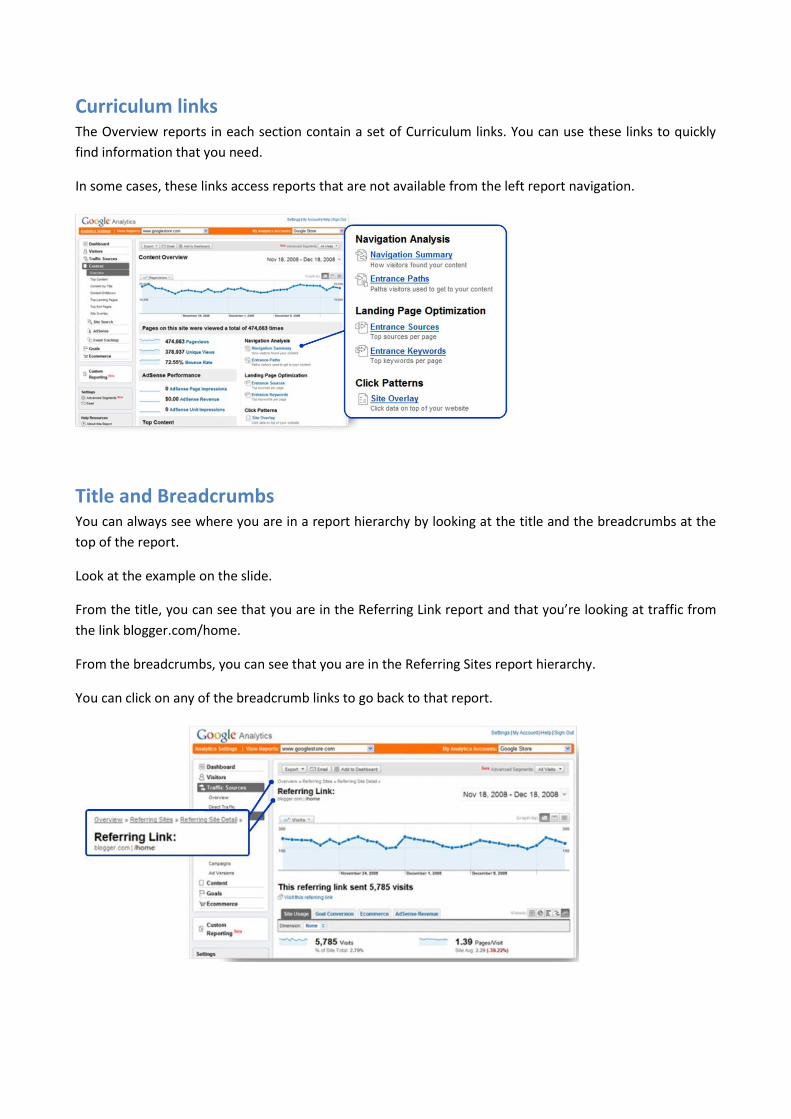
Curriculum links The Overview reports in each section contain a set of Curriculum links. You can use these links to quickly
find information that you need.
In some cases, these links access reports that are not available from the left report navigation.
Title and Breadcrumbs You can always see where you are in a report hierarchy by looking at the title and the breadcrumbs at the
top of the report.
Look at the example on the slide.
From the title, you can see that you are in the Referring Link report and that you’re looking at traffic from
the link blogger.com/home.
From the breadcrumbs, you can see that you are in the Referring Sites report hierarchy.
You can click on any of the breadcrumb links to go back to that report.

Narratives and Scorecards Nearly every report contains a short narrative that summarizes the traffic that’s included in the report.
The scorecard below the narrative provides metric aggregates and averages for the traffic.
Each box in the scorecard contains a question mark button. Clicking it opens a small window that explains
how the metric is calculated.
Report tabs Most reports provide tabs that show different sets of data.
The Site Usage tab shows metrics such as the number of pages viewed per visit, the average time
on site, and the bounce rate.
The Goal Conversion tab shows the conversion rates for each of your goals.
If you’ve enabled ecommerce reporting on your Profile Settings page, you’ll also see an Ecommerce
tab. This tab shows metrics such as Ecommerce revenue, number of transactions, and average
value.
The AdWords Campaigns reports have an additional tab called Clicks. This tab contains AdWords related
metrics such as clicks, cost, revenue per click and ROI.
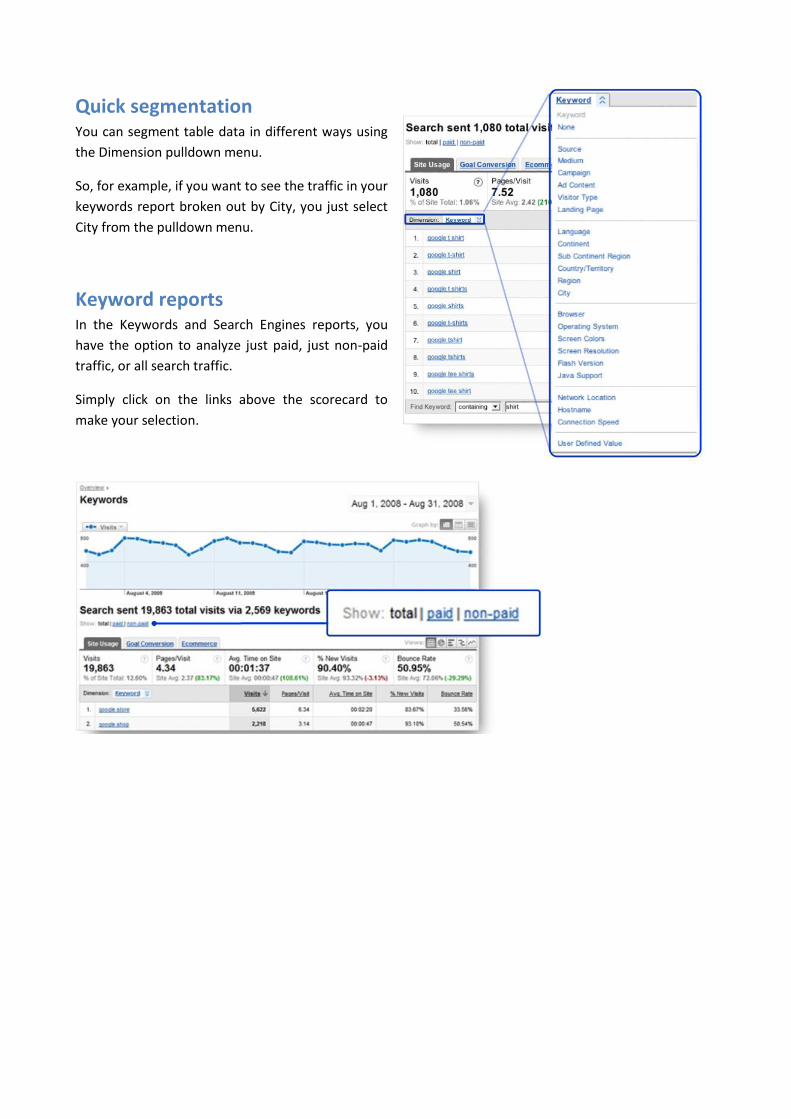
Quick segmentation You can segment table data in different ways using
the Dimension pulldown menu.
So, for example, if you want to see the traffic in your
keywords report broken out by City, you just select
City from the pulldown menu.
Keyword reports In the Keywords and Search Engines reports, you
have the option to analyze just paid, just non-paid
traffic, or all search traffic.
Simply click on the links above the scorecard to
make your selection.
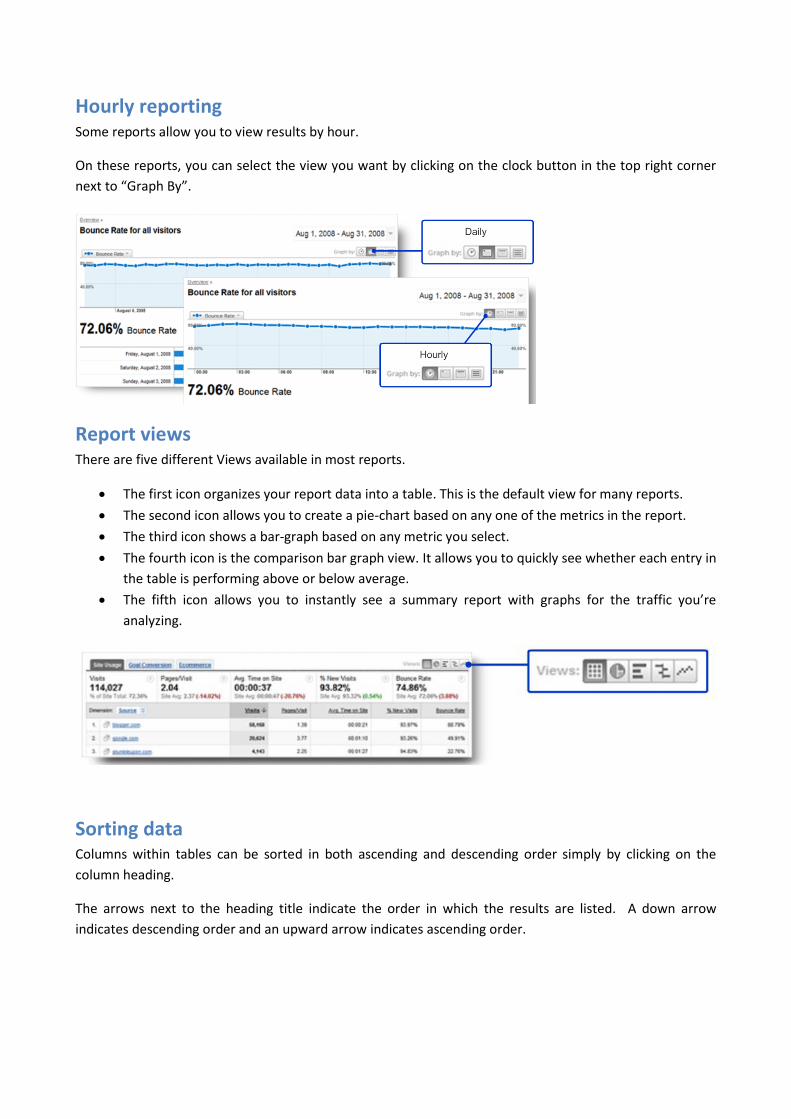
Hourly reporting Some reports allow you to view results by hour.
On these reports, you can select the view you want by clicking on the clock button in the top right corner
next to “Graph By”.
Report views There are five different Views available in most reports.
The first icon organizes your report data into a table. This is the default view for many reports.
The second icon allows you to create a pie-chart based on any one of the metrics in the report.
The third icon shows a bar-graph based on any metric you select.
The fourth icon is the comparison bar graph view. It allows you to quickly see whether each entry in
the table is performing above or below average.
The fifth icon allows you to instantly see a summary report with graphs for the traffic you’re
analyzing.
Sorting data Columns within tables can be sorted in both ascending and descending order simply by clicking on the
column heading.
The arrows next to the heading title indicate the order in which the results are listed. A down arrow
indicates descending order and an upward arrow indicates ascending order.

Expanding Number of Results Displayed By default, all reports with tables display ten rows.
To display more than ten rows, go to the bottom of your report and click the dropdown menu arrow next
to “Show rows”. You can display up to 500 rows per page.
Find Box You can use the Find box at the bottom left of your reports to narrow or refine your results.
For example, if you are looking at the All Traffic Sources report and you want to only see traffic from the
Google domain, you can type in Google and select “containing”.
Or, to exclude all traffic from the Google domain, you would select “excluding”.

INSTALLING GOOGLE ANALYTICS TRACKING CODE
Getting started with Google Analytics Get started with Google Analytics in three simple steps.
First, sign up for a Google Analytics Account.
Second, install the provided code across all pages of your site.
Third, if you are using Google AdWords, link it to your Google Analytics account to report on cost
and click data.
Create a New Account There are two places you can sign up for a Google Analytics account.
You can go to google.com/analytics and click the “Sign up now” link.
Or, if you are already an AdWords user, you can create a new account via “Google Analytics” under
Reporting.
Google Analytics Tracking Code (GATC) Google Analytics uses a combination of JavaScript and first party cookies to gather anonymous data about
your visitors.
As you set up your Google Analytics account, you will be provided with a tracking code. You’ll need to
install this tracking code across all pages of your site.
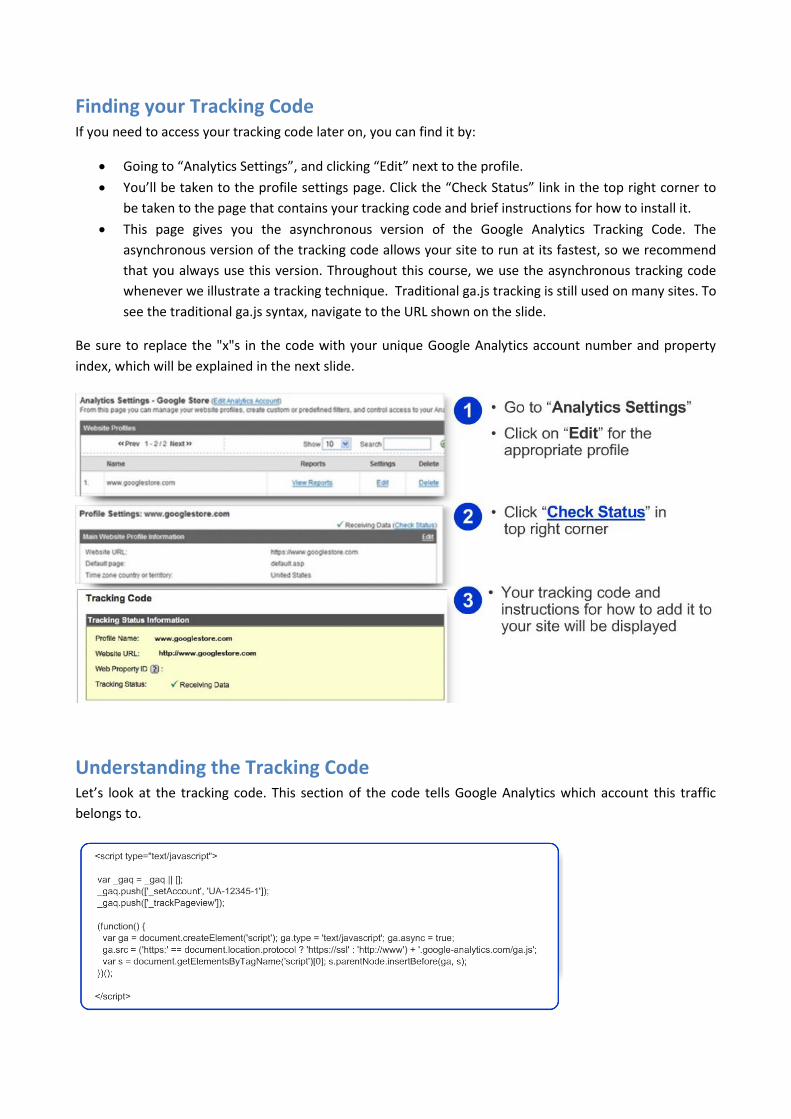
Finding your Tracking Code If you need to access your tracking code later on, you can find it by:
Going to “Analytics Settings”, and clicking “Edit” next to the profile.
You’ll be taken to the profile settings page. Click the “Check Status” link in the top right corner to
be taken to the page that contains your tracking code and brief instructions for how to install it.
This page gives you the asynchronous version of the Google Analytics Tracking Code. The
asynchronous version of the tracking code allows your site to run at its fastest, so we recommend
that you always use this version. Throughout this course, we use the asynchronous tracking code
whenever we illustrate a tracking technique. Traditional ga.js tracking is still used on many sites. To
see the traditional ga.js syntax, navigate to the URL shown on the slide.
Be sure to replace the "x"s in the code with your unique Google Analytics account number and property
index, which will be explained in the next slide.
Understanding the Tracking Code Let’s look at the tracking code. This section of the code tells Google Analytics which account this traffic
belongs to.

The number immediately following the “UA dash” is your unique Google Analytics account number, and the
number following the last dash is the property index. Review the lesson on accounts and profiles to learn
about the property index. This section of the tracking code automatically detects secure versus non-secure
pages. So, you can use the same tracking code on both https and http pages.
Custom Website Setups The tracking code that is provided to you is designed to work with most site setups. In some cases,
however, you’ll need to make small updates to the tracking code on each of your pages.
For example, if you need to:
• Track multiple domains in one profile,
• Track more than one subdomain per profile, or
• Track multiple domain aliases, you should review the module on tracking domains and subdomains
and customize your code before adding it to your pages.
Installing the JavaScript To install the JavaScript, copy your tracking code--either the code provided during setup, or your
customized snippet--and paste it into your page.
One of the main advantages of the asynchronous snippet is that you can position it at the top of the HTML
document. This increases the likelihood that the tracking beacon will be sent before the user leaves the
page. It is customary to place JavaScript code in the <head> section, and we recommend placing the
snippet at the bottom of the <head> section for best performance.
To maintain tracking consistency, it is important that the code is installed across all pages of your site.
Using GA with Adwords and Other Products If you buy keywords on Google AdWords, you can use Google Analytics to see how well your paid keywords
perform in terms of conversion rates, revenue, and ROI. You can compare search result positions for each
keyword and you can compare ad performance.
To do these things, you'll need to link your AdWords account to your Analytics account. Review the module
on Campaign Tracking and AdWords Integration for detailed instructions.
Urchin Software from Google is similar to Google Analytics, but Urchin runs on your own servers, whereas
Google Analytics is a service hosted by Google.
If you’ve licensed Urchin, you can run both Urchin and Google Analytics together on your site. Running
Urchin and Google Analytics together gives you a great deal of flexibility and analysis capability.

You’ll need to make modifications to your tracking code. While this isn’t covered in the course, you can
learn how by following the link shown in the slide.
Verifying Installation
Checking reports for Data Once you’ve installed your tracking code, it usually takes about 24 hours for data to appear in your reports.
The best way to verify that you are receiving data is to simply look at your reports.
Go to the Top Content report in the Content section and make sure that you see Pageview numbers for
each of your pages.
Checking Source Code You can also view your webpage’s source code to verify that the tracking code is installed.
• Navigate your browser to any page on your site. Right click within the browser window and select
the “View Page Source” or “View Source” option in your browser. This will open a new window that
contains the source code for that page.
• Now search for ga.js. (From the source code menu, select “Edit” and click the “Find” option.)
If you find the Google Analytics tracking code on your page, then it is likely that Google Analytics has been
successfully installed on your site.
Repeat this process across several pages on your site to make sure that your installation is complete.

INTERPRETING REPORTS
Guidelines
Contextual Help Resources You can get information about any report you’re looking at by clicking one of the Help Resources.
About this Report offers a brief description of the report.
Conversion University provides insight into how you might use and interpret the data.
Common Questions links to Help Center articles that are related to the report.
Create Context for your Data When analyzing your traffic, avoid focusing on just a single metric. This pageviews result by itself isn’t
actionable because you don’t know what the number really means.
But, when you look at pageviews in the context of other metrics, you start to get
clearer picture.
For example, look at the bounce rate. Half of the time that people entered the site
through this page, they left the site without looking at any other pages. This page is
very important. By comparing the pageviews to the site average, we can see that this
page accounts for over 28% of all the pageviews.
How has the performance of this page changed over time?
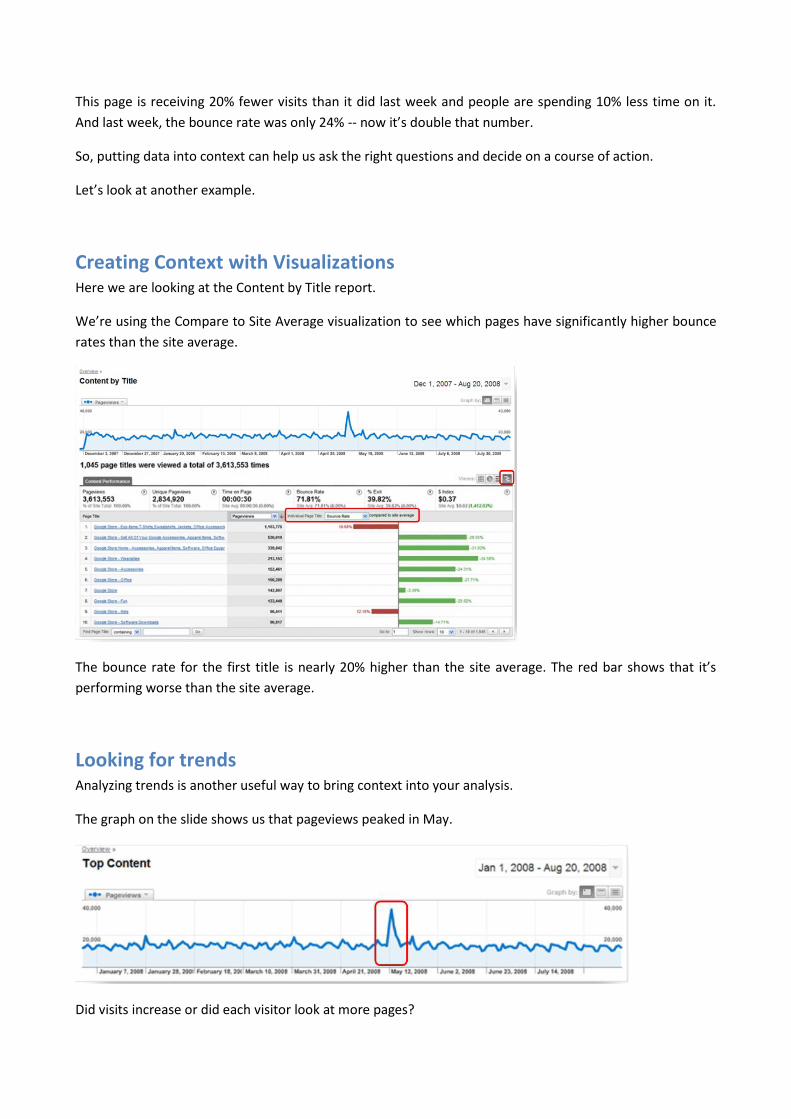
This page is receiving 20% fewer visits than it did last week and people are spending 10% less time on it.
And last week, the bounce rate was only 24% -- now it’s double that number.
So, putting data into context can help us ask the right questions and decide on a course of action.
Let’s look at another example.
Creating Context with Visualizations Here we are looking at the Content by Title report.
We’re using the Compare to Site Average visualization to see which pages have significantly higher bounce
rates than the site average.
The bounce rate for the first title is nearly 20% higher than the site average. The red bar shows that it’s
performing worse than the site average.
Looking for trends Analyzing trends is another useful way to bring context into your analysis.
The graph on the slide shows us that pageviews peaked in May.
Did visits increase or did each visitor look at more pages?

Investigating Changes in Trends Using the Graph Mode to compare Visits and Pageviews, we see that Visits and Pageviews have increased
proportionally.
Data Driven Decision Making Now let’s identify which traffic sources led to the increase in traffic and revenue. We do this by looking at
the All Traffic Sources report and clicking on the Ecommerce tab.
Comparing two days of traffic, we find that -- although several sources sent an increasing number of visitors
to the site -- only Google organic and Google referral had a significant impact on revenue.
Therefore, we know that although other campaigns increased overall traffic, they did not bring in
purchasers.
This kind of information can help you decide where to focus your promotion and site content resources.
Pageviews, Visits and Visitors
Pageview In Google Analytics, a pageview is counted every time a page on your website loads.
So, for example, if someone comes to your site and views page A, then page B, then Page A again, and then
leaves your site -- the total pageviews for the visit is 3.
Visit A visit -- or session -- is a period of interaction between a web browser and a website. Closing the browser
or staying inactive for more than 30 minutes ends the visit.
For example, let’s say that a visitor is browsing the Google Store, a site that uses Google Analytics. He gets
to the second page, and then gets a phone call. He talks on the phone for 31 minutes, during which he does
not click anywhere else on the site.
After his call, he continues where he left off. Google Analytics will count this as a second visit, or a new
session.
Note that throughout these modules, the words “visit” and “session” may be used interchangeably.
Visitor A visitor is uniquely identified by a Google Analytics visitor cookie which assigns a random visitor ID to the
user, and combines it with the timestamp of the visitor’s first visit.
The combination of the random visitor ID and the timestamp establish a Unique ID for that visitor.
You’ll learn more about the visitor cookie in a subsequent module.
Pageviews, Visits and Visitors – The basics Generally, the Visitors metric will be smaller than the Visits metric which in turn will be smaller than the
Pageviews metric.
For example, 1 visitor could visit a site 2 times and generate a total of 5 pageviews.

Pageviews vs. Unique Pageviews A pageview is defined as a view of a page that is tracked by the Google Analytics Tracking Code.
If a visitor hits reload after reaching the page, this will be counted as an additional pageview.
If a user navigates to a different page and then returns to the original page, an additional pageview will also
be recorded.
A unique pageview represents the number of visits during which that page was viewed--whether one or
more times. In other words, if a visitor views page A three times during one visit, Google Analytics will
count this as three pageviews and one unique pageview.
“Absolute Unique” vs. “New vs. Returning” The “Absolute Unique Visitors” report counts each visitor during your selected date range only once. So, if
visitor A comes to your site 5 times during the selected date range and visitor B comes to your site just
once, you will have 2 Absolute Unique Visitors. Remember, a visitor is uniquely identified by a Google
Analytics visitor cookie.
The “New vs. Returning” report classifies each visit as coming from either a new visitor or a returning
visitor. So when someone visits your site for the first time, the visit is categorized as “Visit from a new
visitor.” If the person has browsed your website before, the visit is categorized as “Visit from a returning
visitor.”
A high number of new visits suggests that you are successful at driving traffic to your site while a high
number of return visits suggests that the site content is engaging enough for visitors to come back.
You can look at the Recency report (under Visitors->Visitor Loyalty) to see how recently visitors have
visited. You can look at the Loyalty report to see how frequently they return. Both the Recency and Loyalty
reports are under Visitor Loyalty in the Visitors section.
Pageviews, Visits and Visitors in Your Reports The Pageviews metric can be found in the Visitors Overview and in the Content section reports.
Most of the other reports show Pages Viewed per Visit instead of Pageviews.
Unique Pageviews is only found in the Content section.
Almost all of the reports show Visits.
The Visitors metric -- in other words the number of visitors who came to your site -- is found in the
Visitors section.
Time metrics
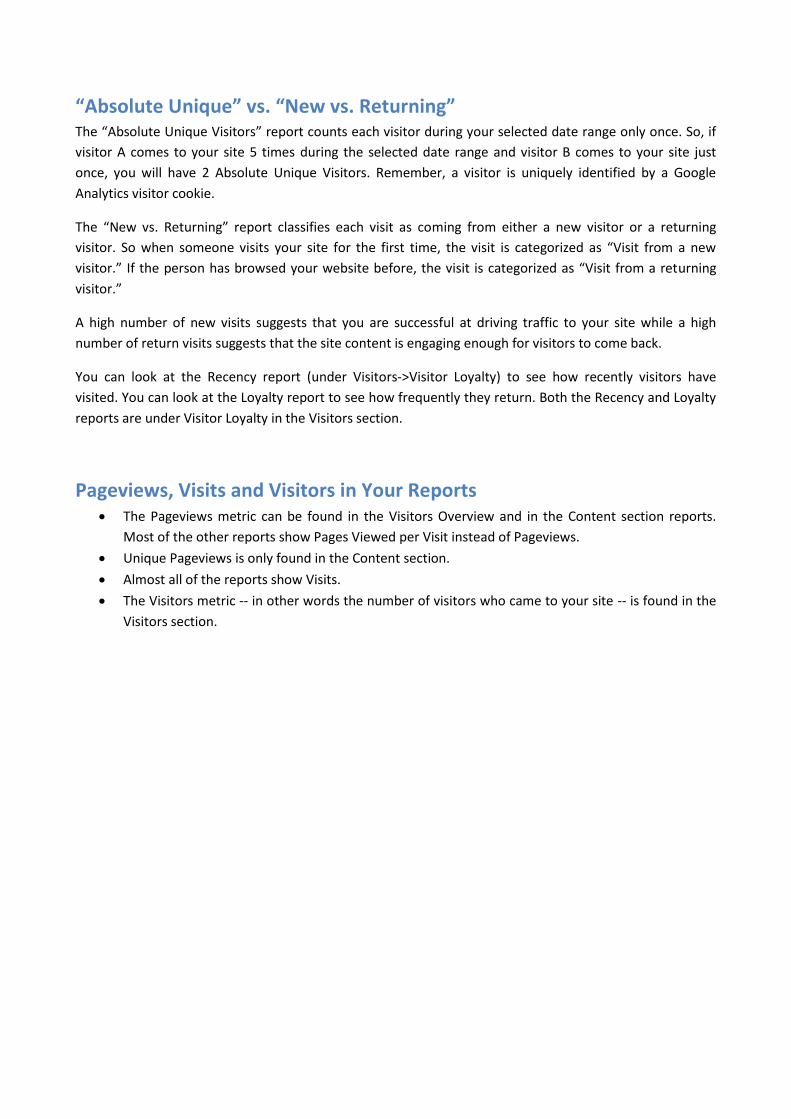
Time on page To calculate Time on Page, Google Analytics compares the timestamps of the visited pages. For example, in
the slide, the visitor saw page A, then page B, and then left the site.
The Time on Page for page A is calculated by subtracting the page A timestamp from the page B timestamp.
So, the Time on Page for page A is 1 minute and 15 seconds.
In order for this calculation to take place, the Google Analytics Tracking Code must be executed on both
pages.
The Time on Page for page B is 0 seconds, because there is no subsequent timestamp that Google Analytics
can use to calculate the actual Time on Page.
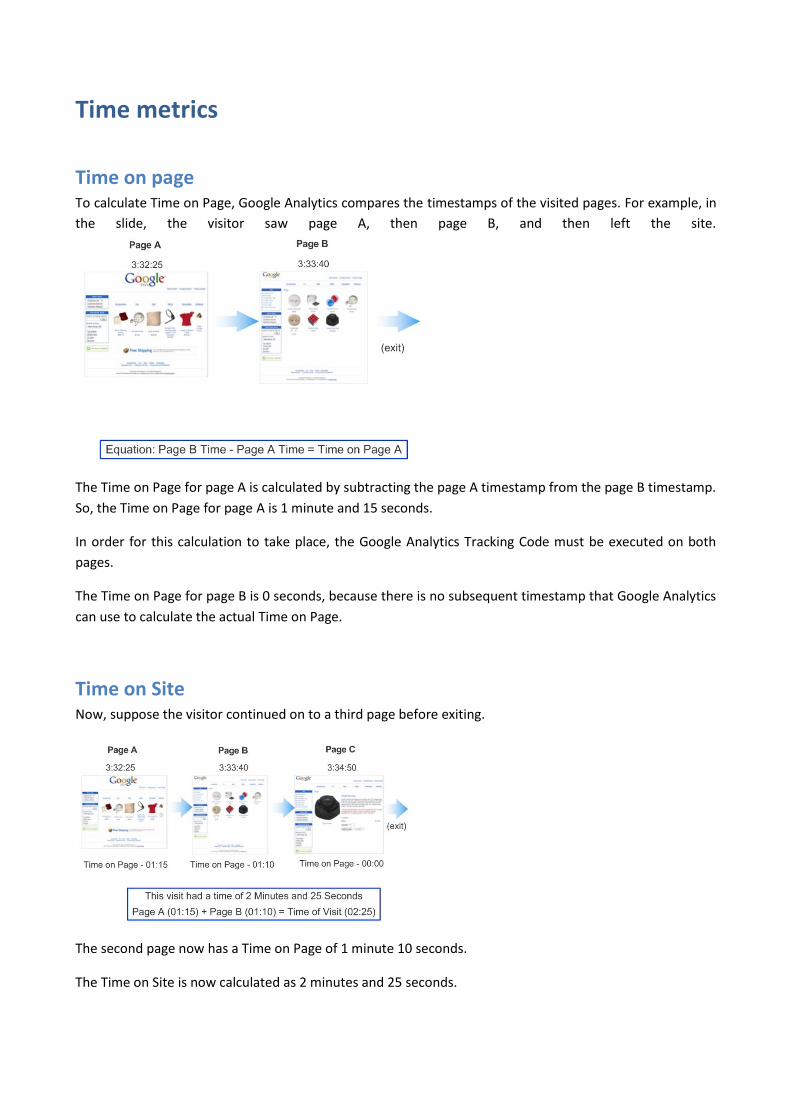
Time on Site Now, suppose the visitor continued on to a third page before exiting.
The second page now has a Time on Page of 1 minute 10 seconds.
The Time on Site is now calculated as 2 minutes and 25 seconds.

“Avg. Time on Page” vs. “Avg. Time on Site” For Average Time on Page, bounces are excluded from the calculation. In other words, any Time on Page of
0 is excluded from the calculation.
For Average Time on Site, bounces remain a part of the calculation.
To calculate Average Time on Site, Google Analytics divides the total time for all visits by the number of
visits.
Flash-based sites Some sites make extensive use of Flash or other interactive technologies.
Often, these kinds of sites don’t load new pages frequently and all the user interaction takes place on a
single page.
As a result, it’s common for sites like this to have high bounce rates and low average times on site.
If you have such a site, you may wish to set up your tracking so that virtual pageviews or events are
generated as the user performs various activities.
You can learn how to do this in the module on Event Tracking and Virtual Pageviews.
“Length of Visit” vs. “Average Time on Site” The Length of Visit (Visitors->Visitor Loyalty->Length of Visit) report categorizes visits according to the
amount of time spent on the site during the visit.
The graph allows you to visualize the entire distribution of visits instead of simply the ‘Average Time on
Site’ across all visits.
You can see whether a few visits are skewing your ‘Average Time on Site’ upward or downward.

Traffic Sources
Traffic Sources Reports The reports in the Traffic Sources section show you where your traffic is coming from on the internet.
You can compare your traffic sources against each other to find out which sources send you the highest
quality traffic.
Traffic Sources Explained Direct Traffic represents visitors who clicked on a bookmark to arrive at your site, or who typed the
URL directly into their browser.
Referring Sites include any sites that send traffic to you. These could be banner ads or links
featured on blogs, affiliates, or any site that links to your site.
Search Engine traffic represents visitors who click on a search results link in Google, Yahoo, or any
other search engine. Search Engine traffic can be :
o Organic -- in other words, free search results –
o Paid -- Paid search engine traffic is pay per click or cost per click traffic that you purchase
from a search engine -- for example on Google AdWords.
Understanding which search engines send you qualified traffic can help you select the search engines on
which you want to advertise.
What Makes a Good Source of Traffic? Looking at the highest traffic drivers is a start, but it doesn’t tell you whether the traffic was qualified. In
other words, did the traffic help you achieve the goals you’ve set for your site?
One easy indicator of quality is Bounce Rate -- the percentage of visits in which the person left without
viewing any other pages.
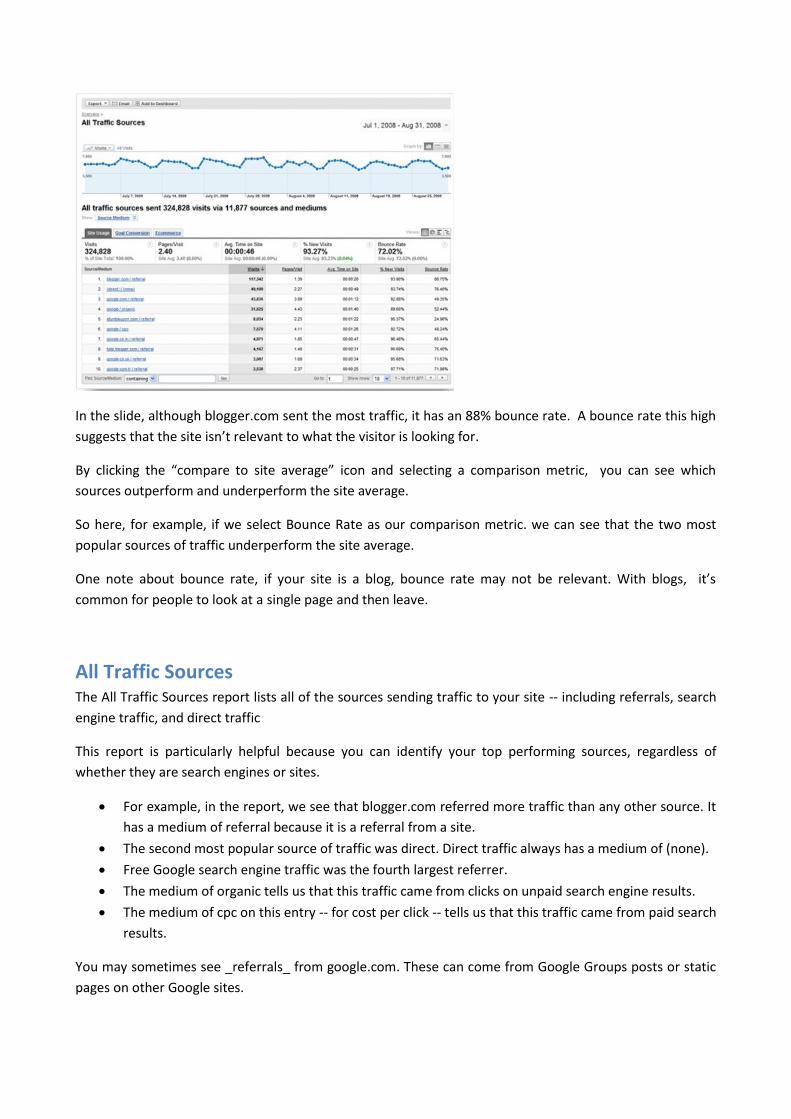
In the slide, although blogger.com sent the most traffic, it has an 88% bounce rate. A bounce rate this high
suggests that the site isn’t relevant to what the visitor is looking for.
By clicking the “compare to site average” icon and selecting a comparison metric, you can see which
sources outperform and underperform the site average.
So here, for example, if we select Bounce Rate as our comparison metric. we can see that the two most
popular sources of traffic underperform the site average.
One note about bounce rate, if your site is a blog, bounce rate may not be relevant. With blogs, it’s
common for people to look at a single page and then leave.
All Traffic Sources The All Traffic Sources report lists all of the sources sending traffic to your site -- including referrals, search
engine traffic, and direct traffic
This report is particularly helpful because you can identify your top performing sources, regardless of
whether they are search engines or sites.
For example, in the report, we see that blogger.com referred more traffic than any other source. It
has a medium of referral because it is a referral from a site.
The second most popular source of traffic was direct. Direct traffic always has a medium of (none).
Free Google search engine traffic was the fourth largest referrer.
The medium of organic tells us that this traffic came from clicks on unpaid search engine results.
The medium of cpc on this entry -- for cost per click -- tells us that this traffic came from paid search
results.
You may sometimes see _referrals_ from google.com. These can come from Google Groups posts or static
pages on other Google sites.

Revenue and Conversion Drivers If you have goals or ecommerce set up on your site, you have a much wider range of metrics with which to
assess performance.
Click on the Goal Conversion or Ecommerce tabs to view which sources are driving conversions and
purchases.
Keyword Report The Keywords report is very useful for understanding what visitors were expecting to find on your site.
Keywords with a high bounce rate tell you where you failed to meet that expectation.
You can isolate your paid search engine traffic by clicking the Paid link. By doing this, you’ll limit the report
to just showing your AdWords traffic and paid traffic from other search engines.
If you have paid keywords with a high bounce rate, you should evaluate whether your landing pages are
relevant enough and you might also want to consider whether you should continue to buy those keywords.
Remember, you can use the Goal Conversion and Ecommerce tabs to compare the performance of
keywords in terms of conversions and revenue.
For example, in the slide example, the ‘google kids’ phrase has a 86% bounce rate. Let’s find out what
landing page is being used.
We start by clicking on the ‘google kids’ entry in the table. This takes us to the Keyword report for ‘google
kids’.

To find out which landing page is being used for this keyword, we’ll select Landing Page from the Dimension
pulldown menu.
We can now see which landing page is being used and evaluate it’s relevance to the keyword. This report
can be particularly helpful if multiple landing pages are being used.
You can find out which landing pages are responsible for the poor performance and send the keyword
traffic to the most effective landing page.
Be sure to also check the bounce rates for organic, non-paid keywords. This information can offer insights
into how to best focus your search engine optimization efforts.

Campaign Attribution As long as you have defined goals and track ecommerce transactions, you can use the metrics on the Goal
Conversion and Ecommerce tabs to assess the performance of any campaign.
By default, Google Analytics attributes a conversion or sale to the campaign that most recently preceded
the conversion or sale.
For example, if a visitor clicks on an AdWords ad (Campaign 1 in the first session) and then later returns via
a referral to purchase something (Referrer 1 in the second session), the referral will get credit for the sale.
However, if instead the visitor returns directly, then the AdWords ad (Campaign 1) will still get credit for
the sale.
To prevent a specific referral or campaign from overriding a prior campaign, simply append
“utm_nooverride=1” to all referring campaign links as shown in the slide. This ensures that the conversion
is always attributed to the original referrer (or first campaign the user clicked on).
Therefore, in the example above, the original campaign will continue to get credit for the conversion.
If a visitor returns via a link without the utm_nooverride, as in the third example, that campaign will get
credit for the sale since it overwrites all previous referring campaigns.

Content Reports
Top Content, Content by Title, Content Drilldown The first three reports listed in the Content section all show the same information, but each report
organizes it differently.
The Top Content report lists each page that received traffic.
The Content by Title report groups your pages according to Title tag. You can click on a title to see
the pages that share that title.
The Content Drilldown report groups pages according to directory. You can click on a directory to
see the pages in the directory.
Why I am seeing “/” in my reports? Pages in your Content reports are represented by their “request URIs”, which is the part of the URL after
the domain name.
So, a forward slash represents your home page.
When you create your profile, you should specify the name of your homepage as the Default page.
That way, instead of having forward slash show up in your reports, you’ll see your homepage URI instead.

Top Landing Pages The Top Landing Pages report lists all of the pages through which people entered your site.
You can use this report to monitor the number of bounces and the bounce rate for each landing page.
Bounce rate is good indicator of landing page relevance and effectiveness. You can lower bounce rates by
tailoring each landing page to its associated ads and referral links. The more relevant the page, the less
likely a visitor will be to bounce.
Navigation Analysis
Navigation Summary Navigation Analysis reports can help you understand how people move through your site. The reports are
listed on the Content Overview page. They’re also available from a pulldown menu when you drill down to
a page detail report.
The first of these -- Navigation Summary --- can help you see how people arrived at a specific page and
where they went afterwards.
Here’s the Navigation Summary report.
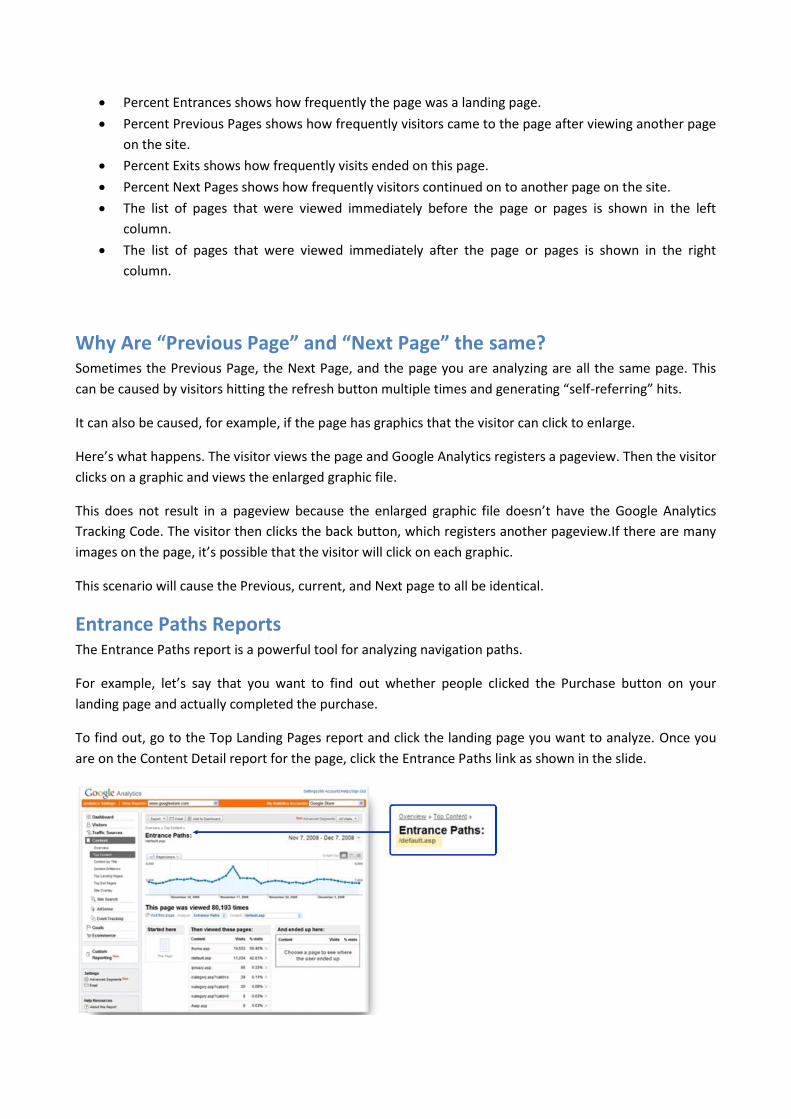
Percent Entrances shows how frequently the page was a landing page.
Percent Previous Pages shows how frequently visitors came to the page after viewing another page
on the site.
Percent Exits shows how frequently visits ended on this page.
Percent Next Pages shows how frequently visitors continued on to another page on the site.
The list of pages that were viewed immediately before the page or pages is shown in the left
column.
The list of pages that were viewed immediately after the page or pages is shown in the right
column.
Why Are “Previous Page” and “Next Page” the same? Sometimes the Previous Page, the Next Page, and the page you are analyzing are all the same page. This
can be caused by visitors hitting the refresh button multiple times and generating “self-referring” hits.
It can also be caused, for example, if the page has graphics that the visitor can click to enlarge.
Here’s what happens. The visitor views the page and Google Analytics registers a pageview. Then the visitor
clicks on a graphic and views the enlarged graphic file.
This does not result in a pageview because the enlarged graphic file doesn’t have the Google Analytics
Tracking Code. The visitor then clicks the back button, which registers another pageview.If there are many
images on the page, it’s possible that the visitor will click on each graphic.
This scenario will cause the Previous, current, and Next page to all be identical.
Entrance Paths Reports The Entrance Paths report is a powerful tool for analyzing navigation paths.
For example, let’s say that you want to find out whether people clicked the Purchase button on your
landing page and actually completed the purchase.
To find out, go to the Top Landing Pages report and click the landing page you want to analyze. Once you
are on the Content Detail report for the page, click the Entrance Paths link as shown in the slide.

You’ll now see the Entrance Paths report for your landing page.
In the middle column, you’ll see all the possible clicks people made on the page. Choose the link that
represents the Purchase page.
In the right hand column, you’ll now see all the pages visitors went to after the Purchase page. By looking at
this list, you’ll be able to see how many visits ended up on the Purchase Completion page.
This report can show you if the landing page is doing the job you designed it for.
Additional Content Reports & Drill-Down You can use the “Analyze” drop-down menu to view additional reports such as Entrance Sources and
Entrance Keywords.
The “Content” drop down menu allows you to select -- or search for -- specific pages to analyze.

ACCOUNTS AND PROFILES
The Analytics Settings Screen When you first login to your Analytics account, you’ll see the Analytics Settings screen. This is where you
will manage the set-up and configuration of your account and profiles.
Analytics Accounts If you have access to multiple Analytics accounts, you can access each account from the My Analytics
Account drop-down list.
For example, if other administrators have added you to their accounts, you’ll see a list of those accounts in
the drop down.
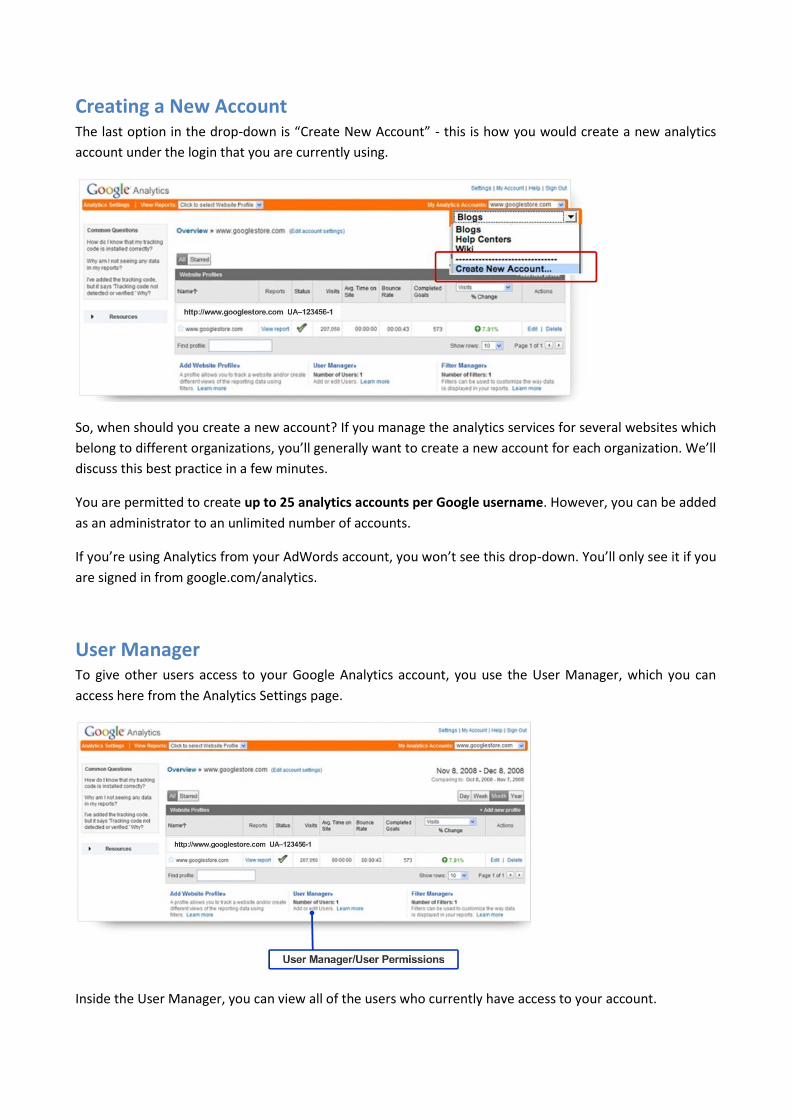
Creating a New Account The last option in the drop-down is “Create New Account” - this is how you would create a new analytics
account under the login that you are currently using.
So, when should you create a new account? If you manage the analytics services for several websites which
belong to different organizations, you’ll generally want to create a new account for each organization. We’ll
discuss this best practice in a few minutes.
You are permitted to create up to 25 analytics accounts per Google username. However, you can be added
as an administrator to an unlimited number of accounts.
If you’re using Analytics from your AdWords account, you won’t see this drop-down. You’ll only see it if you
are signed in from google.com/analytics.
User Manager To give other users access to your Google Analytics account, you use the User Manager, which you can
access here from the Analytics Settings page.
Inside the User Manager, you can view all of the users who currently have access to your account.
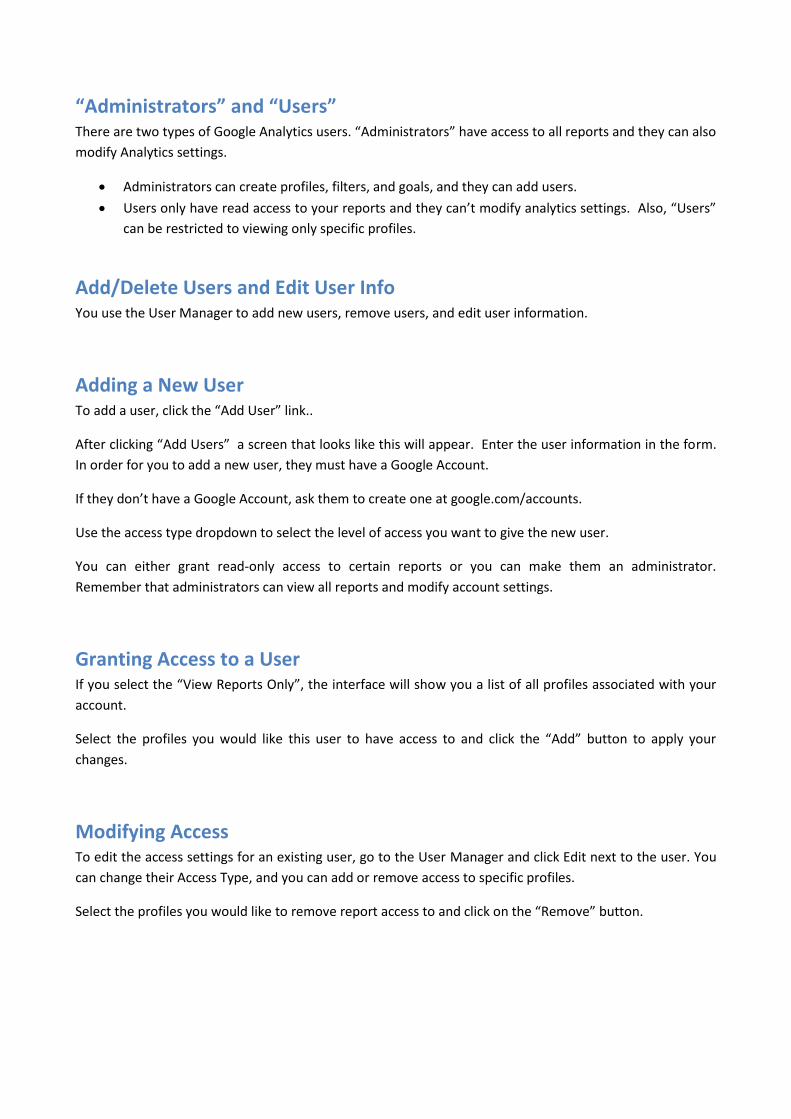
“Administrators” and “Users” There are two types of Google Analytics users. “Administrators” have access to all reports and they can also
modify Analytics settings.
Administrators can create profiles, filters, and goals, and they can add users.
Users only have read access to your reports and they can’t modify analytics settings. Also, “Users”
can be restricted to viewing only specific profiles.
Add/Delete Users and Edit User Info You use the User Manager to add new users, remove users, and edit user information.
Adding a New User To add a user, click the “Add User” link..
After clicking “Add Users” a screen that looks like this will appear. Enter the user information in the form.
In order for you to add a new user, they must have a Google Account.
If they don’t have a Google Account, ask them to create one at google.com/accounts.
Use the access type dropdown to select the level of access you want to give the new user.
You can either grant read-only access to certain reports or you can make them an administrator.
Remember that administrators can view all reports and modify account settings.
Granting Access to a User If you select the “View Reports Only”, the interface will show you a list of all profiles associated with your
account.
Select the profiles you would like this user to have access to and click the “Add” button to apply your
changes.
Modifying Access To edit the access settings for an existing user, go to the User Manager and click Edit next to the user. You
can change their Access Type, and you can add or remove access to specific profiles.
Select the profiles you would like to remove report access to and click on the “Remove” button.
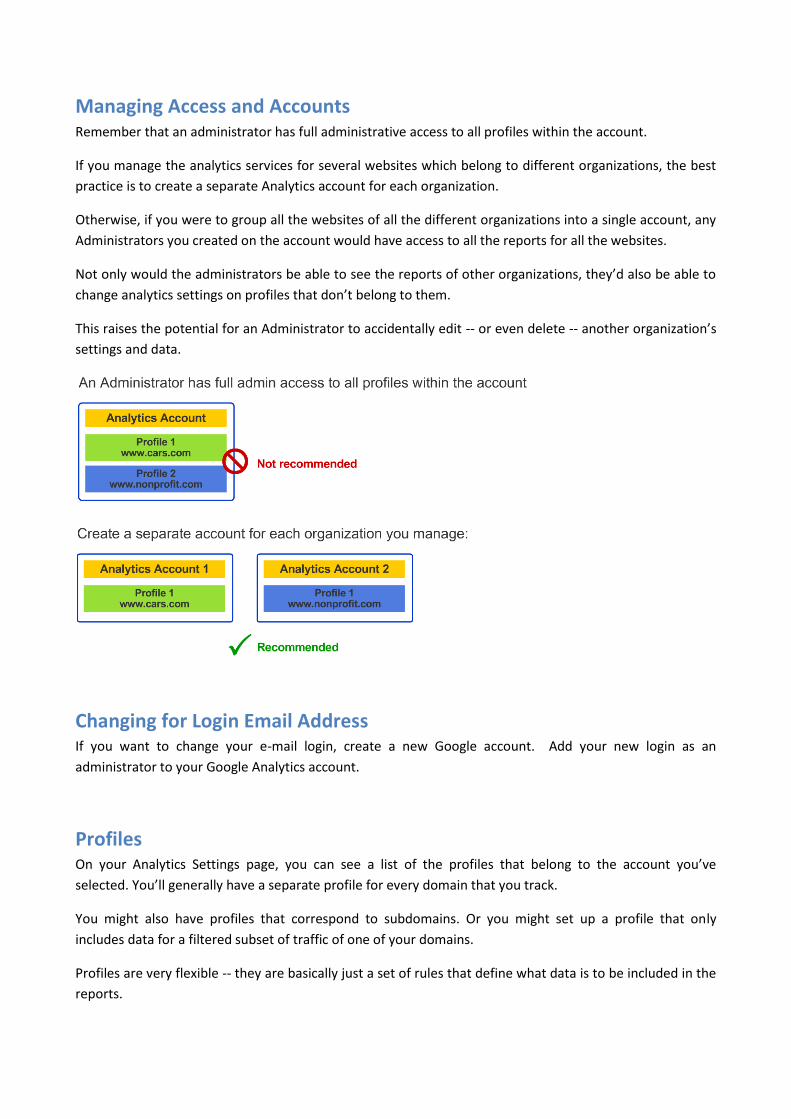
Managing Access and Accounts Remember that an administrator has full administrative access to all profiles within the account.
If you manage the analytics services for several websites which belong to different organizations, the best
practice is to create a separate Analytics account for each organization.
Otherwise, if you were to group all the websites of all the different organizations into a single account, any
Administrators you created on the account would have access to all the reports for all the websites.
Not only would the administrators be able to see the reports of other organizations, they’d also be able to
change analytics settings on profiles that don’t belong to them.
This raises the potential for an Administrator to accidentally edit -- or even delete -- another organization’s
settings and data.
Changing for Login Email Address If you want to change your e-mail login, create a new Google account. Add your new login as an
administrator to your Google Analytics account.
Profiles On your Analytics Settings page, you can see a list of the profiles that belong to the account you’ve
selected. You’ll generally have a separate profile for every domain that you track.
You might also have profiles that correspond to subdomains. Or you might set up a profile that only
includes data for a filtered subset of traffic of one of your domains.
Profiles are very flexible -- they are basically just a set of rules that define what data is to be included in the
reports.
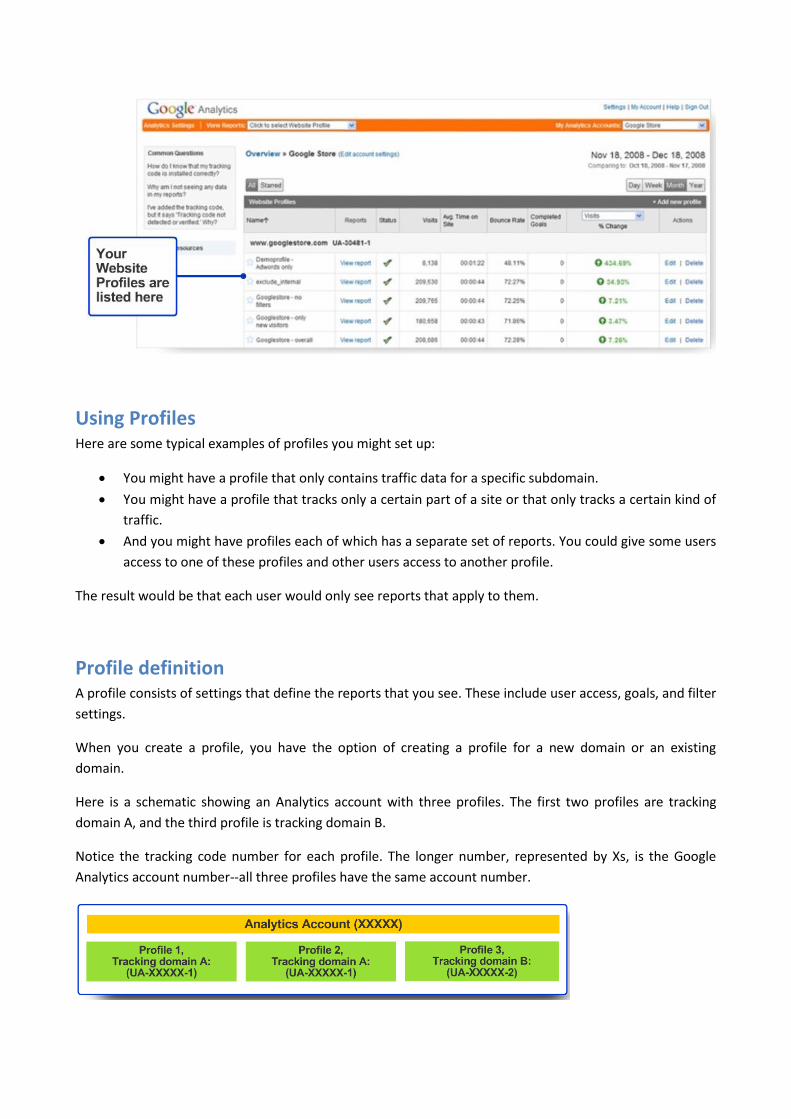
Using Profiles Here are some typical examples of profiles you might set up:
You might have a profile that only contains traffic data for a specific subdomain.
You might have a profile that tracks only a certain part of a site or that only tracks a certain kind of
traffic.
And you might have profiles each of which has a separate set of reports. You could give some users
access to one of these profiles and other users access to another profile.
The result would be that each user would only see reports that apply to them.
Profile definition A profile consists of settings that define the reports that you see. These include user access, goals, and filter
settings.
When you create a profile, you have the option of creating a profile for a new domain or an existing
domain.
Here is a schematic showing an Analytics account with three profiles. The first two profiles are tracking
domain A, and the third profile is tracking domain B.
Notice the tracking code number for each profile. The longer number, represented by Xs, is the Google
Analytics account number--all three profiles have the same account number.
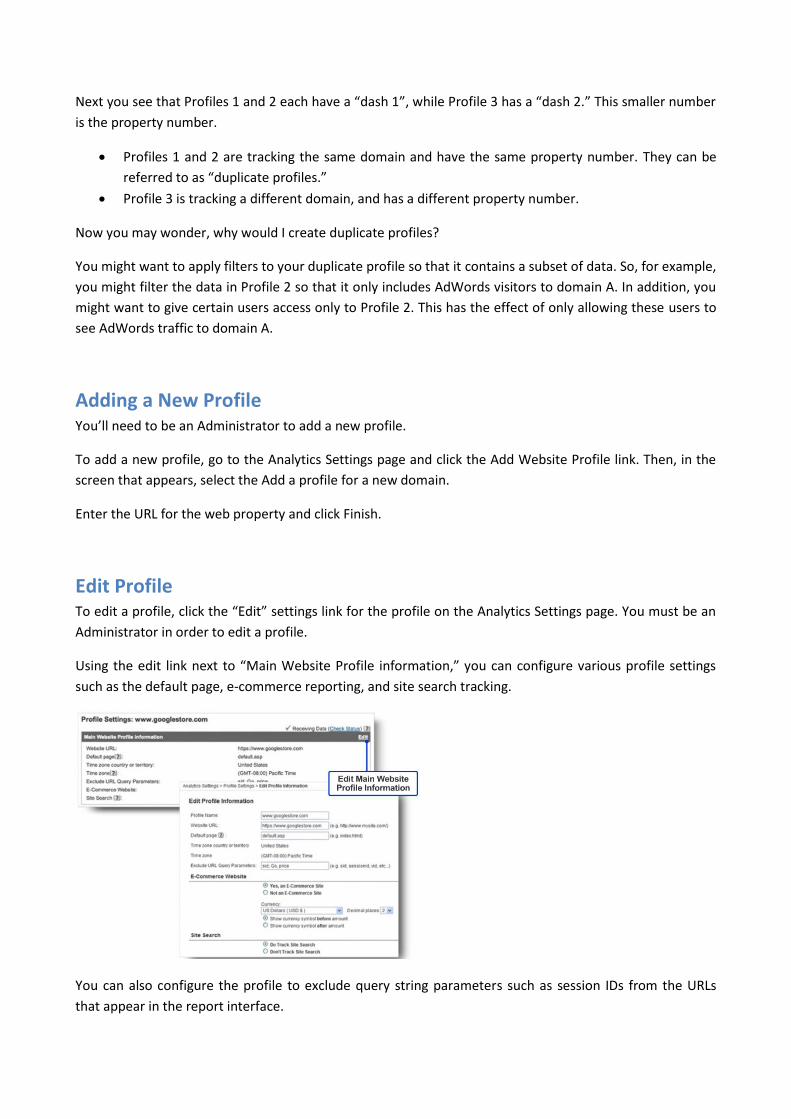
Next you see that Profiles 1 and 2 each have a “dash 1”, while Profile 3 has a “dash 2.” This smaller number
is the property number.
Profiles 1 and 2 are tracking the same domain and have the same property number. They can be
referred to as “duplicate profiles.”
Profile 3 is tracking a different domain, and has a different property number.
Now you may wonder, why would I create duplicate profiles?
You might want to apply filters to your duplicate profile so that it contains a subset of data. So, for example,
you might filter the data in Profile 2 so that it only includes AdWords visitors to domain A. In addition, you
might want to give certain users access only to Profile 2. This has the effect of only allowing these users to
see AdWords traffic to domain A.
Adding a New Profile You’ll need to be an Administrator to add a new profile.
To add a new profile, go to the Analytics Settings page and click the Add Website Profile link. Then, in the
screen that appears, select the Add a profile for a new domain.
Enter the URL for the web property and click Finish.
Edit Profile To edit a profile, click the “Edit” settings link for the profile on the Analytics Settings page. You must be an
Administrator in order to edit a profile.
Using the edit link next to “Main Website Profile information,” you can configure various profile settings
such as the default page, e-commerce reporting, and site search tracking.
You can also configure the profile to exclude query string parameters such as session IDs from the URLs
that appear in the report interface.

Removing Profiles To remove a profile, you can simply click the Delete link next to the profile on the Analytics Settings page.
You’ll need to be an Administrator to do this.
Be careful that you are deleting the correct profile, because you won’t be able to recover the historical
data for the profile once it’s been deleted.

CAMPAIGN TRACKING AND ADWORDS INTEGRATION
Analyze All Marketing Campaigns Google Analytics allows you to track and analyze all of your marketing campaigns -- including paid search
campaigns, banner ads, emails and other programs.
How to Track Your Campaigns There are two ways to track ad campaigns.
For AdWords campaigns, you should enable keyword autotagging. This allows Google Analytics to
automatically populate your reports with detailed AdWords campaign information. In order to
enable autotagging, you’ll need to link your AdWords and Google Analytics accounts; we’ll look at
this in more detail in the next slide.
The second way to track campaigns is to manually tag links. So, for example, you could tag the links
in an email message with campaign-identifying information. You may also choose to manually tag
AdWords links if you do not wish to enable autotagging.
The tags are campaign variables that you append to the end of your URLs.

Linking Adwords to Analytics By linking Google Analytics to your AdWords account, you can get advanced reporting that measures
performance and ROI for your AdWords campaigns.
Within AdWords, select Google Analytics under the Reporting tab to link your accounts. The AdWords login
that you’re using will need administrator privileges in Analytics in order to link the accounts.
If you don’t already have an Analytics account, you’ll be able to create one.
When you link your accounts, you should enable "Destination URL Autotagging”. This option allows you to
differentiate your paid ads from organic search listings and referrals and allows you to see detailed
campaign information in the AdWords section of your Traffic Sources reports.
Your cost data -- the information about clicks and keyword spending -- will be applied once you link your
accounts. If you don't want cost data imported into a particular profile, you can edit the profile settings and
de-select the cost data option -- after you've completed the linking process.
Be aware that you can only link one Analytics account to one AdWords account.
For administration purposes, you will want to create a new Analytics account for each associated AdWords
account. Note that once you have linked an Analytics and AdWords account – the time zone in Google
Analytics will automatically take that of the AdWords Account (if they are different).
Why Autotagging? Autotagging your links is important because it helps Analytics differentiate the traffic coming from Google
paid listings, outlined in green on the slide, and traffic coming from Google organic listings, which are
outlined in red.
If autotagging is not enabled, your Analytics reports will show that the clicks from the sponsored listings
and the organic listings are both coming from the same source: google organic.
By default, Analytics considers them both to be from Google organic search results.

So, enabling autotagging allows you to see which referrals to your site came from your paid Google
campaigns and which ones came from Google organic search results.
How Does Autotagging Works? Autotagging works by adding a unique id, or g-c-l-i-d, to the end of your destination URLs. This unique id
allows Analytics to track and display click details in your reports.
It is important to note that 3rd party redirects and encoded URLs can prevent autotagging from working
properly. You should test these cases by adding a unique parameter to the end of your URL --- for example
you could add ?test=test. Test to make sure that the parameter is carried through to your destination page
and that the link doesn’t break.
Notice that the first query parameter is always preceded with a question mark. Subsequent values are
separated using ampersands.
Appending glicd to the Destination URL Here’s an example of a gclid appended to the end of a URL.

How to Enable Autotagging To enable autotagging, select “Account Preferences” under “My Account”.
Make sure that the Tracking option reads “yes”. If it says “no”, click the edit link, check the box for
“Destination URL Autotagging”, and click “Save Changes”.
When linking your AdWords account to Analytics for the first time, you’ll be prompted to automatically
select “Destination URL Autotagging” and “Cost Data Import”.
If you want to change your autotagging settings later, you can do so by editing your AdWords account
preferences.
Importing Cost Data from Adwords All AdWords cost data from an account will be imported into any profile in which the Apply Cost Data
checkbox is selected.
Make sure both your AdWords and Analytics accounts are set to the same currency so that ROI data is
accurately calculated.
Recall that when linking your AdWords account to your Analytics account, your cost data will be applied to
all of your profiles.
If you don't want cost data imported into a particular profile, you can edit the profile settings. Within the
"Edit Profile Information" screen, find the "Apply Cost Data" checkbox. De-select this checkbox.
And finally, note that Google Analytics is only able to import cost data from AdWords, and not from other
ad networks.
Data Discrepancies: Expected Behavior You may notice differences between the data in your Google Analytics and AdWords reports. There are
several reasons for these differences.
First, AdWords tracks clicks, while Analytics tracks visits. Second, some visitors who click on your
AdWords ads may have JavaScript, cookies, or images turned off. As a result, Analytics won't
report these visits, but AdWords will report the click.
You’ll also see differences between Analytics and AdWords if the Google Analytics Tracking Code on
your landing page doesn’t execute. In this case, AdWords will report the click but Analytics will not
record the visit.
Invalid clicks may also cause reporting differences because while Google AdWords automatically
filters invalid clicks from your reports, Google Analytics will still report the visits.
Finally, keep in mind that AdWords data is uploaded once a day to Analytics so the results for each
may be temporarily out of sync.
Data Discrepancies: Common Issues Make sure that your landing pages contain the Google Analytics Tracking Code. If they don’t, campaign
information will not be passed to Analytics, but clicks will register in AdWords.
Make sure that you have autotagging enabled. Otherwise, visits will be marked as Google Organic instead
of Google CPC. While we strongly recommend that you use autotagging instead of manual tagging, if you
do manually tag your destination URLs, you must make sure that all of them are tagged, otherwise data
discrepancies will occur.
Be aware that campaign data can be lost if your site uses redirects. As a result, Analytics won’t show the
visits as coming from AdWords, but your AdWords report will still report the clicks.

Tracking Online Marketing Google Analytics automatically tracks all of the referrals and search queries that send traffic to your
website.
However, if you are running paid advertising campaigns, you should add tags to the destination URLs of
your ads.
Adding a tag allows you to attach information about the campaign that will show up in your Analytics
reports.
What about Adwords? Although it’s possible to manually tag your AdWords ads, you should enable auto-tagging instead.
If you manually tag your AdWords ads, the AdWords reports will only show you information by Campaign
and Keyword.
If you enable auto-tagging, you’ll be able to see much more detail. The AdWords reports will show you
results by ad group, matched search query, placement domain and many other AdWords attributes.
URL Tagging There are five variables you can use when tagging URLs. To tag a URL, you add a question mark to the end
of the URL, followed by your tag, as shown in the slide.
The variables and values are listed as pairs separated by an equals sign. Each variable-value pair is
separated by an ampersand.
Let’s look at each variable.
You should use utm_source to identify the specific website or publication that is sending the traffic.
Use utm_medium to identify the kind of advertising medium -- for example, cpc for cost per click,
or email for an email newsletter.
Use utm_campaign to identify the name of the campaign -- for example, this could be the product
name or it might be a slogan.
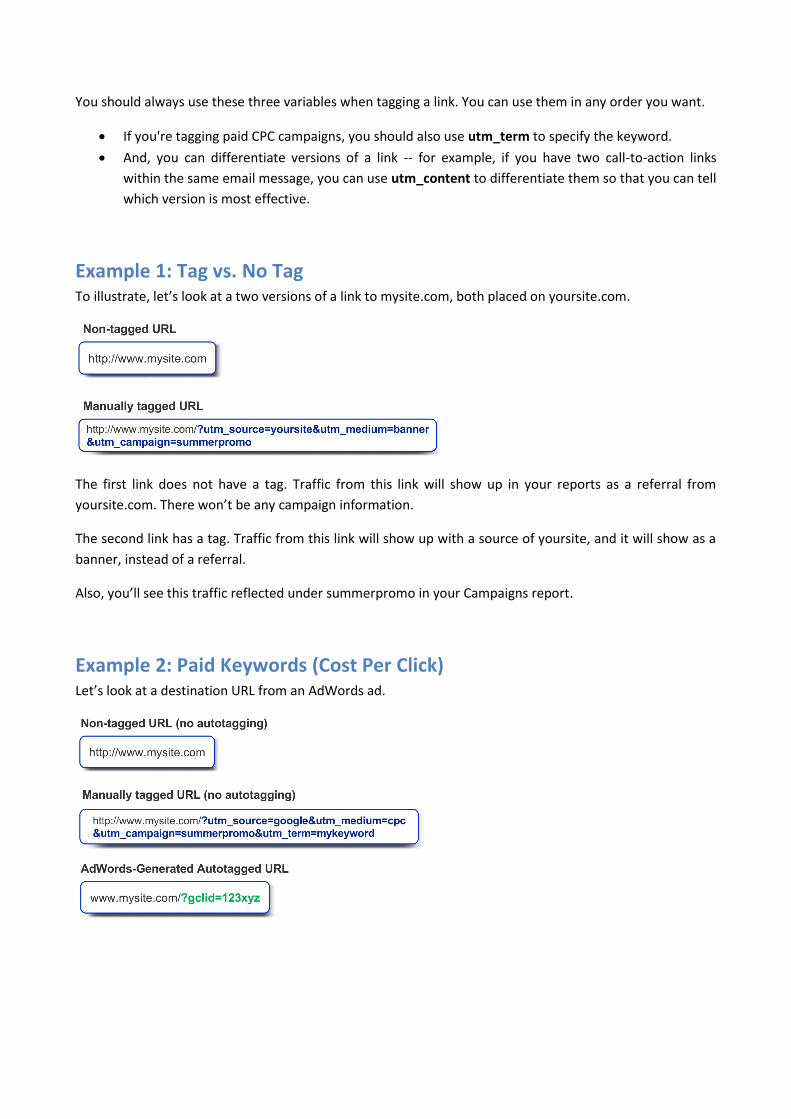
You should always use these three variables when tagging a link. You can use them in any order you want.
If you're tagging paid CPC campaigns, you should also use utm_term to specify the keyword.
And, you can differentiate versions of a link -- for example, if you have two call-to-action links
within the same email message, you can use utm_content to differentiate them so that you can tell
which version is most effective.
Example 1: Tag vs. No Tag To illustrate, let’s look at a two versions of a link to mysite.com, both placed on yoursite.com.
The first link does not have a tag. Traffic from this link will show up in your reports as a referral from
yoursite.com. There won’t be any campaign information.
The second link has a tag. Traffic from this link will show up with a source of yoursite, and it will show as a
banner, instead of a referral.
Also, you’ll see this traffic reflected under summerpromo in your Campaigns report.
Example 2: Paid Keywords (Cost Per Click) Let’s look at a destination URL from an AdWords ad.

In the first example, no tag has been provided and autotagging is disabled. In this case, you won’t
see this traffic in your AdWords reports.
The second example shows how to manually tag an AdWords link. This traffic will show up in your
AdWords reports, but information will be limited to campaign and keyword. You must specify cpc
as your medium and google as your source in order to see this traffic in your AdWords reports. You
should also specify cpc as your medium when tagging paid search campaigns from other search
engines.
The third example shows what an AdWords autotagged URL might look like once AdWords has
appended the g-c-l-i-d variable to the end of the URL. This traffic will show up in your AdWords
reports and you’ll see complete AdWords information.
Where is the Campaign Information Reflected? Let’s look at where information from each of the tags shows up in your reports.
Source
You can see all the sources in the All Traffic Sources report. This report will include not only all the sources
you tagged, but also sources like “direct” and website names.
Medium
You can see also see traffic by medium in the All Traffic Sources report. In addition to all the mediums you
tagged, you’ll also see mediums such as “referral” and “organic”.
Campaign
Campaigns will appear in the Campaigns report.
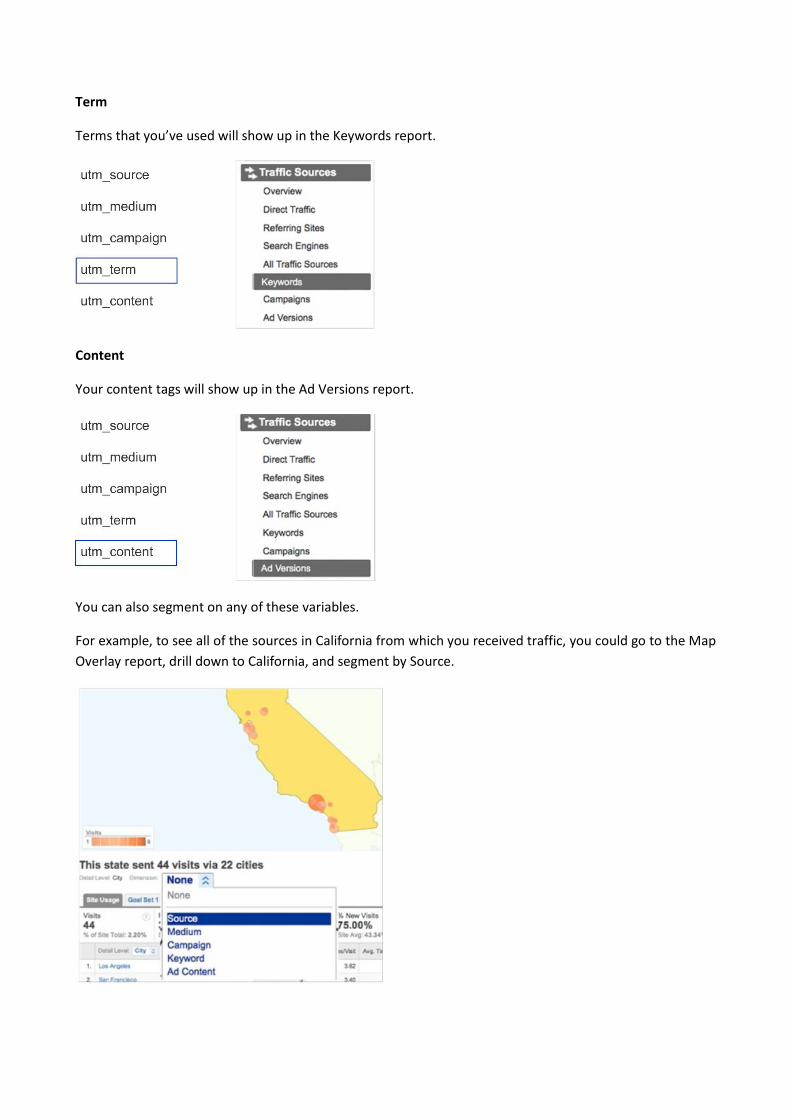
Term
Terms that you’ve used will show up in the Keywords report.
Content
Your content tags will show up in the Ad Versions report.
You can also segment on any of these variables.
For example, to see all of the sources in California from which you received traffic, you could go to the Map
Overlay report, drill down to California, and segment by Source.

The URL Builder You can use the URL Builder in the Google Analytics Help Center to construct your URLs.
You enter in the destination URL and the values for each campaign variable. You should always use source,
medium and campaign name.
The URL Builder can be found via the link displayed, or you can search for “URL Builder” in the Analytics
Help Center.
The URL builder can only construct one URL at a time, so you probably won’t want to use it to construct
every URL for every campaign.
Generating URLs If you have a large number of URLs to tag, you can use spreadsheets to automate the process. Generate a
sample URL in the URL Builder and create a simple spreadsheet formula.
Spreadsheets can make it much easier to generate thousands of tagged URLs.

Best Practices for Tagging Links Stick to these best practices when tagging your advertising campaigns.
If you use AdWords, be sure to enable auto-tagging. Otherwise, you’ll miss out on important
information that can help you optimize your AdWords campaigns.
Second, for each campaign, use the URL Builder to create a template URL. Then, copy and paste
from the template to create the rest of the URLs for the campaign.
Third, use consistent names and spellings for all your campaign values so that they are recorded
consistently within your Analytics reports
Finally, use only the campaign variables you need. You should always use source, medium, and
campaign name, but term and content are optional.
ANALYSIS FOCUS – ADWORDS Watch Youtube video: http://www.youtube.com/watch?v=6HM_d-zH4LI

GOALS
Goals Defining site goals and tracking goal conversions is one of the best ways to assess how well your site meets
its business objectives. You should always try to define at least one goal for a website.
So what is a goal? In Google Analytics, a goal represents an activity or a level of interaction with your
website that’s important to the success of your business.
Some examples of goals are an account signup, a request for a sales call, or even that the visitor spent a
certain amount of time on the website.
Goals – Three Types There are three types of goals in Google Analytics.
A URL Destination goal is a page that visitors see once they have completed an activity. For an
account sign-up, this might be the “Thank You for signing up” page. For a purchase, this might be
the receipt page. A URL Destination goal triggers a conversion when a visitor views the page you've
specified.
A Time on Site goal is a time threshold that you define. When a visitor spends more or less time on
your site than the threshold you specify, a conversion is triggered.
A Pages per Visit goal allows you to define a pages viewed threshold. When a visitor views more
pages --or fewer pages --than the threshold you've set, a conversion is triggered.
Goals in Reports You can see total conversions and conversion rates for each of your goals in your reports.

Funnels For each URL Destination goal that you define, you can also define a funnel. A funnel is the set of steps, or
pages, that you expect visitors to visit on their way to complete the conversion.
A sales checkout process is a good example of a funnel. And the page where the visitor enters credit card
information is an example of one of the funnel steps.
So, the goal page signals the end of the activity -- such as a “thank you” or “confirmation” page -- and the
funnel steps are the pages that visitors encounter on their way to the goal.
Why Define Funnels? Defining a funnel is valuable because it allows you to see where visitors enter and exit the conversion
process.
For example, if you notice that many of your visitors never go further than the “Enter shipping information”
page, you might focus on redesigning that page so that it’s simpler.
Knowing which steps in the process lose would-be customers allows you to eliminate bottlenecks and
create a more efficient conversion path.
Setting Up Goals To set up a goal, first go the Analytics Settings page and edit the the profile for which you want to configure
a goal.
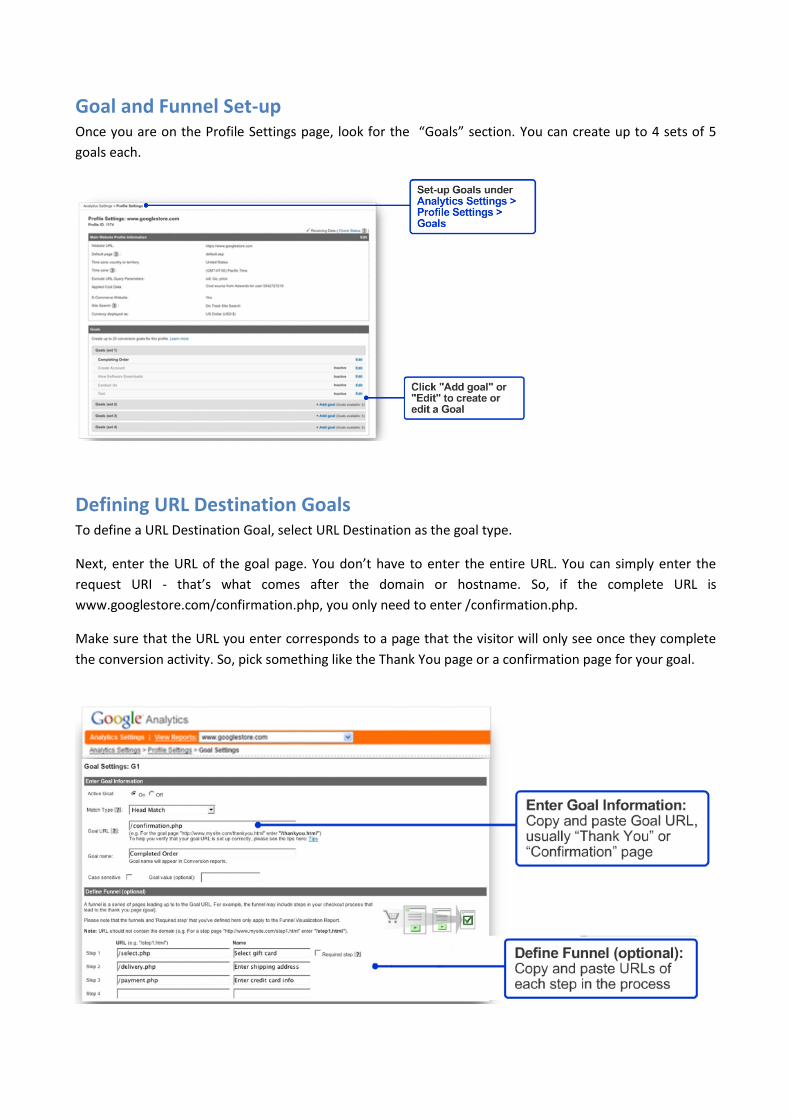
Goal and Funnel Set-up Once you are on the Profile Settings page, look for the “Goals” section. You can create up to 4 sets of 5
goals each.
Defining URL Destination Goals To define a URL Destination Goal, select URL Destination as the goal type.
Next, enter the URL of the goal page. You don’t have to enter the entire URL. You can simply enter the
request URI - that’s what comes after the domain or hostname. So, if the complete URL is
www.googlestore.com/confirmation.php, you only need to enter /confirmation.php.
Make sure that the URL you enter corresponds to a page that the visitor will only see once they complete
the conversion activity. So, pick something like the Thank You page or a confirmation page for your goal.

You can also enter a name for the Goal -- here we’ve entered “Completed Order”. This name will appear in
your conversion reports.
Defining a funnel is optional. To define your funnel steps, you add the URLs of the pages leading up to the
goal URL. Just as with goals, you don’t have to enter the entire URL of a funnel step -- just the request URI is
fine.
Provide a name for each step in the funnel -- here we’ve entered “Select gift card “ for Step 1. The names
you enter will appear in your reports.
Goal URL Match Types The match type defines how Google Analytics identifies a goal or funnel step. You have three choices for
the Match Type option.
“Head Match” is the default. It indicates that the URL of the page visited must match what you
enter for the Goal URL, but if there is any additional data at the end of their URL then the goal will
still be counted. For example, some websites append a product ID or a visitor ID or some other
parameter to the end of the URL. Head Match will ignore these.
Here’s another example, illustrated on this slide: If you want every page in a subdirectory to be
counted as a goal, then you could enter the subdirectory as the goal and select Head Match.
“Exact Match” means that the URL of the page visited must exactly match what you enter for the
Goal URL. In contrast to Head Match, which can be used to match every page in a subdirectory,
Exact Match can only be used to match one single page. Also notice that Exact Match does not
match the second pageview, “/offer1/signup.html?query=hats” because of the extra query
parameter at the end.
“Regular Expression Match” gives you the most flexibility. For example, if you want to count any
sign-up page as a goal, and sign-up pages can occur in various subdirectories, you can create a
regular expression that will match any sign-up page in any subdirectory. Regular Expressions will be
covered in a later module.
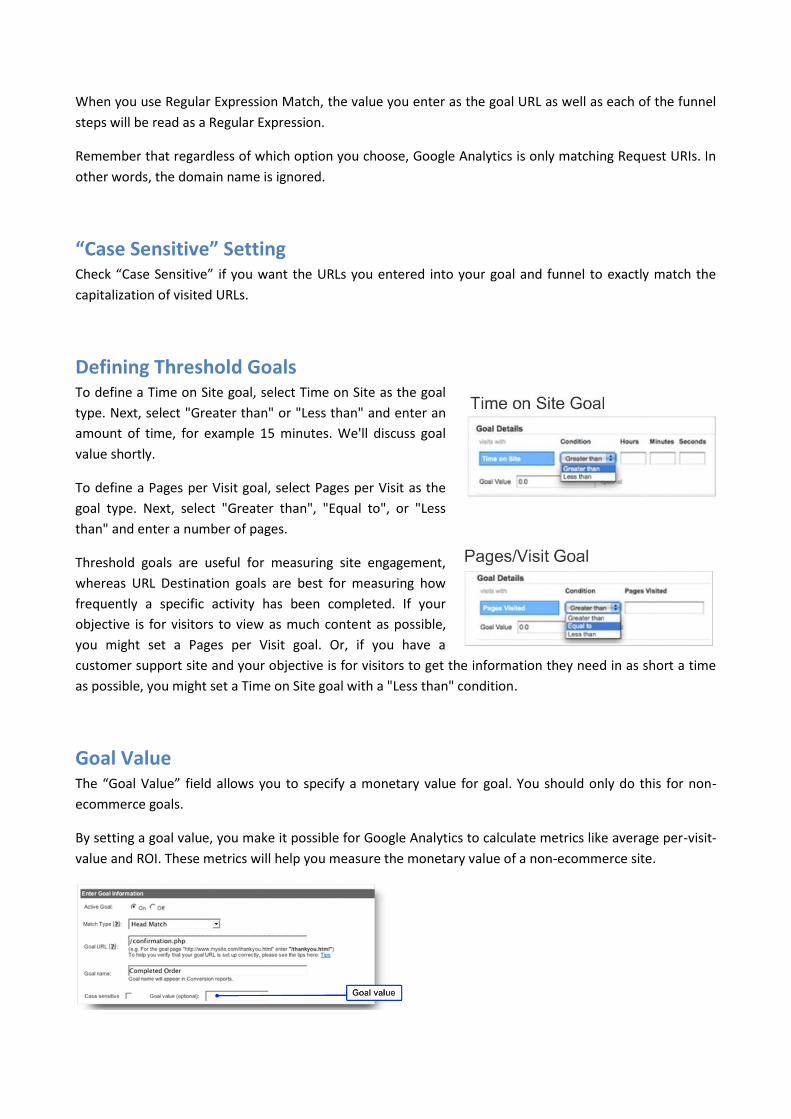
When you use Regular Expression Match, the value you enter as the goal URL as well as each of the funnel
steps will be read as a Regular Expression.
Remember that regardless of which option you choose, Google Analytics is only matching Request URIs. In
other words, the domain name is ignored.
“Case Sensitive” Setting Check “Case Sensitive” if you want the URLs you entered into your goal and funnel to exactly match the
capitalization of visited URLs.
Defining Threshold Goals To define a Time on Site goal, select Time on Site as the goal
type. Next, select "Greater than" or "Less than" and enter an
amount of time, for example 15 minutes. We'll discuss goal
value shortly.
To define a Pages per Visit goal, select Pages per Visit as the
goal type. Next, select "Greater than", "Equal to", or "Less
than" and enter a number of pages.
Threshold goals are useful for measuring site engagement,
whereas URL Destination goals are best for measuring how
frequently a specific activity has been completed. If your
objective is for visitors to view as much content as possible,
you might set a Pages per Visit goal. Or, if you have a
customer support site and your objective is for visitors to get the information they need in as short a time
as possible, you might set a Time on Site goal with a "Less than" condition.
Goal Value The “Goal Value” field allows you to specify a monetary value for goal. You should only do this for non-
ecommerce goals.
By setting a goal value, you make it possible for Google Analytics to calculate metrics like average per-visit-
value and ROI. These metrics will help you measure the monetary value of a non-ecommerce site.
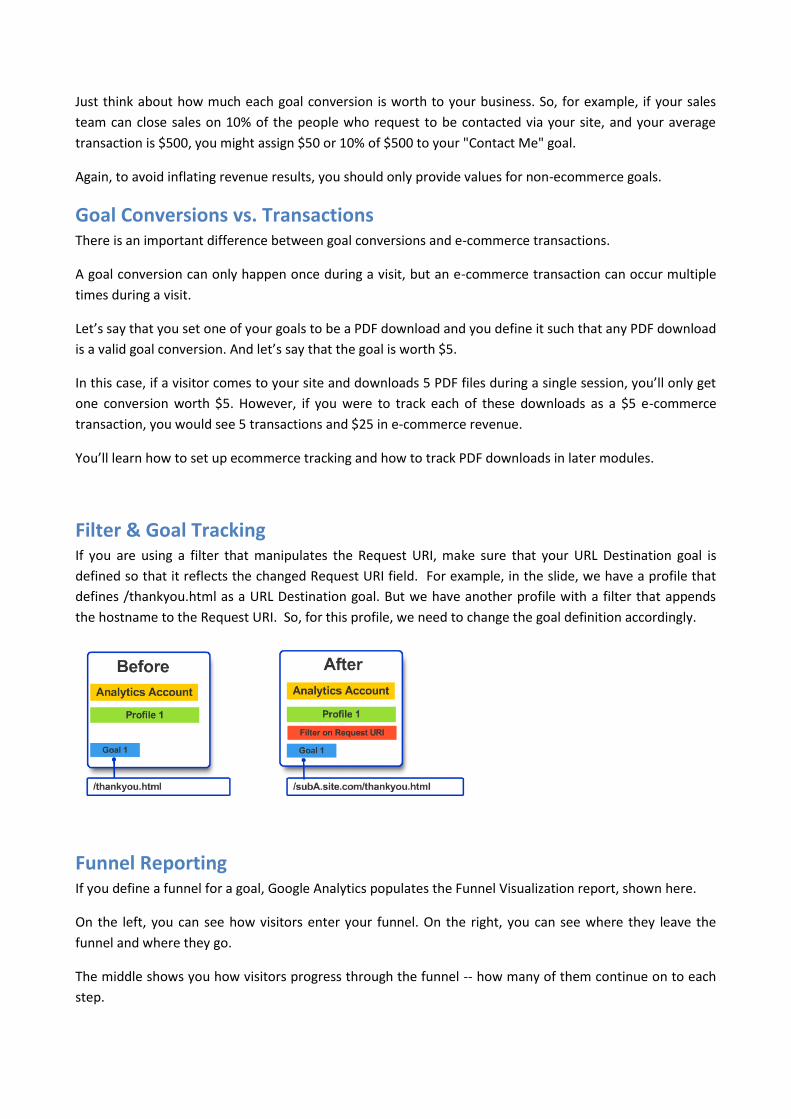
Just think about how much each goal conversion is worth to your business. So, for example, if your sales
team can close sales on 10% of the people who request to be contacted via your site, and your average
transaction is $500, you might assign $50 or 10% of $500 to your "Contact Me" goal.
Again, to avoid inflating revenue results, you should only provide values for non-ecommerce goals.
Goal Conversions vs. Transactions There is an important difference between goal conversions and e-commerce transactions.
A goal conversion can only happen once during a visit, but an e-commerce transaction can occur multiple
times during a visit.
Let’s say that you set one of your goals to be a PDF download and you define it such that any PDF download
is a valid goal conversion. And let’s say that the goal is worth $5.
In this case, if a visitor comes to your site and downloads 5 PDF files during a single session, you’ll only get
one conversion worth $5. However, if you were to track each of these downloads as a $5 e-commerce
transaction, you would see 5 transactions and $25 in e-commerce revenue.
You’ll learn how to set up ecommerce tracking and how to track PDF downloads in later modules.
Filter & Goal Tracking If you are using a filter that manipulates the Request URI, make sure that your URL Destination goal is
defined so that it reflects the changed Request URI field. For example, in the slide, we have a profile that
defines /thankyou.html as a URL Destination goal. But we have another profile with a filter that appends
the hostname to the Request URI. So, for this profile, we need to change the goal definition accordingly.
Funnel Reporting If you define a funnel for a goal, Google Analytics populates the Funnel Visualization report, shown here.
On the left, you can see how visitors enter your funnel. On the right, you can see where they leave the
funnel and where they go.
The middle shows you how visitors progress through the funnel -- how many of them continue on to each
step.

In this example, we can see that there were 9,283 entrances at the top of the funnel and 187 completed
orders, at the bottom of the funnel.
This report is very useful for identifying the pages from which visitors abandon your conversion funnel.
Reverse Goal Path Reporting Here’s another report in the Goals section. It’s the Reverse Goal Path report. You can see this data even if
you haven’t defined a funnel. It lists the navigation paths that visitors took to arrive at a goal page and
shows you the number of conversions that resulted from each path.
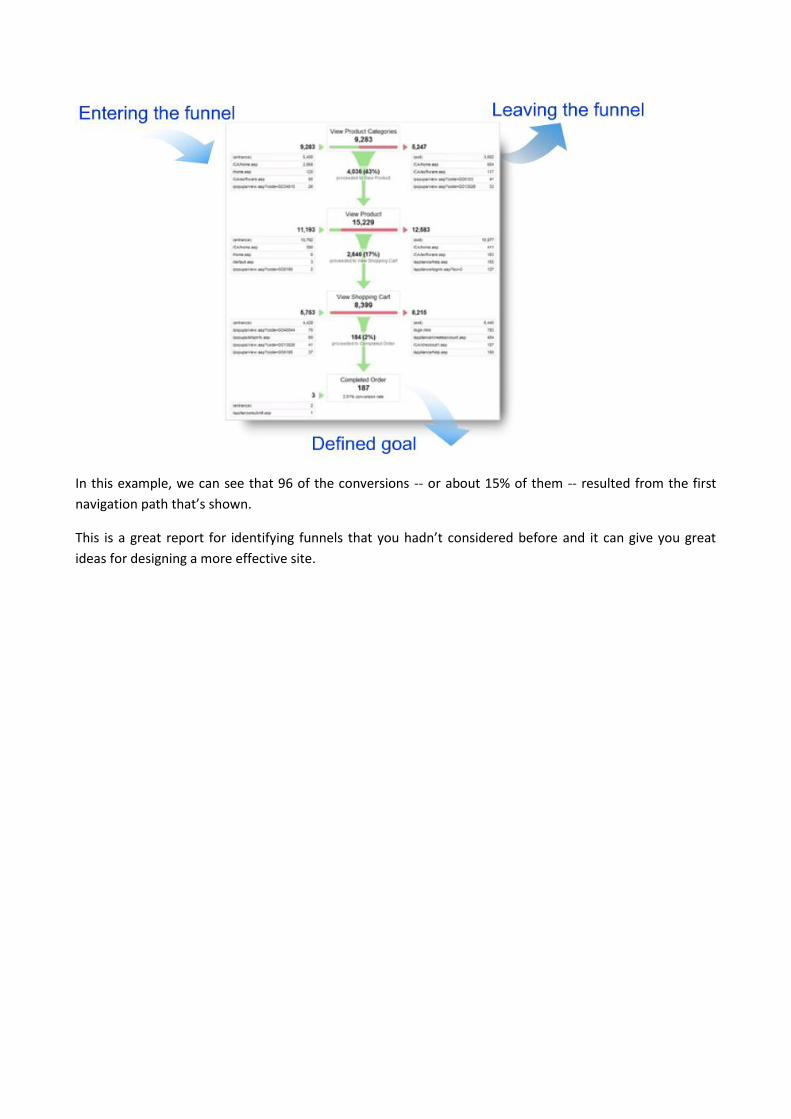
In this example, we can see that 96 of the conversions -- or about 15% of them -- resulted from the first
navigation path that’s shown.
This is a great report for identifying funnels that you hadn’t considered before and it can give you great
ideas for designing a more effective site.

ANALYSIS FOCUS – FUNNEL VISUALIZATION
Funnel Visualization Report If you define a funnel for a goal, Google Analytics populates the Funnel Visualization report, shown here in
the slide.
On the left, you can see how visitors enter your funnel. On the right, you can see where they leave the
funnel and where they go. The middle shows you how visitors progress through the funnel, how many of
them continue on to each step.
In this example, we can see that there were 9,283 entrances at the top of the funnel and 187 completed
orders at the bottom of the funnel.
This report is very useful for identifying the pages from which visitors abandon your conversion funnel.
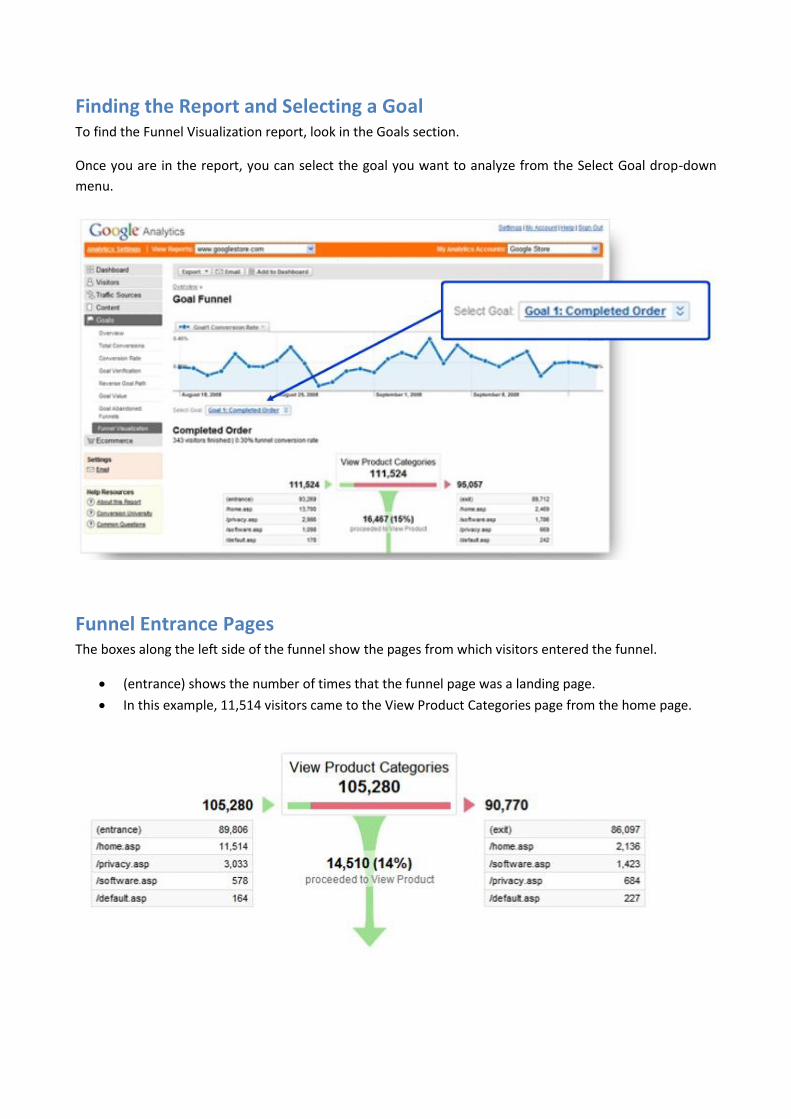
Finding the Report and Selecting a Goal To find the Funnel Visualization report, look in the Goals section.
Once you are in the report, you can select the goal you want to analyze from the Select Goal drop-down
menu.
Funnel Entrance Pages The boxes along the left side of the funnel show the pages from which visitors entered the funnel.
(entrance) shows the number of times that the funnel page was a landing page.
In this example, 11,514 visitors came to the View Product Categories page from the home page.
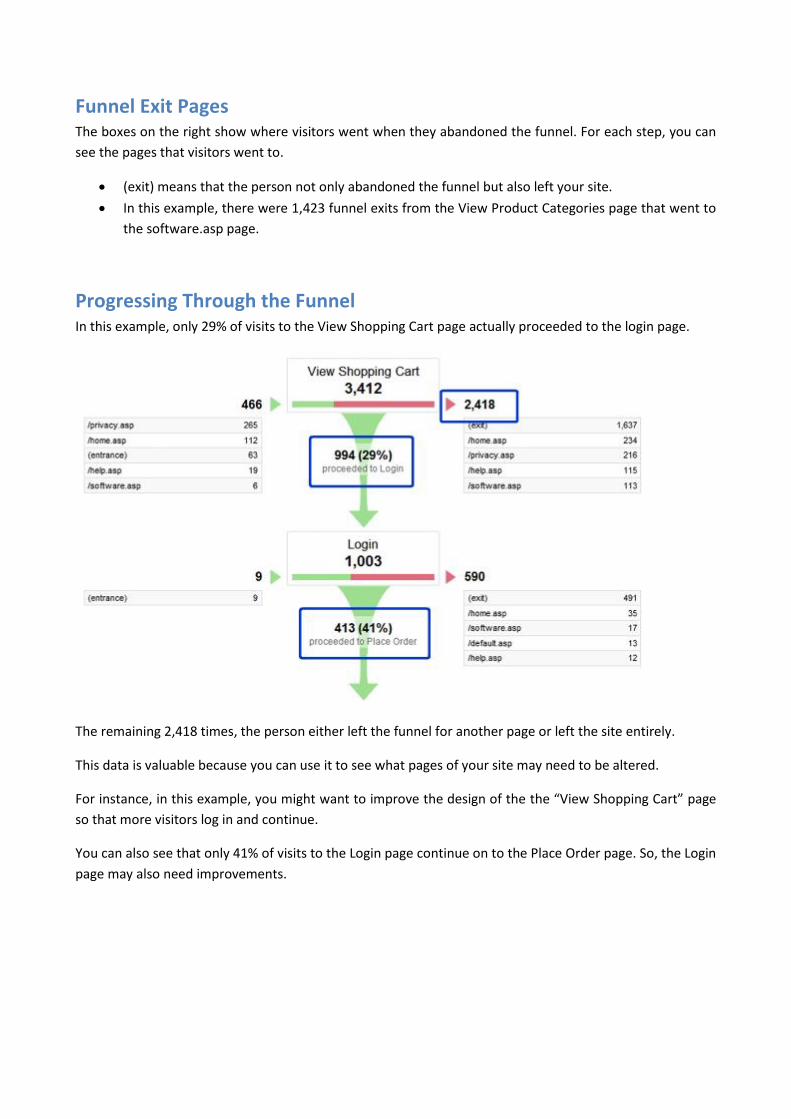
Funnel Exit Pages The boxes on the right show where visitors went when they abandoned the funnel. For each step, you can
see the pages that visitors went to.
(exit) means that the person not only abandoned the funnel but also left your site.
In this example, there were 1,423 funnel exits from the View Product Categories page that went to
the software.asp page.
Progressing Through the Funnel In this example, only 29% of visits to the View Shopping Cart page actually proceeded to the login page.
The remaining 2,418 times, the person either left the funnel for another page or left the site entirely.
This data is valuable because you can use it to see what pages of your site may need to be altered.
For instance, in this example, you might want to improve the design of the the “View Shopping Cart” page
so that more visitors log in and continue.
You can also see that only 41% of visits to the Login page continue on to the Place Order page. So, the Login
page may also need improvements.

Understanding the Numbers Let’s look at all the numbers in the report.

FILTERS
Overview Google Analytics filters provide you with an extremely flexible way of defining what data is included in your
reports and how it appears.
You can use them to customize your reports so that data that you deem useful is highlighted in interesting
ways. Filters can also help you clean up your data so that it is easier to read.
There are two types of filters in Google Analytics:
predefined filters
custom filters
You can use the Filter manager to create new filters, to edit their settings, and to delete them.
To apply filters to a profile, you edit the profile.
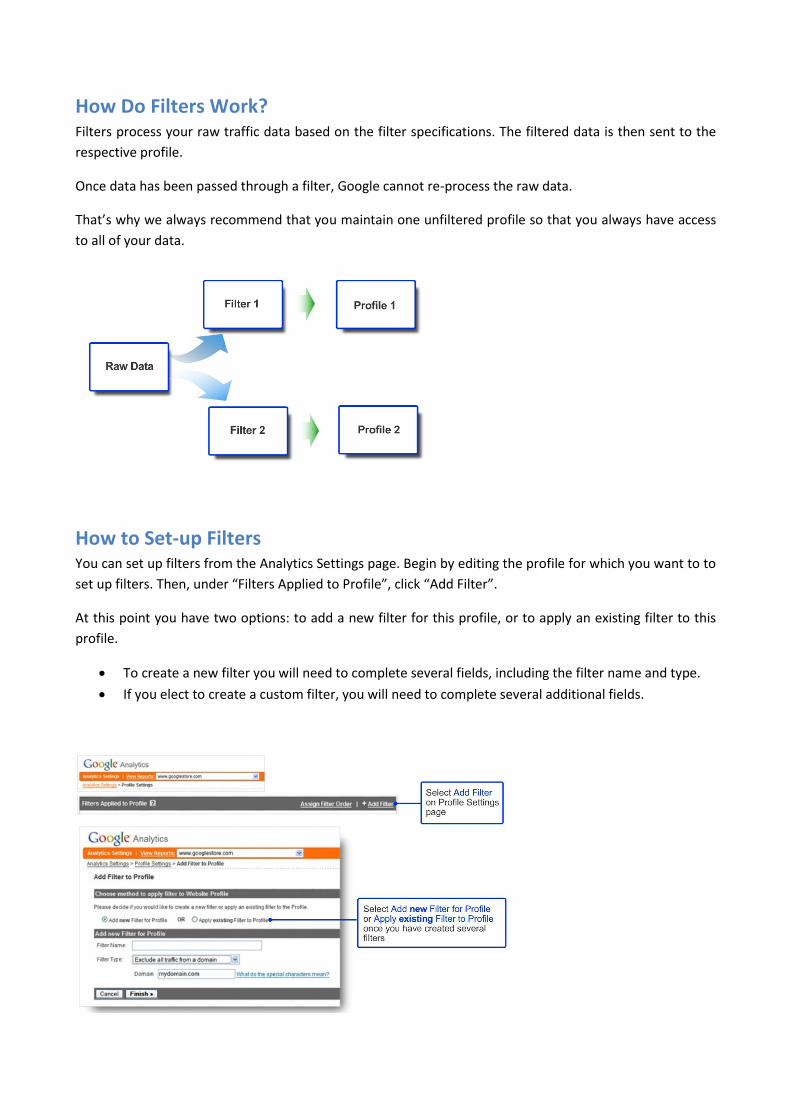
How Do Filters Work? Filters process your raw traffic data based on the filter specifications. The filtered data is then sent to the
respective profile.
Once data has been passed through a filter, Google cannot re-process the raw data.
That’s why we always recommend that you maintain one unfiltered profile so that you always have access
to all of your data.
How to Set-up Filters You can set up filters from the Analytics Settings page. Begin by editing the profile for which you want to to
set up filters. Then, under “Filters Applied to Profile”, click “Add Filter”.
At this point you have two options: to add a new filter for this profile, or to apply an existing filter to this
profile.
To create a new filter you will need to complete several fields, including the filter name and type.
If you elect to create a custom filter, you will need to complete several additional fields.

Predefined Filters Google Analytics provides three commonly used predefined filters -- you’ll see these filters under the “Filter
Type” drop-down when you are creating your filters.
The first filter called “Exclude all traffic from a domain” excludes traffic from the domain that you
specify in the Domain field directly below the Filter Type dropdown. If you apply this filter, Google
Analytics will apply a reverse lookup with each visitor’s IP address to determine if the visitor is
coming in from a domain that should be filtered out. Domains usually represent the ISP of your
visitor although larger companies generally have their IP addresses mapped to their domain name.
The second filter, “Exclude all traffic from an IP address”, removes traffic from addresses entered
into the IP address field. This filter is generally used to exclude your internal company traffic.
The third filter, “Include only traffic to a subdirectory”, causes your profile to only report traffic to
a specified directory on your site. This is typically used on a profile that is created to track one part
of a website.
Best Practices for Filters As a best practice, we recommend that you create a filter to exclude your internal company traffic from
your reports.
To do this you can use the predefined filter type called “Exclude all traffic from an IP address”. You will
need to enter your IP address or range of addresses into the ‘IP address” field.
Creating Custom Filters In addition to the three pre-defined filters that Analytics offers, you can also create custom filters for your
profiles.
Custom filters offer you greater control over what data appears in your profiles.
To create a custom filter, select “Custom filter” from the “Filter Type” drop-down. Additional fields will
appear when you choose this option.

Each custom filter has three main parts.
The first part of a custom filter is “Filter Types”. There are six filter types available and each one
serves a specific purpose. We’ll look at these in a minute.
The second part is the “Filter Field”. There are numerous fields you can use to create your filter.
Examples of some commonly used fields are the “Request URI” and “Visitor Country” fields.
The complete list of fields can be found through the link shown here or you can search for “filter
fields” in the Analytics Help Center.
The third part of a custom filter is the “Filter Pattern”. This is the text string that is used to attempt
to match pageview data. The pattern that you provide is applied to the field and, if it matches any
part of the field, it returns a positive result and causes an action to occur. You’ll need to use POSIX
Regular Expressions to create the filter pattern. Learn more in the module on Regular Expressions.
Filter Types Here’s a chart that describes the filter types.

Exclude and Include filters are the most common types. They allow you to segment your data in many
different ways. They’re frequently used to filter out or filter in traffic from a particular state or country.
Lowercase and Uppercase filters do not require a filter pattern, only a filter field. Lowercase and Uppercase
filters are very useful for consolidating line items in a report. Let’s say, for example, that you see multiple
entries in your reports for a keyword or a URL, and the only difference between the multiple entries is that
sometimes the URL or keyword appears with a different combination of uppercase and lowercase letters.
You can use the Lowercase and Uppercase filters to consolidate these multiple entries into a single entry.
Search and Replace filters replace one piece of data with another. They are often used to replace long URL
strings with a shorter string that is easier to read and identify in your reports.
You can use Advanced filters to remove unnecessary data, replace one field with another, or combine
elements from multiple filter fields. For example, a best practice when tracking multiple subdomains in a
single profile is to append the subdomain name to the page names. You can do this by creating an
advanced filter that appends Hostname to Request URI.
Let's look at an example of a Search and Replace filter.
Example: Search and Replace Filter Here’s an example of how you might use a Search and Replace filter.
Let’s say that your website uses category IDs as an organizational structure. So, in your Top Content
reports, you’d see a list of Request URIs that indicate the different pages on your site.
The page “/category.asp?catid=5” is actually the Google Store Wearables page. You could make the Top
Content report more meaningful by replacing “catid=5” with a descriptive word, like “Wearables”.
Here’s what the Search and Replace filter might look like. This particular filter would overwrite the entire
Request URI with “Wearables.”
This is a simplified example to give you an idea of how you can use filters.

Filters and Profiles You can track and segment multiple sites from the same Analytics account, using the same JavaScript code.
And, once you’ve defined a filter, you can apply it to a single profile or across several profiles.
So, for example, in the slide, the graphic shows a single Analytics account with two profiles.
Filter 1 has been applied to both profiles.
Filter 2 has been applied only to Profile 2.
By setting up multiple profiles and applying filters creatively to each of them, you have a great deal of
reporting and analysis flexibility.
Again, you use the Filter manager to create and manage filters. To apply filters to a profile, you edit the
profile.
Customize Data Views You can also use profiles and filters together to create customized data views.
Let’s say that you want to have two different views of your data -- one view includes only traffic to a
subdomain and the other view only includes customers from a specific geographic region.
To do this, you’d set up Profile 2 and Profile 3 as shown here in the chart.
Or, for example, you might want to set up a profile that only inlcudes Google AdWords traffic. We’ll look at
how to do this in the next slide. Remember, you always want to maintain a profile that contains all of your
data. That’s Profile 1 in the chart.

How to Include Only Google Adwords Traffic To set up a profile that includes only Google AdWords traffic, you need to apply
the two Custom Include filters shown in the slide.
In filter one, you’ll filter on campaign source for a pattern of google.
In filter two, you’ll filter on campaign medium for a pattern of cpc.
You can apply these two filters in any order.
Tracking Subdomains Let’s look at how you can use profiles and filters to track subdomains.
If your subdomains are totally separate businesses, and you have no need for reports that include
cumulative traffic to both, then you could simply create a unique profile for each subdomain.
To do this, you’d install the “dash 1” version of your tracking code on your Subdomain A pages, and the
“dash 2” version of your tracking code on your Subdomain B pages.
But what if you want to analyze the traffic aggregated across both subdomains? In this case, you could set
up at 3 duplicate profiles. Then, you’d apply an Include filter to two of the profiles.
Profile 1 includes all traffic to both subdomains.
Profile 2 only includes traffic to subdomain A.
Profile 3 only includes traffic to subdomain B.
In this scenario, you’d install identical tracking code on every page of the site regardless of subdomain.
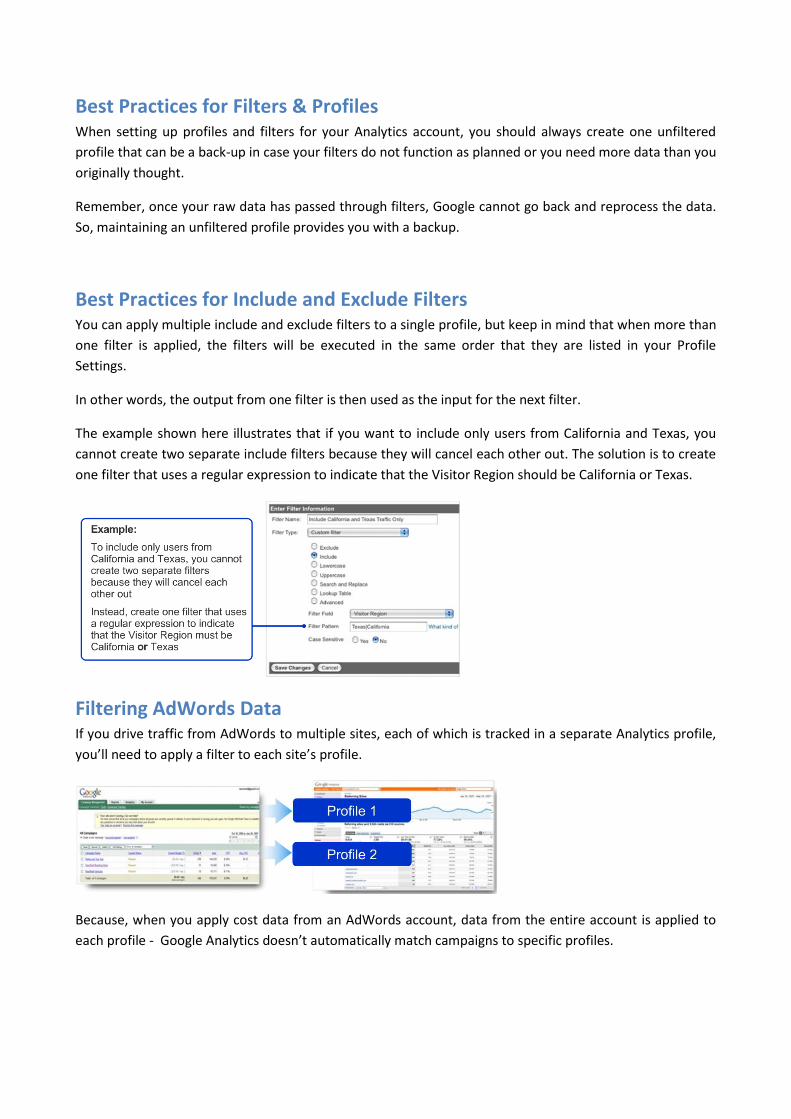
Best Practices for Filters & Profiles When setting up profiles and filters for your Analytics account, you should always create one unfiltered
profile that can be a back-up in case your filters do not function as planned or you need more data than you
originally thought.
Remember, once your raw data has passed through filters, Google cannot go back and reprocess the data.
So, maintaining an unfiltered profile provides you with a backup.
Best Practices for Include and Exclude Filters You can apply multiple include and exclude filters to a single profile, but keep in mind that when more than
one filter is applied, the filters will be executed in the same order that they are listed in your Profile
Settings.
In other words, the output from one filter is then used as the input for the next filter.
The example shown here illustrates that if you want to include only users from California and Texas, you
cannot create two separate include filters because they will cancel each other out. The solution is to create
one filter that uses a regular expression to indicate that the Visitor Region should be California or Texas.
Filtering AdWords Data If you drive traffic from AdWords to multiple sites, each of which is tracked in a separate Analytics profile,
you’ll need to apply a filter to each site’s profile.
Because, when you apply cost data from an AdWords account, data from the entire account is applied to
each profile - Google Analytics doesn’t automatically match campaigns to specific profiles.

One AdWords Account, Multiple URLs To illustrate what would happen if you don’t apply a filter, let’s imagine that you have two sites and you
spend $50 to drive traffic to each of them.
Without a filter, the Clicks tab on each profile would include $100 worth of cost data instead of just the $50
you spent for that site.
So, for each profile that should include a subset of your AdWords data, you’ll need to create a custom
include filter.
Filters for Cost Sources In your profile settings, select “edit filter”.
Create a custom filter and select the Include filter type.
For the filter field, select “Campaign Target URL”. This field only applies to Google AdWords data.
Use a regular expression to create the filter pattern based on the AdWords destination URL that is
applicable to this profile.
Once you’ve saved this filter, only AdWords data for this profile will be displayed in the reports.
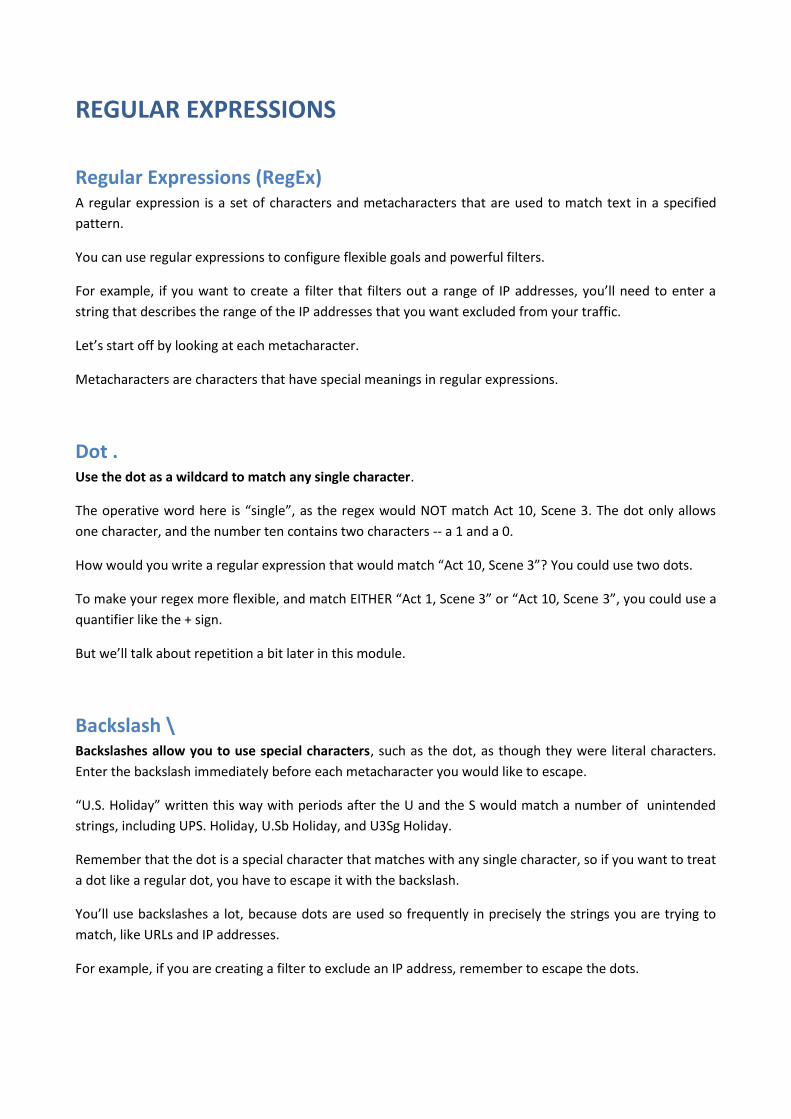
REGULAR EXPRESSIONS
Regular Expressions (RegEx) A regular expression is a set of characters and metacharacters that are used to match text in a specified
pattern.
You can use regular expressions to configure flexible goals and powerful filters.
For example, if you want to create a filter that filters out a range of IP addresses, you’ll need to enter a
string that describes the range of the IP addresses that you want excluded from your traffic.
Let’s start off by looking at each metacharacter.
Metacharacters are characters that have special meanings in regular expressions.
Dot . Use the dot as a wildcard to match any single character.
The operative word here is “single”, as the regex would NOT match Act 10, Scene 3. The dot only allows
one character, and the number ten contains two characters -- a 1 and a 0.
How would you write a regular expression that would match “Act 10, Scene 3”? You could use two dots.
To make your regex more flexible, and match EITHER “Act 1, Scene 3” or “Act 10, Scene 3”, you could use a
quantifier like the + sign.
But we’ll talk about repetition a bit later in this module.
Backslash \ Backslashes allow you to use special characters, such as the dot, as though they were literal characters.
Enter the backslash immediately before each metacharacter you would like to escape.
“U.S. Holiday” written this way with periods after the U and the S would match a number of unintended
strings, including UPS. Holiday, U.Sb Holiday, and U3Sg Holiday.
Remember that the dot is a special character that matches with any single character, so if you want to treat
a dot like a regular dot, you have to escape it with the backslash.
You’ll use backslashes a lot, because dots are used so frequently in precisely the strings you are trying to
match, like URLs and IP addresses.
For example, if you are creating a filter to exclude an IP address, remember to escape the dots.
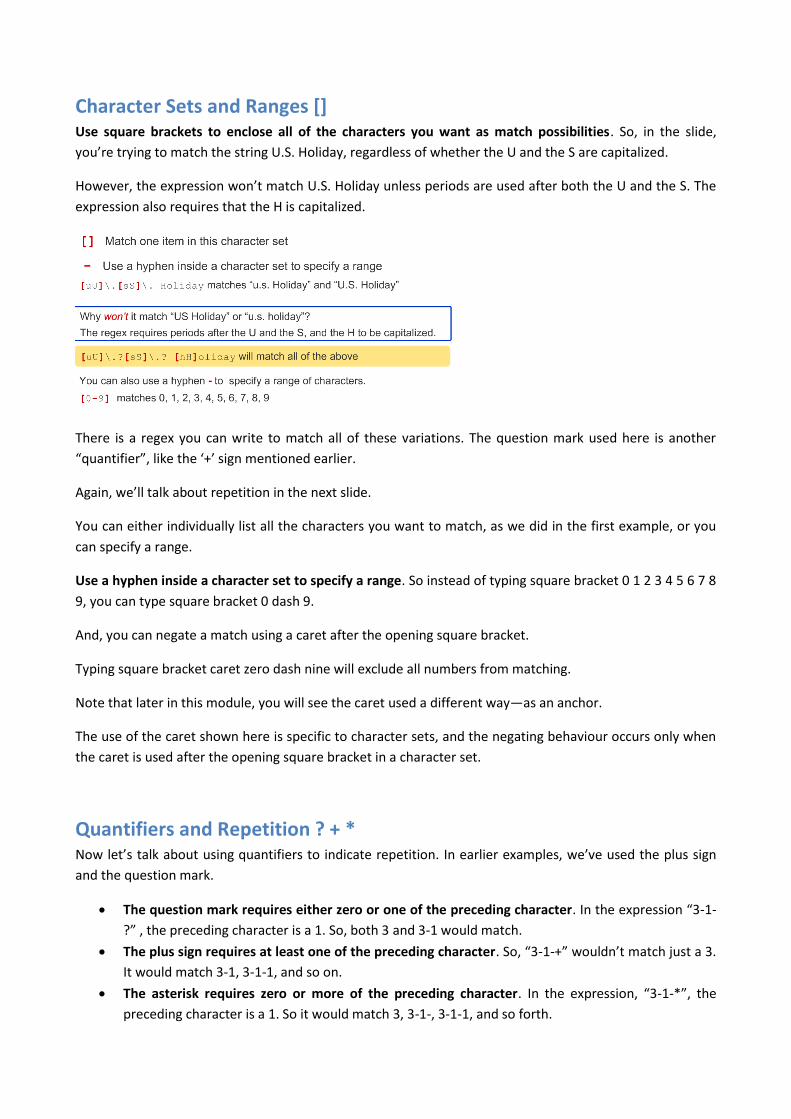
Character Sets and Ranges [] Use square brackets to enclose all of the characters you want as match possibilities. So, in the slide,
you’re trying to match the string U.S. Holiday, regardless of whether the U and the S are capitalized.
However, the expression won’t match U.S. Holiday unless periods are used after both the U and the S. The
expression also requires that the H is capitalized.
There is a regex you can write to match all of these variations. The question mark used here is another
“quantifier”, like the ‘+’ sign mentioned earlier.
Again, we’ll talk about repetition in the next slide.
You can either individually list all the characters you want to match, as we did in the first example, or you
can specify a range.
Use a hyphen inside a character set to specify a range. So instead of typing square bracket 0 1 2 3 4 5 6 7 8
9, you can type square bracket 0 dash 9.
And, you can negate a match using a caret after the opening square bracket.
Typing square bracket caret zero dash nine will exclude all numbers from matching.
Note that later in this module, you will see the caret used a different way—as an anchor.
The use of the caret shown here is specific to character sets, and the negating behaviour occurs only when
the caret is used after the opening square bracket in a character set.
Quantifiers and Repetition ? + * Now let’s talk about using quantifiers to indicate repetition. In earlier examples, we’ve used the plus sign
and the question mark.
The question mark requires either zero or one of the preceding character. In the expression “3-1-
?” , the preceding character is a 1. So, both 3 and 3-1 would match.
The plus sign requires at least one of the preceding character. So, “3-1-+” wouldn’t match just a 3.
It would match 3-1, 3-1-1, and so on.
The asterisk requires zero or more of the preceding character. In the expression, “3-1-*”, the
preceding character is a 1. So it would match 3, 3-1-, 3-1-1, and so forth.
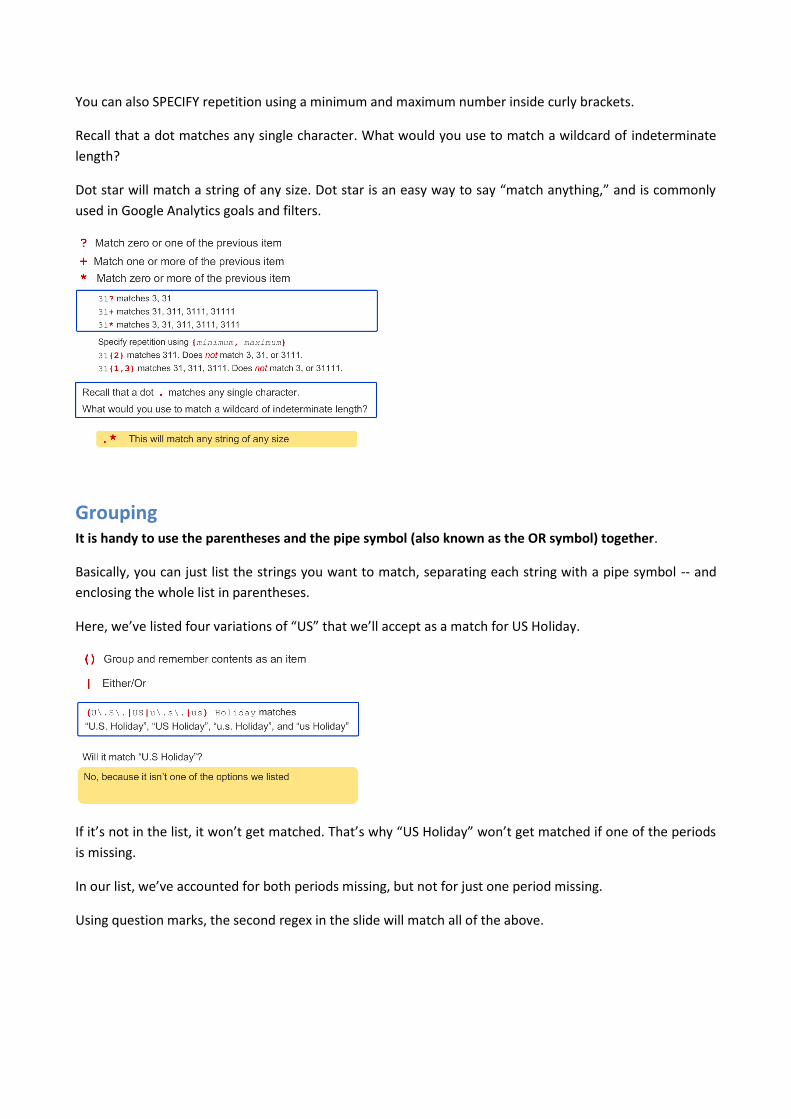
You can also SPECIFY repetition using a minimum and maximum number inside curly brackets.
Recall that a dot matches any single character. What would you use to match a wildcard of indeterminate
length?
Dot star will match a string of any size. Dot star is an easy way to say “match anything,” and is commonly
used in Google Analytics goals and filters.
Grouping It is handy to use the parentheses and the pipe symbol (also known as the OR symbol) together.
Basically, you can just list the strings you want to match, separating each string with a pipe symbol -- and
enclosing the whole list in parentheses.
Here, we’ve listed four variations of “US” that we’ll accept as a match for US Holiday.
If it’s not in the list, it won’t get matched. That’s why “US Holiday” won’t get matched if one of the periods
is missing.
In our list, we’ve accounted for both periods missing, but not for just one period missing.
Using question marks, the second regex in the slide will match all of the above.

Anchors ^ $ The caret signals the beginning of an expression. In order to match, the string must BEGIN with what the
regex specifies.
The dollar sign says, if there are any more characters after the END of this string, then it’s not a match.
So, caret US means start with US. US Holiday matches, but “Next Monday is a US Holiday” does not match.
Holiday$ means end with Holiday. US Holiday still matches, but “US Holiday Schedule” does not match.
Anchors can be useful when specifying an IP address. Take a look at these examples.
Shorthand Character Classes \d \s \w Some character classes are used so commonly that there is a shorthand that you can use instead of writing
out the ranges within square brackets.
Let’s look at the example of a simplified regex that could match an address:
Backslash d means match any one digit zero through nine.
Use curly brackets and a minimum and maximum number to specify how many digits to match.
Backslash d followed by 1 comma 5 in curly brackets means that the address must contain at least one
digit, and at most five digits.
Backslash s means that the number should be followed by one space, backslash w means match any
alphanumeric character and the star means include as many alphanumeric characters as you want.
“345 Embarcadero” matches, but just “Embarcadero” does not, because this regex requires the string to
start with a number.
If you want to make the number optional, group the first part of the regex with parentheses--including the
space--and follow it with the question mark.
Note that an address like “1600 Amphitheatre Parkway” would not match either, because the regex does
not account for the space between Amphitheatre and Parkway.
The slide shows one way you could account for this.
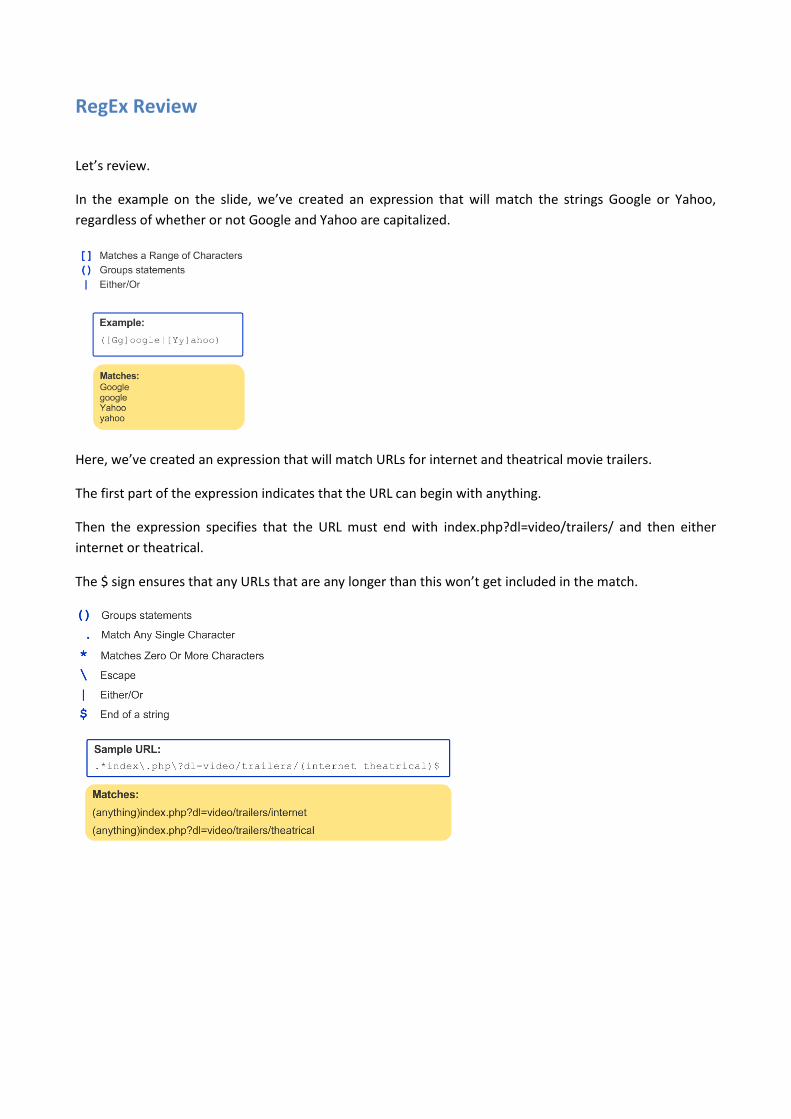
RegEx Review
Let’s review.
In the example on the slide, we’ve created an expression that will match the strings Google or Yahoo,
regardless of whether or not Google and Yahoo are capitalized.
Here, we’ve created an expression that will match URLs for internet and theatrical movie trailers.
The first part of the expression indicates that the URL can begin with anything.
Then the expression specifies that the URL must end with index.php?dl=video/trailers/ and then either
internet or theatrical.
The $ sign ensures that any URLs that are any longer than this won’t get included in the match.
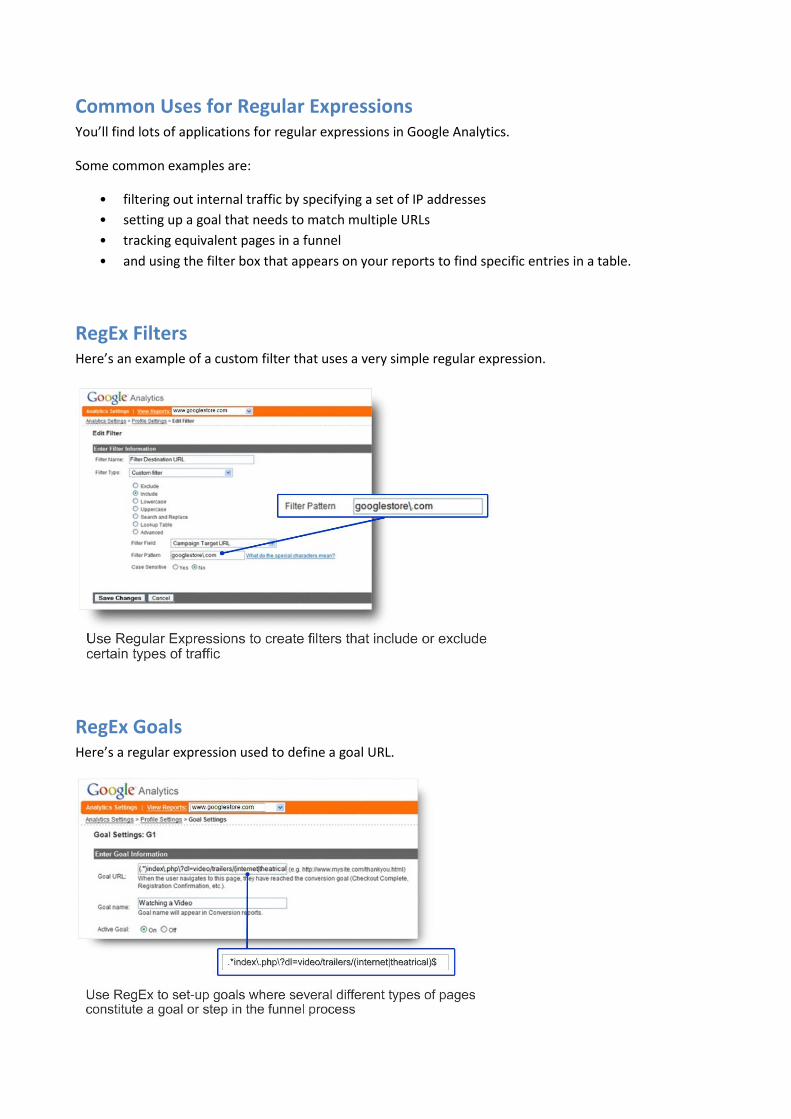
Common Uses for Regular Expressions You’ll find lots of applications for regular expressions in Google Analytics.
Some common examples are:
• filtering out internal traffic by specifying a set of IP addresses
• setting up a goal that needs to match multiple URLs
• tracking equivalent pages in a funnel
• and using the filter box that appears on your reports to find specific entries in a table.
RegEx Filters Here’s an example of a custom filter that uses a very simple regular expression.
RegEx Goals Here’s a regular expression used to define a goal URL.

RegEx and Tracking Equivalent Pages Here’s how you might use regular expressions to group pages or funnel steps on your site.
Using a regular expression allows you to track them as one funnel step rather than tracking each page or
action individually.
Learn how goals and funnels work in the module on goals.
RegEx Within the Report Interface And, here’s an example of using regular expressions within your reports. We’re using the Find box to
display all the rows in the table that contain Google or Yahoo.
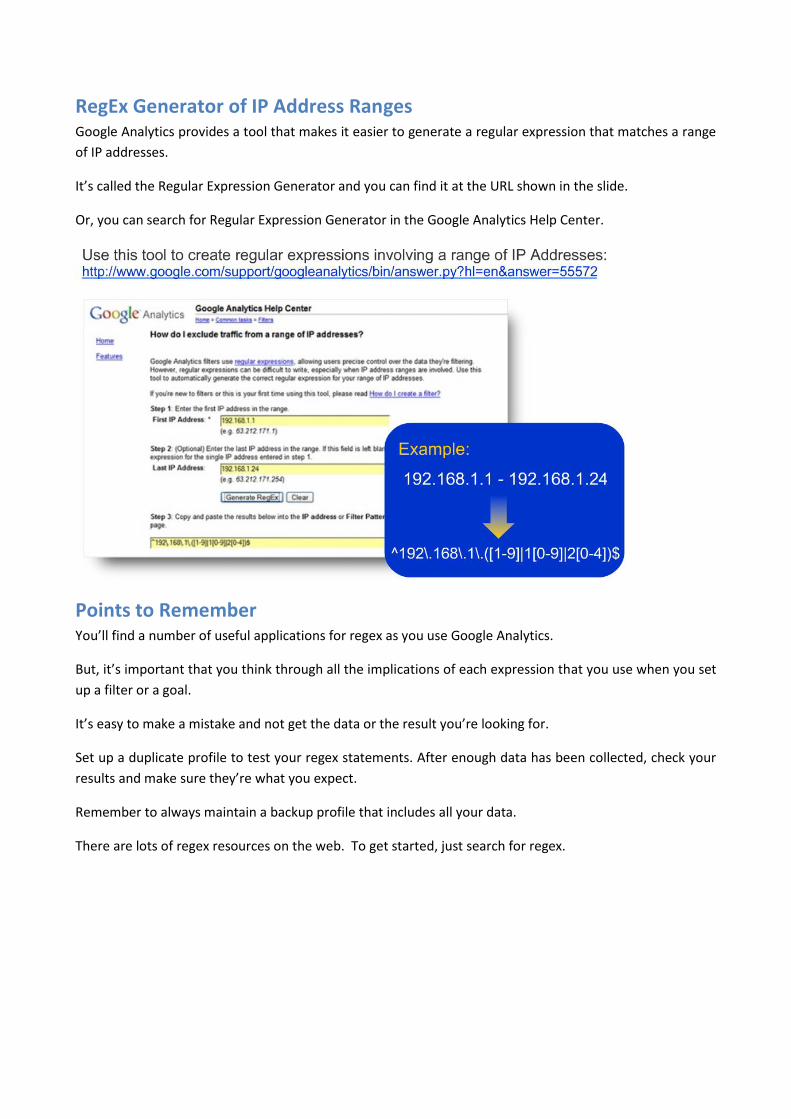
RegEx Generator of IP Address Ranges Google Analytics provides a tool that makes it easier to generate a regular expression that matches a range
of IP addresses.
It’s called the Regular Expression Generator and you can find it at the URL shown in the slide.
Or, you can search for Regular Expression Generator in the Google Analytics Help Center.
Points to Remember You’ll find a number of useful applications for regex as you use Google Analytics.
But, it’s important that you think through all the implications of each expression that you use when you set
up a filter or a goal.
It’s easy to make a mistake and not get the data or the result you’re looking for.
Set up a duplicate profile to test your regex statements. After enough data has been collected, check your
results and make sure they’re what you expect.
Remember to always maintain a backup profile that includes all your data.
There are lots of regex resources on the web. To get started, just search for regex.

COOKIES
What are Cookies? Some web sites store information about you or your computer in a small file called a cookie. The cookie is
stored on your hard drive.
Sites that run Google Analytics issue first party cookies that allow the site to uniquely, but anonymously,
identify individual visitors.
So, when a visitor returns to a site that runs Google Analytics, the site is able to remember that the visitor
has been to the site before and Google Analytics will only count that visitor once in unique visitor
calculations.
There are two types of cookies:
• First-party cookies are set by the domain being visited. Only the web site that created a first-party
cookie can read it. This is the kind of cookie used for Google Analytics tracking.
• Third-party cookies are set by third party sites -- basically sites other than the site being visited.
Users can choose whether to allow some, none, or all types of cookies to be set on their computers.
However, if a user does not allow cookies at all, they may not be able to view some Web sites or take
advantage of customization features.
Persistent vs. Temporary Cookies Cookies can be set with or without an expiration date. This detail is important in order to understand how
Google Analytics tracks visits and unique visitors.
• Persistent cookies have an expiration date, and remain on your computer even when you close
your browser or shut down. On return visits, persistent cookies can be read by the web site that
created them.
• Temporary cookies do not have an expiration date, as they are only stored for the duration of your
current browser session. As soon as you quit your browser, temporary cookies are destroyed.
Cookie-Based Visitor Tracking While it’s impossible to determine the exact number of web visitors who have cookies enabled or disabled,
available statistics suggest that the vast majority of visitors enable cookies.
Many kinds of sites require that visitors have cookies enabled.
For example, you need to have cookies enabled in order to login to many online shopping carts and to use
web mail.

First party cookies, which are the kind used for Google Analytics, are allowed by a majority of visitors.
Cookie tracking makes it possible to correlate shopping cart transactions with search campaign information,
and perform other visitor analysis.
Remember -- websites only have access to the information that you provide. Websites can’t get your email
address or access to any information on your computer unless you provide it. And since Google Analytics
only uses first party cookies, Google Analytics cookies can only be read by the website that created them.
The utm First-Party Cookies Google Analytics sets the five first-party cookies shown in the slide.
The __utmv cookie is optional, and will only be set if the _setVar() method is called. You will learn about
_setVar() in the module on Custom Visitor Segmentation.
All of the Google Analytics cookies are persistent except for one. The __utmc cookie is a temporary cookie
that is destroyed when the visitor quits the browser.
Each of the other Google Analytics cookies has an expiration date set in the future, meaning that the cookie
will persist on the user’s computer until it expires, or until the user deletes it from their computer.
Example: Google Analytics Cookies
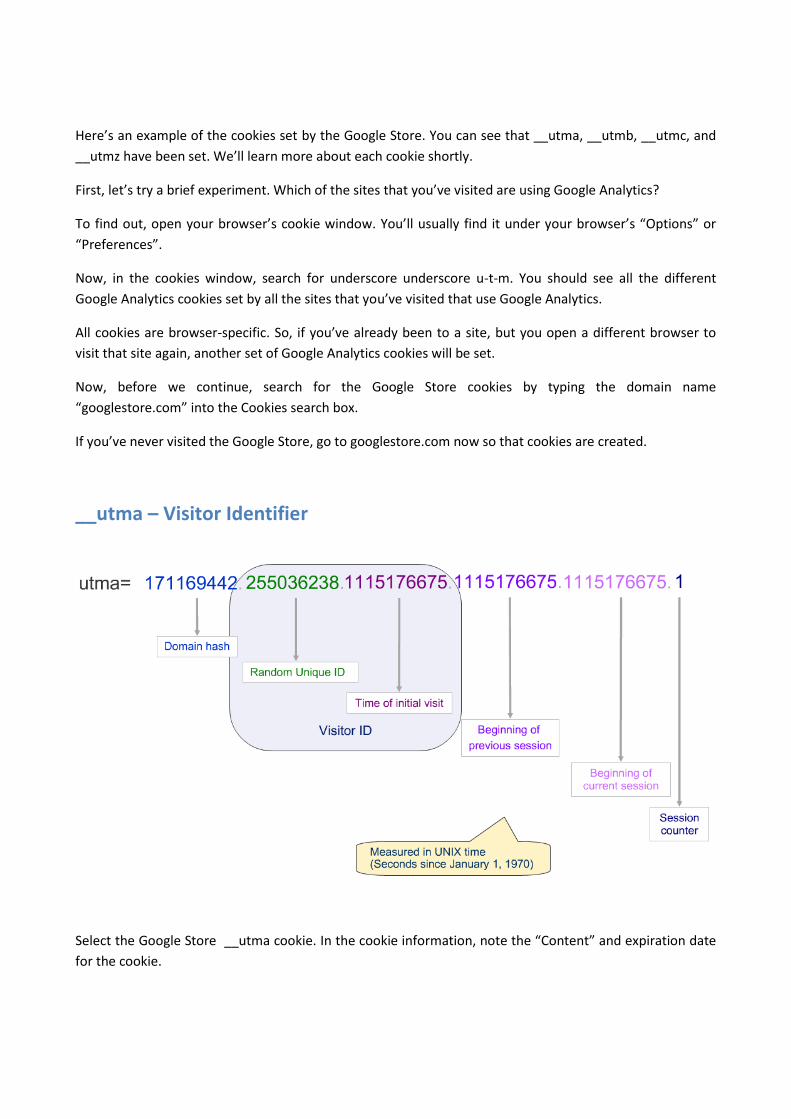
Here’s an example of the cookies set by the Google Store. You can see that __utma, __utmb, __utmc, and
__utmz have been set. We’ll learn more about each cookie shortly.
First, let’s try a brief experiment. Which of the sites that you’ve visited are using Google Analytics?
To find out, open your browser’s cookie window. You’ll usually find it under your browser’s “Options” or
“Preferences”.
Now, in the cookies window, search for underscore underscore u-t-m. You should see all the different
Google Analytics cookies set by all the sites that you’ve visited that use Google Analytics.
All cookies are browser-specific. So, if you’ve already been to a site, but you open a different browser to
visit that site again, another set of Google Analytics cookies will be set.
Now, before we continue, search for the Google Store cookies by typing the domain name
“googlestore.com” into the Cookies search box.
If you’ve never visited the Google Store, go to googlestore.com now so that cookies are created.
__utma – Visitor Identifier
Select the Google Store __utma cookie. In the cookie information, note the “Content” and expiration date
for the cookie.

• The first number in the content of every Google Analytics cookie is called the “domain hash.” It
represents the domain that you visited and that set these cookies. Google Analytics applies an
algorithm to the domain and outputs a unique numeric code that represents the domain. Each
Google Analytics cookie set by the domain will begin with this number.
• The next number is a random unique ID.
• The three subsequent numbers are timestamps. They represent the time of the initial visit, the
beginning of your previous session, and the beginning of your current session. The timestamps
represent the number of seconds since January 1, 1970. Notice that the last three timestamps are
the same. What does this tell you?
• The last number, the session counter, can give you the answer. The last number tells you the
number of times you have visited this site. This number will increment each time you visit the site.
The session counter here is “1”, and the last three timestamps are all the same because this is your
first visit to the site.
The random unique ID combined with the first timestamp make up the visitor ID that Google Analytics uses
to identify unique visitors to the site. These details allow Google Analytics to calculate the number of
unique visitors and number of visits.
Look at your Google Store __utma cookie.
How many times have you visited the Google Store? If you think you’ve visited more times than is indicated
by the cookie, remember that the cookie only includes the number of times you visited from this computer
using this browser.
Also, if you have cleared your cookies at some point, it is only counting from the last time you cleared your
cookies.
When does this cookie expire? You should see that the date is two years from last the time you visited.
__utmb & __utmc – Session Identifiers The __utmb and __utmc cookies together identify a session.
• The content of the __utmc cookie is simply the domain hash.
• The content of the __utmb cookie will also be the domain hash plus, if the site is using ga.js, some
additional values.
The key difference between the two cookies is that __utmb is a persistent cookie with an expiration date
that is set 30 minutes after it is created. While __utmc is a temporary cookie that is destroyed as soon as
the visitor quits the browser.
Let’s review what you know about a session, or visit, in Google Analytics. First note that the terms “session”
and “visit” are used interchangeably. A session is defined by 30 minutes of inactivity or if a visitor quits the
browser.

Each time the visitor navigates to a new page and the JavaScript in the Google Analytics Tracking Code is
executed, the __utmb cookie is refreshed and set to expire in 30 minutes.
This is how a session can be 2 hours long. As long as the visitor remains active on the site, the session
remains active.
But if the visitor stays on a page for more than 30 minutes, the __utmb cookie will be destroyed. The next
time the visitor loads a page, Google Analytics won’t find a__utmb cookie. Instead, a new __utmb cookie is
created and, from the standpoint of tracking, this is a new session.
So, why is the __utmc cookie needed? Let’s say a visitor quits and starts the browser and comes back right
away to the same site. Since the __utmc cookie was destroyed, Google Analytics will know that this is a
new session.
So, to summarize, when the visitor loads a page, the JavaScript in the Google Analytics Tracking Code
checks for both the __utmb and __utmc cookies. If either one is missing, it notes this as a new session, and
creates whichever cookie-- __utmb, __utmc, or both-- was missing.
Note that it is possible to adjust this behavior. With a small customization to the Google Analytics Tracking
code, you can make the session timeout length anything you want. You’ll learn about this in the Code
Customizations module.
__utmz – Campaign Cookie The __utmz cookie stores the campaign tracking values that are passed via tagged campaign URLs.
So, for example, if a visitor comes to your site on a link tagged with campaign variables utm_source,
utm_medium, and utm_campaign, the values for these variables will be stored in the __utmz cookie.
Preceding the campaign tracking values, you will see four numbers stored in the __utmz cookie.

• The first number is the domain hash, as with the other Google Analytics cookies.
• The second number is a timestamp.
• The third and fourth numbers are the “session number” and “campaign number”, respectively.
• The “session number” increments for every session during which the campaign cookie gets
overwritten.
• The “campaign number” increments every time you arrive at the site via a different campaign or
organic search, even if it is within the same session.
The __utmz cookie has a six month timeout, meaning that a visit will be attributed to a particular campaign
for up to six months, or until the __utmz cookie is overwritten with another value.
You can modify the six month timeout and you can change the rules which govern when the __utmz cookie
value is overwritten. You’ll learn how in the Code Customizations module.
The __utmz data shown here would show up in your All Traffic Sources report as coming from the source /
medium “google / organic”.
Now, in your browser’s cookie window, select the __utmz cookie from your visit to googlestore.com.
Assuming that it was a direct visit, you’ll see “utmcsr=(direct)” and “utmcmd=(none)”. Your visit will show
up in the Google Store’s Google Analytic’s account as coming from the source / medium “direct / none”.

__utmz – Campaign Values The slide shows how the values in the __utmz cookie map to campaign variables.
For example, the utmcsr value in the __utmz cookie is the source, or the value that was assigned to
utm_source in the tagged link.
Campaign Values: From Tagged URL to Cookie So, if you reached “somesite.com” via a tagged URL that looks like this, then the __utmz cookie would look
like this.
__utmv – Visitor Segmentation The __utmv cookie is for custom visitor segmentation. You’ll only see this cookie if the site calls the
_setVar() method. This cookie contains the domain hash, and one other value: the value you assign using
_setVar().
For example, suppose all site visitors who log in get set to “Member”, while those who do not log in remain
unassigned. The Google Analytics account owner would then be able to compare “Members” to those who
are “(not set)” and see whether, for example, Members convert more often or spend more money on the
site.
The __utmv is a persistent cookie that expires after 2 years.
Try searching your browser cookies for “utmv”. Any sites that appear will be those that use the Google
Analytics custom segmentation feature.
Refer to the module on Custom Visitor Segmentation to learn more about _setVar() and the __utmv cookie.
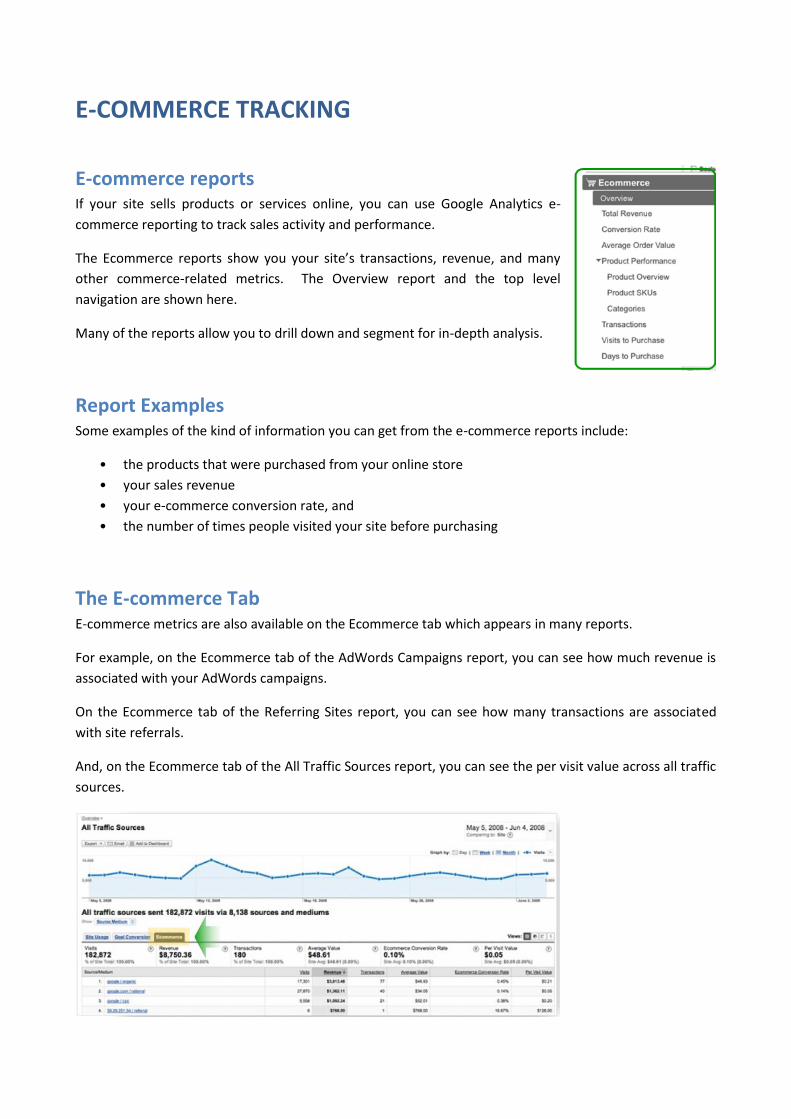
E-COMMERCE TRACKING
E-commerce reports If your site sells products or services online, you can use Google Analytics e-
commerce reporting to track sales activity and performance.
The Ecommerce reports show you your site’s transactions, revenue, and many
other commerce-related metrics. The Overview report and the top level
navigation are shown here.
Many of the reports allow you to drill down and segment for in-depth analysis.
Report Examples Some examples of the kind of information you can get from the e-commerce reports include:
• the products that were purchased from your online store
• your sales revenue
• your e-commerce conversion rate, and
• the number of times people visited your site before purchasing
The E-commerce Tab E-commerce metrics are also available on the Ecommerce tab which appears in many reports.
For example, on the Ecommerce tab of the AdWords Campaigns report, you can see how much revenue is
associated with your AdWords campaigns.
On the Ecommerce tab of the Referring Sites report, you can see how many transactions are associated
with site referrals.
And, on the Ecommerce tab of the All Traffic Sources report, you can see the per visit value across all traffic
sources.
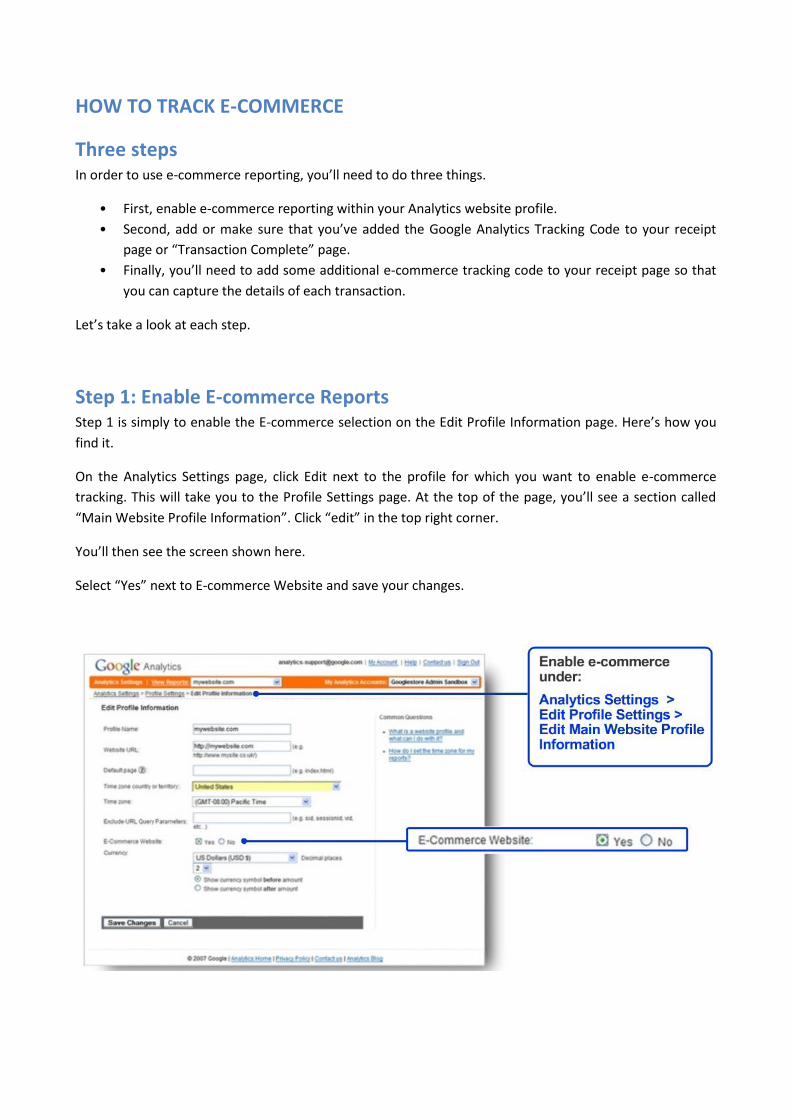
HOW TO TRACK E-COMMERCE
Three steps In order to use e-commerce reporting, you’ll need to do three things.
• First, enable e-commerce reporting within your Analytics website profile.
• Second, add or make sure that you’ve added the Google Analytics Tracking Code to your receipt
page or “Transaction Complete” page.
• Finally, you’ll need to add some additional e-commerce tracking code to your receipt page so that
you can capture the details of each transaction.
Let’s take a look at each step.
Step 1: Enable E-commerce Reports Step 1 is simply to enable the E-commerce selection on the Edit Profile Information page. Here’s how you
find it.
On the Analytics Settings page, click Edit next to the profile for which you want to enable e-commerce
tracking. This will take you to the Profile Settings page. At the top of the page, you’ll see a section called
“Main Website Profile Information”. Click “edit” in the top right corner.
You’ll then see the screen shown here.
Select “Yes” next to E-commerce Website and save your changes.
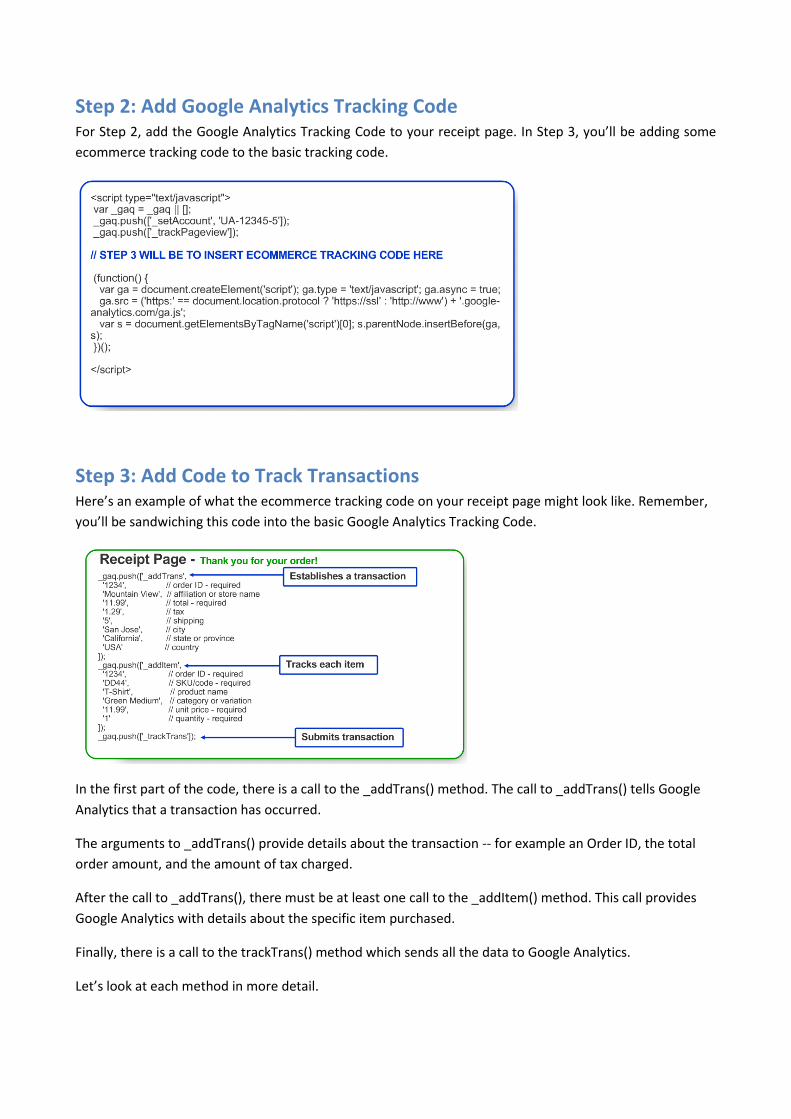
Step 2: Add Google Analytics Tracking Code For Step 2, add the Google Analytics Tracking Code to your receipt page. In Step 3, you’ll be adding some
ecommerce tracking code to the basic tracking code.
Step 3: Add Code to Track Transactions Here’s an example of what the ecommerce tracking code on your receipt page might look like. Remember,
you’ll be sandwiching this code into the basic Google Analytics Tracking Code.
In the first part of the code, there is a call to the _addTrans() method. The call to _addTrans() tells Google
Analytics that a transaction has occurred.
The arguments to _addTrans() provide details about the transaction -- for example an Order ID, the total
order amount, and the amount of tax charged.
After the call to _addTrans(), there must be at least one call to the _addItem() method. This call provides
Google Analytics with details about the specific item purchased.
Finally, there is a call to the trackTrans() method which sends all the data to Google Analytics.
Let’s look at each method in more detail.

Creating the transaction: _addTrans() The _addTrans() method establishes a transaction and takes the arguments shown here.
Your code will need to dynamically retrieve the values from your merchant software to populate these
fields.
You can type single-quote single-quote to leave an optional field blank, but note that Order ID and Total are
required.
Providing Product Details: addItem() For each item that a visitor purchases, call _addItem(). If more than one item is purchased, you’ll call
_addItem() multiple times.
As with _addTrans(), you can leave some of the fields blank, but note that Order ID, SKU or Code, Price and
Quantity are required arguments.
Use the same Order ID that you used in the call to addTrans(). If you’re not sure how to write this code,
contact your merchant software provider.
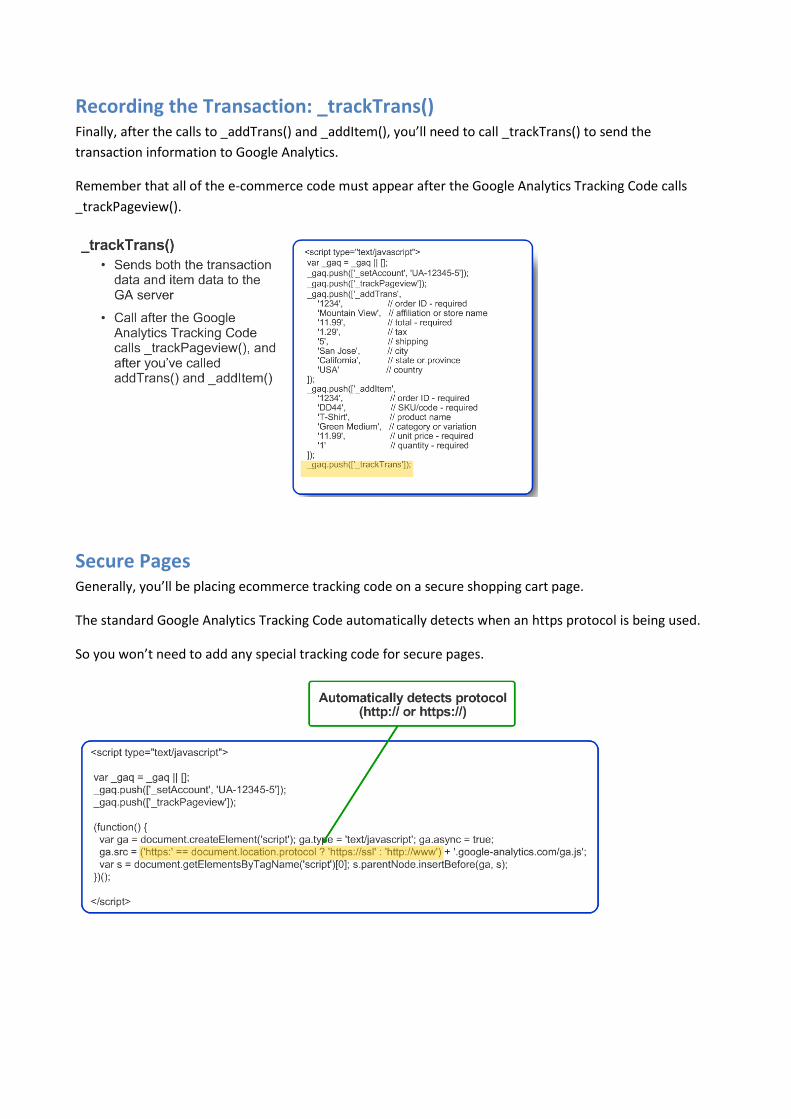
Recording the Transaction: _trackTrans() Finally, after the calls to _addTrans() and _addItem(), you’ll need to call _trackTrans() to send the
transaction information to Google Analytics.
Remember that all of the e-commerce code must appear after the Google Analytics Tracking Code calls
_trackPageview().
Secure Pages Generally, you’ll be placing ecommerce tracking code on a secure shopping cart page.
The standard Google Analytics Tracking Code automatically detects when an https protocol is being used.
So you won’t need to add any special tracking code for secure pages.
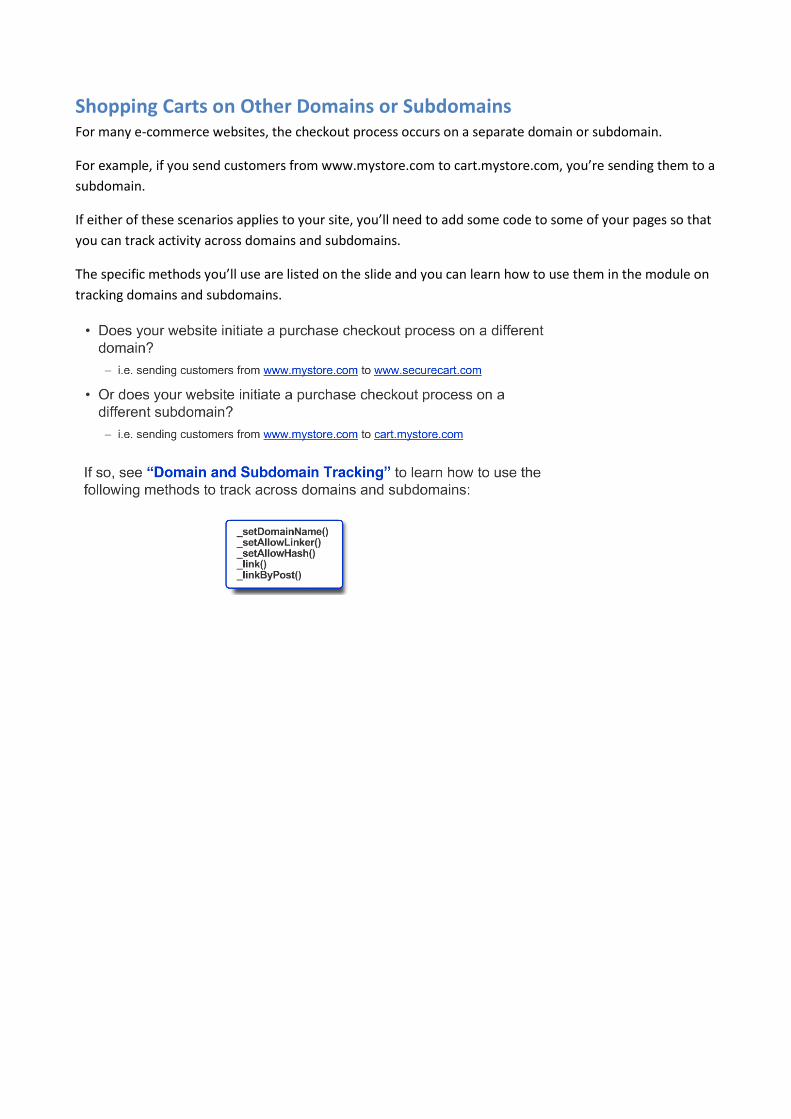
Shopping Carts on Other Domains or Subdomains For many e-commerce websites, the checkout process occurs on a separate domain or subdomain.
For example, if you send customers from www.mystore.com to cart.mystore.com, you’re sending them to a
subdomain.
If either of these scenarios applies to your site, you’ll need to add some code to some of your pages so that
you can track activity across domains and subdomains.
The specific methods you’ll use are listed on the slide and you can learn how to use them in the module on
tracking domains and subdomains.
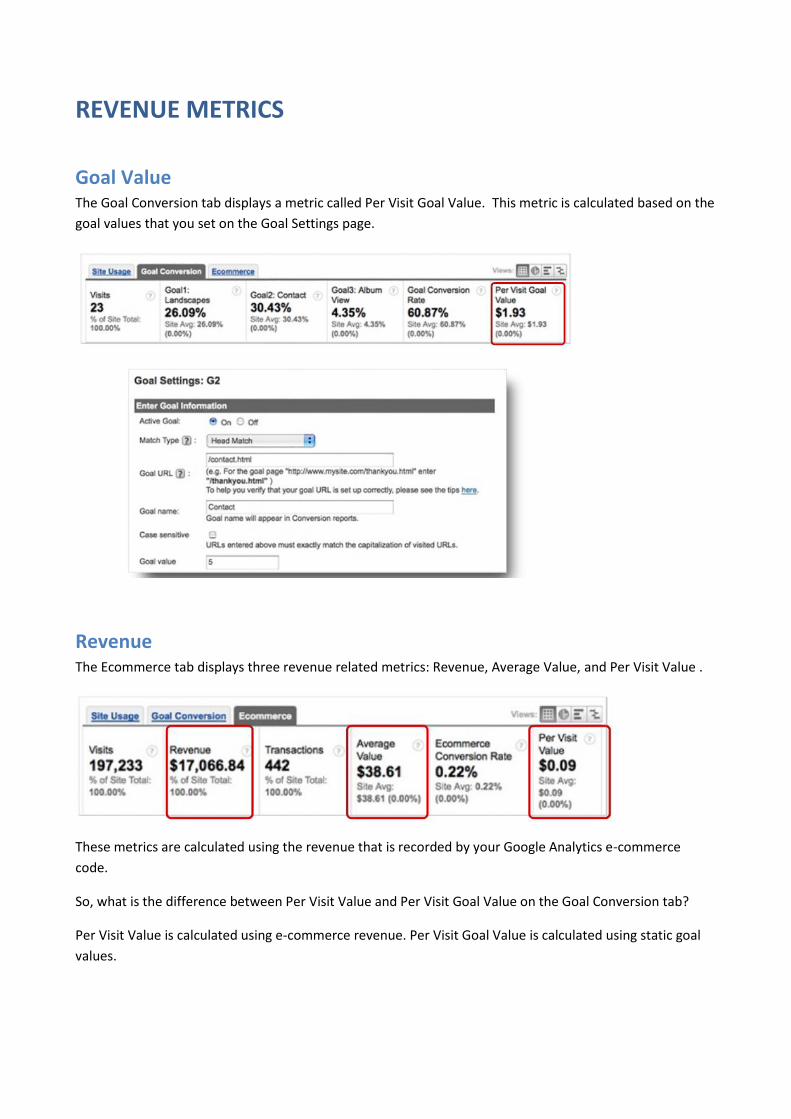
REVENUE METRICS
Goal Value The Goal Conversion tab displays a metric called Per Visit Goal Value. This metric is calculated based on the
goal values that you set on the Goal Settings page.
Revenue The Ecommerce tab displays three revenue related metrics: Revenue, Average Value, and Per Visit Value .
These metrics are calculated using the revenue that is recorded by your Google Analytics e-commerce
code.
So, what is the difference between Per Visit Value and Per Visit Goal Value on the Goal Conversion tab?
Per Visit Value is calculated using e-commerce revenue. Per Visit Goal Value is calculated using static goal
values.

Goal Value + Revenue There are a few places where Goal Value and Ecommerce Revenue are summed.
On the Clicks tab, the Revenue per Click, ROI, and Margin are based on the sum total of Goal Values and
Ecommerce Revenue.
In the Content reports, the $ Index metric is also based on the sum total of Goal Value and Ecommerce
Revenue.
What is $ Index? The $ Index metric appears in most of the Content reports and it allows you to identify the pages that have
the most impact on site profitability.
A single $ Index value by itself doesn’t tell you much -- it’s most useful as a way of ranking pages.
By sorting your pages from highest $ Index value to lowest $ Index value, you’ll be able to identify your
most important pages. Let’s look at how $ Index is calculated.
$ Index Calculation The calculation for $ Index assigns the highest values to pages that are frequently viewed prior to high
value conversions or transactions.
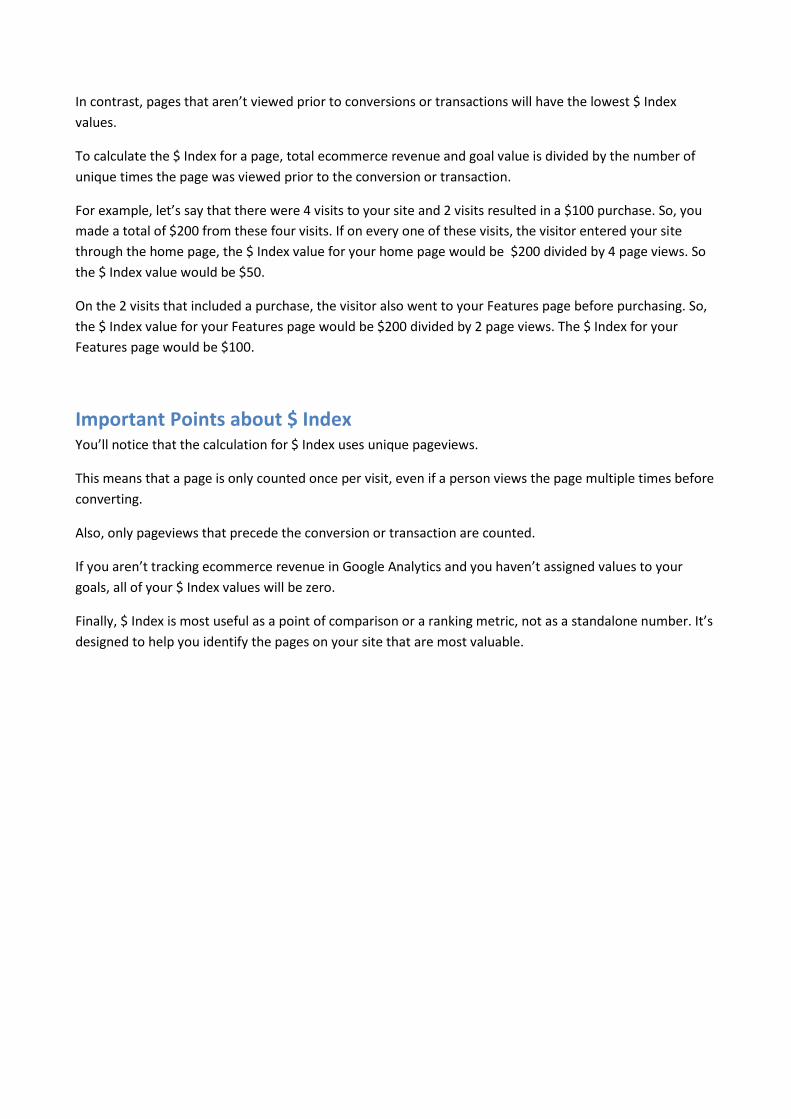
In contrast, pages that aren’t viewed prior to conversions or transactions will have the lowest $ Index
values.
To calculate the $ Index for a page, total ecommerce revenue and goal value is divided by the number of
unique times the page was viewed prior to the conversion or transaction.
For example, let’s say that there were 4 visits to your site and 2 visits resulted in a $100 purchase. So, you
made a total of $200 from these four visits. If on every one of these visits, the visitor entered your site
through the home page, the $ Index value for your home page would be $200 divided by 4 page views. So
the $ Index value would be $50.
On the 2 visits that included a purchase, the visitor also went to your Features page before purchasing. So,
the $ Index value for your Features page would be $200 divided by 2 page views. The $ Index for your
Features page would be $100.
Important Points about $ Index You’ll notice that the calculation for $ Index uses unique pageviews.
This means that a page is only counted once per visit, even if a person views the page multiple times before
converting.
Also, only pageviews that precede the conversion or transaction are counted.
If you aren’t tracking ecommerce revenue in Google Analytics and you haven’t assigned values to your
goals, all of your $ Index values will be zero.
Finally, $ Index is most useful as a point of comparison or a ranking metric, not as a standalone number. It’s
designed to help you identify the pages on your site that are most valuable.
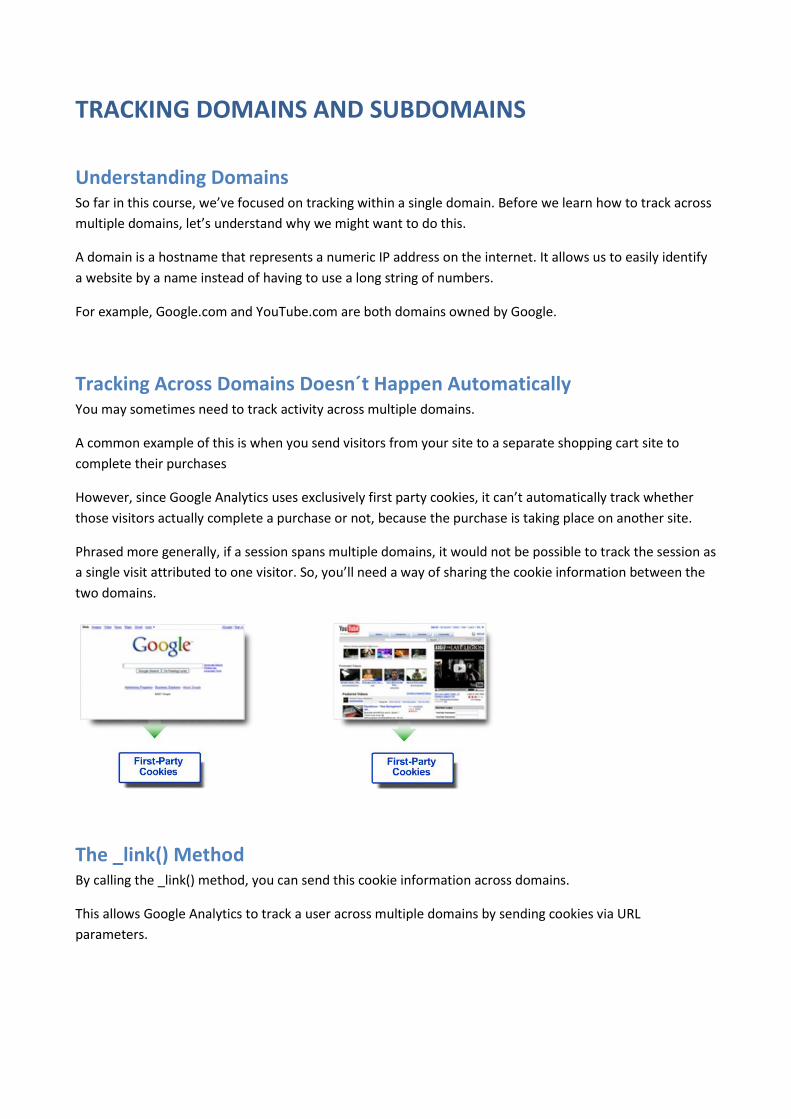
TRACKING DOMAINS AND SUBDOMAINS
Understanding Domains So far in this course, we’ve focused on tracking within a single domain. Before we learn how to track across
multiple domains, let’s understand why we might want to do this.
A domain is a hostname that represents a numeric IP address on the internet. It allows us to easily identify
a website by a name instead of having to use a long string of numbers.
For example, Google.com and YouTube.com are both domains owned by Google.
Tracking Across Domains Doesn´t Happen Automatically You may sometimes need to track activity across multiple domains.
A common example of this is when you send visitors from your site to a separate shopping cart site to
complete their purchases
However, since Google Analytics uses exclusively first party cookies, it can’t automatically track whether
those visitors actually complete a purchase or not, because the purchase is taking place on another site.
Phrased more generally, if a session spans multiple domains, it would not be possible to track the session as
a single visit attributed to one visitor. So, you’ll need a way of sharing the cookie information between the
two domains.
The _link() Method By calling the _link() method, you can send this cookie information across domains.
This allows Google Analytics to track a user across multiple domains by sending cookies via URL
parameters.

Tracking Across Domains (Step 1) To track across domains, you’ll need to follow two steps.
First, add a few lines to the Google Analytics Tracking Code on all pages of each site. The lines you need to
add are shown here, in blue.
Call _setDomainName() with an argument of “none”.
Call _setAllowLinker() with an argument of “true”.
Tracking Across Domains (Step 2) The second step involves the _link() method. Use this method in all links between domains.
In this example, we’re updating all links from Google.com to YouTube.com and vice versa. We update each
link to call the _link() method as shown here.
Now, when a user clicks on a link that takes them to the other domain, the session information is preserved
and the user is identified as being the same visitor across both domains.

Forms and _linkByPost() Method If you use a form to transfer your visitors from one domain to another, you will need to use the
_linkByPost() method instead of the _link() method.
This situation occurs most often with third party shopping carts.
To use forms to transfer from one domain to another, you must modify all the appropriate forms with the
code shown here.
The _linkByPost() method will change the form action by adding query-string parameters to the value in the
action attribute when the visitor submits the form.
Subdomains You may also sometimes need to track across multiple subdomains. A subdomain is part of a larger domain
and frequently each subdomain contains the pages for a specific department or offering.
For example, Google.com has several subdomains such as news.google.com, sites.google.com, and
maps.google.com.
Since Google Analytics uses first-party cookies, cookies set on a subdomain can not automatically be read
on the main domain, and vice versa.
As with multiple domains, you need to explicitly share the cookie information between subdomains or
you’ll lose session information. If you don’t share cookie information between your subdomains, it may
appear as though your own site is a referrer since only one domain is recognized as the main domain.
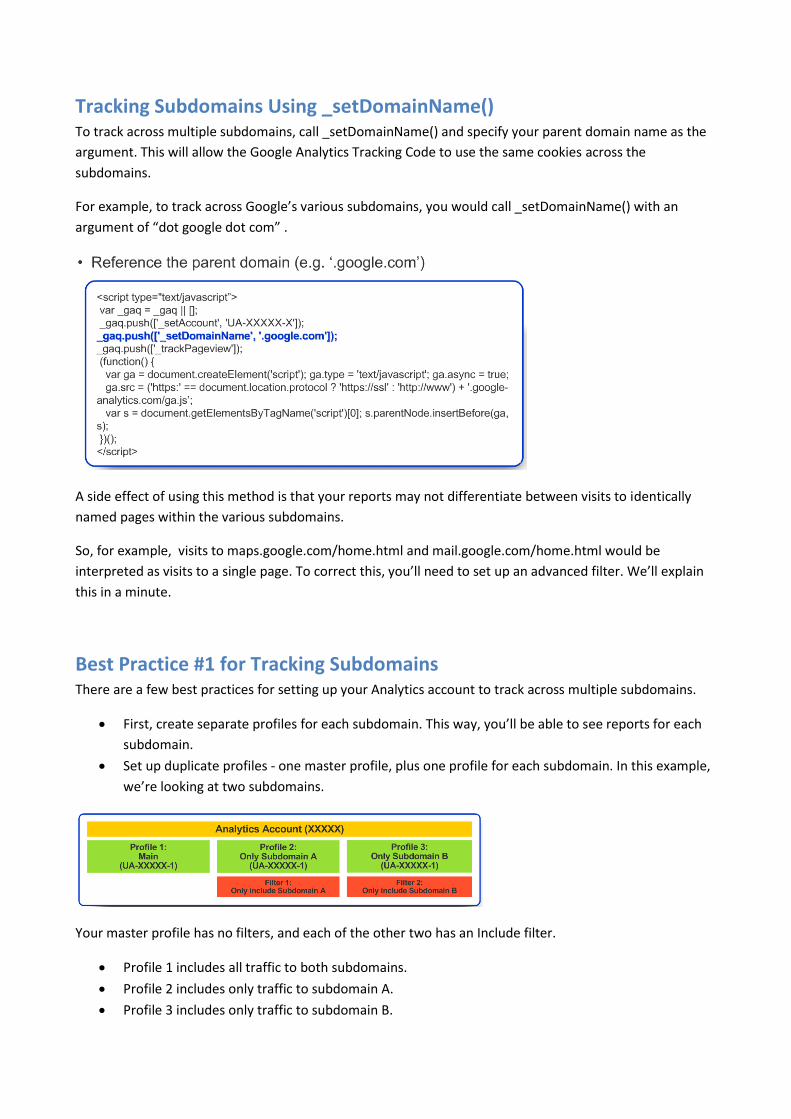
Tracking Subdomains Using _setDomainName() To track across multiple subdomains, call _setDomainName() and specify your parent domain name as the
argument. This will allow the Google Analytics Tracking Code to use the same cookies across the
subdomains.
For example, to track across Google’s various subdomains, you would call _setDomainName() with an
argument of “dot google dot com” .
A side effect of using this method is that your reports may not differentiate between visits to identically
named pages within the various subdomains.
So, for example, visits to maps.google.com/home.html and mail.google.com/home.html would be
interpreted as visits to a single page. To correct this, you’ll need to set up an advanced filter. We’ll explain
this in a minute.
Best Practice #1 for Tracking Subdomains There are a few best practices for setting up your Analytics account to track across multiple subdomains.
First, create separate profiles for each subdomain. This way, you’ll be able to see reports for each
subdomain.
Set up duplicate profiles - one master profile, plus one profile for each subdomain. In this example,
we’re looking at two subdomains.
Your master profile has no filters, and each of the other two has an Include filter.
Profile 1 includes all traffic to both subdomains.
Profile 2 includes only traffic to subdomain A.
Profile 3 includes only traffic to subdomain B.
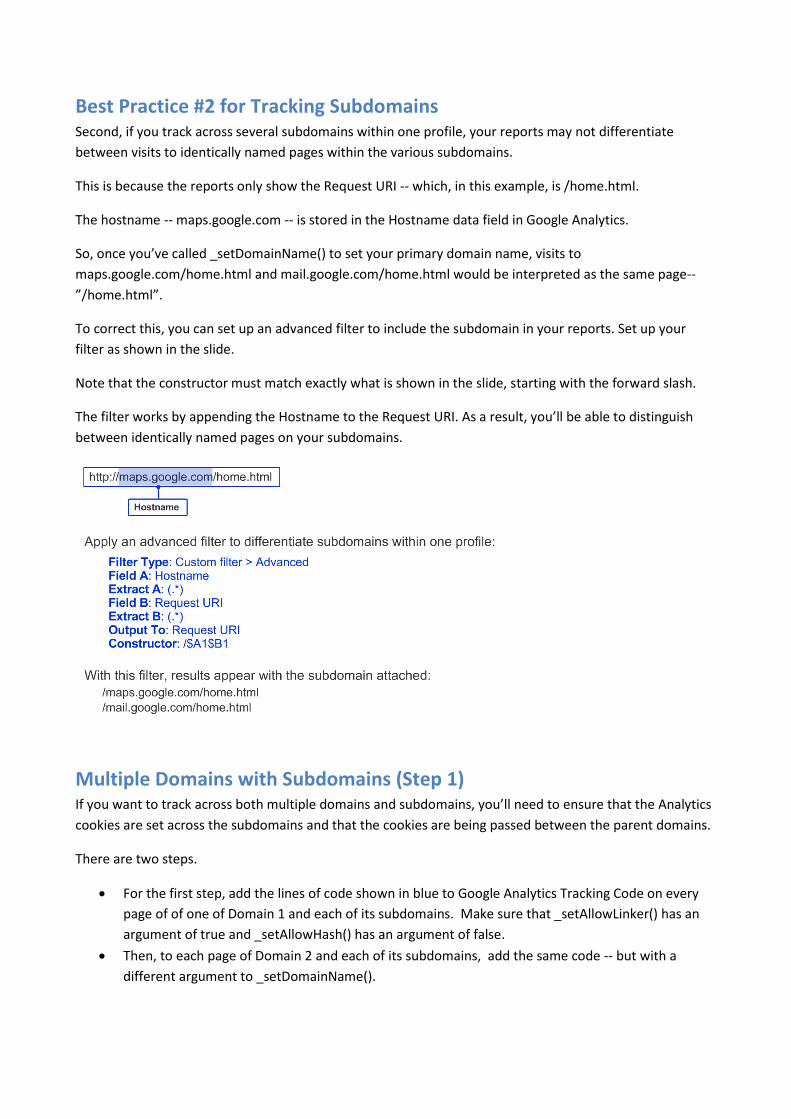
Best Practice #2 for Tracking Subdomains Second, if you track across several subdomains within one profile, your reports may not differentiate
between visits to identically named pages within the various subdomains.
This is because the reports only show the Request URI -- which, in this example, is /home.html.
The hostname -- maps.google.com -- is stored in the Hostname data field in Google Analytics.
So, once you’ve called _setDomainName() to set your primary domain name, visits to
maps.google.com/home.html and mail.google.com/home.html would be interpreted as the same page--
”/home.html”.
To correct this, you can set up an advanced filter to include the subdomain in your reports. Set up your
filter as shown in the slide.
Note that the constructor must match exactly what is shown in the slide, starting with the forward slash.
The filter works by appending the Hostname to the Request URI. As a result, you’ll be able to distinguish
between identically named pages on your subdomains.
Multiple Domains with Subdomains (Step 1) If you want to track across both multiple domains and subdomains, you’ll need to ensure that the Analytics
cookies are set across the subdomains and that the cookies are being passed between the parent domains.
There are two steps.
For the first step, add the lines of code shown in blue to Google Analytics Tracking Code on every
page of of one of Domain 1 and each of its subdomains. Make sure that _setAllowLinker() has an
argument of true and _setAllowHash() has an argument of false.
Then, to each page of Domain 2 and each of its subdomains, add the same code -- but with a
different argument to _setDomainName().
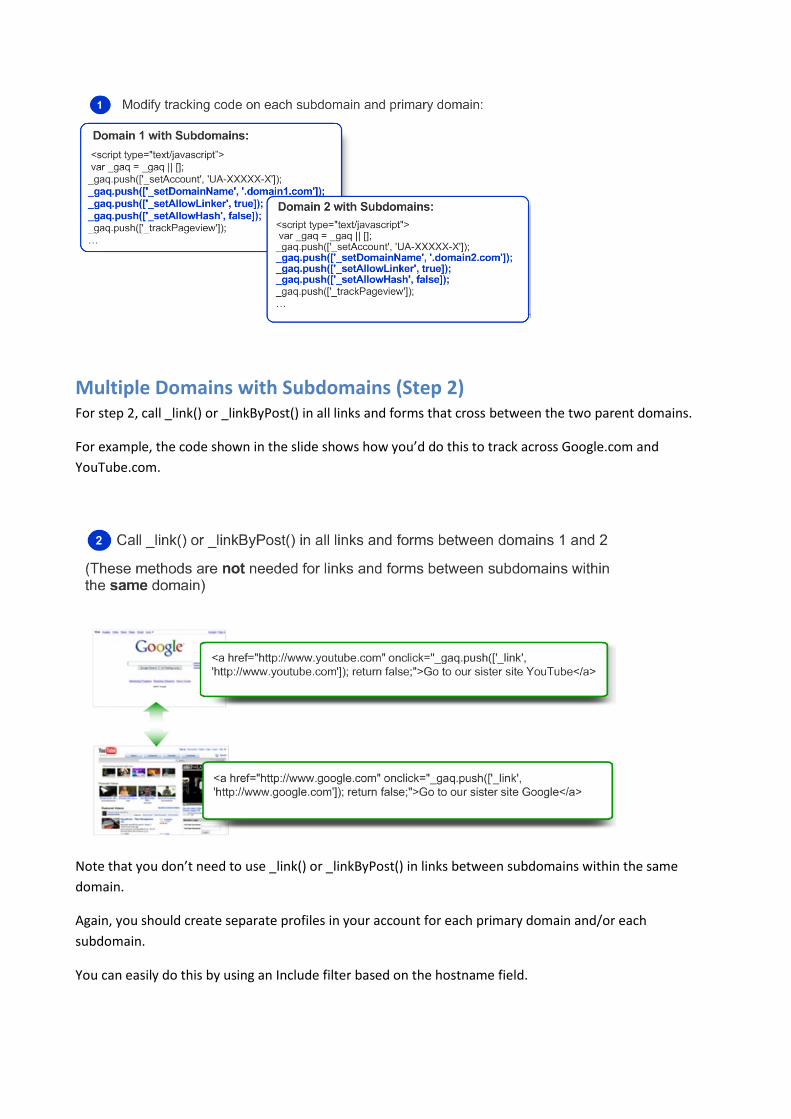
Multiple Domains with Subdomains (Step 2) For step 2, call _link() or _linkByPost() in all links and forms that cross between the two parent domains.
For example, the code shown in the slide shows how you’d do this to track across Google.com and
YouTube.com.
Note that you don’t need to use _link() or _linkByPost() in links between subdomains within the same
domain.
Again, you should create separate profiles in your account for each primary domain and/or each
subdomain.
You can easily do this by using an Include filter based on the hostname field.

CUSTOM REPORTING
Designing a Custom Report You can create reports that show exactly the information you want to see, organized in the way you want
to see it.
When creating a custom report, think of a table.
Dimensions are the rows of the table and metrics are the columns in the table. This report has two
dimensions -- in green -- and four metrics in blue.
So, the report will show pageviews, bounces, visits, and revenue for each source and keyword.
Creating a Custom Report Click on the Custom Reporting menu to get started.
If you have no reports defined, your Custom Reporting Overview will look like this.
You’ll see a help article link and links to sample reports.
Click ‘Create new custom report’ to build a new report.
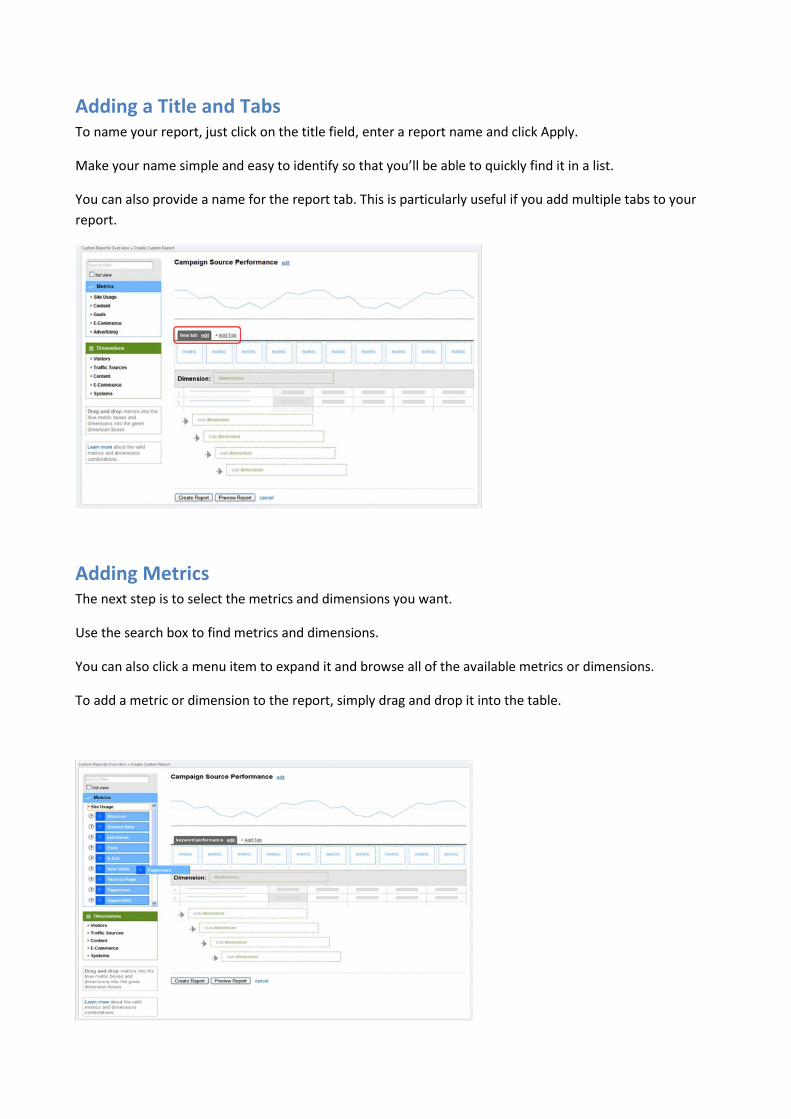
Adding a Title and Tabs To name your report, just click on the title field, enter a report name and click Apply.
Make your name simple and easy to identify so that you’ll be able to quickly find it in a list.
You can also provide a name for the report tab. This is particularly useful if you add multiple tabs to your
report.
Adding Metrics The next step is to select the metrics and dimensions you want.
Use the search box to find metrics and dimensions.
You can also click a menu item to expand it and browse all of the available metrics or dimensions.
To add a metric or dimension to the report, simply drag and drop it into the table.
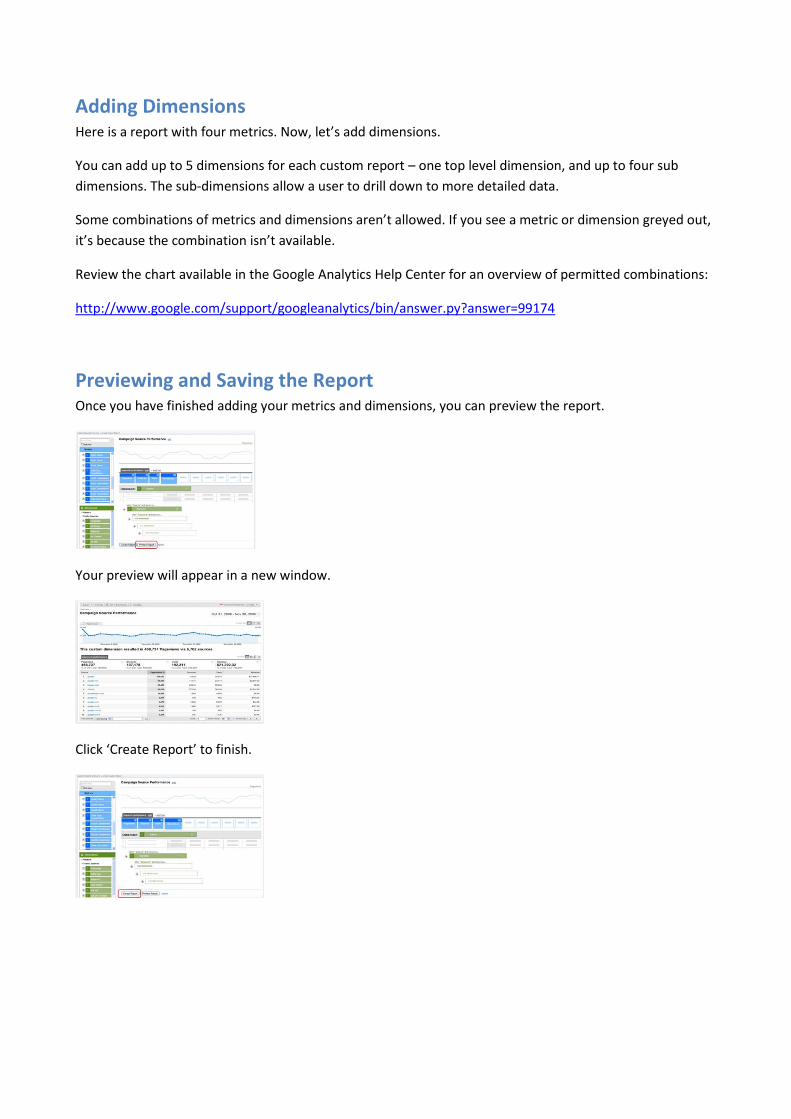
Adding Dimensions Here is a report with four metrics. Now, let’s add dimensions.
You can add up to 5 dimensions for each custom report – one top level dimension, and up to four sub
dimensions. The sub-dimensions allow a user to drill down to more detailed data.
Some combinations of metrics and dimensions aren’t allowed. If you see a metric or dimension greyed out,
it’s because the combination isn’t available.
Review the chart available in the Google Analytics Help Center for an overview of permitted combinations:
http://www.google.com/support/googleanalytics/bin/answer.py?answer=99174
Previewing and Saving the Report Once you have finished adding your metrics and dimensions, you can preview the report.
Your preview will appear in a new window.
Click ‘Create Report’ to finish.

Viewing and Accessing the Report You’ll see the new report listed under the Custom Reporting menu. Now that the report has been saved,
you can access it anytime.
In this custom report, we can click any of the Sources to see the keywords for that source. Lets click
‘google’.
Now we can compare search keyword performance for the Google search engine.
Deleting a Report Click on the Custom Reporting menu link to access the Custom Reporting Overview page shown in the slide.
Here you can see a list of saved custom reports and you can edit or delete any of them.
Click Edit to modify the report.

Editing a Report By editing a report, you can add, remove or modify metrics and dimensions, add tabs, and change the name
of the report.
Creating a new tab allows you to drag a different set of metrics onto the report. To experiment with this,
click Add Tab.
Here we've created a new tab called Visitors.
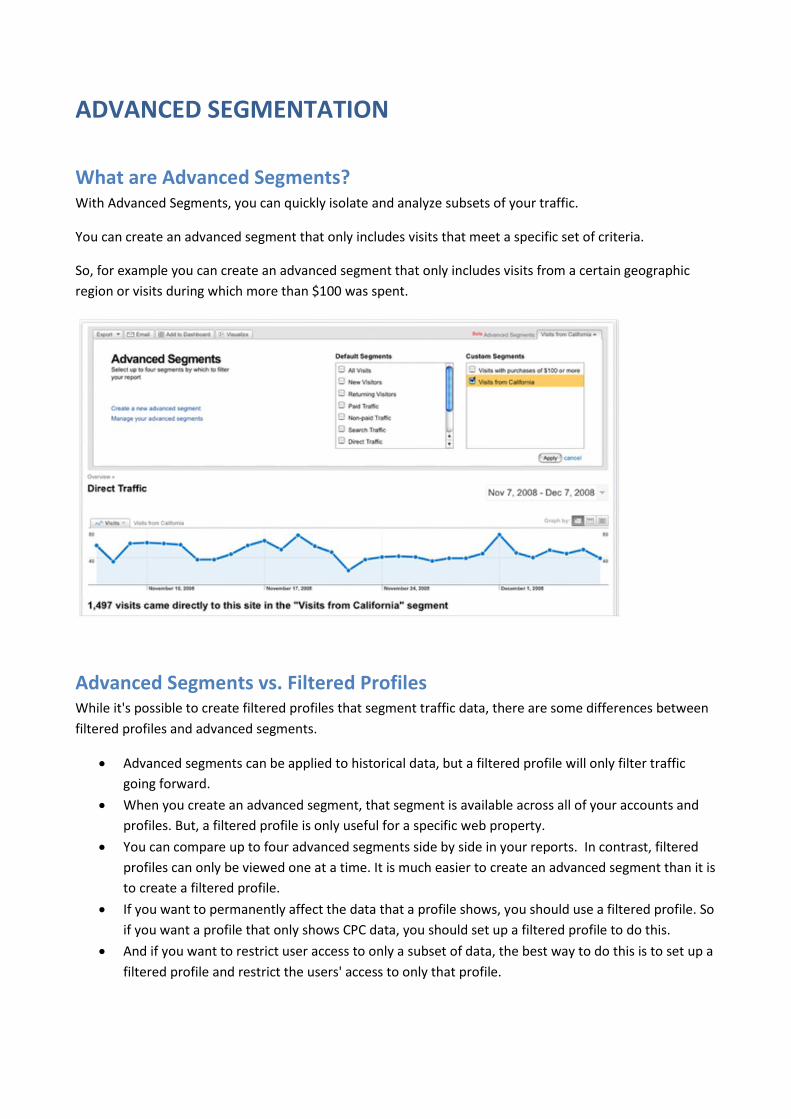
ADVANCED SEGMENTATION
What are Advanced Segments? With Advanced Segments, you can quickly isolate and analyze subsets of your traffic.
You can create an advanced segment that only includes visits that meet a specific set of criteria.
So, for example you can create an advanced segment that only includes visits from a certain geographic
region or visits during which more than $100 was spent.
Advanced Segments vs. Filtered Profiles While it's possible to create filtered profiles that segment traffic data, there are some differences between
filtered profiles and advanced segments.
Advanced segments can be applied to historical data, but a filtered profile will only filter traffic
going forward.
When you create an advanced segment, that segment is available across all of your accounts and
profiles. But, a filtered profile is only useful for a specific web property.
You can compare up to four advanced segments side by side in your reports. In contrast, filtered
profiles can only be viewed one at a time. It is much easier to create an advanced segment than it is
to create a filtered profile.
If you want to permanently affect the data that a profile shows, you should use a filtered profile. So
if you want a profile that only shows CPC data, you should set up a filtered profile to do this.
And if you want to restrict user access to only a subset of data, the best way to do this is to set up a
filtered profile and restrict the users' access to only that profile.

Applying and Advanced Segment To apply an advanced segment, simply Click Advanced Segments and select the segments you want.
The Default Segments are predefined, so you don’t have to do anything to use them except to select them.
The All Visits segment under Default Segments is enabled by default.
Once you’ve applied one or more advanced segments, you can see the data for the segments throughout
all of your reports.
You can also change your date range and see the segments applied to historical data.
The segments remain applied until you deselect them or you logoff or view reports on another account or
profile.
Creating an Advanced Segment Let’s create an advanced segment that only includes visits during which more than $100 was spent. Begin
by clicking the Advanced Segments pulldown. Next, click Create a new advanced segment.

Now you’ll see a screen that looks like this. Using this screen, you ca combine one or more logical
statements to define a segment.
To include only visits during more than $100 was spent, first look for the metric Revenue.
It’s usually easiest to type what you are looking for into the search box, but you can also browse the
complete list of metrics and dimensions. Now, drag the metric into the work area. Select the condition
Greater than and specify 100.
By clicking Test Segment, you can see that 25 visits meet the condition.
You can add additional logic, but for now, let’s just name and save the segment.
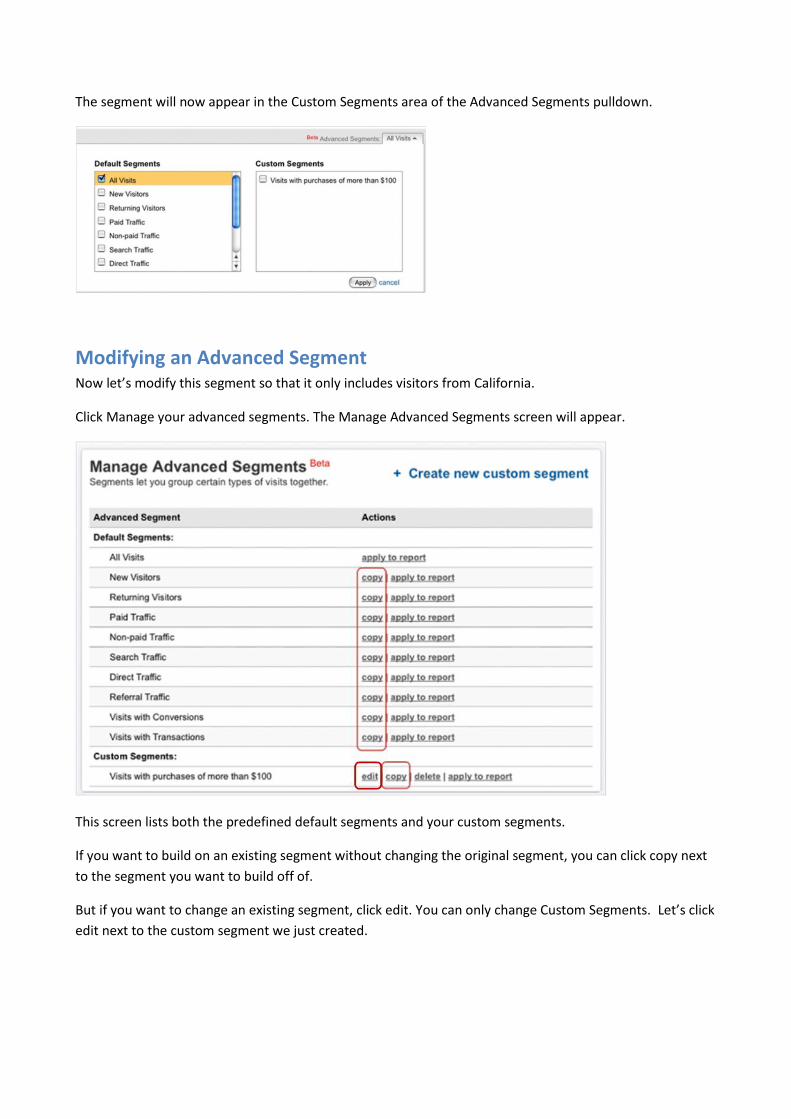
The segment will now appear in the Custom Segments area of the Advanced Segments pulldown.
Modifying an Advanced Segment Now let’s modify this segment so that it only includes visitors from California.
Click Manage your advanced segments. The Manage Advanced Segments screen will appear.
This screen lists both the predefined default segments and your custom segments.
If you want to build on an existing segment without changing the original segment, you can click copy next
to the segment you want to build off of.
But if you want to change an existing segment, click edit. You can only change Custom Segments. Let’s click
edit next to the custom segment we just created.
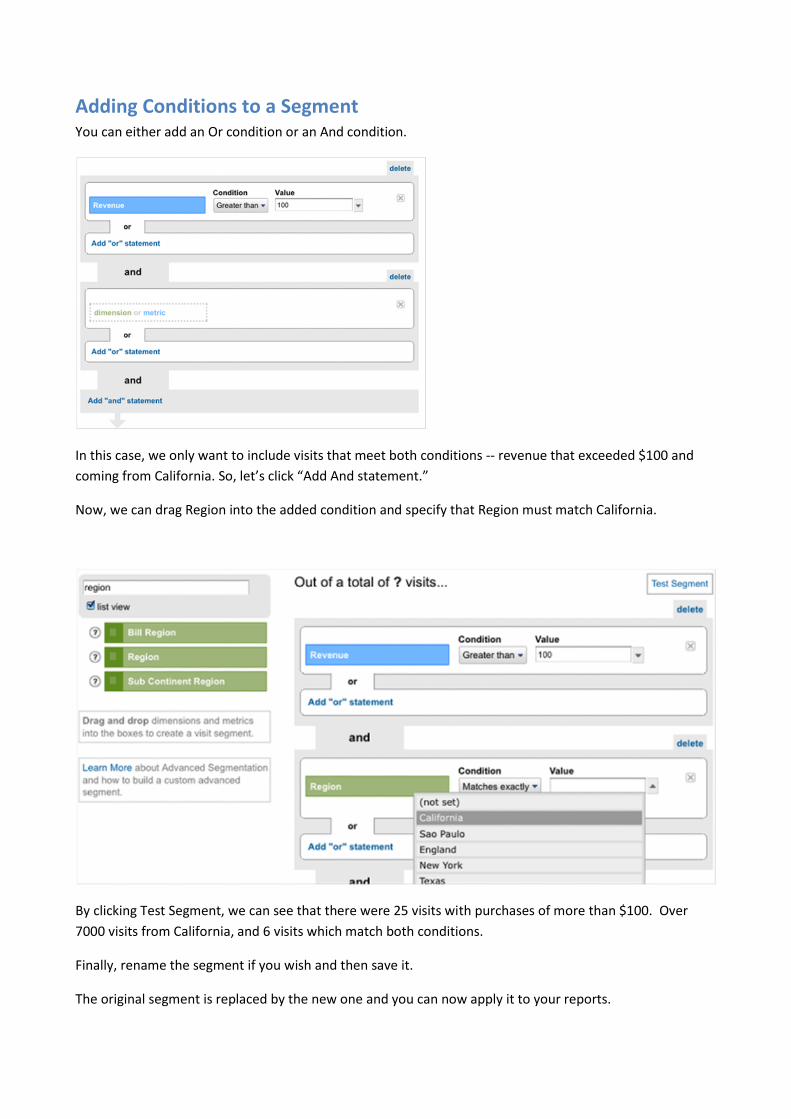
Adding Conditions to a Segment You can either add an Or condition or an And condition.
In this case, we only want to include visits that meet both conditions -- revenue that exceeded $100 and
coming from California. So, let’s click “Add And statement.”
Now, we can drag Region into the added condition and specify that Region must match California.
By clicking Test Segment, we can see that there were 25 visits with purchases of more than $100. Over
7000 visits from California, and 6 visits which match both conditions.
Finally, rename the segment if you wish and then save it.
The original segment is replaced by the new one and you can now apply it to your reports.
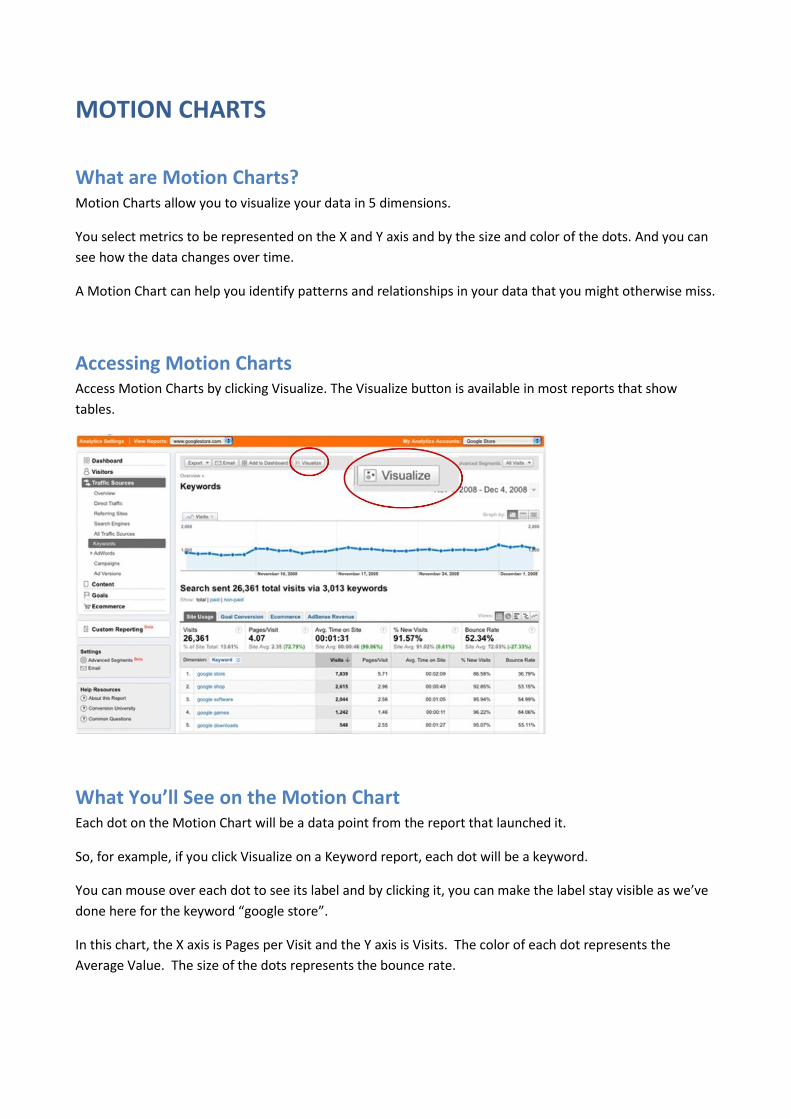
MOTION CHARTS
What are Motion Charts? Motion Charts allow you to visualize your data in 5 dimensions.
You select metrics to be represented on the X and Y axis and by the size and color of the dots. And you can
see how the data changes over time.
A Motion Chart can help you identify patterns and relationships in your data that you might otherwise miss.
Accessing Motion Charts Access Motion Charts by clicking Visualize. The Visualize button is available in most reports that show
tables.
What You’ll See on the Motion Chart Each dot on the Motion Chart will be a data point from the report that launched it.
So, for example, if you click Visualize on a Keyword report, each dot will be a keyword.
You can mouse over each dot to see its label and by clicking it, you can make the label stay visible as we’ve
done here for the keyword “google store”.
In this chart, the X axis is Pages per Visit and the Y axis is Visits. The color of each dot represents the
Average Value. The size of the dots represents the bounce rate.
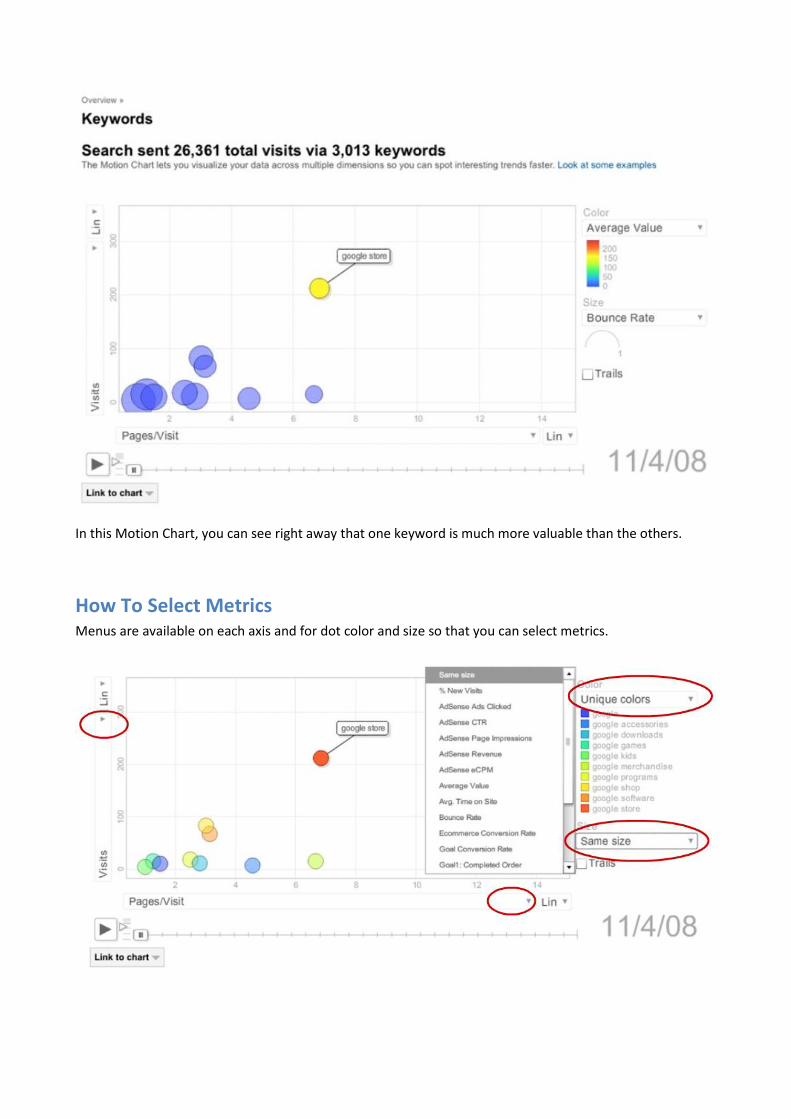
In this Motion Chart, you can see right away that one keyword is much more valuable than the others.
How To Select Metrics Menus are available on each axis and for dot color and size so that you can select metrics.
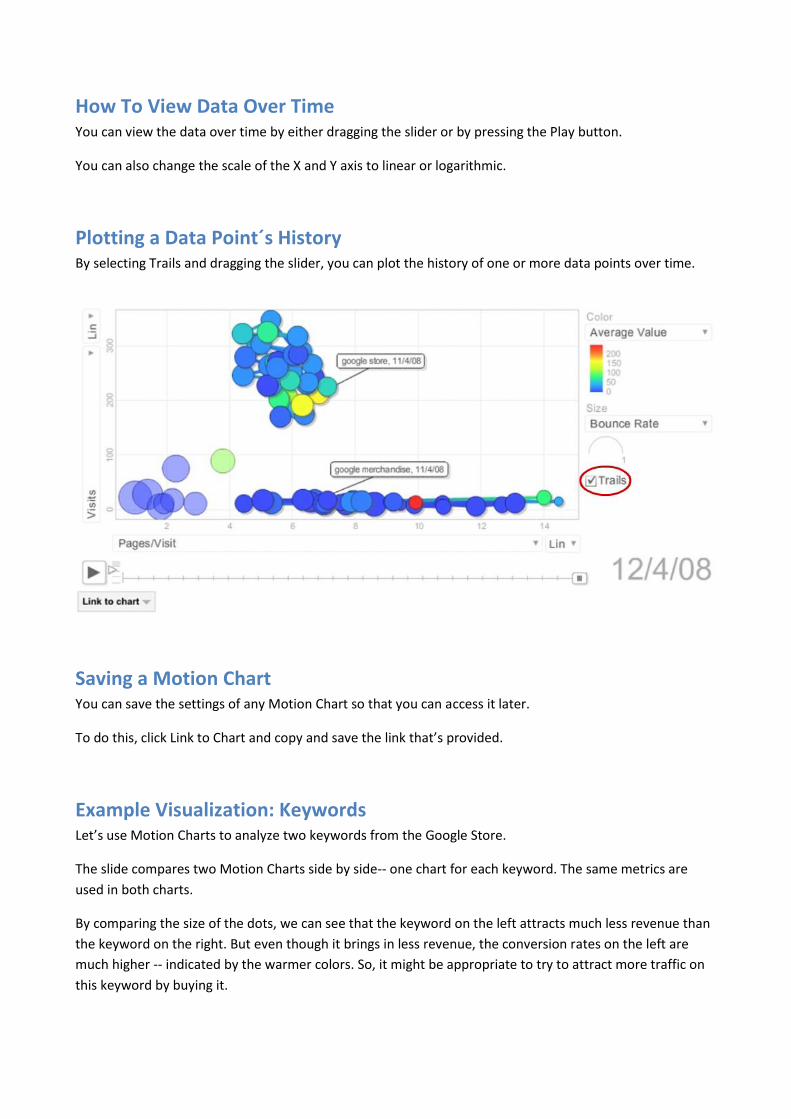
How To View Data Over Time You can view the data over time by either dragging the slider or by pressing the Play button.
You can also change the scale of the X and Y axis to linear or logarithmic.
Plotting a Data Point´s History By selecting Trails and dragging the slider, you can plot the history of one or more data points over time.
Saving a Motion Chart You can save the settings of any Motion Chart so that you can access it later.
To do this, click Link to Chart and copy and save the link that’s provided.
Example Visualization: Keywords Let’s use Motion Charts to analyze two keywords from the Google Store.
The slide compares two Motion Charts side by side-- one chart for each keyword. The same metrics are
used in both charts.
By comparing the size of the dots, we can see that the keyword on the left attracts much less revenue than
the keyword on the right. But even though it brings in less revenue, the conversion rates on the left are
much higher -- indicated by the warmer colors. So, it might be appropriate to try to attract more traffic on
this keyword by buying it.
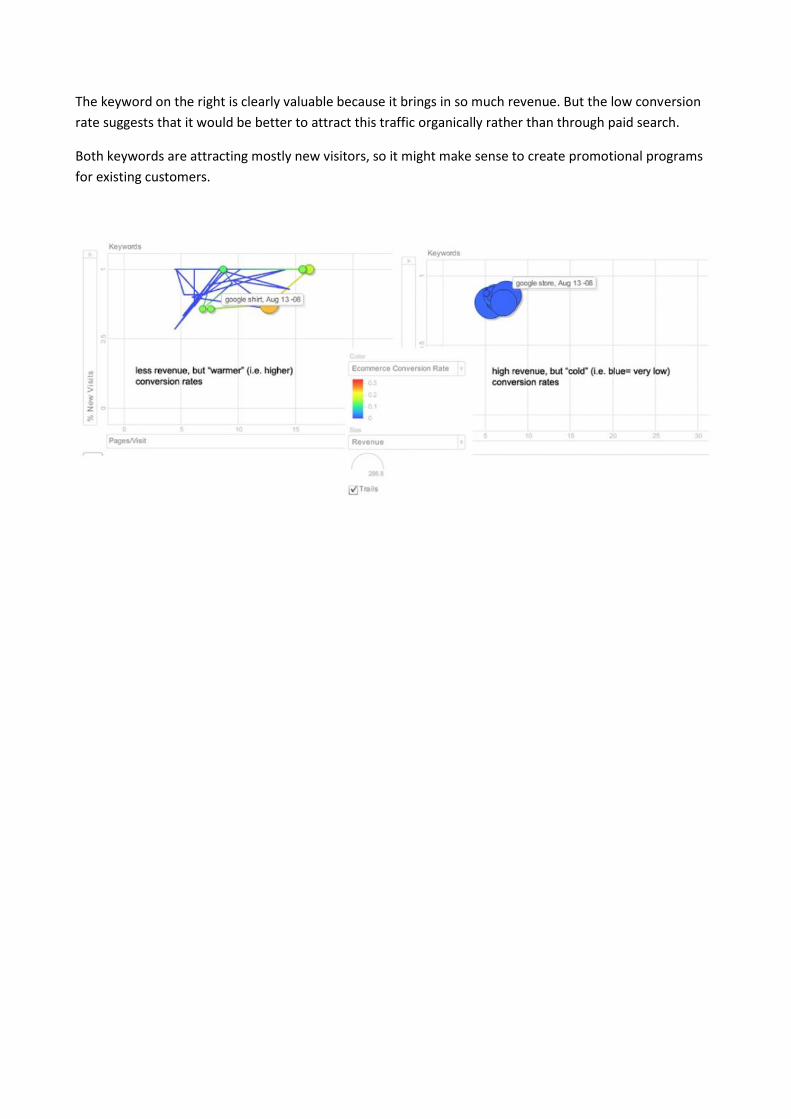
The keyword on the right is clearly valuable because it brings in so much revenue. But the low conversion
rate suggests that it would be better to attract this traffic organically rather than through paid search.
Both keywords are attracting mostly new visitors, so it might make sense to create promotional programs
for existing customers.

INTERNAL SITE SEARCH
Internal Site Search Reporting Google Analytics provides internal site search reports that allow you to see how people search once they’ve
arrived at your site.
Why is Internal Site Search Important? So why analyze how people search your site?
On both large and small sites, visitors frequently use search boxes as a form of navigation.
By looking at what people search for, you can identify missing or hidden content on your site, improve
search results for key phrases, and even get ideas for new keywords to use in marketing campaigns.
Setting Up Site Search In order to set up Site Search Tracking for your website, you’ll need to configure your Profile settings.
On the Analytics Settings page, click 'Edit' next to the profile for which you want to enable Site Search
Tracking. Once the Profile Settings page appears, look for the Main Website Profile Information section and
click Edit.
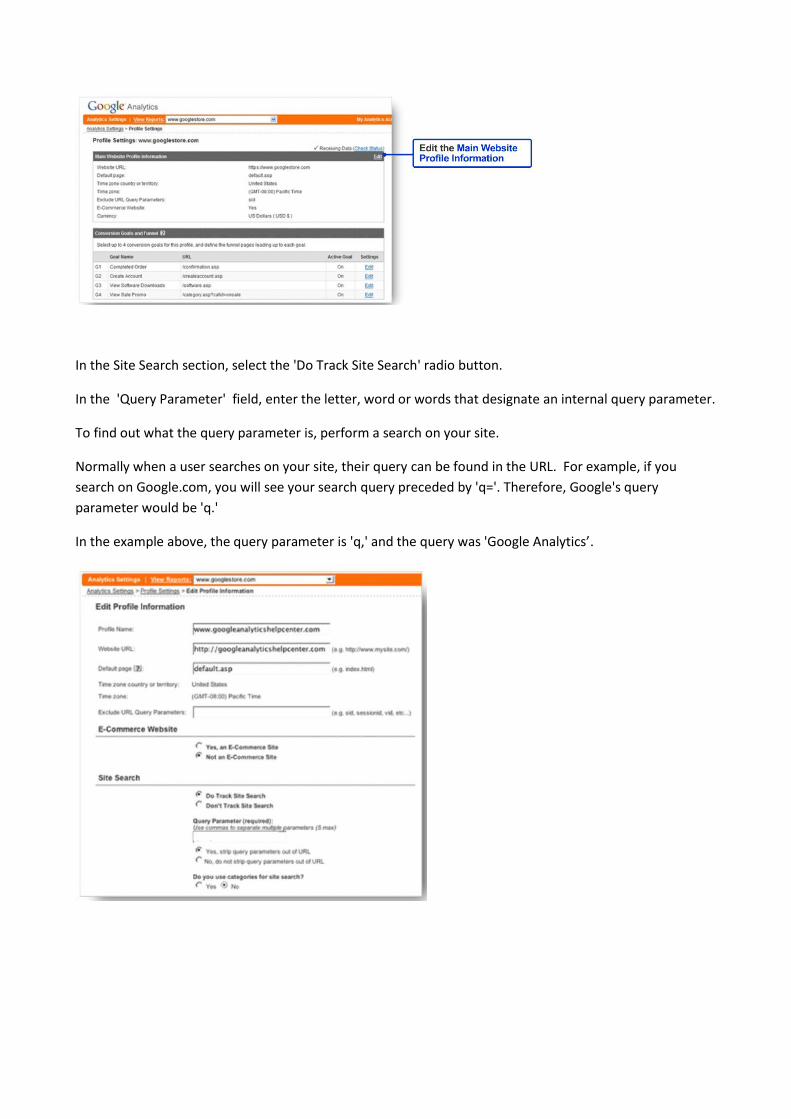
In the Site Search section, select the 'Do Track Site Search' radio button.
In the 'Query Parameter' field, enter the letter, word or words that designate an internal query parameter.
To find out what the query parameter is, perform a search on your site.
Normally when a user searches on your site, their query can be found in the URL. For example, if you
search on Google.com, you will see your search query preceded by 'q='. Therefore, Google's query
parameter would be 'q.'
In the example above, the query parameter is 'q,' and the query was 'Google Analytics’.

Identifying Your Query Parameter(s) What is the query parameter in this example?
Look at the URL that’s generated by your search. You should be able to find your query and the query
parameter in the URL.
In this case, the search query was “creating a profile” and you can see that the query parameter is “query”.
Your parameter might be different -- it could be the word "term” or “search”,
Or it might be just a letter, like "s" or ”p".
Setting Up Site Search If you have a particularly large site, some sections of your site may use different query parameters.
You may provide up to five parameters, separating each parameter by a comma.
Next, select whether or not you want Google Analytics to strip out the query parameter from your URL.
Stripping out the query parameter has the same effect as excluding URL Query Parameters in your Main
Website Profile Settings
If, in your Site Search settings, you choose to strip the query parameters, you don't have to also exclude
them from your main settings.
Note that Google Analytics will only strip out the query parameters you listed, and not any other
parameters in the same URL.

Site Search Categories If you use 'Categories‘ on your site - such as the ability to use drop-down menus to narrow a search - you
can include categories in your search analytics by following these steps:
First, select the 'Yes' radio button under 'Do you use categories for site search?'
Then, enter your 'Category Parameter' in the field provided. Enter only the letters that designate an
internal query category such as 'cat, qc,'.
The same principle that you used to identify the query parameter can be used to identify the category
parameter. You can also contact your webmaster to identify the query and category parameters for your
site.
Decide if you want to strip out the category parameters that you just provided. If you select Yes, only the
parameters you provided will be stripped out. As with the query parameter setting, this has the same effect
as excluding URL Query Parameters in your Main Website Profile Settings so if you choose to strip the
category parameters here, you don't have to exclude them again from your main settings.
Click 'Save Changes' to finish.
Where to Find Site Search in Your Reports The Site Search reports are located in the Content section of Google Analytics. Click on the Site Search
navigation button to see all of the reports.
By analyzing your Site Search reports, you can find out:
• Which products or items visitors are looking for
• Where visitors started their search and where they ended up after searching
• Whether searches resulted in conversions

Site Search Overview The Site Search Overview summarizes the search activity on your site.
You can get to more detailed reports by clicking on the embedded links in the Site Search Overview, or by
using the left navigation.
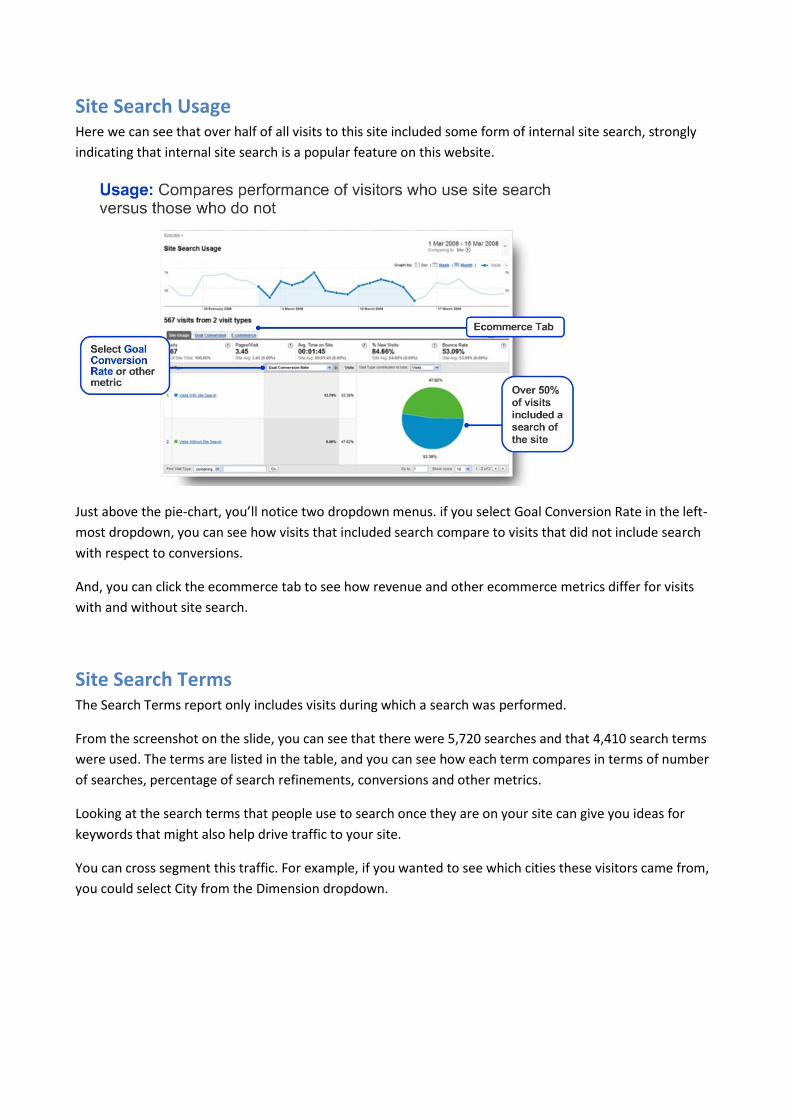
Site Search Usage Here we can see that over half of all visits to this site included some form of internal site search, strongly
indicating that internal site search is a popular feature on this website.
Just above the pie-chart, you’ll notice two dropdown menus. if you select Goal Conversion Rate in the left-
most dropdown, you can see how visits that included search compare to visits that did not include search
with respect to conversions.
And, you can click the ecommerce tab to see how revenue and other ecommerce metrics differ for visits
with and without site search.
Site Search Terms The Search Terms report only includes visits during which a search was performed.
From the screenshot on the slide, you can see that there were 5,720 searches and that 4,410 search terms
were used. The terms are listed in the table, and you can see how each term compares in terms of number
of searches, percentage of search refinements, conversions and other metrics.
Looking at the search terms that people use to search once they are on your site can give you ideas for
keywords that might also help drive traffic to your site.
You can cross segment this traffic. For example, if you wanted to see which cities these visitors came from,
you could select City from the Dimension dropdown.
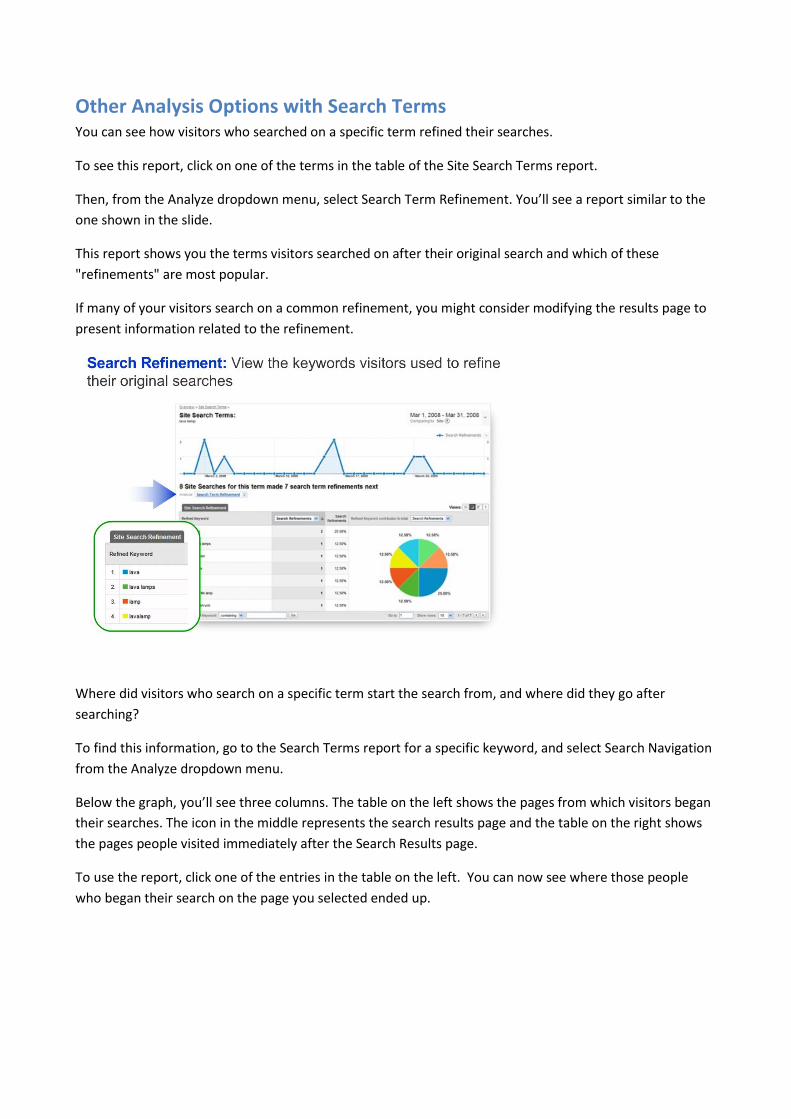
Other Analysis Options with Search Terms You can see how visitors who searched on a specific term refined their searches.
To see this report, click on one of the terms in the table of the Site Search Terms report.
Then, from the Analyze dropdown menu, select Search Term Refinement. You’ll see a report similar to the
one shown in the slide.
This report shows you the terms visitors searched on after their original search and which of these
"refinements" are most popular.
If many of your visitors search on a common refinement, you might consider modifying the results page to
present information related to the refinement.
Where did visitors who search on a specific term start the search from, and where did they go after
searching?
To find this information, go to the Search Terms report for a specific keyword, and select Search Navigation
from the Analyze dropdown menu.
Below the graph, you’ll see three columns. The table on the left shows the pages from which visitors began
their searches. The icon in the middle represents the search results page and the table on the right shows
the pages people visited immediately after the Search Results page.
To use the report, click one of the entries in the table on the left. You can now see where those people
who began their search on the page you selected ended up.

Site Search Start Pages You can use the Start Pages report to find out how many searches were initiated on each page of your site.
The easiest way to find this report is to click on Start Pages under Site Search in the left navigation.
The Start Pages report lists all of the pages from which visitors searched.
Click on a page in the table to learn more about the searches that occurred from that page. A detail report
will appear which lists all of the search terms that were used from that page.
You can use this report to find out what visitors are searching for from your landing pages and you can use
the information to improve the page content.
For example, if many visitors search on "shipping options" from your shopping cart page, you may want to
display shipping information directly on the page.
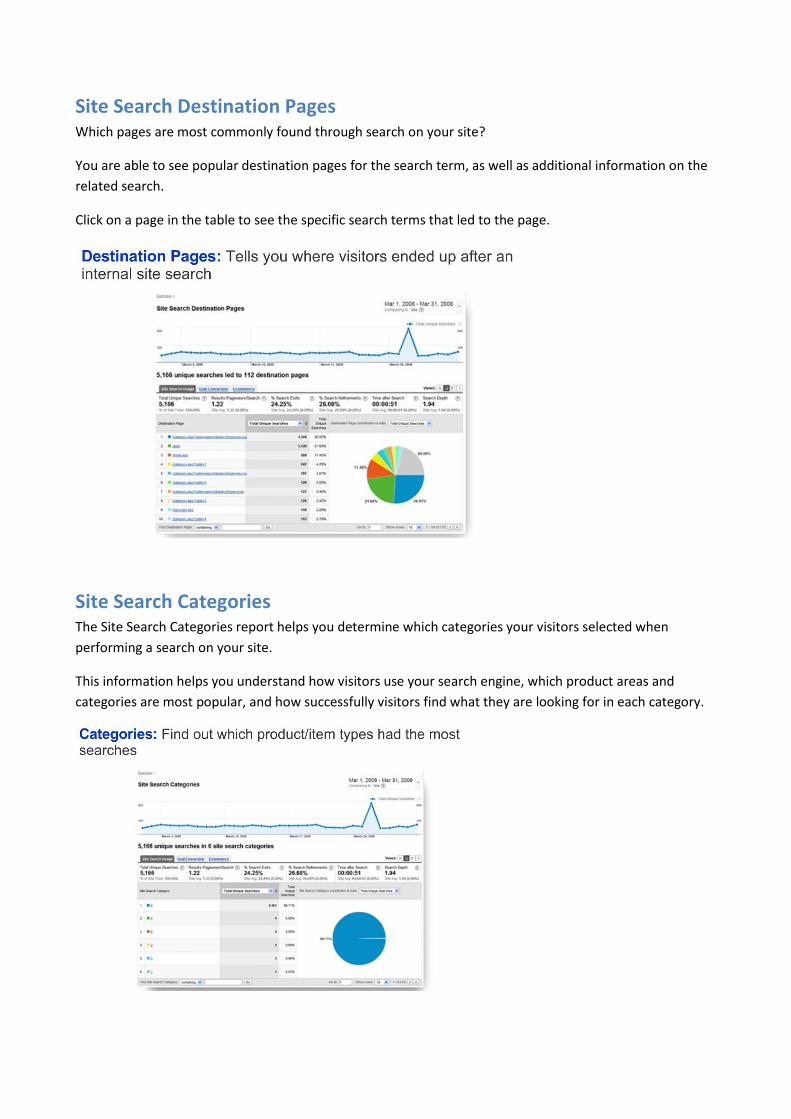
Site Search Destination Pages Which pages are most commonly found through search on your site?
You are able to see popular destination pages for the search term, as well as additional information on the
related search.
Click on a page in the table to see the specific search terms that led to the page.
Site Search Categories The Site Search Categories report helps you determine which categories your visitors selected when
performing a search on your site.
This information helps you understand how visitors use your search engine, which product areas and
categories are most popular, and how successfully visitors find what they are looking for in each category.
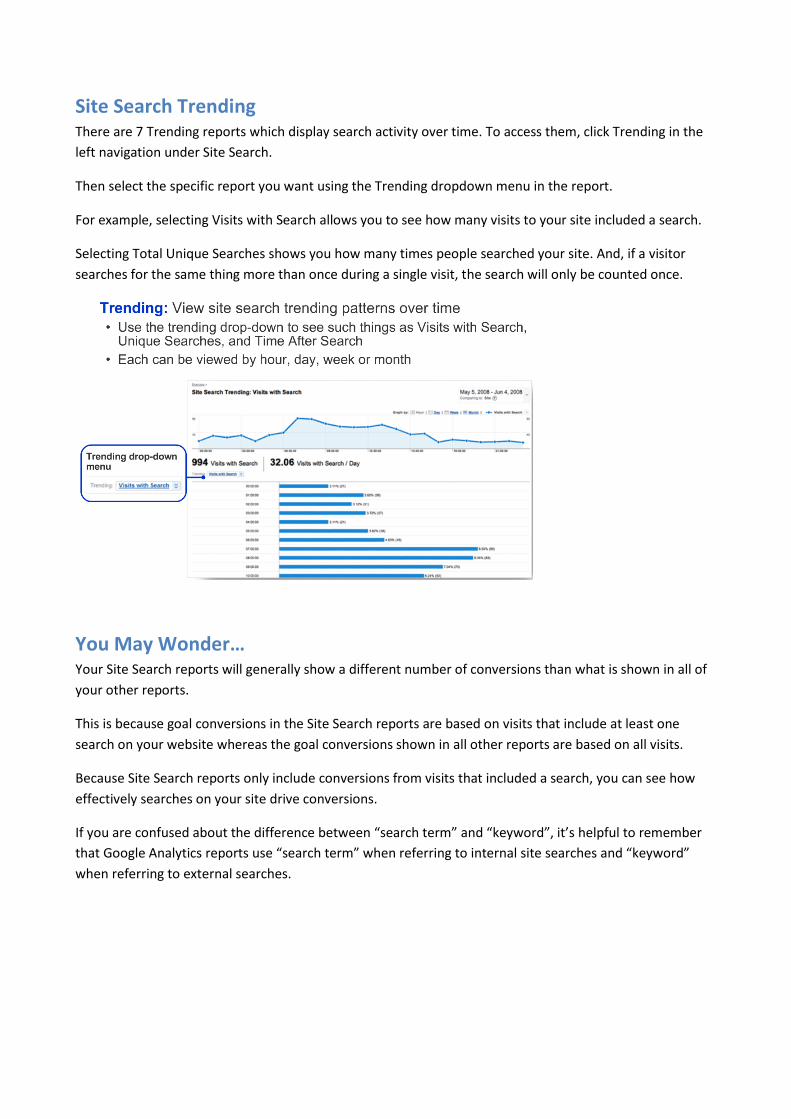
Site Search Trending There are 7 Trending reports which display search activity over time. To access them, click Trending in the
left navigation under Site Search.
Then select the specific report you want using the Trending dropdown menu in the report.
For example, selecting Visits with Search allows you to see how many visits to your site included a search.
Selecting Total Unique Searches shows you how many times people searched your site. And, if a visitor
searches for the same thing more than once during a single visit, the search will only be counted once.
You May Wonder… Your Site Search reports will generally show a different number of conversions than what is shown in all of
your other reports.
This is because goal conversions in the Site Search reports are based on visits that include at least one
search on your website whereas the goal conversions shown in all other reports are based on all visits.
Because Site Search reports only include conversions from visits that included a search, you can see how
effectively searches on your site drive conversions.
If you are confused about the difference between “search term” and “keyword”, it’s helpful to remember
that Google Analytics reports use “search term” when referring to internal site searches and “keyword”
when referring to external searches.

TRACKING SITE INTERACTIONS
Web Analytics and Interactive Activities Many websites use technologies such as Flash and Ajax to interact with visitors.
For example, some websites embed video players, games, and other interactive experiences on site pages.
However, the basic web analytics model of tracking pageviews doesn’t capture these kinds of interactions.
This is because when a visitor interacts with a video player, for example, no pageview is generated.
Some other examples of interactions that don’t generate pageviews are Ajax-based activities, file
downloads, and clicks on links that take the visitor to another site.
So how do you track these kinds of activities? There are two ways: virtual pageviews and Event Tracking.
Virtual Pageviews You can create a virtual pageview to represent practically any kind of activity or interaction you want. You
simply call _trackPageview() and provide any name you want as the argument.
It’s “virtual” because you’re telling Google Analytics to register a pageview even though no new page has
actually been loaded.
You’ll see these virtual pageviews alongside ordinary pageviews in the Top Content and Content Drilldown
reports.

Example Code If you look at the Google Analytics Tracking Code, you’ll notice that it calls _trackPageview().
This lets Google Analytics know that the browser has loaded a page.
When you call _trackPageview(), however, you’ll want to provide an argument that specifies a virtual
pagename for the event you’re tracking.
Use of Virtual Pageviews Here are some more examples.
In each of these cases, we’re simply calling _trackPageview() to register a virtual pageview.
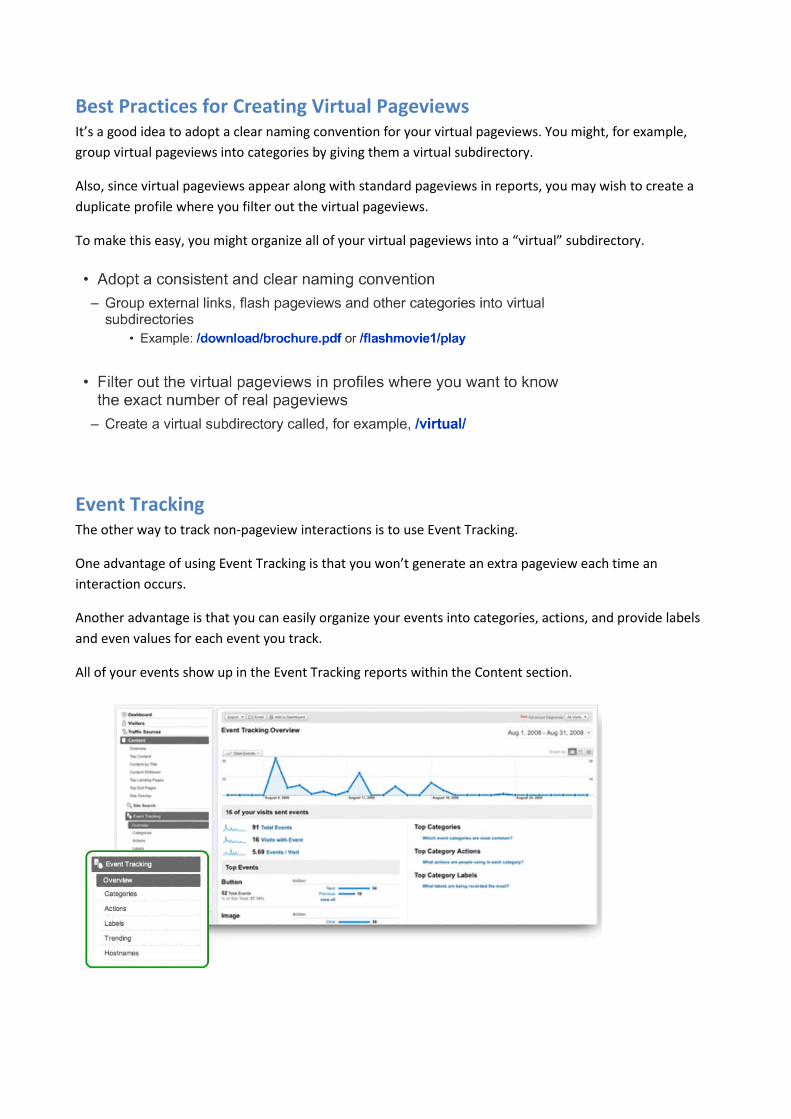
Best Practices for Creating Virtual Pageviews It’s a good idea to adopt a clear naming convention for your virtual pageviews. You might, for example,
group virtual pageviews into categories by giving them a virtual subdirectory.
Also, since virtual pageviews appear along with standard pageviews in reports, you may wish to create a
duplicate profile where you filter out the virtual pageviews.
To make this easy, you might organize all of your virtual pageviews into a “virtual” subdirectory.
Event Tracking The other way to track non-pageview interactions is to use Event Tracking.
One advantage of using Event Tracking is that you won’t generate an extra pageview each time an
interaction occurs.
Another advantage is that you can easily organize your events into categories, actions, and provide labels
and even values for each event you track.
All of your events show up in the Event Tracking reports within the Content section.
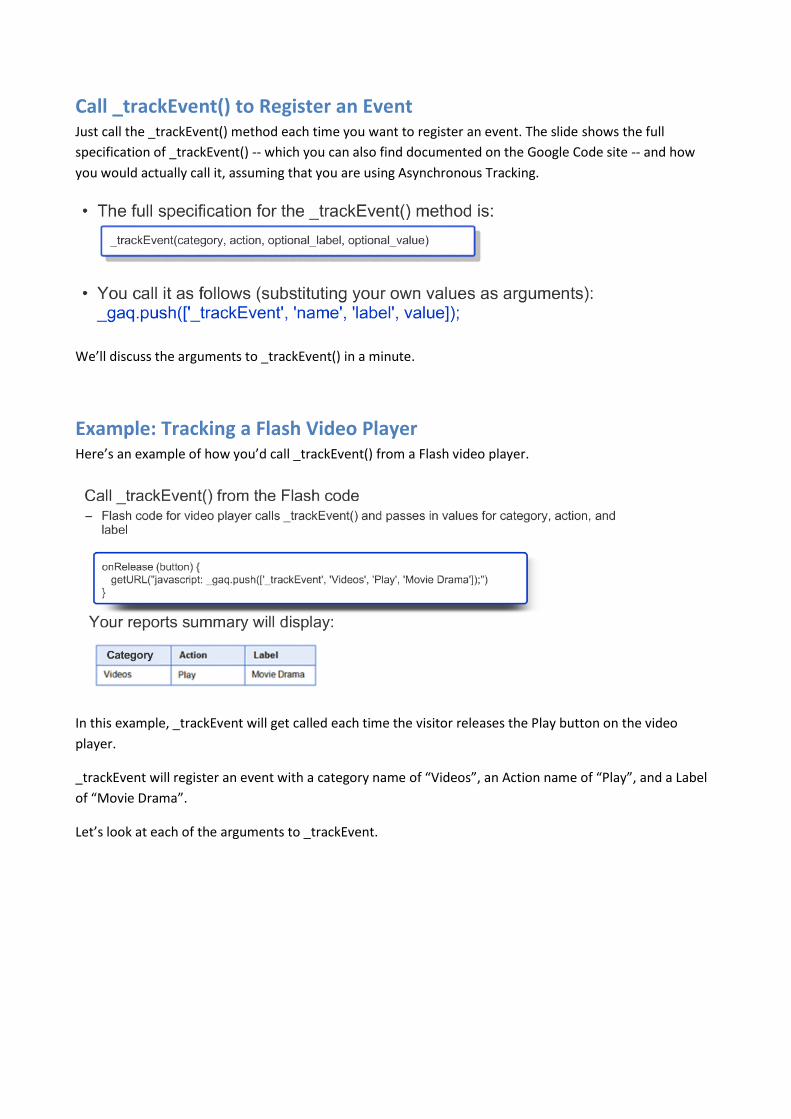
Call _trackEvent() to Register an Event Just call the _trackEvent() method each time you want to register an event. The slide shows the full
specification of _trackEvent() -- which you can also find documented on the Google Code site -- and how
you would actually call it, assuming that you are using Asynchronous Tracking.
We’ll discuss the arguments to _trackEvent() in a minute.
Example: Tracking a Flash Video Player Here’s an example of how you’d call _trackEvent() from a Flash video player.
In this example, _trackEvent will get called each time the visitor releases the Play button on the video
player.
_trackEvent will register an event with a category name of “Videos”, an Action name of “Play”, and a Label
of “Movie Drama”.
Let’s look at each of the arguments to _trackEvent.
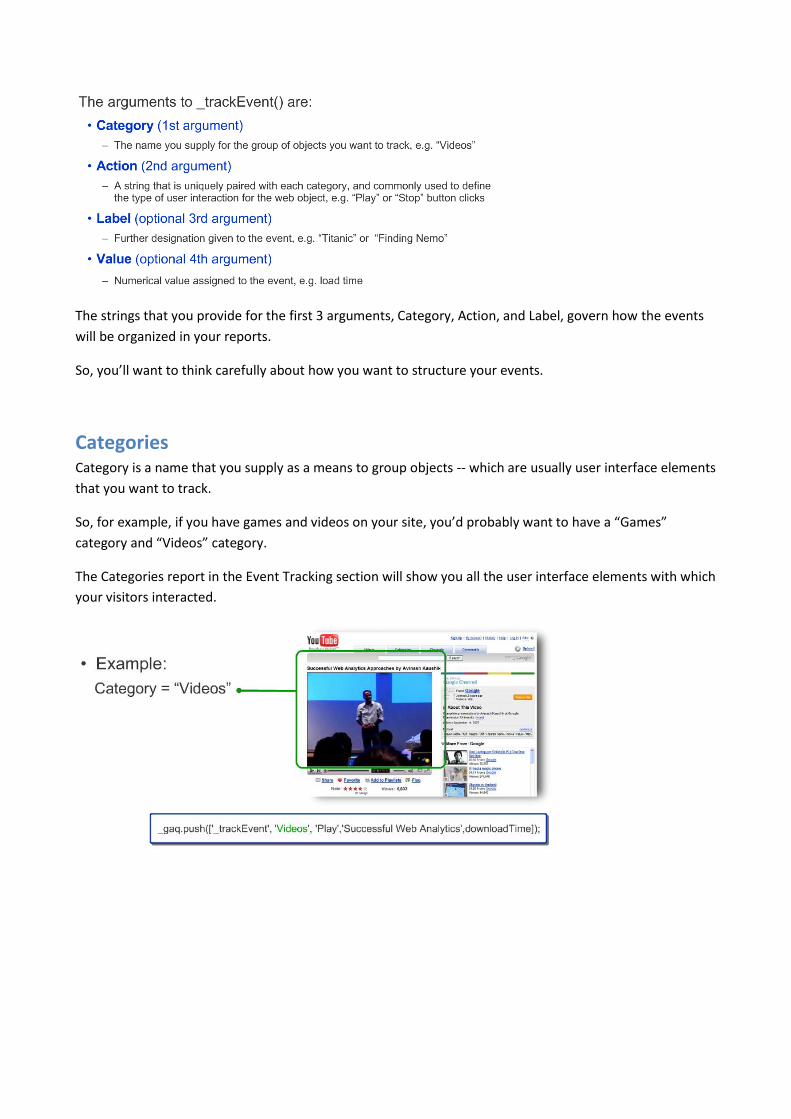
The strings that you provide for the first 3 arguments, Category, Action, and Label, govern how the events
will be organized in your reports.
So, you’ll want to think carefully about how you want to structure your events.
Categories Category is a name that you supply as a means to group objects -- which are usually user interface elements
that you want to track.
So, for example, if you have games and videos on your site, you’d probably want to have a “Games”
category and “Videos” category.
The Categories report in the Event Tracking section will show you all the user interface elements with which
your visitors interacted.
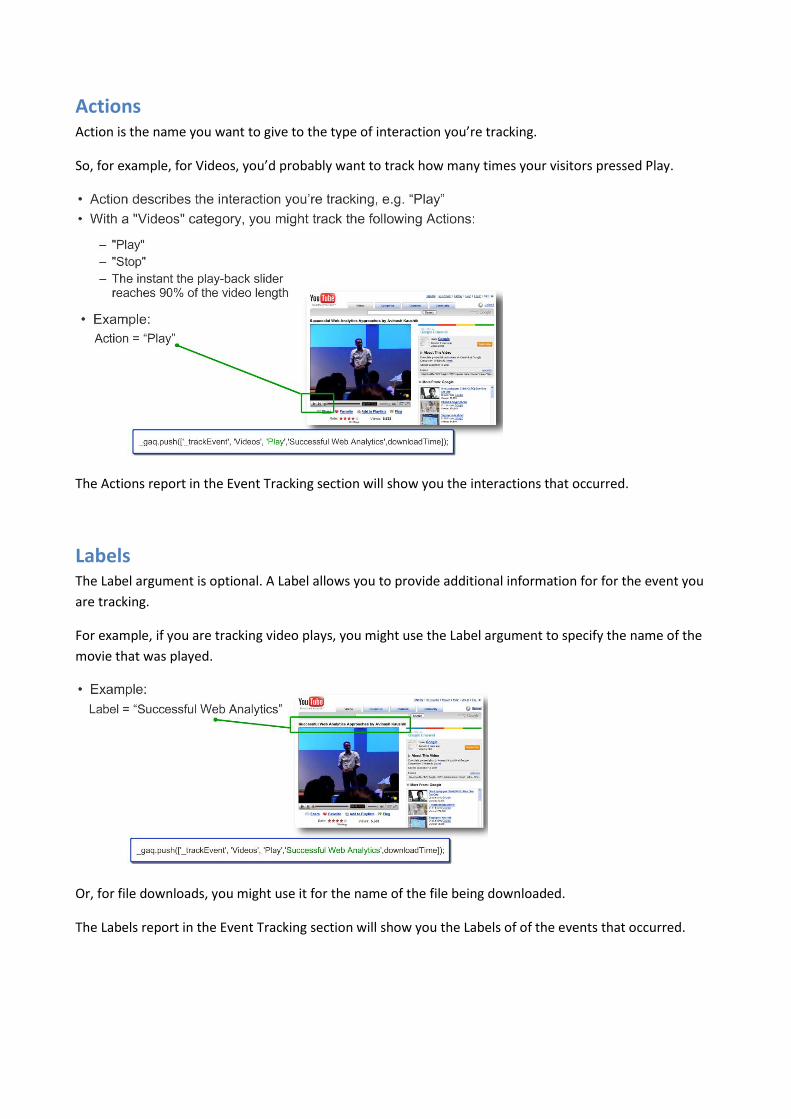
Actions Action is the name you want to give to the type of interaction you’re tracking.
So, for example, for Videos, you’d probably want to track how many times your visitors pressed Play.
The Actions report in the Event Tracking section will show you the interactions that occurred.
Labels The Label argument is optional. A Label allows you to provide additional information for for the event you
are tracking.
For example, if you are tracking video plays, you might use the Label argument to specify the name of the
movie that was played.
Or, for file downloads, you might use it for the name of the file being downloaded.
The Labels report in the Event Tracking section will show you the Labels of of the events that occurred.
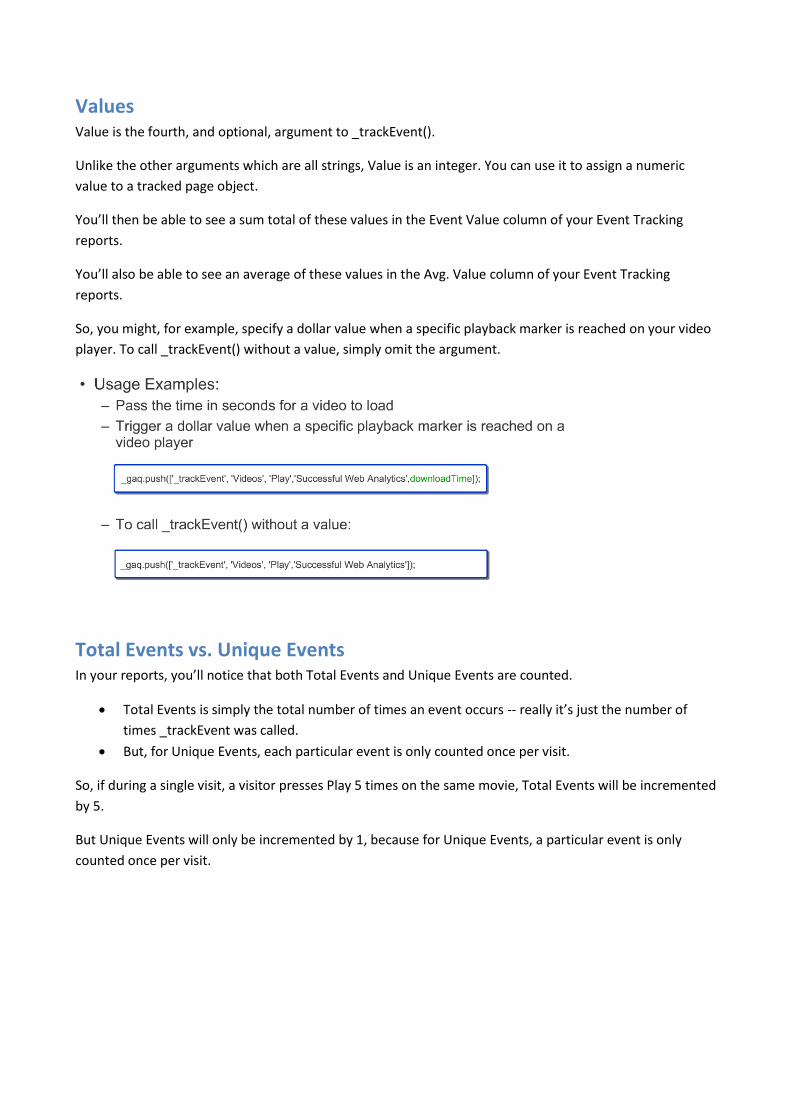
Values Value is the fourth, and optional, argument to _trackEvent().
Unlike the other arguments which are all strings, Value is an integer. You can use it to assign a numeric
value to a tracked page object.
You’ll then be able to see a sum total of these values in the Event Value column of your Event Tracking
reports.
You’ll also be able to see an average of these values in the Avg. Value column of your Event Tracking
reports.
So, you might, for example, specify a dollar value when a specific playback marker is reached on your video
player. To call _trackEvent() without a value, simply omit the argument.
Total Events vs. Unique Events In your reports, you’ll notice that both Total Events and Unique Events are counted.
Total Events is simply the total number of times an event occurs -- really it’s just the number of
times _trackEvent was called.
But, for Unique Events, each particular event is only counted once per visit.
So, if during a single visit, a visitor presses Play 5 times on the same movie, Total Events will be incremented
by 5.
But Unique Events will only be incremented by 1, because for Unique Events, a particular event is only
counted once per visit.
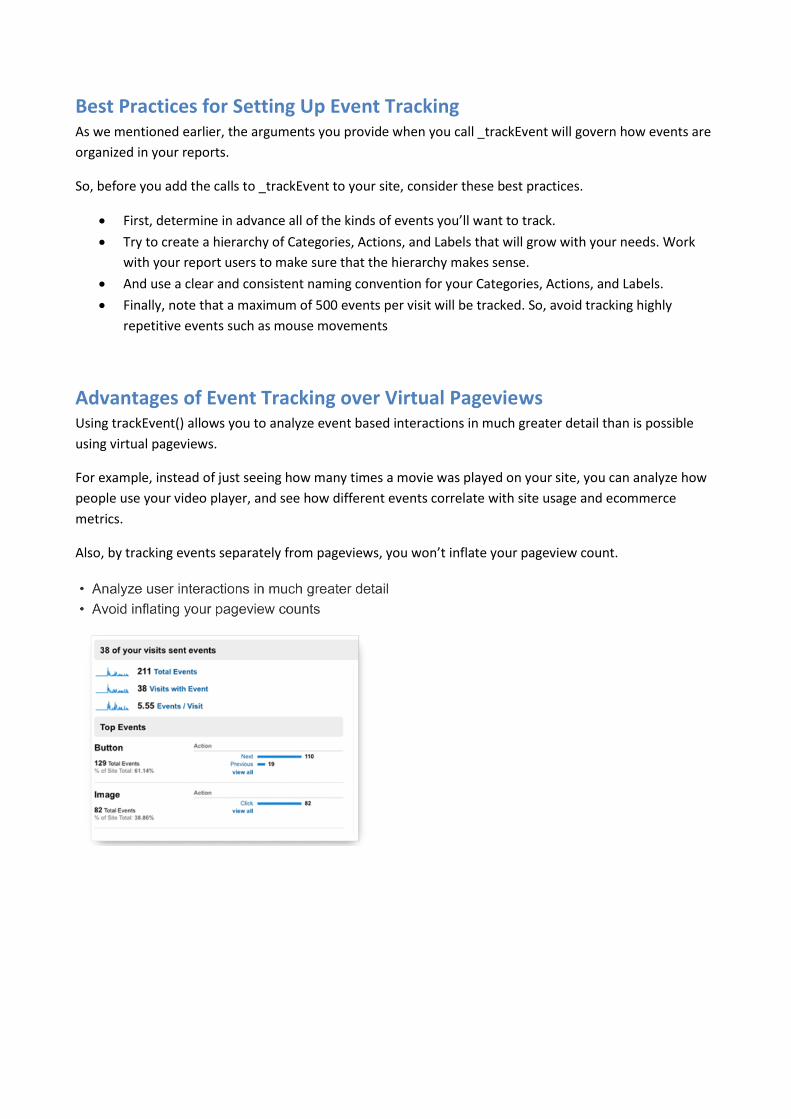
Best Practices for Setting Up Event Tracking As we mentioned earlier, the arguments you provide when you call _trackEvent will govern how events are
organized in your reports.
So, before you add the calls to _trackEvent to your site, consider these best practices.
First, determine in advance all of the kinds of events you’ll want to track.
Try to create a hierarchy of Categories, Actions, and Labels that will grow with your needs. Work
with your report users to make sure that the hierarchy makes sense.
And use a clear and consistent naming convention for your Categories, Actions, and Labels.
Finally, note that a maximum of 500 events per visit will be tracked. So, avoid tracking highly
repetitive events such as mouse movements
Advantages of Event Tracking over Virtual Pageviews Using trackEvent() allows you to analyze event based interactions in much greater detail than is possible
using virtual pageviews.
For example, instead of just seeing how many times a movie was played on your site, you can analyze how
people use your video player, and see how different events correlate with site usage and ecommerce
metrics.
Also, by tracking events separately from pageviews, you won’t inflate your pageview count.

ADDITIONAL CUSTOMIZATIONS
How to Change Session Timeout Value In Google Analytics, a visit—or session—is defined by 30 minutes of inactivity, or when a user quits the
browser.
You can change the 30 minute default by calling setSessionCookieTimeout as shown in the slide.
Simply specify a new timeout value in milliseconds as the argument to _setSessionCookieTimeout().
How to Change Campaign Expiration By default, a conversion can be attributed to a campaign that is up to 6 months old. But, if your business
has a longer or shorter marketing campaign timeframe, you can change this value.
Just call _setCampaignCookieTimeout() and specify your new campaign length in milliseconds.
For example, let’s say that you want to set a campaign length of 30 days. To figure out the number of
milliseconds that is, type “30 days in milliseconds” into Google Search. The search engine will give you the
answer which you can plug into _setCampaignCookieTimeout().
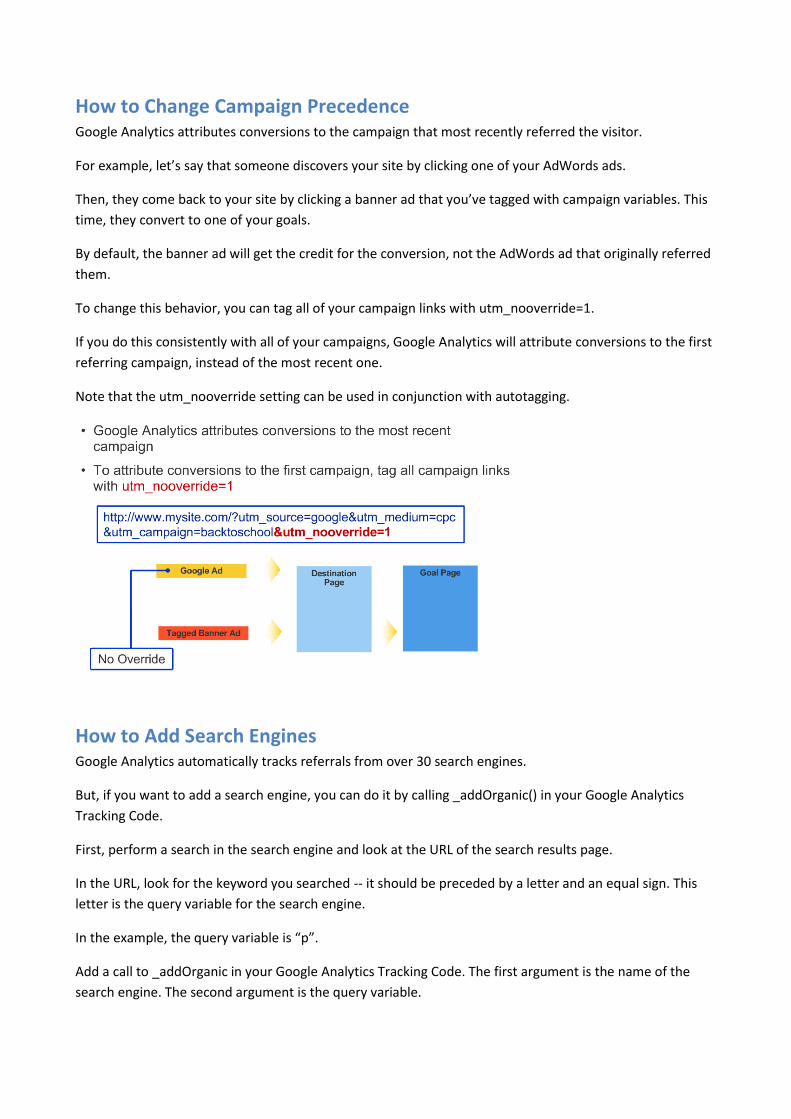
How to Change Campaign Precedence Google Analytics attributes conversions to the campaign that most recently referred the visitor.
For example, let’s say that someone discovers your site by clicking one of your AdWords ads.
Then, they come back to your site by clicking a banner ad that you’ve tagged with campaign variables. This
time, they convert to one of your goals.
By default, the banner ad will get the credit for the conversion, not the AdWords ad that originally referred
them.
To change this behavior, you can tag all of your campaign links with utm_nooverride=1.
If you do this consistently with all of your campaigns, Google Analytics will attribute conversions to the first
referring campaign, instead of the most recent one.
Note that the utm_nooverride setting can be used in conjunction with autotagging.
How to Add Search Engines Google Analytics automatically tracks referrals from over 30 search engines.
But, if you want to add a search engine, you can do it by calling _addOrganic() in your Google Analytics
Tracking Code.
First, perform a search in the search engine and look at the URL of the search results page.
In the URL, look for the keyword you searched -- it should be preceded by a letter and an equal sign. This
letter is the query variable for the search engine.
In the example, the query variable is “p”.
Add a call to _addOrganic in your Google Analytics Tracking Code. The first argument is the name of the
search engine. The second argument is the query variable.
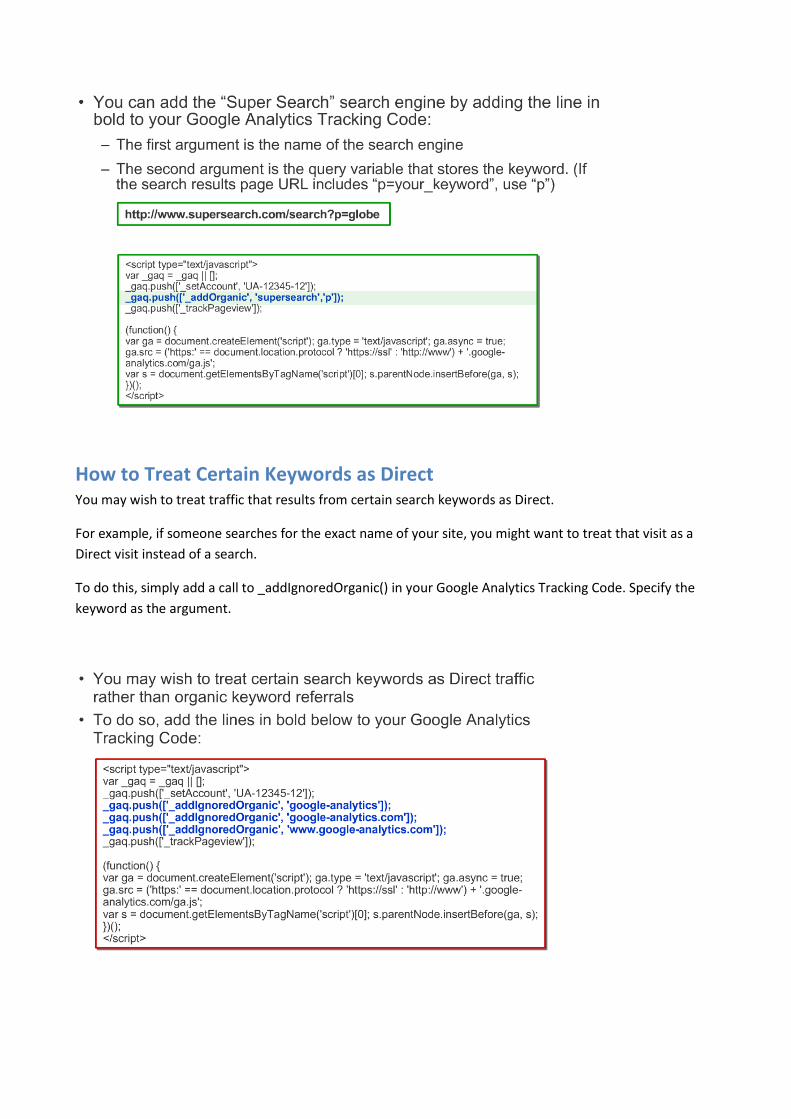
How to Treat Certain Keywords as Direct You may wish to treat traffic that results from certain search keywords as Direct.
For example, if someone searches for the exact name of your site, you might want to treat that visit as a
Direct visit instead of a search.
To do this, simply add a call to _addIgnoredOrganic() in your Google Analytics Tracking Code. Specify the
keyword as the argument.

Treat Certain Referring Sites as Direct You can also treat referrals from certain sites as Direct traffic instead of as referrals.
For each site that you want to exclude as a referral and treat as Direct, add a call to _addIgnoredRef() in
your Google Analytics Tracking Code.
Specify the name of the site as the argument.