government of the northwest territories
TRANSCRIPT
PROGRAM MONITORING AND
EVALUATION MANUAL
GOVERNMENT OF THE NORTHWEST TERRITORIES
APPENDIX B

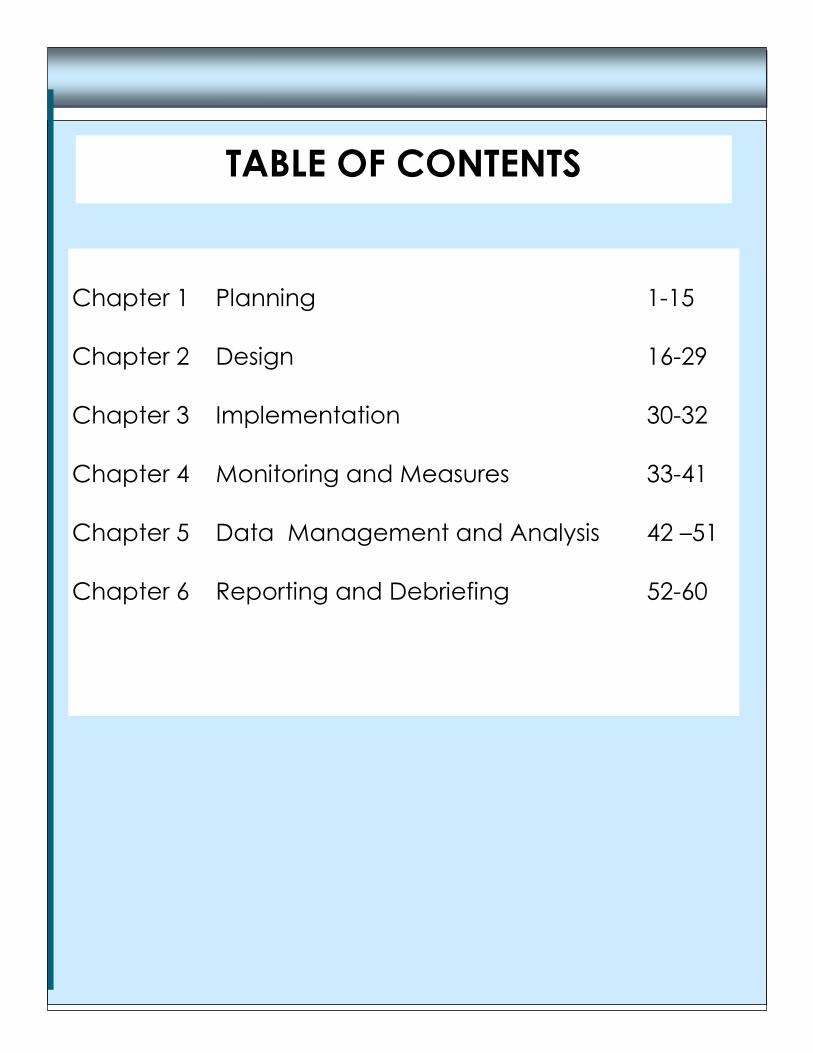
TABLE OF CONTENTS
Chapter 1 Planning 1-15
Chapter 2 Design 16-29
Chapter 3 Implementation 30-32
Chapter 4 Monitoring and Measures 33-41
Chapter 5 Data Management and Analysis 42 –51
Chapter 6 Reporting and Debriefing 52-60


Program evaluation is a systematic collection of information about a program which helps you
make judgements about a program, or informs decisions about future programming. This booklet
will help a program manager to understand the evaluation and monitoring process so that they
will have the basics they need to for proper program management. There are good reasons for
evaluating a program. Any of the following cells could become the focus of an evaluation:
Introduction
Page 1
What to consider from the beginning
Why
evaluate?
Accountability
Planning
Program
Improvement
Contract obligations
Legislation requires
Public scrutiny
Resource decisions
Coordination
Collaboration
Client impact
Efficiency
Program re-design
Discuss the primary reason for the evaluation.
Why are you about to undertake this evaluation? This is important because it will shape the
questions that you ask and set the orientation of the study. Your resources may not be large
enough to cover every element that could be included so stay as precise as you can. It may
mean that some items will have to be dropped. Its better to have a few pieces of good in-
formation on your program rather than a lot of information that cannot be used.

PHASE 1
PLANNING FOR EVALUATION
The most terrifying words in the
English language are: “I’m from
the government and I’m here to
help.”
Ronald Regan
Page 2
Planning
Design
Implementation
Data Analysis Reporting and
Debriefing
Along with the primary reason you should be assessing if it is actually
evaluation that would be most helpful. For example: High Board Turnover
Sometimes a Board can have problems of its own. The problems may
stem back to things like outdated by-laws, little understanding of
"governance", operational boards versus policy boards, miscommunica-
tion with staff, unrealistic expectations, etc. In these cases you may want
to hire someone who is an expert on Board relations, roles, and responsi-
bilities. They may have experience in Board evaluation as opposed to
program evaluation. Extreme Staff Turnover There is a good chance that
if your organization is suffering from really high staff turn over or poor staff
morale, it might point to problems with 1) the working environment, 2)
management style or practices, 3) the nature of the work, 4) pay levels.
One suggestion is to call in a Human Resources Specialist rather than an
evaluator. They have more tools in their belt for this kind of exploration.
If you think money is missing, or you are constantly having a difficult time
making payroll, you either need an accountant or an auditor to check
your finances. However you can look at the value for money of the pro-
gram expenditures.
Steps throughout the evaluation process
Page 3
Determine the commissioner of the evaluation.
Under whose authority are you conducting this evaluation? It may be your own authority but it
may be that your Deputy minister or Minister wants it done. It could be a board of some sort or
perhaps it is a condition of a legal agreement. Although many parties (like your clients) may be
interested in the evaluation, you will be writing for who ever commissioned the work that will be
done.
Consider your current work load.
Many government managers will say that there is no perfect time to conduct an evaluation and
feel they are stretched to the limit already. Do you have the time to do this right now? Even if
you hire someone to assist you or you pass the entire project over to another staff member there
will still be demands on your time.
Consider the program’s current operating environment.
There may be times in your organization when undertaking a program evaluation is not favour-
able. This includes Periods of Organizational Change Be aware that management changes or
agency reorganizations are very stressful for staff. They may not be as open or helpful as they
usually are. They may think that you are evaluating in order to cut their program. We suggest
that you reschedule your evaluation. No Money If you want to hire out to do your evaluation
and have very little money, you need to either scale back your evaluation or wait until another
time. If you cannot afford to do it right, you need to re-think the task. Is it fiscal year end, Christ-
mas or March break time? Has there been a tragedy in the communities that you are involved
in? Think about the timing of the project.
Enumerate your resources
What do you have to work with? Do you have a budget?
Consider that you may need special software, overtime
pay, long distance money for document bindings etc.
look at the help you can expect from other staff, or the
additional human resource needs that might come from
coding and entering data. Do you enough office space?
Planning
What to consider from the beginning

If you have carefully considered why you are undertaking an evaluation, you are closer to
having a clear statement on its purpose. There must be an end point to the exercise. If you
return to page 4 you can see three major reason that evaluations are normally carried out.
Beside these are considerations that might be addressed in that kind of evaluation. A purpose
could be to see if the intervention has had an impact or what kind of impact can be
documented. Another purpose could be to see if the funds are commensurate with the results
achieved, or even if the systems processes used in the program create an efficient work place.
This purpose statement is a touchstone. It has to be clear and concise and should guide all of
the work that is about to be undertaken. It should be matched with the scope of the
evaluation.
It is possible that an evaluation can be done prematurely if the evaluator is looking to show
results before the program has had a chance to be fully implemented. It could also be that the
client has a number of stages to progress through before effects are realized.
Page 4
PROGRAM
COMMUNITY PROBLEM
PROGRAM DESIGN
PROGRAM IMPLEMENTATION
PROGRAM
MONITORING & EVALUATION
REPORTING & FEEDBACK
PROACTIVE EVALUATION
CLARIFICATIVE
EVALUATION
INTERACTIVE EVALUATION
MONITORING EVALUATION
MONITORING EVALUATION
IMPACT EVALUATION
BASIC PROGRAM CYCLE
1.1 Define the purpose of the evaluation
1.2 Determine the stage of the program and approach
Planning
Page 5
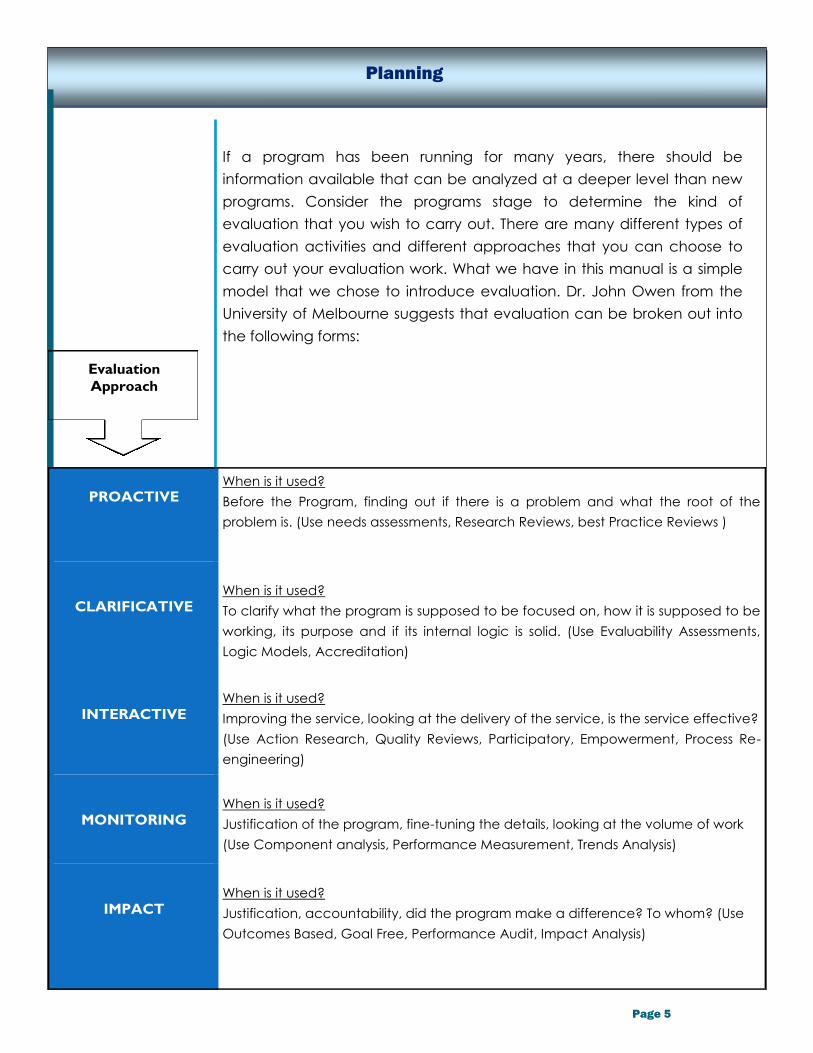
If a program has been running for many years, there should be
information available that can be analyzed at a deeper level than new
programs. Consider the programs stage to determine the kind of
evaluation that you wish to carry out. There are many different types of
evaluation activities and different approaches that you can choose to
carry out your evaluation work. What we have in this manual is a simple
model that we chose to introduce evaluation. Dr. John Owen from the
University of Melbourne suggests that evaluation can be broken out into
the following forms:
PROACTIVE When is it used?
Before the Program, finding out if there is a problem and what the root of the
problem is. (Use needs assessments, Research Reviews, best Practice Reviews )
CLARIFICATIVE
When is it used?
To clarify what the program is supposed to be focused on, how it is supposed to be
working, its purpose and if its internal logic is solid. (Use Evaluability Assessments,
Logic Models, Accreditation)
INTERACTIVE
When is it used?
Improving the service, looking at the delivery of the service, is the service effective?
(Use Action Research, Quality Reviews, Participatory, Empowerment, Process Re-
engineering)
MONITORING
When is it used?
Justification of the program, fine-tuning the details, looking at the volume of work
(Use Component analysis, Performance Measurement, Trends Analysis)
IMPACT
When is it used?
Justification, accountability, did the program make a difference? To whom? (Use
Outcomes Based, Goal Free, Performance Audit, Impact Analysis)
Evaluation
Approach
Planning

Did you ever wonder?
Do we have enough money to run the organization?
Do we have the support of other agencies?
Why did unexpected things happen?
How much does it cost us to provide this service?
Are we doing any good?
Should we continue to do this work?
Is our community getting any better?
There are many things you might like to know about your program or
service. The first step in framing an evaluation is to ask "What do you
want to know?” This is the hardest part of an evaluation. You will need
to talk to your stakeholders and staff to try to get the information
together. People will say things like "I want to know if the program
works”, or “I don’t know, just evaluate it”. Don't be swayed by this; you
have to be very specific. If you are not specific you cannot measure
accurately. It takes a long time to get down to the true question.
What can help you to decide which questions to select?
-Review the original terms of reference for the program—the original
contracts or documentation.
-Talk to your clients and staff
-Talk to other agencies
-Talk to your funders
-Ask your Board
-Read your minutes, logs, or files
-
Different kinds of questions can be put into categories to help you get a
rounded view of the data that you might receive. The simplest way is to
look at questions that are concerned with the client and the operation.
Questions about clients
It is important to find out what happened to your client. What happened
to your client before they were in your program? What happened to
them afterward? Did changes happen right away? A few months later
or years later? Did your program make big changes - big enough to
effect the whole community? Sometimes a change can be seen right
away, or it may take a few years or a lifetime to achieve. Things like
behaviour and attitudes are slow to change.
Page 6
Generate a large
number of items
and then weed
them down until
you have 4 or 5
evaluation ques-
tions that are very
clear.
A good plan today is
better than a great
plan tomorrow!
1.3 Choose Your Questions
Planning
Questions about operations
What do we mean by operations? An operation is the administration and management that
surrounds a work situation. Operations handles all the support functions such as payroll, buying
supplies, paying bills, buying computers, etc. Having good management and administration
takes the pressure off of staff so that they can concentrate on their specialty area. Operations
have a great deal to do with the success of a program.
For example:
Can we work more efficiently?
Is the Board interfering with client work?
Where is all our money being spent?
Are we well managed?
Why can't we hang on to staff?
Efficiency
Efficiency is about business processes. The number of steps that you go through to get to a
desired end is related to how efficient the program is. When the program was designed,
procedures or processes were put into place. The fewer steps it takes the more efficient the
program. Why is this important? Because processes take time and time is money. The ore time
taken on procedures and processes, the less time the worker has to spend or in their specialty
area, so it impacts on client satisfaction as well. Having said that it is important to note that there
is a need for bureaucracy. You will need to keep a paper trail on certain items especially money
transfers and there are legislative requirements that have to be maintained. Documentation of
the program is necessary for audit and for evaluation purposes, so you might want to make sure
that you hit middle ground, you are efficient with processes and can get the job done with the
minimum number of steps while ensuring that there is proper program recording.
Economy
Economy refers to getting things done in the most effective way that you can for the least
amount of money. It does not necessarily mean that the cheapest way is the best way. You must
get value for your money. If you spend 10 dollars and get a tiny change, but then if you spend 15
dollars and get a huge change, where is your money being spent in the best way? Perhaps you
get a big change when you spend 25 dollars but only a tiny barely noticeable when you spend
an extra 30 dollars on top of this. What is the best value for your money?
Page 7
Effectiveness is doing the right things—efficiency is doing things
right
Planning

Page 8
Effectiveness
Effective means that you got the results that you were looking for. Was your program
effective? Did you get different degrees of effectiveness? Did the medicine work? Did the
children learn and apply their knowledge? Did the paint on the house last for 10 winters?
Effectiveness translates into results, outcomes or impacts.
An evaluability assessment seeks to find out if a program can actually be evaluated. Are the
program manager’s ready for this evaluation?
There should be clear goals for the program
The important issues should be known by the managers
There should be a theory as to how what they do will make a
difference
If the program has not documented and set itself up properly in the
beginning, then you will have a hard time during the evaluation. Your best action is to meet
with the staff to spend some time with them clarifying the goals, activities and outcomes. By
doing this you are helping to clarify the program’s design. Laura Leviton, Recruitment Business
partner at LexisNexis UK suggests the following:
1. Involve intended users of evaluation information.
2. Clarify the intended program from the perspective of policy makers, managers, and staff
and other key stakeholders.
3. Explore program reality, including the plausibility and measurability of program goals and
objectives.
4. Get agreement on evaluation priorities and use of information on program performance.
We suggest that a review of available documentation is necessary, and
it is important to look at what data is available and what information
can be collected in view of the questions that have been selected. If
there is not enough information to answer the question, it should be
reconsidered. Thee should also be a mix of both qualitative and
quantitative information.
QUALITATIVE in-
formation tells a story
QUANTITATIVE information gives you
numbers
Thinking about both
kinds of information will
help you to stretch your
thinking when it comes to
developing clear evalua-
tion questions.
1.4 Conduct an Assessment on Available Data
Planning Planning
Page 9
Example: Quantitative client information—numbers
80% of high school graduates are employed.
Spousal assault has dropped 80% over 5 years.
90% of all babies are born with ideal birth weight.
There has been a 5% loss of property due to forest fires in the past two
years.
Of 100 people who entered alcohol treatment, 24 months ago, 50%
are still sober.
IMPORTANT!
Once the questions have
been selected, it is impera-
tive that you get whoever
commissioned the evalua-
tion to agree to these ques-
tions. The last thing you
need is for the boss to look
at the report, and say that
it is not what they had in
mind and does not address
any of their concerns!
The scope of the evaluation will set the boundaries around how far the study is to
go. How big is the evaluation? How much ground will be covered? This is impor-
tant because it sets limits on the effort expended and the funds that will be
spent. If at some time in the future you were asked why some element was not
covered in the study, your scope is will protect the studies' parameters.
1.5 Set the Scope of the evaluation
Planning
Example: Qualitative client information—stories
Attitudes of the clients.
ratings on the services provided.
opinions about life situations, etc.
If it expresses an opinion or tells a story it can be considered qualitative
information.

Page 10
The Terms of Reference must include nearly everything that you want to do for the evaluation.
This document is your touchstone. It will explain to everyone what you and your team have de-
cided to do. It is a really good idea to have it formally approved. If ever it comes to a dis-
agreement about what your task is, the terms of reference should clarify things. Here is a sug-
gestion for what it might contain:
1. Purpose of the evaluation
2. Who commissioned the evaluation
3. Program overview
4. Scope
5. Evaluation questions
6. Design of the study
7. Timelines
8. Budget
9. Project Management
10. Roles and Responsibilities
11. Where the report will be distributed
12. How the findings will be used.
Planning checklist
Have you……...??
1. Determined the primary reason for the evaluation.
2. Defined the purpose of the evaluation
3. Determined the stage of the program
4. Selected questions
5. Conducted an assessment of available data
6. Sketched out the terms of reference
1.6 Draft Terms of Reference
Planning

OUTLINE
1. Review of questions with program stage and approach
2. Selecting tools and data collection methods
3. Participant selection and sampling
4. Set the protocol
5. Writing instructions to participants
6. Review packaging and public announcements
7. Setting the evaluative criteria
8. Traditional Knowledge and Culture
9. Evaluation timeline
10. Evaluation framework
11. Budget
12. Conduct & ethics
Page 11
Compare the questions with the age of the program to see if the
questions are fair at this point of the program’s operation. Are they
premature or should initial results be expected? Is the selected approach
appropriate for the kinds of information that you are seeking?
2.1 Review questions with program stage and approach
2.2 Selecting tools and data collection methods
PHASE 2
DEGISNING THE EVALUATION
Go through each question and decide where the best data is available.
After that decide how to get the data. Please, think outside the box. Most
programs want to use questionnaires but people are quickly becoming
inundated with requests for information from websites or telemarketers to
email surveys on top of opinion polls.

Page 12
Methods for Collecting Information
Developing your collection instrument can be expensive and time consuming, so choose
carefully. There will be pros and cons to each method. Balance your information requirements
against your resources to see what you can afford to do, in what time frame.
Qualitative Information Examples:
Recording Sheets Value for Money Audit
Logs/ Diaries File Audit
Interviews Comparative Studies
Artistic Expression Video Journals
Observation Opinion Polls
Management Reviews Surveys/Questionnaires
Focus Groups News report discussion forums
Graffiti walls for teens Case studies
Longitudinal studies Process charting
Delphi Technique Blue ribbon panels
Peer reviews Comparative studies
Cost to benefit studies Return on Investment studies
Literature reviews Picture Diaries
Meta Analysis Value for money study
How do you decide?
How much money do you have to develop the tool?
How much time do you have?
How many people will it take to use it to gather data?
Does it fit with the questions that you wish answered?
Will it be acceptable to your clients?
How hard will it be to get people to participate?
How sensitive is the information that you need/
How in-depth do you need the information to be?
Design

Page 13
Quantitative Information Examples:
Budget sheets and expenditure reports
Website analytics
Time series analysis
Screening tools or psychometrics
Descriptive statistics
Analysis of variance between groups
Performance measures
Pre-Post studies
How can you get people to participate? You can invite them to volunteer by letter or personal
invitation, by radio, or newspaper, depending on what it is that you are evaluating. If the
information that you seek is very personal, people may not be comfortable in stepping
forward. In some cases, you can choose people randomly, picking names out of a hat or even
from the phone book. How about every 7th person who walks through a door? You could
choose every 10th, 20th, or 50th "thing" for study. (It does not always have to be a person. It
could be a truck, a food item, an animal, or even a file!)
You could choose people who fit a certain profile, like people who are the same age, with the
same education, the same medical problem or family problem. You can't generalize to
everybody what you find out about a particular group of people who share a common
problem.
In order to be able to say that your data is a fair or true
representation of your program participants, you have to have a
"sample".
2.3 Select sample frame and participants
Design

Sample Frame From the population you must decide who (or what) to include and who
(or what) to leave out. Narrow in on who you are interested in. You need to know who
NOT to include in the study because you want the people who participate in the study to
be similar to each other. If they are similar, they can be called representative of the
population. All this means is that they are in a group of people who share similar
characteristics. If they are all very different, we will not be able to say that they are
representative. The “values” (or descriptors) used to describe populations are called
population parameters. When we calculate descriptive statistics on a sample, sometimes
we are interested in just that sample, but more often we are interested in making
inferences about the population parameters.
Sample Size We need to have enough people participating to let us generalize about
everyone in the population. We figure this out is by doing a statistical calculation. How
confident do you want to be that your predictions about the sample will be right? People
most often use 95% or 99%. This is called a confidence level. The confidence interval is a
plus-or-minus figure. This is what you usually see with opinion poll results. All it means is that
when you use a sample, you want to add on a little bit extra just to make sure that
absolutely everybody is captured by the sample. Think of the term “more or less” or, “give
or take a few No matter how representative a sample is, the measurements you obtain
from it will not likely be exactly the same as what you would get from measuring the
entire population. That difference between sample statistics and population parameters
is called sampling error.
Calculating a Sample
To figure out how many items you need for your sample, you have to have some
information:
How big is your population?
How sure do you want to be? 90% 95% 99%?
What confidence interval do you want? 4%? 5%? 2%?
To answer these questions, it is recommended that you use a sample size calculator.
There will be a number of these on the Internet and they will ask you the three above
questions.
Page 14
Design

You will need to actually describe the way in which you will you collect the information. What
arrangements do you have to make? Perhaps you are doing an interview. This requires an inter-
viewer and an interviewee. Are these 2 people a good match? Do they have a private place to
do the interview? How will they contact each other? If you are using a questionnaire, how will it
be delivered to the people that you want to answer it? How will it get back to you? Are there
instructions on it? If you are doing a file review for operations, you have to set times and dates for
this to take place. It should not interfere with someone getting their work done.
Describe the what, the how when and responsibility for ach step in collecting the information.
This way, any bias that may be inherent in your study may become apparent. It also will add rig-
our to the study in that all of the pieces are presented together so that the study design can be
strengthened. A basic tenant of research is replicability, where others could carry out the same
study and get similar results, and writing the protocol can help them to do this.
Write instructions for the participants
When you are designing your tools, you must pay attention to the instructions that you are send-
ing along with the tool. What might seem clear to you might not make sense to anyone else. Test
your instructions too!
If you send out an item like a questionnaire - here are a couple of things to remember. If the pa-
per is white, and you are sending the questionnaire to someone who sits at a desk, it may get
shuffled into all of the other papers and get lost. Bright colored paper helps. Attractiveness
counts in designing your tools. If the questions are too crowded, or the print is too small, or the
instructions are too complex, and the “look” is messy, people will turn away from it. This is a real
art form. Again, get help if you need it. Have a third party review your public announcements—
posters, paper ads, flyers, or newsletters to make sure that the language, age and culture is ap-
propriate and that it is attractive enough to catch the audience’s eye.
Page 15
2.4 Set the protocol
2.5 Test your packaging and review public announcements
Design

There are sometimes
problems with evaluation studies due to poor research design. As you review your tools, meth-
ods, participants, and data collection tasks, keep your eyes open for these trouble spots.
Getting the information from people who only have good things to say about your pro-
gram.
Selecting people who are not " the normal guy" (i.e. representative) of your program cli-
ent.
Trying to prove that your program is effective rather than trying to see what the reality is.
Trying to prove one thing while testing something completely different.
Ignoring the hundreds of other things (variables) that might influence program outcomes.
Ignoring differences between groups.
Generalizing your findings to everybody when your sample size is too small.
Bad timing.
Misleading introduction of the evaluation project.
Adding up scores on scales and then taking an average
The tool is not a good match for the questions
Bad/confusing instructions
Page 16
Common Design Flaws
You might consider these points "pesky" , but make sure you do them! They are important!
Collect data in a consistent way
Test your data collection tools
Identify information source before starting
Note: Who have you chosen to collect the data? Can this person be neutral? Will the par-
ticipants trust this person? Make sure each person on the team collects the data in exactly
the same way. You will have to coach them.
Design
An important thing to remember when you are carrying out an evaluation is that you have a
serious obligation to preserve peoples privacy. This would include people you interview, survey,
or records and files used for information sources. Permission to use private information must al-
ways be obtained up front, before any data gathering occurs. Strict rules for how to use the in-
formation must be agreed upon by all parties. Nothing will damage your credibility more than
misuse of confidential information, especially in if you live in a small community, where word
travels fast.
You must be sure to demonstrate a respect and sensitivity to the diversity of the people served
by the program. Here are some guidelines :
explain to stakeholders the potential risks and benefits associated with the intended
evaluation;
obtain written informed consent from those involved in the evaluation, where there may
be risks;
never deny anyone services for refusing to participate in the study;
do not place potential program users in a control group that prevents them from receiving
vital services;
protect confidential information contributed by program users and service providers;
ensure anonymity of persons who respond to surveys, questionnaires, etc.;
treat people fairly
Also, you must be careful about how information impacts the public. If there is sensitive or dis-
turbing information resulting from the evaluation, care must be taken as to how it is made pub-
lic.
There is often a high degree of interest and participation by community residents. It is better to
give the people more information than some may feel is necessary, than to be accused of hid-
ing things, or wasting peoples’ time with evaluations that produce no visible results.
Page 17
2.6 Review of conduct and ethics
Design

The Access to Information Act on information collected through program evaluation and Pri-
vacy Legislation may have impacts on the work that you are about to undertake. On the one
hand the report can be requested under the Access to Information Act. This is fine, but if some-
one wants to see the actual raw data like interview notes, and questionnaire sheets, there may
be difficulties. You must not release anything that will lead the reader to know who said what,
unless they give you permission. If in any doubt at all get legal advice or talk to your departmen-
tal ATIPP coordinator.
Access to Information and Privacy Acts
Page 18
Be sure to include traditional knowledge where you can, and when designing your program,
respect the culture that you will be working in. If you are using a data collection method that is
not socially acceptable, you will not have the participation that you require. In some cultures,
discussions of sexuality, gender roles and traditional belief systems can be deemed as inappro-
priate when in the presence of another gender, or in the presence of someone from outside of
the culture.
Looking for traditional knowledge has it’s own set of rules.
In some cases elders are paid for their expertise but in
other cases when asking someone their opinion on a pro-
gram they are not paid .
In some cases traditional knowledge may not be in
agreement with scientific or standard practice. Even so, it
Traditional knowledge and culture
Design
Evaluators are to be competent in their provision of service.
Evaluators should apply systematic methods of inquiry appropriate to the evaluation.
Evaluators should possess or provide content knowledge appropriate for the evaluation.
Evaluators should continuously strive to improve their methodological and practice skills.
Evaluators are to act with integrity in their relationships with all stakeholders.
Evaluators should accurately represent their level of skills and knowledge.
Evaluators should declare any conflict of interest to clients before embarking on an evaluation project
and at any point where such conflict occurs. This includes conflict of interest on the part of either evalua-
tor or stakeholder.
Evaluators should be sensitive to the cultural and social environment of all stakeholders and conduct
themselves in a manner appropriate to this environment.
Evaluators should confer with the client on contractual decisions such as: confidentiality; privacy; commu-
nication; and, ownership of findings and reports.
Evaluators are to be accountable for their performance and their product.
Evaluators should be responsible for the provision of information to clients to facilitate their decision-
making concerning the selection of appropriate evaluation strategies and methodologies. Such informa-
tion should include the limitations of selected methodology.
Evaluators should be responsible for the clear, accurate, and fair, written and/or oral presentation of study
findings and limitations, and recommendations.
Evaluators should be responsible in their fiscal decision-making so that expenditures are accounted for
and clients receive good value for their dollars.
Evaluators should be responsible for the completion of the evaluation within a reasonable time as agreed
to with the clients. Such agreements should acknowledge unprecedented delays resulting from factors
beyond the evaluator's control.
Canadian Evaluation Societies
GUIDELINES FOR ETHICAL CONDUCT
Page 19
COMPETENCE
INTEGRITY
ACCOUNTABILITY
Design

No matter how
carefully considered
your timeline is, what
ever number you come
up with, double it.
There are always
unforeseen situations
that will push you off of
your timeline.
Page 20
2.7 Setting the timeline
What time of year is it? Is there a community situation that you should
know about? When do you want the information to go out and when do
you want to have all of the information collected by? It is a good idea to
put a time limit on it so that you can start working with your data. Also
think of timing in smaller terms - when you approach a person , or what
the program can handle at that particular time. Have you all new staff?
Is it the busy season for your service? What might be good for your client?
Here is an example of how a timeline might look. Please be aware that
not all steps have been included here. You may want a more precise
timeline.
Approve terms of reference Develop survey Conduct sampling Develop Data collation tools Implement survey Start file Audit Data collection Data cleaning and analysis Draft /report preliminary results Write draft report Finalize report Prepare report release through public affairs Debrief evaluation
Jan Feb March Apr May Jun Jul Aug Sept Oct Nov Dec
When is the best time to
collect this information?
Design

How do evaluation practitioners make a judgment on a program? What kind of criteria is used to decide if
something is acceptable or not acceptable? There are two well known international evaluators that
give some guidance in this area and we refer to their expertise here:
Dr. Michael Patton advocates for evaluators and clients to establish the standards of desirability
before the data collection. This way there is a classification by which the program can be held
up for inspection, in a calm and deliberative manner before the results come in. He calls them
levels of attainment:
1. Level at which the program is considered highly effective;
2. Level at which the program is considered adequate;
3. Level at which the program is considered inadequate.
Dr. John Owen advises that before the data gathering, the evaluators and clients should decide
who is to make the judgment about the worth of the program under review. He goes on to say
that “In some instances, the client of an evaluation is more than happy to let the evaluator do
so. But in other cases, the client prefers to take on this responsibility.” Here is an example
Page 21
2.8 Setting the Evaluative Criteria
Aspect Element to be judged
Excellent Good Mixed Poor
Documentation Appropriate signa-
tures and paper trail
for program approv-
als.
100 % of appropriate
approvals in place
At least 85% of files
are current
90% of appropriate
approvals in place
Between 84-74% of
files are current
70% of appropriate
approvals in place.
Between 73-63%
Under 69%of appro-
priate approvals in
place.
Under 62% of files
are current
Client Focus Satisfaction:
Students
Directors
Deputy Ministers
Program is deemed
excellent if 90% or
over of those sur-
veyed are satisfied.
Program is deemed
good if 80% - 89%of
those surveyed are
satisfied.
Program is deemed as
mixed, if 70% -79%of
those surveyed are
satisfied.
Program is deemed
unsatisfactory if the
satisfaction rate is
under 70%.
Design
Even if you conduct the evaluation in-house there may be costs associated with it that
you could overlook . Consider the following:
Training time
Advertising
Consultant /research assistant time
Publishing/Photocopying
Honoraria
Mail out costs
Travel /hotel costs
Food for community meetings
Office supplies
Long distance calls
Specialized computer software
Backfill
Translation
There will always be a cost to an evaluation, although it may not be apparent. Taking
time from your regular schedule, your salary, meetings with steering committees and
working groups, overtime and use of government equipment all contributes to the cost
of an evaluation .
2.9 Budgeting
Page 22
Design

2.10 Evaluation frameworks
There is nothing complex about evaluation frameworks. There is no
correct way to do an evaluation framework either. They are simply plans
on how the work that you are going to carry out is documented. They
can be complex or simple, but they need to give the reader an idea of
the sequence of events about to take place.
Example 1:
Page 23
Data Collection In-strument
Data Source Type of Analysis Timing
Q1 What has been the utilization of each program?
Q2 What has been the level of funding and expenditures, over the years of operation
Q3 What other resources are dedicated to this program?
Q4 What are the barriers to access for this program?
Q5 What have been the outputs and impacts of the program on the targeted population?
Q6 What worked well and what improvements could be made with this type of administrative structure?
Question
Associated
Activity
Data
Source
Method
Type of
Analysis
Who
Collects
When
Collected
Example 2:
Design

Reviewed the questions considering program stage and approach
Selected the tools and data collection methods
Conducted selection and sampling
Set the protocol
Wrote instructions to participants
Released public announcements
Set the evaluative criteria
Considered traditional knowledge and culture
Monitored the evaluation timeline
Set up the evaluation framework
Budgeted the project
Reviewed all conduct and ethical issues
Page 24
Design checklist
Have you……...??
Design
Example 3
PRE-TEST
(Situation that the program
was set up to address)
Additional evidence
Roll up of performance
measures
Client feedback
POST-TEST
(Situation today)
COMPARISON
Provides supporting
evidence

Page 25
Once the planning and design is finished, it is time to get started with implementation. This is
assuming that:
The terms of reference have been approved;
The evaluation framework is complete;
The instruments for collecting the data have been designed and tested;
Public affairs and communications documents are ready to go.
Data is ready to be collected.
Handling resistance
The next task is to manage the evaluation project. Some delicacy might be necessary. Evalua-
tion can often generate strong feelings and even fear. Those doing the evaluation must be
careful not to rush the evaluation and take time to listen to the concerns of the program staff.
Talking to program staff about how they feel or think of the evaluation and the program is
helpful, even more so if they are able to contribute to the formation of the evaluation ques-
tions. These should reflect things that they genuinely want to know. By actively involving the
staff throughout the process, you will help generate some ownership and increase the chance
of the results being used.
Keeping track
A good way to keep the project on track is through interim reports. Tentative findings and rec-
ommendations be communicated to the steering committee or senior management as they
arise. Keep your timelines close as well—should you find that you are off track by 10 days with-
out reason, it may require that you turn your attention to finding out what the difficulty is.
Even if you have hired a consultant to carry out the evaluation, as a program manager you
are still responsible for ensuring that the project goes as planned. You have not “offloaded”
your work on to someone else's shoulders; you should be committed to getting the best project
that you can while spending the public’ s money wisely.
PHASE 3
MANAGING THE EVALUATION PROJECT

Page 26
The importance of the planning stage
Many of the most important decisions in any project are discussed in the planning stages. This is
where the people around the table may be willing to entertain innovations or ideas regarding the
project. No matter what the outcome is, the defining characteristics of the project and the major
decisions will be made during this time. Some of these decisions will have an impact on the suc-
cess of the project – so document carefully and use your influence carefully. It is important to en-
gage the people with whom you will be working. Keeping everyone in the loop and ensuring that
everyone has the same idea of the purpose and direction of the project is critical. Never assume
that everyone is on the same page. You may have to reiterate comments to constantly test that
everyone has the same vision. Its important to use active communications – having people at the
board room table rather than scores of emails but be aware that people time is valuable. Re-
quest a meeting when you have something to report or need direction. In evaluation cases if dif-
ferent stakeholders are partnering with you, there may be situations where there is disagreement.
You may have to work to reach middle ground and if necessary with the support of senior man-
agement.
Manage Risk
Especially in the forum of social programming, the project manager will have to look for potential
risk situations and take steps early to mitigate these. This might include things such as a person be-
ing unhappy with a particular question and complaining about it, or a groups being annoyed at
being excluded from the group who was consulted. Ensuring that your ethics are absolutely
proper is a good place to start.
Stay on Course
If you have good terms of reference that have been ap-
proved by the commissioner of the evaluation, you are
much less likely to experience mission drift. There may be
the attempt for partners to request add-ons or to ex-
pand the project under the idea of “while we are
here...”. It will take careful management skills to keep
the person making the suggestions on side with the pro-
ject while turning them down. As the evaluation pro-
ceeds and something doesn't fit within the original terms
of reference, discuss it with your steering committee or
senior management.
Implementation

Page 27
Take the role of project manager to heart
This means that you cannot let the project run you – you have to manage the project and
may have to negotiate the authority to manage it properly . You will need to make decisions,
and in order to stay on track you will have to resolve issues. It is suggested that your best
course of action is to solve as many issues as you can before going to the Steering committee
or the commissioner, and staying on schedule will be partially dependent on your ability to
problem solve.
Notes on Project Management
Project management checklist
Have you……...??
Implementation
Had the terms of reference approved
Had instruments approved and tested
Prepared the public affairs materials
Kept track of timelines and budgets and expenditures
Managed risk
Managed passive or overt resistance

Page 28
Monitoring and Measuring
WHAT IS PERFORMANCE MEASUREMENT?
Performance measurement can be defined as a data collection and monitoring system es-
tablished to manage activities and improve results of government programs. Performance
measurement goes by different titles; performance information, performance monitoring, per-
formance data, performance management and /or results based management. Industry has
their own version called Six Sigma which is based on quality process outputs to measure de-
fective production and foster management improvement.
The GNWT first used measures in the late 1970’s but went to a formal system called Manage-
ment for results in the mid 1980’s. It was revised in the 1990’s to line up to objects in the busi-
ness plans in an attempt to provide information on results for resources. Managers however,
continued to collect what was important for them to run their programs. If program demands
on time were high, managers kept statistics that were fast to collect. In many cases the data
was not kept in a format that could be manipulated statistically, nor did they perform analysis
on the data that they had on hand.
The link between program evaluation and performance measurement is that the information
from the measures are rolled up or aggregated over time so that managers can answer some
(but not all) of the questions that may be a part of program evaluation.
If measures are collected by a program they must have utility—they must tell the reader
something about the program. This is not likely be helpful with one data point. Many measures
taken the same way over a number of years will show trends. If the units of production are
compared to costs over time the manager can have a better idea of cost per unit, and if this
is then trended against the inflation rate the manager can know that the cost of producing a
unit is becoming more expensive if not less expensive .

Page 29
INPUTS PROGRAM
ACTIVITIES
OUTPUTS MANAGEMENT
ATTRIBUTES
SHORTER OR
MEDIUM TERM
OUTCOMES
SOCIETICAL
IMPACTS
LONGER TERM
(CLIENT TYPE)
OUTCOMES
MONITORING EVALUATION
Money
Staff
Time
Facilities
Supplies
Money spent
Staff hours
Time spent
Facilities used
Supplies bought
Items produced
Clients served
Choose what is matters to you.
Timeliness
Quality
Relevance
Access
Capacity
Efficiency
Cost effective
Knowledge gained
Skills learned
Use of new skills
New practices
Changes in attitudes
awareness
Changes in behaviour
Life long changes
Trending over time
Individual change
Environmental change
Societal change
Economic changes
Political change
Change in public values
Social change
Monitoring and Measures
There are many ways to collect data, and many people choose to measure over time. There
is the expectation that outputs will lead to short term outcomes which will lead to medium
term outcomes and to eventually societal impacts. If the program logic is strong, the case
can be made for attribution from you program to societal impacts but be aware that there
as intervening events that can have influences that your program cannot control. The pro-
gram could be a good as it possibly could be, but it may only have the impact on a person
up to a certain point. Multiple lines of evidence gives a manager a better sense of the reli-
ability and validity of the information that they are already collecting.

Programs, services and projects have a schedules and timelines that are followed from the re-
search stage through implementation, monitoring, evaluation and reporting stages. This is a cau-
tion that as the program progresses through the initial start-up up and into full delivery, the
achievement of results will take time. the graphic below gives a typical situation. Once the prob-
lem is verified, the ideas for an intervention are discussed and the program is designed and im-
plemented. As soon as the program starts, things will be produced or consumed. These will be
the initial outputs. In cases where society wants systemic change, it will take time. Changes in be-
haviour can take a generation to achieve. So if your program is in its first few years of operation,
don’t assign yourself longer term or societal impacts as measures and hope to achieve them
within the first 5 years.
Timing for attainment of results
Page 30
Verification of problem
Program design and approvals
Implementation
and adjustments
Initial outputs produced
Short to medium term outcomes
Medium to longer term outcomes
Societal Impacts
Also consider your ability to influence future impacts. The government has a high degree of con-
trol over inputs and outputs and to some extent the shorter term outcomes but as the length of
time increases between the actual intervention and the social impact is achieved, there are in-
tervening variables that occur over which the government has little control.
Lower ability to con-
trol. Expensive and
difficult to collect but
this is where public
interest lays.
High degree of con-
trol. Easy to pro-
duce and collect
information on.
Monitoring and Measures

Page 31
Although there is cross-over between performance measurement and program evaluation,
many jurisdictions see measurement as a subset of program evaluation. In most cases monitoring
is cyclical, fast and usually involves outputs, production, and processing. Evaluation can be used
in all stages of a program’s life, but is usually aimed towards the assessment of the results of a pro-
gram.
Program Monitoring with Measures
Output measures are usually recorded right away, they record nominal data such as numbers,
types of things, amounts of money, length of time, demographics, etc. If outputs are used in
tandem with inputs they can help the manager to make some kind of judgement on cost effi-
ciency.
Input (how much it cost ) + output (number of things consumed)= was it worth the cost?
Input (amount of time) - output (number of things produced)= is the length of time reasonable?
Output Measures
Definition - units of services provided, products provided or people served by government
or government funded programs; a count of the goods and services produced. Use output
measures when you want to show production. Output measures only tell you how
much was done, not how well or efficiently it was done, or what impact it had on the clients.
Examples of outputs:
• number of grants
• dollar amount of grants
• number of business start-ups
• number of jobs created
• number of students graduating
• number of counselling sessions
Monitoring and Measures
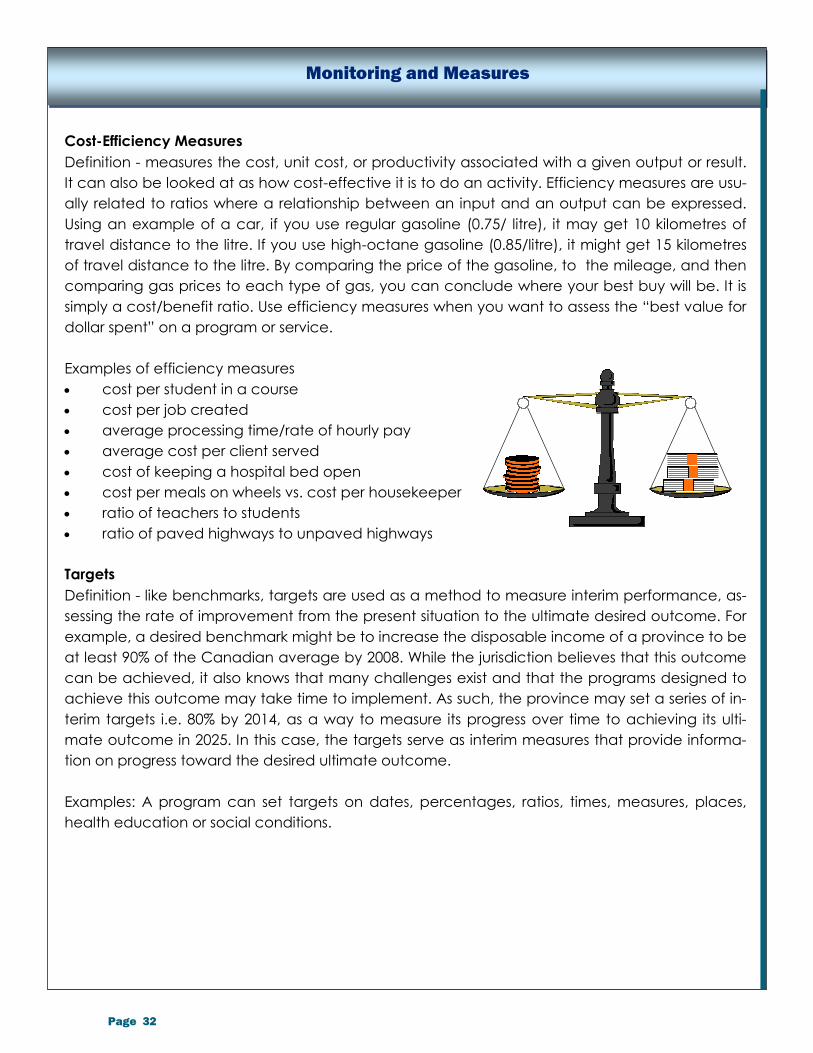
Cost-Efficiency Measures
Definition - measures the cost, unit cost, or productivity associated with a given output or result.
It can also be looked at as how cost-effective it is to do an activity. Efficiency measures are usu-
ally related to ratios where a relationship between an input and an output can be expressed.
Using an example of a car, if you use regular gasoline (0.75/ litre), it may get 10 kilometres of
travel distance to the litre. If you use high-octane gasoline (0.85/litre), it might get 15 kilometres
of travel distance to the litre. By comparing the price of the gasoline, to the mileage, and then
comparing gas prices to each type of gas, you can conclude where your best buy will be. It is
simply a cost/benefit ratio. Use efficiency measures when you want to assess the “best value for
dollar spent” on a program or service.
Examples of efficiency measures
cost per student in a course
cost per job created
average processing time/rate of hourly pay
average cost per client served
cost of keeping a hospital bed open
cost per meals on wheels vs. cost per housekeeper
ratio of teachers to students
ratio of paved highways to unpaved highways
Targets
Definition - like benchmarks, targets are used as a method to measure interim performance, as-
sessing the rate of improvement from the present situation to the ultimate desired outcome. For
example, a desired benchmark might be to increase the disposable income of a province to be
at least 90% of the Canadian average by 2008. While the jurisdiction believes that this outcome
can be achieved, it also knows that many challenges exist and that the programs designed to
achieve this outcome may take time to implement. As such, the province may set a series of in-
terim targets i.e. 80% by 2014, as a way to measure its progress over time to achieving its ulti-
mate outcome in 2025. In this case, the targets serve as interim measures that provide informa-
tion on progress toward the desired ultimate outcome.
Examples: A program can set targets on dates, percentages, ratios, times, measures, places,
health education or social conditions.
Page 32
Monitoring and Measures

Benchmarks
Definition - the standard or reference point against which something is measured. It can be a
goal, or a comparison against another similar organization. For example a jurisdiction may set a
goal to rank in the top three Canadian jurisdictions for lowest percentage of high school drop-
outs per 1,000 students. In this example, the jurisdiction has set a standard of performance or a
benchmark of success, by being ranked in the top three jurisdictions. This jurisdiction will there-
fore assess its performance with respect to high school dropout rates by monitoring its ranking
relative to all other jurisdictions. Only when it achieves a top three ranking will it consider its "stay
in high school program" a success.
Outcomes
Definition -Outcomes are the desired results of the program, activity, or service. These are the
changes that you want to see. They have been called results or sometimes impacts and they
are what happens as a result of your program or service. A goal is what you were aiming for and
the outcome is what actually happened. Outcomes can be short-term, medium term, or long-
term. Some things happen right away, some take months to achieve and some may take years
to achieve.
Shorter-term Outcomes
• % of students trained who have jobs 6 months after training
• increased awareness of the negative effects of alcohol or drugs
• sobriety maintained for 3 months
• homeless people come off the streets to use the shelter
• 14 new northern businesses have been developed
• community governments better manage their affairs
Medium- term Outcome
Within 4 years of initial treatment breast cancer survivors are cancer free
The participants lost a total of 500 pounds in 2 years of the program
Two years after training, students are still employed on a full time basis
sobriety maintained for 3 years for 15 people
10 ex- homeless persons have maintained their own residences
Of the 15 new northern businesses started in 2010, 14 are still successfully operating
Longer-term Outcomes
a healthier population has resulted from a 90% drop in diabetes
safer communities through a XXX drop in crime rates
children exhibit progress towards age appropriate motor skills
a negotiated settlement acceptable to all parties
Page 33
Monitoring and Measures

Management Attributes
Rather than assigning a level of attainment x time as a measure to government activities,
there is a way to ask for certain attributes in the services that are provided. For lack of a
better term, we will call this management attributes. They can be what ever is important to
the manager in regard to competent administration, such as timeliness, cost effectiveness,
quality, relevance ect. One can choose the attributes that they feel are right for the pro-
gram. The following is an example for a post secondary program.
Page 34
ATTRIBUTE METRIC HOW DOES THIS HELP US?
CAPACITY Enrolment in programs
Number of PYs
# and type of program
Are the children actually attending programs?
Are there enough staff to handle the case loads?
QUALITY Program ratings
Number of staff accessing PD
Number of PD opportunities
How do the parents like the program?
Are the staff well trained and current?
Is there money to keep staff trained?
Are we doing enough?
ACCESS Locations
Availability of programs
Number of spaces
Shortfall
Location tells us where programs and services are
being offered. From this we can extrapolate gaps
in services.
The number of spaces /interventions if compared
to the birth rates in the area also will point to po-
tential gaps. It may lead to a public affairs cam-
paign so that parents know what is available.
RELEVANCE Survey results
Demographics
Statistics with use of screening tools
What are the teachers recording in their screen-
ings? Over time have there have there been
changes in the assessment results? If yes, it is evi-
dence suggesting that the interventions are suc-
cessful. If no and the screening tools are held con-
stant, then it might mean that the interventions are
not producing the desired results.
COST Revenue sources and amount
Core funding x program
Contribution agreements totals
Where is the money coming from (i.e. potential
indicator of risk)? Is the money getting to where it
needs to go? Spending patterns may indicate po-
tential service inequity.
Monitoring and Measures
There must be utility to the measures, meaning that they are useful either to the funder or to
the institution;
They must be reasonably accessible to the monitor (Availability);
The value of the measure must be equal to the time and effort it takes to collect it;
A limited number of meaningful measures are more efficient and appropriate than many
measures that do not truly address the organization’s goals;
The measures must be clear and easily understood by clients, stakeholders and the public
and show how performance is being addressed (Understandability);
The measures are an accurate representation of what is being measured. The information
presented is timely and directly related to the subject matter (Validity);
The information is free from error, unbiased and complete. The results can be duplicated by
others using the same information and methodology (Reliability);
The data can be compared to past years or to similar organizations (Comparability)
Performance data should not stand on its own. Numbers need to be viewed in relation to some-
thing, like a standard, or a benchmark, or progression over time. It should indicate movement of
some sort - are things improving or regressing? Are the outputs commensurate with the amount of
energy expended and the cost of producing them? You need a plan to implement a perform-
ance measurement system.
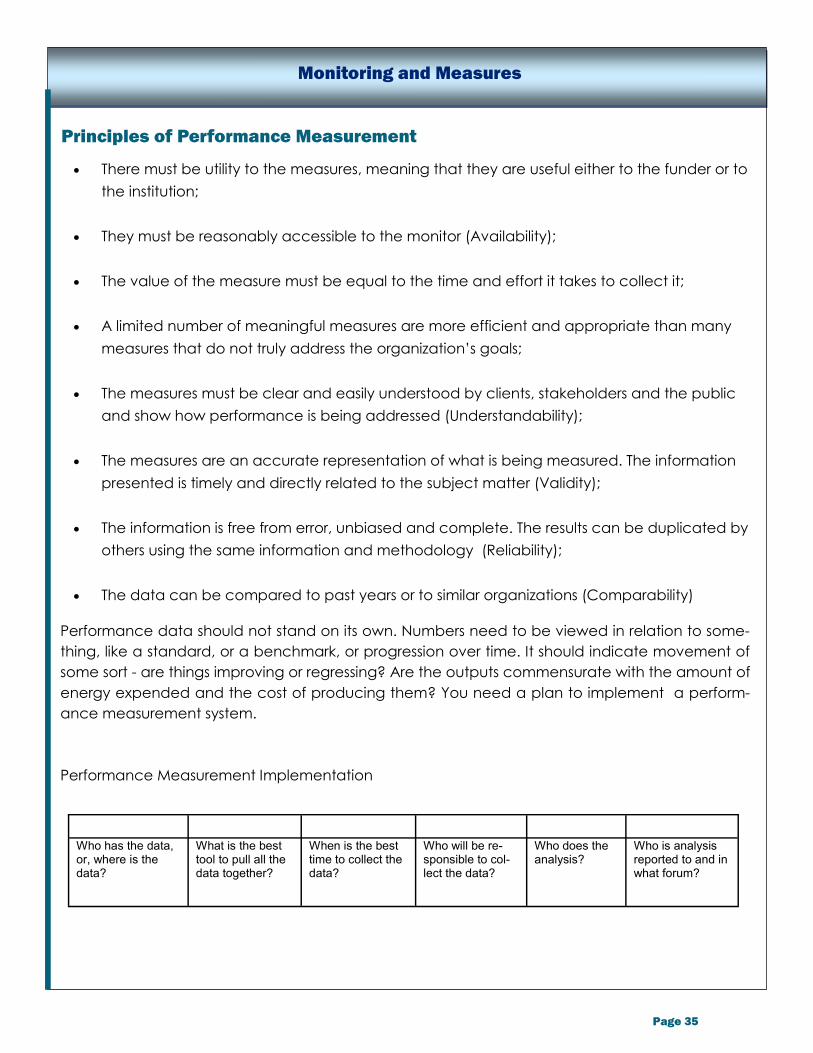
Performance Measurement Implementation
Principles of Performance Measurement
Page 35
Monitoring and Measures
Who has the data, or, where is the data?
What is the best tool to pull all the data together?
When is the best time to collect the data?
Who will be re-sponsible to col-lect the data?
Who does the analysis?
Who is analysis reported to and in what forum?

CAUSE AND EFFECT
The causal link between what your program produces and greater societal change will be dif-
ficult to establish. As time passes after the intervention, it’s effect may diminish and thus be-
come harder to show direct attribution. How many workshops have staff attended? One year
later can they still explain the major concepts? If they have applied the materials right away
and sustained the effort they probably can but if they have not used the material or looked at
it again they may not have good recall. The bigger the impact that the program aims for, the
harder it will be to prove that it was the change agent. If you work with children in grade 1,
you may have an impact during the time that you are working with them and right after-
wards. There may be lasting impacts throughout grade school. However, to claim that the
change sustains itself throughout high school and later in life is harder to prove. There are mul-
tiple variables at work which cannot all be factored into an evaluation or research study.
VISIBLE RESULTS VS. CHANGE
For a combination of political and administrative reasons, governments wish to demonstrate
visible results, clear signs that the government's activities are making a difference. The prob-
lem occurs with the time lag that occurs between program outputs and social outcomes. Be
sensible in what can be achieved by which timeframe.
EVALUATING BY GOAL ACHIEVEMENT
In the early days of program evaluation, a common approach was to evaluate by an assess-
ment of goal achievement. Fortunately, evaluation theory has come a long way so that man-
agers now have choices on how they evaluate programs. In the 1980’s managers were ad-
vised to write goals as “pie in the sky” ultimate achievements in the best of all worlds. We rec-
ommend that programs avoid this kind of goal statement. This writing style makes it look like
the managers are failing to achieve their goals and it has resulted in program overreach-
where the program is being assigned responsibility for what lays outside their jurisdiction or
mandate. If the manager wants a statement of what a perfect world should look like, (i.e. a
vision statement) they can write one. It will act as a touchstone for keeping the organization’s
“eyes on the prize”, but it won’t be tested. These statements are extremely expensive to test,
and it is almost impossible to show direct attribution back to the program. Goals should be
written with an end date in mind - say a 10 year horizon upon which time one would expect a
review of the program and a readjustment if necessary. Goals should also be specific, achiev-
able and reasonably measurable.
Inside Story Headline
Page 36
Monitoring and Measures

“Without big
data, you are
blind and deaf
and in the
middle of a
freeway.” –
Geoffrey Moore, author
and consultant
Page 37
Before data collection starts there are a few things that you can do to
make life easier:
Give thought to how data will be returned and in what form.
Make it easier for respondents (and yourself) by collecting numeri-
cal data on spreadsheets that have already been designed. This
way data sets from different respondents can be combined and
then maintained over the years.
Know before hand what kind of statistical manipulation you will
need to apply in order to answer the evaluation questions.
If you are asking a respondent qualitative type questions, consider
how that information will be recorded.
If hand written notes are taken they will have to be transcribed. If
more than one person is taking notes across multiple sites, all of
the data will have to be electronically transcribed so that it can
be cut and pasted together to compare each question.
If you are sending out your own survey, by post or email and you
are not using an online internet service such as Survey It or Survey
Monkey, you will have to build a database to house the data.
Data analysis generally follows the following steps:
1. Group
2. Describe
3. Interpret
As soon as the data starts to come in, start the collation right away.
Chances are that it will likely arrive in large volumes and handling the
data as it arrives will save some time later. It will give you the opportu-
nity to test your data collation instruments as well.
PHASE 4
DATA MANAGEMENT AND ANAYSIS

Step 1 Grouping and Organizing Data
You should
remember to
have back up
copies of
everything
before you
start playing
with the data.
Page 38
Collate the questions
Start grouping data by pulling together the larger items before drilling
into specifics. For example, in a mixed methods situation you may have
interviews, questionnaires and focus groups across multiple sites. Collect
the data from the different instruments and keep them separate. You
might need to know that a particular kind of response comes from either
the questionnaire or the interview or the focus group.
Each item on each instrument has to be grouped together i.e. all ques-
tion # 1s together, all questions #2, etc.
Code the data
Have the coding sheets developed before your instrument goes out.
They may have to be tweaked but at least you have a head start. Cod-
ing sheets are used assign a theme to open ended statements or to col-
lect all of the numerical values into one place. These are easy - they are
simply a way to get all of the information on to one page so that you can
look at it. Take a copy of your questionnaire, make a master sheet that
looks like the questionnaire and for each question leave room to count
up all of the different responses for each question.
If you have an interview, you would do much of the same but you might
for instance look for key phrases or words that keep popping up in the
discussions.
As you are testing your tool, also test your coding sheet to see if it works.
One of the things that you should consider is to have one person do all of
the data entry on your coding sheets, then have another person do at
least a portion of the same data entry on another sheet (don't let them
see each others work) then compare what they wrote down. This will tell
you that there is agreement on where everything has been placed. If the
results are the same you can say that you have inter-rater reliability.
Data Management and Analysis
“The goal is to turn
data into
information, and
information into
insight.” – Carly
Fiorina, former
executive,
president, and chair
of Hewlett-Packard
Page 39
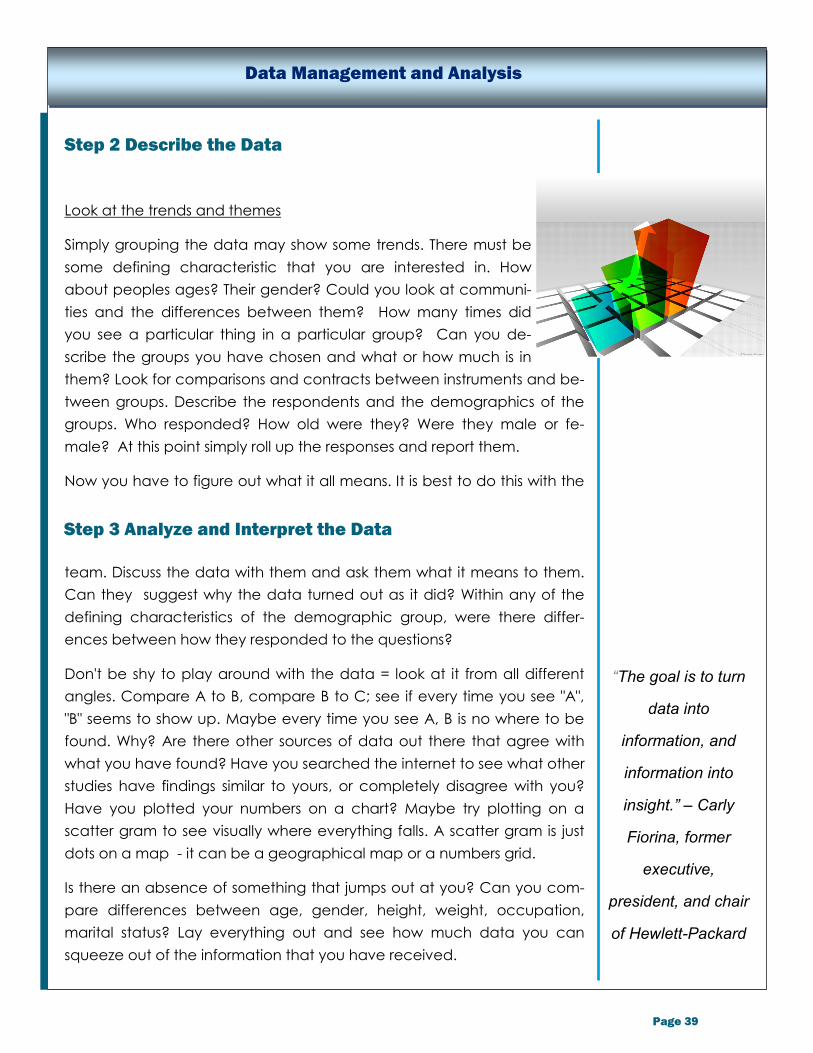
Look at the trends and themes
Simply grouping the data may show some trends. There must be
some defining characteristic that you are interested in. How
about peoples ages? Their gender? Could you look at communi-
ties and the differences between them? How many times did
you see a particular thing in a particular group? Can you de-
scribe the groups you have chosen and what or how much is in
them? Look for comparisons and contracts between instruments and be-
tween groups. Describe the respondents and the demographics of the
groups. Who responded? How old were they? Were they male or fe-
male? At this point simply roll up the responses and report them.
Now you have to figure out what it all means. It is best to do this with the
team. Discuss the data with them and ask them what it means to them.
Can they suggest why the data turned out as it did? Within any of the
defining characteristics of the demographic group, were there differ-
ences between how they responded to the questions?
Don't be shy to play around with the data = look at it from all different
angles. Compare A to B, compare B to C; see if every time you see "A",
"B" seems to show up. Maybe every time you see A, B is no where to be
found. Why? Are there other sources of data out there that agree with
what you have found? Have you searched the internet to see what other
studies have findings similar to yours, or completely disagree with you?
Have you plotted your numbers on a chart? Maybe try plotting on a
scatter gram to see visually where everything falls. A scatter gram is just
dots on a map - it can be a geographical map or a numbers grid.
Is there an absence of something that jumps out at you? Can you com-
pare differences between age, gender, height, weight, occupation,
marital status? Lay everything out and see how much data you can
squeeze out of the information that you have received.
Step 2 Describe the Data
Step 3 Analyze and Interpret the Data
Data Management and Analysis

Page 40
Interpreting Stories
With story telling, artwork or interviews, looking for themes can be done by using a highlighter on
a copy of your raw data sheet. Every time the person mentions a certain thing, or something re-
lated to that certain thing, the pictures have themes, use a highlighter on it. Blue might mean
one theme, yellow could be another theme and green yet another. You will need to have con-
sistent application and understanding between everyone as to what each theme is. Remember
have someone else verify your numbers and have the team in agreement as to what the num-
bers are telling you. If you have one pet theory, don't stick to it - it is entirely acceptable to give
the other person's interpretation in the report. As a matter of fact, it may give you more credibil-
ity.
Cause and Effect
This means that changes in X are directly caused by changes in Y. There may be an association
between them. Then we have correlation. Correlation is a statistical relationship between two
factors, where high scores on one factor tend to go with high scores on the other factor (positive
correlation) or that high scores on one factor go with low scores on the other factor (negative
correlation). If you want to prove that there was a correlation you have to do some statistical
work. The relationship between these two factors may be weak or strong, and just because you
see these two factors match up it does not means that one has caused the other. Get help from
a statistician, and ask them to help you with a Chi Square or with correlation co-efficient. Simply
seeing these factors together on a page does not mean that there is a true relationship . You
need to test it. HOWEVER! Correlation does not mean causation! This means that when you see
the two factors together, one does not always have an influence over the other. Down south,
cows will sometimes lie down before it rains. That does not mean that a cow lying down will bring
on the rain! Be careful how you interpret your findings!
Are My Findings Significant?
Your findings may be significant to you or your boss, or client, but saying that your results are sta-
tistically significant means something else. It means there is a low probability that the results of
the evaluation occurred by chance alone. In psychology it is conventional that results are said
to be significant if the probability of their occurrence by chance is equal to or less than 5 per
cent.
Data Management and Analysis

Page 41
Regression Threat
A regression threat (known also as a regression artifact or regression to the mean) is a statistical
phenomenon that occurs when ever you have a non-random sample from a population and
two measures that are imperfectly correlated. Say that your two measures are a pre-test and a
post-test. Most likely these won’t be perfectly correlated with each other. Furthermore, assume
that your sample shows really low pre-test scores. The regression threat means that the post-test
average for your group will appear to increase or improve even if you don't do anything to
them -- even if you never give them a treatment. Think about it as the “you can only go up from
here" phenomena. If you include in your program only the kids who constituted the lowest 10%
of the class on the pre -test, chances are that they will increase on the post-test because they
could not go any lower.
Unintended Impacts
There is a possibility of unintended impacts where the background research has not been done
before a program is up and running. In your role as a manager you must keep your eyes open
for things that may happen that you did not anticipate. Some may have no impact on the pro-
gram, some may be good, and some may be serious.
Stretching Research Findings
Sometimes a researcher is tempted to exaggerate the importance of the findings, regardless of
whether there is data or evidence to support it. This is done both intentionally and un-
intentionally and for any number of reasons. This could even be the result of a small sample size
being generalized or exaggerated to a general population.
There can be dishonesty in the way some people chose to interpret and present their findings
too. Depending on the types of statistics they use or the graph that they choose to present their
findings on, it’s possible to distort the data. You will get the most meaningful results if you inter-
pret your data fairly and present what the data is actually suggesting rather than what you
think others want to see.
Data Management and Analysis

Page 42
Step 4 Present the Data
Data can be expressed in a number of different ways. How you lay out your data will help you
to interpret it correctly. You can try different forms of graphs, charts, or tables to help you see
clearly. Examples follow:
Cross tabs
Cross tabs can generate many interesting questions and can show data is a clear and concise
way. It is easy to see difference between groups and can lead to further statistical applications.
A typical cross tab looks like the following.
There are also ways to do visual comparisons that can help people understand the scope, size
or direction of the data you are trying to present. For example a scale drawing.
Thanks to Colin Douglas Howell on work adapted from illustrations and scale diagrams by Ar-
thur Weasley, Steveoc 86, Dropzink, and Piotr Jaworski.
Television Watching Preference
Male Female TOTAL
Hockey 50 30 80
Football 60 10 70
Oprah 12 62 74
Days of Our Lives 5 50 55
Bugs and Tweety 9 8 17
Vikings 22 26 48
Wrestling 42 12 54
CBC News 66 62 128
Duck Dynasty 44 50 94
total 310 310 620
Data Management and Analysis

Graphics created by Arthur Beltran, Houston Texas.
Page 43
Graphs
If you have data that needs to be presented it can be done in many ways with graphs, but if
you are going for visual impact, consider that the two pictures below represent the same
thing. Which would hold your interest?
Data Management and Analysis

Step 5 Making the Judgment and Recommendations
There is a major difference between a program evaluation and a research study. In program
evaluation the author will be called upon to make a judgement on the program and is ex-
pected to have collected enough robust evidence to be able to make recommendations.
There must be a point to the evaluation— not just straight reporting of numbers, cost and opin-
ions. These judgement calls are based on the evidence that is collected in relation to the
evaluation questions and the summary of what all of the responses to the questions indicate as
a whole. If you have taken the time to return to the evaluative criteria, you can go back to
your team and ask the group to make the evaluative judgement. It does not have to be a puni-
tive or long exercise. It can be set up with the criteria on one side of a table and the judgement
indicated by a check mark into categories as such;
Please note that some explanation will be required as a reader may wish explanation of why a
particular rating was given.
This format is not the only way to impart judgement but it may be useful for complex programs
with many questions.
Page 44
Criteria Criteria not
met
Criteria met Program exceeded
expectations
80% of the clients approve of
this service
70% of all cases were seen
within 1 week of initial intake
Expenditures were kept within
budget
Data Management and Analysis

Page 45
Analysis
Description + Interpretation + Judgment = Recommendations
Recommendations should follow through from the findings - the reader should be able to see
the body of evidence for each recommendation. Before writing the recommendations it is wise
to have them in draft and discuss them with the evaluation team, because some of the solutions
that you may propose may already have been considered or attempted. If this is the case this
information might be appropriate for the report. An outside party may read the report and won-
der why certain strategies had not been attempted so it is best to keep the reader informed.
Rejecting or ignoring findings
Sometimes we want to believe in something so badly that we overlook the scientific evidence
in favour of less rigorous evidence. You must beware that in your own evaluation study you will
find evidence to support what you want to see and not what actually "is". This is a problem in all
fields of study as the sidebar story will indicate. If you find something troublesome report it.
Please reference the problem. Other people in other programs are counting on you to help
them to NOT make the same mistakes!
Four stages of acceptance:
i) this is worthless nonsense;
ii) this is an interesting, but perverse, point of view;
iii) this is true, but quite unimportant;
iv) I always said so.
(J.B.S. Haldane, Journal of Genetics #58, 1963,p.464)
Data Management and Analysis
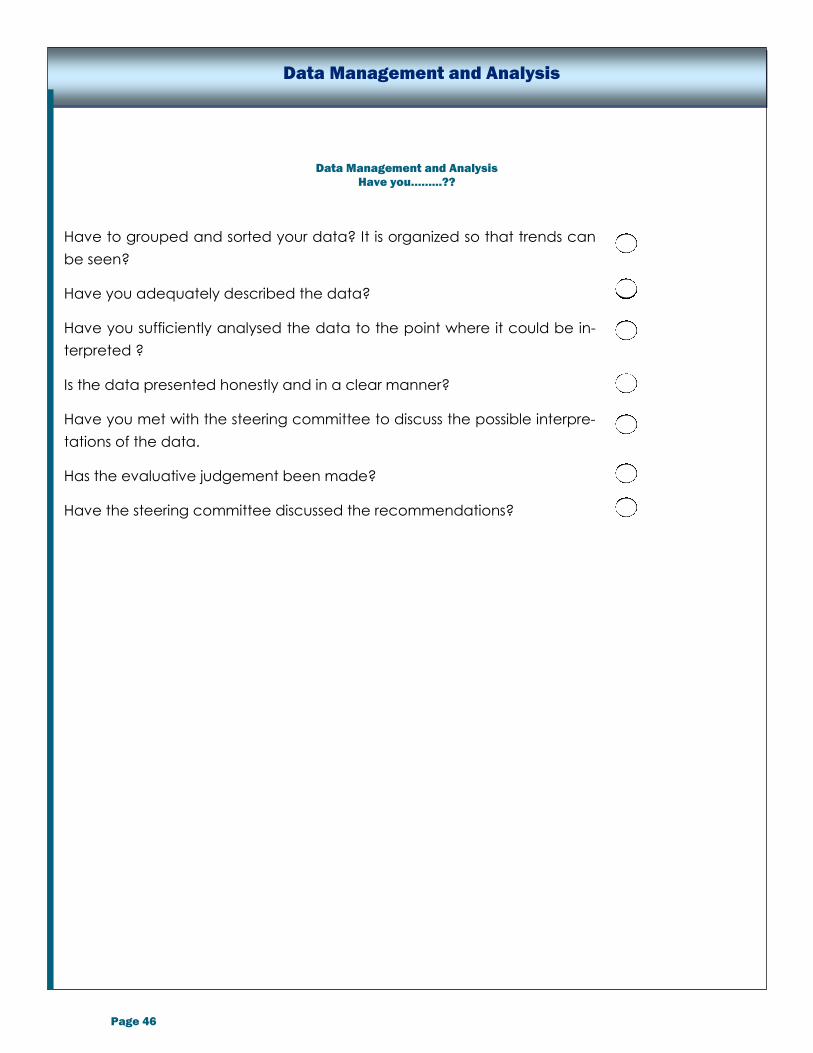
Have to grouped and sorted your data? It is organized so that trends can
be seen?
Have you adequately described the data?
Have you sufficiently analysed the data to the point where it could be in-
terpreted ?
Is the data presented honestly and in a clear manner?
Have you met with the steering committee to discuss the possible interpre-
tations of the data.
Has the evaluative judgement been made?
Have the steering committee discussed the recommendations?
Page 46
Data Management and Analysis
Data Management and Analysis
Have you……...??

Steps:
1. Draft the evaluation report
2. Decide your communication strategy
3. Adjust the program
4. Debrief with the evaluation team
Using the outline provided, begin the drafting of your report. Once you have it, be prepared for
changes.
We are assuming that you have discussed your data with the team and that everyone has had
a chance to comment on the interpretation of the findings. Never spring bad results on anyone.
If they have been involved in a meaningful way they should have some idea of what is going to
be said as a result of the data. You need to get consensus on the report. If you have a point that
cannot be agreed upon or has a reasonable alternate explanation for the findings, to be fair,
you must report this. It truly will make for a stronger presentation.
Page 47
The introduction should be brief and describe the program (its goals, how long it has been run-
ning, number of staff, etc), the reason (s) for the evaluation, stakeholders, clients, and other im-
portant background.
Introduction
SAMPLE REPORT
OUTLINE
Introduction
Executive
Summary
Design
Results and
Analysis
Recommendations
Conclusions
Phase 5
REPORTING AND DEBRIEFING
Step 1 Draft the Evaluation Report

Describe the data collected. Explain how you arranged your data, and what it is telling you. It
helps to keep information clear if it is presented in tables, charts or graphs. Then explain under
each, what it is telling you. Please note that this is not always possible, it depends on how you
collected your information.
The Results and Analysis
The Design - Methodology
This section should tell the reader exactly how the evaluation was done, so that if someone else
wanted to copy it, they could, with your instructions. Tell us how the evaluator collected the in-
formation. Describe the methods or tools that you used, how people were chosen to partici-
pate, and who, how and when the information was collected. THIS IS A VERY IMPORTANT SEC-
TION!
Page 48
The summary should: list the evaluation questions, present the most important findings (two or
three sentences each); and state the methods used to get the answers. It is easier to write this
section last.
Executive Summary
Reporting and Debriefing
Recommendations
Recommendations take the conclusions to the next step and asks the questions - what can we
do about it??? How can we make things better? Everything that you recommend should be
able to be traced back to your analysis. Consider some options; sometimes it is difficult to see
that there may be options. In fact, there may be options available to you that you don't want
to take - such as closing a program. We would urge you to look at the consequences of all of
the options. Don't parachute recommendations! Every now and then you will read a report and
out of nowhere comes a recommendation. There is no evidence to back it up, no previous dis-
cussion on it, it just appears as if magic. We call this parachuting. You have to build the case
for what you are recommending.

You and your team must look at all of the data. You must agree on how the analysis was
done, and try to reach agreement on what the analysis reveals. Ask what the findings mean for
the program. Ask your team - "Why did we find what we found??? What does this mean to the
program?"
BE CLEAR ON
THE MESSAGE!
Page 49
Conclusions
Step 2 Build Communications Strategy
Good communication helps to relieve people's fears. Remember that when there is poor com-
munication, rumours start, so you have to be open about what you are doing. You should have
a communications plan. Consider the best way to keep people informed as you go along.
Make sure everybody is clear on what the findings and recommendations are, and exactly
what it is that you want the public to know.
Once you have discussed your preliminary findings with your partners, don't go away and de-
velop an entirely different set of recommendations. Never spring them on anyone!
A very wise person once said that "Evaluation results are not like birthday presents. Nobody likes
to be surprised." By the time your results are ready to be released, everyone concerned should
have had the chance to review the data and make comments on the draft report.
Reporting and Debriefing

Considerations for Communications Strategy
Who gets the findings first?
Tailor-make your presentation to your audience.
Make findings interesting.
Report major finding first, minor ones second.
Don't attack or lay blame.
Give credit to the people who helped you.
Look critically at the report.
Do the results look too good to be true?
Is the report in plain language?
Is translation needed?
Page 50
Step 3 Adjust the Program
The evaluation doesn't end with the reporting of the results. You need to act upon them. The
evaluation can help you do several things: improve your program; help others learn from your
experience; and tell funders/government what happened with the program money.
Improvements
You will have learned why things worked well or did not. You can then use this information to
make changes to the program or service in the future. You may want to change the focus,
change the target group, or expand a very successful program. The important thing is to take
what you have found, and do something with the information. Make sure that this is shared with
the community and your clients.
Learning
Your evaluation could also help others in the community, or help other
communities to develop programs and services that you have found to
be successful. Your information could save others from some trial and
error, especially if you kept a good record of what you did, and the de-
cisions you made along the way.
Reporting and Debriefing
Who needs the
report?
Your stakeholders
Your clients
Community groups
Funding bodies
The public
Community leaders
Colleagues in other
jurisdictions?
Legislators?

Page 51
Step 4 Debriefing the Evaluation
The final phase of the evaluation project needs to happen before the steering committee drifts
apart. A review of the evaluation process helps point out what could be improved for the next
time. Look back at how relationships between the parties involved worked, it may show how the
evaluation plans unfolded. How will you rate the quality of the evaluation? American Joint
Committee for Standards for Educational Evaluation (AJCSEE) have increasingly been used by
the professional evaluation associations, including the American and Canadian Evaluation Asso-
ciations. The standards should be reviewed before undertaking an evaluation as they can be
used both as a guide for managing the evaluation process and to assess an existing evaluation.
The standards have been adopted by the GNWT (our own standards are below) and the AJCSEE
technical standards include:
Utility criterion are intended to increase the extent to which program stakeholders find
evaluation processes and products valuable in meeting their needs.
Feasibility criteria are intended to increase evaluation effectiveness and efficiency.
Propriety standards support what is proper, fair, legal, right and just in evaluations.
Accuracy standards increase the dependability and truthfulness of evaluation representa-
tions, propositions, and findings, especially those that support interpretations and judg-
ments about quality.
Communication and Reporting criterion will ensure that evaluation communications have
adequate scope and guard against misconceptions, biases, distortions, and errors.
1.0 Evaluation Planning
Standard
The department must apply the discipline of evaluation to assess the performance of its policies,
programs and initiatives, both departmental and inter-organizational.
Guidance
the evaluation committee should develop an evaluation plan that is based on assessment
of risk, departmental priorities, reporting requirements, and priorities of the government as a
whole
the full range of evaluation issues should be considered at the planning stage of an evalua-
tion (such as timing, resources, scope, confidentiality etc)
the relevance of any policy, program or initiative should be considered during its evalua-
tion - i.e. is it consistent with priorities, does it address an actual need, is it relevant to the
people that it is trying to serve .
Reporting and Debriefing
Page 52
the evaluation should attempt to determine if the policy, program or initiative is effective in
meeting its objectives, and within budget and
the evaluation should attempt to determine if the most appropriate means are be-
ing used to achieve the program goals.
2.0 Competency
Standard
The person or persons carrying out evaluations, or evaluation related work, must possess or col-
lectively possess the knowledge and competence necessary to fulfil the requirements of the
particular evaluation work.
Guidance
1. Evaluators should possess or ensure the provision of knowledge appropriate for the evalua-
tion and continuously strive to improve their methodological and practice skills.
1. In order to develop valid, credible and unbiased conclusions and recommendations,
evaluators should possess knowledge, skills and experience in:
the application of sound research design that enable them to answer the questions
the collection and analysis of reliable quantitative and qualitative data and
the ability to make judgements on the data.
3.0 Objectivity and Integrity
Standard
Individuals performing evaluation work must be free from impairments that hinder their objectiv-
ity and must act with integrity in their relationships with all stakeholders.
Guidance
Evaluators should:
1. accurately represent their level of skills and knowledge and declare any matter that could
compromise their objectivity before embarking on an evaluation project or at any point
during the project.
2. Evaluators should be accountable for their performance and their products and for:
ensuring that their work addresses the priority concerns and accountability require-
ments of departmental management and the government has conferred with stake-
holders on decisions such as confidentiality, privacy, communications and ownership of
findings and reports
Reporting and Debriefing
Page 53
ensuring sound fiscal decision-making so that expenditures are accounted for and cli-
ents receive good value for their dollars and
completing the evaluation work within a reasonable time as agreed to with the clients.
4.0 Consultation and Advice
Standard
Evaluation work must incorporate sufficient and appropriate consultation and, where appropri-
ate, apply the advice and guidance of specialists and other knowledgeable persons.
Guidance
1. Evaluators should consult major stakeholders when conducting their work
2. Where appropriate, peer review groups should be organised to review evaluation products
to improve their quality and enhance the sharing of best practices
5.0 Measurement and Analysis
Standard
Evaluation work must produce timely, pertinent and credible findings and conclusions that man-
agers and other stakeholders can use with confidence, based on practical, cost-effective and
objective data collection and analysis.
Guidance
1. Evaluation products should be made available at the most appropriate time to aid man-
agement decision-making
2. Evaluation findings should be relevant to the issues addressed and flow from the evidence
3. Evaluation products should be useful to managers in improving performance and reporting
on results achieved.
Reporting and Debriefing

Page 54
6.0 Reporting
Standard
Evaluation reports must present the findings, conclusions and recommendations in a clear and
objective manner. Guidance
Evaluation reports should be written so that senior managers and external readers can under-
stand the issues being reported. They should:
be concise and clearly written
include information that is needed for a proper understanding of the findings, conclusions
and recommendations
present the conclusions and recommendations so that they flow logically from evaluation
findings
clearly expose the limits of the evaluation in terms of scope, methods and conclusions
provide the reader with appropriate context by describing the purpose and timing of the
work, the policy, program or initiative that was evaluated, how it fits into the overall opera-
tions of the organisation
provide an accurate assessment of the results that have been achieved by the policy, pro-
gram or initiative
provide relevant analysis and explanation of any significant problems and contain clear
and actionable recommendations
In view of transparency, once client confidentiality is protected, the report should be made
available to program staff and partners and available for pub-
lic discussion, unless the Minister chooses to withhold it.
Reporting and Debriefing
At least try to make the
report attractive, concise
and visually interesting!

Reporting and Debriefing
Have you……...??
Reporting and Debriefing
1. Did you seek approval on the outline of the evaluation report?
2. Have you achieved consensus on the evaluative judgement?
3. Are the alternative explanations that would explain your findings?
4. Is your steering committee aware of the findings so far?
5. Have you drafted the evaluation report?
6. Is the communication strategy approved?
7. Is there agreement on the adjustments to the program?
8. Have you debriefed with the evaluation team?
9. Have you reviewed your performance against the evaluation standards?
Page 55