governor mary fallin, - pikepass: faster. safer. easier 2nd qtr bhr.pdf · 3500 martin luther king...
TRANSCRIPT

Governor Mary Fallin, Member Ex-Officio
Dana Weber, Chairwoman
David A. Burrage Vice-Chairman
G. Carl Gibson, Secretary & Treasurer
Kenneth Adams, Member
Guy Berry, Member
Gene Love, Member
Mike Patterson, Secretary of Transportation
Oklahoma Turnpike Authority Report to Bondholders Second Quarter 2017
Tim J. Gatz Executive Director
Prepared by the Controller Division

3500 Martin Luther King Ave. •P.O. Box 11357 •Oklahoma City, OK 73136-0357 • 405/425-3600 • Fax: 405/427-8246 • www.pikepass.com Dear Oklahoma Turnpike Authority Bondholders: With the System-wide toll increase that became effective March 1, 2017, net toll revenues for the second quarter of 2017 reported at $78.7 million, an increase of 16.1% when compared to the same period last year. This toll increase was approved at the Authority meeting held on December 6, 2016 for the purpose of funding the Driving Forward program. Year-to-date net toll revenues exceeded budgeted projections by 0.5%. Overall, toll transactions for the second quarter were approximately 47.6 million, consistent with the prior year. Passenger traffic on the Turnpike System remained consistent with the previous year. Heavy truck traffic increased 6.1% over the same period last year. Net toll revenue attributable to the interoperable agreements with the North Texas Tollway Authority and the Kansas Turnpike Authority was approximately 3.2% for the second quarter. Year-to-date revenue fund operating expenses reported at $40.1 million, operating at 8.8% under the annualized 2017 operating budget. Senior and total debt service ratios remain in compliance with the minimum trust requirements. Total debt service coverage exceeds minimum trust requirements on a rolling twelve-month basis by approximately 37%. Chart 1: Two-Year Comparison of Toll Revenues Chart 2: 2017 Revenues - Actual vs. Projections (Cumulative)
$0
$50
$100
$150
$200
$250
$300
Jan
Feb
Mar Ap
r
May Jun Jul
Aug
Sep
Oct
Nov De
c
Millions
2017 2017 Projections
$0
$5
$10
$15
$20
$25
$30
Jan
Feb
Mar Ap
r
May Jun Jul
Aug
Sep
Oct
Nov De
c
Millions
2016 2017 2017 Projections

Report to Bondholders - Quarter ending June 30, 2017 – Page II
Chart 3: 2017 Operating Expenses – Budget vs. Actual Revenue Fund Only (cumulative)
Chart 4: Operating Expenses by Division-All Funds For the Six Months Ended June 30, 2017
Second Quarter Highlights:
• The Driving Forward program continues to progress with ten projects in design and four in construction.
The Engineering Division successfully negotiated three professional service contracts for the design of the Gilcrease Turnpike, the right-of-way acquisition for the Gilcrease Turnpike and the design for the widening of Sara Road near the John Kilpatrick Turnpike extension. Driving Forward projects to widen the Turner Turnpike from mile post 202.2-218 were awarded.
• The Engineering Division awarded a Capital Plan project to reconstruct maintenance facilities at Fletcher
and Walters on the H.E. Bailey Turnpike. The Division declared an emergency bridge repair on the Turner Turnpike in order to expedite the repair process. The Construction Division processed seven supplemental agreements for on-going construction projects. In addition, the Engineering Division currently has multiple active design projects and construction projects.
• During the second quarter, the Controller Division staff finalized the preparation of the 2016
Comprehensive Annual Financial Report (CAFR) and distributed the report in compliance with the trust-required deadlines. This 2016 CAFR was submitted to the Government Finance Officers Association of the United States and Canada (GFOA) to apply for the Certificate of Achievement Award for Excellence in Financial Reporting. A member of the Controller Division management staff attended the annual conference of the GFOA in May. The GFOA conference offers the most current education and information on the latest issues and financial reporting requirements affecting state and local governments. Staff also prepared for upcoming changes in the interoperability reconciliation process.
• The Toll Operations Division completed the tag file download testing for the central hub interoperability
project. The toll equipment installation at the Coweta Toll Plaza on the Muskogee Turnpike was completed, and testing is in process. The Infinity phase II in-lane testing at the Newcastle toll plaza on the H.E. Bailey Turnpike and regression testing at the Santa Fe toll plaza on the John Kilpatrick Turnpike were completed. The Infinity phase II installation and testing at the US177 lane 1 location on the Cimarron Turnpike was completed, as well as the Infinity phase III lab testing.
• In the second quarter, the Maintenance Division, supplementing labor through supervised inmates and contractors, completed various System repairs. With combined efforts, approximately 760,000 linear feet of joints and cracks were sealed, and 30,000 square yards of drainage repairs were completed. The Maintenance Division also performed brush and weed control and maintained approximately 18,000 acres of vegetation management.
010,000,00020,000,00030,000,00040,000,00050,000,00060,000,00070,000,00080,000,00090,000,000
Jan Feb Mar AprMay Jun Jul Aug Sep Oct NovDec
Budget Actual Administrative Services $907,563
1.8%Toll &
PIKEPASS Operations
$18,190,215 36.9%
Other $5,171,653
10.5%Highway
Patrol $9,349,398
19.0%
Information Technology $2,776,602
5.6%
Engineering & Maintenance $12,896,862
26.2%
Report to Bondholders - Quarter ending June 30, 2017 – Page III
• As of June 30, 2017, the total number of active PIKEPASS tags exceeded 1.7 million, an increase of
1.5% when compared to the same time last year. PIKEPASS patrons continued to take advantage of the PIKEPASS volume discount program with approximately $1.3 million in discounts issued to frequent patrons of the System during the second quarter of 2017.
• The OHP troopers continued their efforts to achieve safe patron travel through several enforcement
programs. In the second quarter of 2017, OHP troopers made approximately 35,000 violator contacts and assisted over 5,000 motorists.
Respectfully, Dana S. Weber Chairwoman of the Authority Tim J. Gatz Executive Director of the Authority
Report to Bondholders - Quarter ending June 30, 2017 - Page IV
OKLAHOMA TURNPIKE AUTHORITY
TABLE OF CONTENTS
June 30, 2017
Schedule Page
Statements of Net Position 1
Schedule of Deposits and Withdrawals 2
Statements of Revenues, Expenses and Changes in Net Position 3
Statement of Revenues - Total All Turnpikes 4
Statement of Revenues - Turner Turnpike 5
Statement of Revenues - Will Rogers Turnpike 6
Statement of Revenues - H. E. Bailey Turnpike 7
Statement of Revenues - Muskogee Turnpike 8
Statement of Revenues - Indian Nation Turnpike 9
Statement of Revenues - Cimarron Turnpike 10
Statement of Revenues - John Kilpatrick Turnpike 11
Statement of Revenues - Cherokee Turnpike 12
Statement of Revenues - Chickasaw Turnpike 13
Statement of Revenues - Creek Turnpike 14
Schedule of Cash, Cash Equivalents and Investments 15
Schedule of Bonds Issued, Retired, Defeased and Outstanding 18
Schedule of Sales of Surplus Property 18
Prepared by the Controller Division

Report to Bondholders - Quarter ending June 30, 2017 - Page 1
***PRELIMINARY AND UNAUDITED***
Oklahoma Turnpike Authority
Statements of Net Position
June 30, 2017 and 2016
2017 2016
Assets:Current assets: Cash and cash equivalents-unrestricted 64,447,409 27,707,964 Investments-unrestricted 12,004,840 28,052,861 Cash and cash equivalents - restricted 434,514,915 70,895,743 Investments-restricted 59,037,275 75,862,135 Accounts receivable 10,570,983 12,163,020 Accrued interest receivable-unrestricted 46,875 72,479 Accrued interest receivable-restricted 197,605 1,699,237 Tag inventory 4,529,161 4,088,101 Materials inventory 5,379,030 5,067,061 Prepaid expenses 53,916 52,248
Total current assets 590,782,009 225,660,849
Noncurrent assets:
Cash and cash equivalents - restricted 41,685,704 24,169,116
Investments-restricted 117,593,611 122,213,222Total noncurrent cash, cash equivalents and investments 159,279,315 146,382,338
Capital assets:
Depreciable, net 905,769,710 944,944,839
Land 193,403,638 163,091,548
Construction work in progress 216,324,473 90,381,060
Net capital assets 1,315,497,821 1,198,417,447
Revenue bond issuance costs, net of accumulated amortization of
$88,125 in 2016 - 53,361
Total noncurrent assets 1,474,777,136 1,344,853,146
Total assets 2,065,559,145 1,570,513,995
Deferred Outflows of Resources:
Unamortized net deferred debit on refunding 52,601,940 58,483,033
Accumulated change in fair value of hedging derivative 44,922,487 67,584,270
Related to pensions 11,274,058 4,972,653
Total deferred outflows of resources 108,798,485 131,039,956
Liabilities:
Current liabilities:
Accounts payable and accrued expenses 5,800,998 8,633,803
Payable from restricted assets:
Accounts payable and accrued expenses payable 240,868 119,078
Accrued interest payable 21,499,688 14,888,657
Unearned revenue 31,310,623 27,887,198
Arbitrage rebate payable to U.S. Treasury - 241,834
Current notes payable and long-term debt 69,924,991 77,254,991
Total current liabilities 128,777,168 129,025,561
Noncurrent liabilities:
Accounts payable and accrued expenses 1,542,813 1,391,461
Net pension liability 10,876,456 4,001,576
Long-term debt, net of unamortized net premiums of
$76,055,448 and $57,331,722 in 2017 and 2016, respectively 1,300,410,457 881,171,731
Payable to Department of Transportation 53,475,977 53,123,196
Derivative instrument liability 44,922,487 67,584,270
Total noncurrent liabilities 1,411,228,190 1,007,272,234
Total liabilities 1,540,005,358 1,136,297,795
Deferred Inflows of Resources:
Related to pensions 4,030,068 5,806,543
Total deferred inflows of resources 4,030,068 5,806,543
Net Position:
Invested in capital assets, net of related debt 356,898,068 311,569,794
Restricted for debt service 125,857,135 109,887,115
Restricted for reserve maintenance 54,852,861 76,990,880
Unrestricted 92,714,140 61,001,824
Total net position 630,322,204$ 559,449,613$

Report to Bondholders - Quarter ending June 30, 2017 - Page 2
Oklahoma Turnpike Authority
Schedule of Deposits and Withdrawals
For the Quarter Ending June 30, 2017
Beginning Ending
Account Book Receipts Withdrawals Book
Balance or Deposits or Payments Balance
2006 Variable Rate Debt service accounts 3,678,716$ 13,977,847 11,328,546 6,328,017$
2007 Debt service accounts 936,765 936,798 1,873,563 -
2011 Debt service accounts 15,940,894 31,881,788 15,940,894 31,881,788
2017 Debt service accounts 2,580,735 15,176,321 7,590,987 10,166,069
Revenue Bond Reserve account 112,237,810 1,732,133 107,319 113,862,624
Revenue fund 32,381,356 290,361,410 300,971,653 21,771,113
Reserve Maintenance fund 42,614,687 35,069,337 22,775,631 54,908,393
General fund 40,273,298 60,800,575 46,392,737 54,681,136
Motor Fuel Tax Trust fund 45,289,565 18,545,180 18,418,054 45,416,691
2017 Construction fund 389,740,641 36,964,564 74,512,163 352,193,042
PIKEPASS account 34,410,758 56,905,344 53,241,221 38,074,881
Total 720,085,225$ 729,283,754$
Cash & Cash Equivalents-unrestricted 64,447,409$
Investments-unrestricted 12,004,840
Cash & Cash Equivalents-restricted 476,200,619
Investments-restricted 176,630,886
Total 729,283,754$

Report to Bondholders - Quarter ending June 30, 2017 - Page 3
***PRELIMINARY AND UNAUDITED***
Oklahoma Turnpike Authority
Statements of Revenues, Expenses and Changes in Net Position
For the Quarters Ended and Year to Date June 30, 2017 and 2016
2017 2016 2017 2016
Current Current Year Year
Quarter Quarter to Date to Date
Operating revenues:
Tolls 78,733,898$ 67,804,521$ 145,119,151$ 131,197,291$
Concessions 442,602 709,985 1,504,378 1,582,241
Total operating revenues 79,176,500 68,514,506 146,623,529 132,779,532
Operating expenses:
Toll Operations 4,953,516 4,612,175 9,673,371 9,111,235
Turnpike Maintenance 5,953,547 5,503,848 10,957,614 10,952,730
Engineering 1,120,635 719,439 1,720,713 1,731,350
Construction 117,643 - 218,535 -
Highway Patrol 5,741,653 6,999,928 9,349,398 10,461,581
PIKEPASS Customer Service 4,560,830 3,697,144 8,516,844 7,241,499
Administrative Services 411,845 393,104 907,563 910,056
Information Technology 1,572,410 1,245,894 2,776,602 2,773,965
Controller 325,797 319,669 631,108 574,096
Finance and Revenue 306,130 555,049 2,670,128 753,183
Executive 998,937 998,583 1,869,947 1,814,913
Authority 374 1,224 470 2,129
Total operating expenses before
depreciation and amortization 26,063,317 25,046,057 49,292,293 46,326,737
Operating income before depreciation and amortization 53,113,183 43,468,449 97,331,236 86,452,795
Depreciation and amortization (21,644,815) (22,098,225) (43,043,750) (44,233,968)
Operating income 31,468,368 21,370,224 54,287,486 42,218,827
Non-operating revenues (expenses):
Interest earned on investments 1,359,434 1,099,313 2,457,001 2,184,012
Net increase (decrease) in fair value of investments 444,630 579,133 1,186,018 1,751,276
Interest expense on revenue bonds outstanding (8,769,658) (9,602,407) (18,229,026) (19,820,991)
Other revenues 1,384,676 1,060,627 2,598,103 2,190,890
Net non-operating expenses (5,580,918) (6,863,334) (11,987,904) (13,694,813)
Change in net position 25,887,450 14,506,890 42,299,582 28,524,014
Total net position, beginning of the quarter 604,434,754 544,942,723 588,022,622 530,925,599
Total net position, end of the quarter 630,322,204$ 559,449,613$ 630,322,204$ 559,449,613$
Other relevant data:
Motor fuel tax received 11,324,002$ 11,380,063$ 22,540,082$ 22,330,676$
Reserve maintenance deposits made 11,115,587 12,000,000 20,670,000 24,000,000
Debt interest deposits (net of interest 15,220,411 10,016,268 26,374,081 19,880,840
earned on debt service accounts)
Debt principal deposits (net of interest 13,977,104 14,125,809 26,966,034 28,251,548
earned on debt service accounts)
Required
Coverage Ratio
Actual Coverage
Ratio
Actual Coverage
Ratio
Senior Debt Service Coverage Ratio 120% 248% 247%
Total Debt Service Coverage Ratio 100% 137% 129%

Report to Bondholders - Quarter ending June 30, 2017 - Page 4
STATEMENT OF REVENUES
CURRENT QUARTER AND SAME QUARTER PRIOR YEAR
TOTAL ALL TURNPIKES
Vehicle Number
Miles of
Class of Vehicle Revenue Traveled Transactions
Quarter ended June 2017
Two Axle Vehicles $ 50,136,013 766,093,286 43,530,617
Three Axle Vehicles 1,735,028 20,488,478 748,402
Four Axle Vehicles 1,784,175 14,439,825 434,893
Five Axle Vehicles 24,269,476 122,327,418 2,765,136
Six Axles Vehicles 809,206 3,379,469 82,462
Total $ 78,733,898 926,728,476 47,561,510
Concession Revenue 442,602
Total Revenue $ 79,176,500
% Increase from prior year quarter 15.56%
Quarter ended June 2016
Two Axle Vehicles $ 43,199,825 764,917,281 43,668,619
Three Axle Vehicles 1,516,705 20,820,245 770,926
Four Axle Vehicles 1,622,984 15,198,677 453,141
Five Axle Vehicles 20,800,253 118,433,218 2,611,097
Six Axles Vehicles 664,754 3,125,957 73,414
Total $ 67,804,521 922,495,378 47,577,197
Concession Revenue 709,985
Total Revenue $ 68,514,506
$0
$6,000,000
$12,000,000
$18,000,000
$24,000,000
Jan Feb Mar Apr May Jun Jul Aug Sep Oct Nov Dec
TOTAL REVENUE BY MONTHALL TURNPIKES
2016
2017

Report to Bondholders - Quarter ending June 30, 2017 - Page 5
STATEMENT OF REVENUES
CURRENT QUARTER AND SAME QUARTER PRIOR YEAR
TURNER TURNPIKE
Vehicle Number
Miles of
Class of Vehicle Revenue Traveled Transactions
Quarter ended June 2017
Two Axle Vehicles $ 9,793,186 197,207,564 4,337,299
Three Axle Vehicles 471,460 5,943,480 97,858
Four Axle Vehicles 463,970 3,890,336 60,454
Five Axle Vehicles 7,937,154 38,930,553 507,905
Six Axles Vehicles 305,146 1,256,692 16,889
Total $ 18,970,916 247,228,625 5,020,405
Concession Revenue 85,729
Total Revenue $ 19,056,645
% Increase from prior year quarter 15.75%
Quarter ended June 2016
Two Axle Vehicles $ 8,461,663 195,337,084 4,329,520
Three Axle Vehicles 416,485 5,992,916 98,764
Four Axle Vehicles 419,017 4,098,584 61,211
Five Axle Vehicles 6,802,391 37,732,284 489,470
Six Axles Vehicles 275,022 1,278,651 16,460
Total $ 16,374,578 244,439,519 4,995,425
Concession Revenue 88,493
Total Revenue $ 16,463,071
$0
$1,750,000
$3,500,000
$5,250,000
$7,000,000
Jan Feb Mar Apr May Jun Jul Aug Sep Oct Nov Dec
TOTAL REVENUE BY MONTHTURNER TURNPIKE
2016
2017
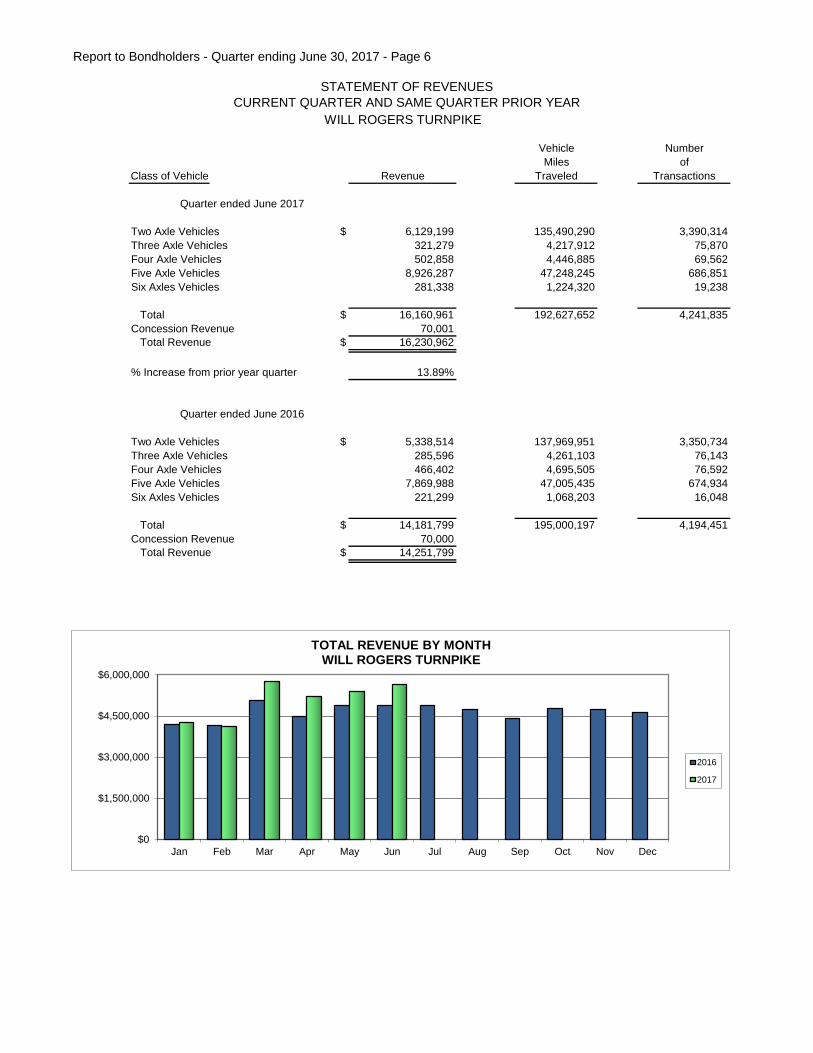
Report to Bondholders - Quarter ending June 30, 2017 - Page 6
STATEMENT OF REVENUES
CURRENT QUARTER AND SAME QUARTER PRIOR YEAR
WILL ROGERS TURNPIKE
Vehicle Number
Miles of
Class of Vehicle Revenue Traveled Transactions
Quarter ended June 2017
Two Axle Vehicles $ 6,129,199 135,490,290 3,390,314
Three Axle Vehicles 321,279 4,217,912 75,870
Four Axle Vehicles 502,858 4,446,885 69,562
Five Axle Vehicles 8,926,287 47,248,245 686,851
Six Axles Vehicles 281,338 1,224,320 19,238
Total $ 16,160,961 192,627,652 4,241,835
Concession Revenue 70,001
Total Revenue $ 16,230,962
% Increase from prior year quarter 13.89%
Quarter ended June 2016
Two Axle Vehicles $ 5,338,514 137,969,951 3,350,734
Three Axle Vehicles 285,596 4,261,103 76,143
Four Axle Vehicles 466,402 4,695,505 76,592
Five Axle Vehicles 7,869,988 47,005,435 674,934
Six Axles Vehicles 221,299 1,068,203 16,048
Total $ 14,181,799 195,000,197 4,194,451
Concession Revenue 70,000
Total Revenue $ 14,251,799
$0
$1,500,000
$3,000,000
$4,500,000
$6,000,000
Jan Feb Mar Apr May Jun Jul Aug Sep Oct Nov Dec
TOTAL REVENUE BY MONTHWILL ROGERS TURNPIKE
2016
2017

Report to Bondholders - Quarter ending June 30, 2017 - Page 7
STATEMENT OF REVENUES
CURRENT QUARTER AND SAME QUARTER PRIOR YEAR
H. E. BAILEY TURNPIKE
Vehicle Number
Miles of
Class of Vehicle Revenue Traveled Transactions
Quarter ended June 2017
Two Axle Vehicles $ 6,023,962 100,911,027 4,711,524
Three Axle Vehicles 190,277 2,343,444 96,081
Four Axle Vehicles 185,141 1,505,770 61,301
Five Axle Vehicles 1,544,069 9,047,088 399,653
Six Axles Vehicles 48,954 237,415 10,780
Total $ 7,992,403 114,044,744 5,279,339
Concession Revenue 81,581
Total Revenue $ 8,073,984
% Increase from prior year quarter 16.88%
Quarter ended June 2016
Two Axle Vehicles $ 5,160,988 100,313,961 4,696,684
Three Axle Vehicles 168,886 2,354,009 96,916
Four Axle Vehicles 158,735 1,496,596 61,880
Five Axle Vehicles 1,238,263 8,121,643 359,062
Six Axles Vehicles 38,429 211,044 9,829
Total $ 6,765,301 112,497,253 5,224,371
Concession Revenue 142,842
Total Revenue $ 6,908,143
$0
$750,000
$1,500,000
$2,250,000
$3,000,000
Jan Feb Mar Apr May Jun Jul Aug Sep Oct Nov Dec
TOTAL REVENUES BY MONTHH.E. BAILEY TURNPIKE
2016
2017

Report to Bondholders - Quarter ending June 30, 2017 - Page 8
STATEMENT OF REVENUES
CURRENT QUARTER AND SAME QUARTER PRIOR YEAR
MUSKOGEE TURNPIKE
Vehicle Number
Miles of
Class of Vehicle Revenue Traveled Transactions
Quarter ended June 2017
Two Axle Vehicles $ 3,789,173 65,949,028 2,647,108
Three Axle Vehicles 294,789 3,317,362 172,351
Four Axle Vehicles 102,749 831,003 35,768
Five Axle Vehicles 1,107,233 5,971,064 237,361
Six Axles Vehicles 31,430 160,033 6,181
Total $ 5,325,374 76,228,490 3,098,769
Concession Revenue 123,602
Total Revenue $ 5,448,976
% Increase from prior year quarter 11.32%
Quarter ended June 2016
Two Axle Vehicles $ 3,438,608 69,743,881 2,786,557
Three Axle Vehicles 280,589 3,783,866 201,762
Four Axle Vehicles 92,979 879,056 37,791
Five Axle Vehicles 929,401 5,613,628 223,090
Six Axles Vehicles 31,367 177,137 7,009
Total $ 4,772,944 80,197,568 3,256,209
Concession Revenue 122,012
Total Revenue $ 4,894,956
$0
$500,000
$1,000,000
$1,500,000
$2,000,000
Jan Feb Mar Apr May Jun Jul Aug Sep Oct Nov Dec
TOTAL REVENUE BY MONTHMUSKOGEE TURNPIKE
2016
2017

Report to Bondholders - Quarter ending June 30, 2017 - Page 9
STATEMENT OF REVENUES
CURRENT QUARTER AND SAME QUARTER PRIOR YEAR
INDIAN NATION TURNPIKE
Vehicle Number
Miles of
Class of Vehicle Revenue Traveled Transactions
Quarter ended June 2017
Two Axle Vehicles $ 2,463,389 43,076,114 1,325,046
Three Axle Vehicles 105,380 1,618,657 47,536
Four Axle Vehicles 157,965 1,389,887 44,791
Five Axle Vehicles 1,581,309 8,634,201 251,861
Six Axles Vehicles 32,797 151,854 4,310
Total $ 4,340,840 54,870,713 1,673,544
Concession Revenue 41,682
Total Revenue $ 4,382,522
% Increase from prior year quarter 15.46%
Quarter ended June 2016
Two Axle Vehicles $ 2,182,976 44,605,561 1,375,366
Three Axle Vehicles 67,441 1,168,642 36,701
Four Axle Vehicles 156,864 1,626,342 52,035
Five Axle Vehicles 1,324,269 8,180,962 240,970
Six Axles Vehicles 22,496 114,354 3,605
Total $ 3,754,046 55,695,861 1,708,677
Concession Revenue 41,682
Total Revenue $ 3,795,728
$0
$400,000
$800,000
$1,200,000
$1,600,000
Jan Feb Mar Apr May Jun Jul Aug Sep Oct Nov Dec
TOTAL REVENUE BY MONTHINDIAN NATION TURNPIKE
2016
2017
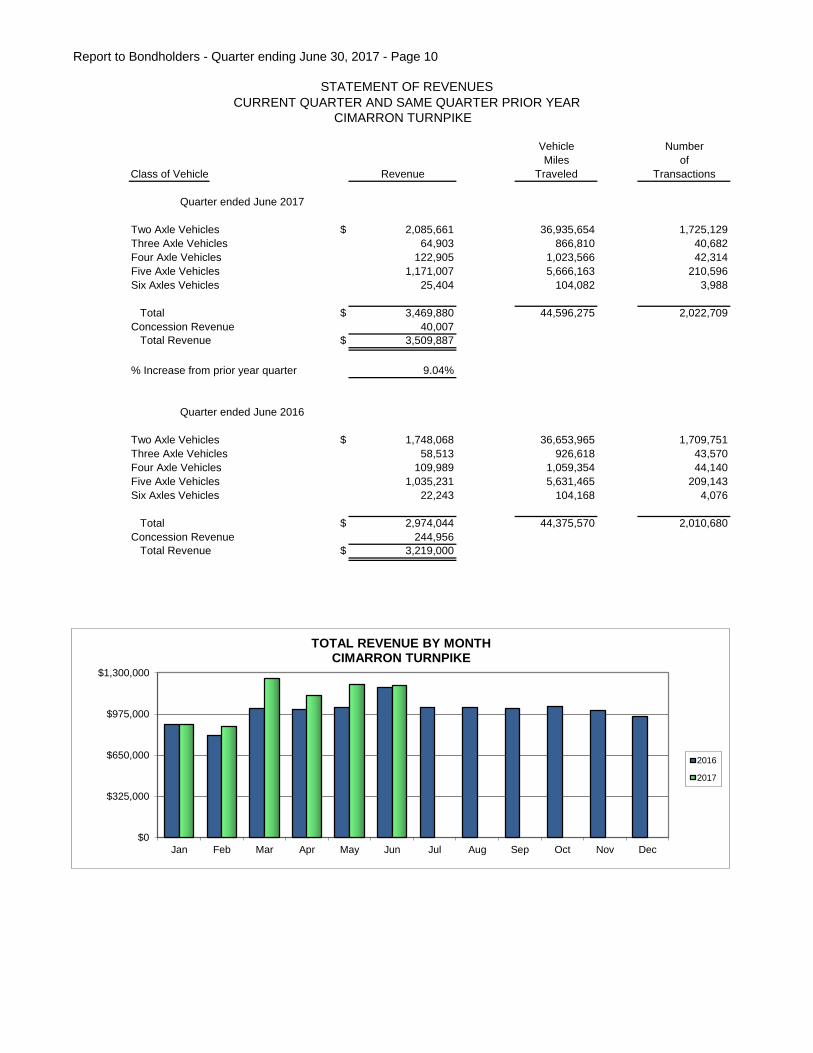
Report to Bondholders - Quarter ending June 30, 2017 - Page 10
STATEMENT OF REVENUES
CURRENT QUARTER AND SAME QUARTER PRIOR YEAR
CIMARRON TURNPIKE
Vehicle Number
Miles of
Class of Vehicle Revenue Traveled Transactions
Quarter ended June 2017
Two Axle Vehicles $ 2,085,661 36,935,654 1,725,129
Three Axle Vehicles 64,903 866,810 40,682
Four Axle Vehicles 122,905 1,023,566 42,314
Five Axle Vehicles 1,171,007 5,666,163 210,596
Six Axles Vehicles 25,404 104,082 3,988
Total $ 3,469,880 44,596,275 2,022,709
Concession Revenue 40,007
Total Revenue $ 3,509,887
% Increase from prior year quarter 9.04%
Quarter ended June 2016
Two Axle Vehicles $ 1,748,068 36,653,965 1,709,751
Three Axle Vehicles 58,513 926,618 43,570
Four Axle Vehicles 109,989 1,059,354 44,140
Five Axle Vehicles 1,035,231 5,631,465 209,143
Six Axles Vehicles 22,243 104,168 4,076
Total $ 2,974,044 44,375,570 2,010,680
Concession Revenue 244,956
Total Revenue $ 3,219,000
$0
$325,000
$650,000
$975,000
$1,300,000
Jan Feb Mar Apr May Jun Jul Aug Sep Oct Nov Dec
TOTAL REVENUE BY MONTHCIMARRON TURNPIKE
2016
2017

Report to Bondholders - Quarter ending June 30, 2017 - Page 11
STATEMENT OF REVENUES
CURRENT QUARTER AND SAME QUARTER PRIOR YEAR
JOHN KILPATRICK TURNPIKE
Vehicle Number
Miles of
Class of Vehicle Revenue Traveled Transactions
Quarter ended June 2017
Two Axle Vehicles $ 9,805,257 84,092,059 12,586,080
Three Axle Vehicles 101,516 683,878 75,160
Four Axle Vehicles 91,327 429,206 47,606
Five Axle Vehicles 769,293 2,350,981 176,556
Six Axles Vehicles 24,763 62,229 5,689
Total $ 10,792,156 87,618,353 12,891,091
Concession Revenue -
Total Revenue $ 10,792,156
% Increase from prior year quarter 16.66%
Quarter ended June 2016
Two Axle Vehicles $ 8,496,804 82,513,754 12,837,186
Three Axle Vehicles 91,206 695,716 80,893
Four Axle Vehicles 80,352 420,878 47,097
Five Axle Vehicles 561,089 1,907,134 148,484
Six Axles Vehicles 21,494 59,318 5,424
Total $ 9,250,945 85,596,800 13,119,084
Concession Revenue -
Total Revenue $ 9,250,945
$0
$1,000,000
$2,000,000
$3,000,000
$4,000,000
Jan Feb Mar Apr May Jun Jul Aug Sep Oct Nov Dec
TOTAL REVENUE BY MONTHJOHN KILPATRICK TURNPIKE
2016
2017

Report to Bondholders - Quarter ending June 30, 2017 - Page 12
STATEMENT OF REVENUES
CURRENT QUARTER AND SAME QUARTER PRIOR YEAR
CHEROKEE TURNPIKE
Vehicle Number
Miles of
Class of Vehicle Revenue Traveled Transactions
Quarter ended June 2017
Two Axle Vehicles $ 1,774,270 21,409,518 1,045,959
Three Axle Vehicles 49,117 428,870 18,652
Four Axle Vehicles 69,387 409,530 14,729
Five Axle Vehicles 662,631 2,388,071 82,487
Six Axles Vehicles 15,689 52,596 1,867
Total $ 2,571,094 24,688,585 1,163,694
Concession Revenue -
Total Revenue $ 2,571,094
% Increase from prior year quarter 15.02%
Quarter ended June 2016
Two Axle Vehicles $ 1,510,584 21,903,699 1,101,386
Three Axle Vehicles 43,438 441,027 19,658
Four Axle Vehicles 59,791 408,359 14,908
Five Axle Vehicles 613,385 2,466,964 85,263
Six Axles Vehicles 8,200 27,342 1,064
Total $ 2,235,398 25,247,391 1,222,279
Concession Revenue -
Total Revenue $ 2,235,398
$0
$237,500
$475,000
$712,500
$950,000
Jan Feb Mar Apr May Jun Jul Aug Sep Oct Nov Dec
TOTAL REVENUE BY MONTHCHEROKEE TURNPIKE
2016
2017

Report to Bondholders - Quarter ending June 30, 2017 - Page 13
STATEMENT OF REVENUES
CURRENT QUARTER AND SAME QUARTER PRIOR YEAR
CHICKASAW TURNPIKE
Vehicle Number
Miles of
Class of Vehicle Revenue Traveled Transactions
Quarter ended June 2017
Two Axle Vehicles $ 181,389 4,576,377 267,781
Three Axle Vehicles 11,767 213,284 12,480
Four Axle Vehicles 6,123 60,088 3,516
Five Axle Vehicles 45,269 369,333 21,611
Six Axles Vehicles 3,239 20,030 1,172
Total $ 247,787 5,239,112 306,560
Concession Revenue -
Total Revenue $ 247,787
% Increase from prior year quarter 20.77%
Quarter ended June 2016
Two Axle Vehicles $ 133,484 3,968,281 232,199
Three Axle Vehicles 25,689 571,319 33,430
Four Axle Vehicles 5,671 63,763 3,731
Five Axle Vehicles 36,288 330,161 19,319
Six Axles Vehicles 4,034 28,010 1,639
Total $ 205,166 4,961,534 290,318
Concession Revenue -
Total Revenue $ 205,166
$0
$22,500
$45,000
$67,500
$90,000
Jan Feb Mar Apr May Jun Jul Aug Sep Oct Nov Dec
TOTAL REVENUE BY MONTHCHICKASAW TURNPIKE
2016
2017

Report to Bondholders - Quarter ending June 30, 2017 - Page 14
STATEMENT OF REVENUES
CURRENT QUARTER AND SAME QUARTER PRIOR YEAR
CREEK TURNPIKE
Vehicle Number
Miles of
Class of Vehicle Revenue Traveled Transactions
Quarter ended June 2017
Two Axle Vehicles $ 8,090,527 76,445,655 11,494,377
Three Axle Vehicles 124,540 854,781 111,732
Four Axle Vehicles 81,750 453,554 54,852
Five Axle Vehicles 525,224 1,721,719 190,255
Six Axles Vehicles 40,446 110,218 12,348
Total $ 8,862,487 79,585,927 11,863,564
Concession Revenue -
Total Revenue $ 8,862,487
% Increase from prior year quarter 21.57%
Quarter ended June 2016
Two Axle Vehicles $ 6,728,136 71,907,144 11,249,236
Three Axle Vehicles 78,862 625,029 83,089
Four Axle Vehicles 73,184 450,240 53,756
Five Axle Vehicles 389,948 1,443,542 161,362
Six Axles Vehicles 20,170 57,730 8,260
Total $ 7,290,300 74,483,685 11,555,703
Concession Revenue -
Total Revenue $ 7,290,300
$0
$800,000
$1,600,000
$2,400,000
$3,200,000
Jan Feb Mar Apr May Jun Jul Aug Sep Oct Nov Dec
TOTAL REVENUE BY MONTHCREEK TURNPIKE
2016
2017

Report to Bondholders-Quarter ending June 30, 2017 - Page 15
Oklahoma Turnpike Authority
Schedule of Cash, Cash Equivalents and Investments
as of June 30, 2017
Interest Purchase Maturity Fair
Description Rate Date Date Cost Value
Unrestricted:
General Fund: Rate xPurchase Date Maturity Dte x Cost x Fair Value
Blackrock Liq Fedfd-Csh 0.460 % 6/30/2017 Demand $ 46,899,226 $ 46,899,226
FHLB 1.010 2/19/2016 2/26/2021 1,000,000 992,610
U.S. Treasury Notes 1.375 5/14/2015 4/30/2020 3,974,062 3,982,680
U.S. Treasury Notes 1.500 10/20/2014 8/31/2018 5,065,039 5,011,750
U.S. Treasury Notes 0.875 7/5/2016 7/31/2019 1,006,133 989,540
U.S. Treasury Notes 1.375 7/14/2014 7/31/2018 998,867 1,000,960
U.S. Treasury SLGS 0.000 11/30/1990 2/21/2021 27,300 27,300
58,970,627 58,904,066
Revenue Fund:
Blackrock Liq Fedfd-Csh 0.460 6/30/2017 Demand 18,683,464 18,683,464
18,683,464 18,683,464
Total unrestricted cash equivalents & investments $ 77,654,091 $ 77,587,530

Report to Bondholders-Quarter ending June 30, 2017 - Page 16
Oklahoma Turnpike Authority
Schedule of Cash, Cash Equivalents and Investments
as of June 30, 2017
Interest Purchase Maturity Fair
Description Rate Date Date Cost Value
Restricted:
Reserve Maintenance Fund: Rate xPurchase Date Maturity Date x Cost x FMV
Blackrock Liq Fedfd-Csh 0.460 % 6/30/2017 Demand $ 18,646,683 $ 18,646,683
FHLB 1.000 2/19/2016 2/26/2021 2,000,000 1,985,220
FHLMC 1.000 5/17/2016 8/26/2019 2,000,000 1,991,420
FHLMC 1.000 5/31/2016 11/26/2019 3,000,000 2,994,300
U.S. Treasury Notes 0.875 2/25/2015 1/15/2018 3,989,844 3,993,960
U.S. Treasury Notes 1.375 5/14/2015 4/30/2020 3,974,063 3,982,680
U.S. Treasury Notes 1.375 7/6/2016 9/30/2020 4,085,781 3,970,880
U.S. Treasury Notes 0.625 7/5/2016 6/30/2018 4,005,781 3,974,680
U.S. Treasury Notes 0.875 7/5/2016 7/31/2019 4,024,531 3,958,160
U.S. Treasury Notes 1.500 5/14/2015 5/31/2019 2,015,859 2,004,660
U.S. Treasury Notes 1.000 5/14/2015 5/15/2018 4,008,906 3,990,640
51,751,448 51,493,283
Revenue Bond Reserve Accounts: Rate xPurchase Date Maturity Date x Cost x FMV
Blackrock Liq Fedfd-Csh 0.460 6/30/2017 Demand 26,485,448 26,485,448
U.S. Bank CD 1.099 12/1/2016 12/1/2017 15,000,000 15,000,000
JP Morgan Chase Repo 5.991 5/23/2002 1/1/2022 50,936,450 50,936,450
U.S. Treasury Notes 0.875 8/26/2014 8/15/2017 3,989,375 3,999,640
U.S. Treasury Notes 1.375 7/6/2016 9/30/2020 3,064,336 2,978,160
U.S. Treasury Notes 0.625 7/5/2016 6/30/2018 3,004,336 2,981,010
U.S. Treasury Notes 0.875 7/5/2016 7/31/2019 3,018,398 2,968,620
U.S. Treasury Notes 1.000 5/30/2013 5/31/2018 4,998,047 4,987,400
U.S. Treasury Notes 1.375 5/30/2013 5/31/2020 1,983,051 1,990,720
112,479,441 112,327,448
2006 Variable Rate Debt Service Accounts:
Cavanal Hill U.S. Treasury 0.080 6/30/2017 Demand 6,328,017 6,328,017
6,328,017 6,328,017
2011 Bond Service Accounts:
Cavanal Hill U.S. Treasury 0.080 6/30/2017 Demand 31,881,788 31,881,788
31,881,788 31,881,788
2017 Bond Service Accounts:
Cavanal Hill U.S. Treasury 0.080 6/30/2017 Demand 10,117,548 10,117,548
10,117,548 10,117,548
2017A Construction Fund:
Blackrock Liq Fedfd-Csh 0.460 6/30/2017 Demand 357,105,758 357,105,758
357,105,758 357,105,758

Report to Bondholders-Quarter ending June 30, 2017 - Page 17
Oklahoma Turnpike Authority
Schedule of Cash, Cash Equivalents and Investments
as of June 30, 2017
Interest Purchase Maturity Fair
Description Rate Date Date Cost Value
Turnpike Trust Fund: Rate xPurchase Date Maturity Date x Cost x FMV
Cavanal Hill U.S. Treasury 0.080 % 6/30/2017 Demand $ 8,572,955 $ 8,572,955
U.S. Treasury Notes 0.875 8/26/2014 8/15/2017 3,989,375 3,999,640
U.S. Treasury Notes 1.500 12/18/2015 10/31/2019 6,997,539 7,010,430
U.S. Treasury Notes 1.000 12/18/2015 12/15/2017 5,299,379 5,296,661
U.S. Treasury Notes 1.375 7/6/2016 9/30/2020 2,042,890 1,985,440
U.S. Treasury Notes 1.250 12/18/2015 12/15/2018 6,994,805 6,990,620
U.S. Treasury Notes 0.625 7/5/2016 6/30/2018 2,002,891 1,987,340
U.S. Treasury Notes 0.875 7/5/2016 7/31/2019 2,012,265 1,979,080
U.S. Treasury Notes 1.375 7/14/2014 7/31/2018 2,497,168 2,502,400
40,409,267 40,324,566
Prepaid PIKEPASS Fund: Rate xPurchase Date Maturity Date x Cost x FMV
Blackrock Liq Fedfd-Csh 0.460 6/30/2017 Demand 1,839,025 1,839,025
FHLMC 1.500 8/16/2016 8/28/2024 1,000,000 966,050
U.S. Treasury Notes 1.500 12/18/2015 10/31/2019 699,754 701,043
U.S. Treasury Notes 1.000 12/18/2015 12/15/2017 699,918 699,559
U.S. Treasury Notes 1.250 12/18/2015 12/15/2018 699,480 699,062
Vanguard 500 Index (open-end mutual fund) 1.880 5/15/2014 Demand 4,596,196 7,593,950
Cavanal Hill LTD DUR (open-end mutual fund) 1.680 Various Demand 4,160,842 4,147,064
Ishares MSCI Emerging Mkts (closed-end-equity fund) 1.420 Various Demand 306,646 314,564
Ishares Morgan Stanley Capital International
Europe Asia Far East Index (closed-end equity fund) 2.540 Various Demand 697,829 820,216
Ishares RSSLL Midcap Index (closed-end fund) 1.530 Various Demand 251,621 379,417
Ishares RSSLL 2000 ETF (closed-end equity fund) 1.360 Various Demand 322,634 548,179
Ishares Core S&P Midcap (closed-end equity fund) 1.520 Various Demand 359,926 586,212
Ishares Core S&P Smallcap 600 (closed-end equity fund) 1.250 Various Demand 443,964 876,375
Metropolitan West T/R Bd-1 1.350 10/10/2014 Demand 4,130,562 4,042,172
SPDR S&P 500 Depository Receipts (closed-end equity fund) 1.910 Various Demand 2,286,854 3,816,813
22,495,251 28,029,701
Total restricted cash equivalents & investments 632,568,518 637,608,109
Cash balance (unrestricted & restricted) - 14,088,115
Total Cash, Cash Equivalents and Investments $ 710,222,609 $ 729,283,754

OKLAHOMA TURNPIKE AUTHORITY
SCHEDULE OF INDEBTEDNESS ISSUED, RETIRED, DEFEASED AND OUTSTANDING
AS OF JUNE 30, 2017
Quarter Quarter
Beginning Ending
Date of Amount of Range of Range of Balance Additional Retired or Balance
Issuance Issuance Maturities Interest Rates Outstanding Issues Defeased Outstanding
Refunding 2nd Senior Revenue Bonds - Series 2006B 8/24/06 106,160,000 1/1/15 to 1/1/28 * $ 93,595,000 $ 93,595,000
Refunding 2nd Senior Revenue Bonds - Series 2006E 8/24/06 106,160,000 1/1/15 to 1/1/28 * 93,595,000 - 93,595,000
Refunding 2nd Senior Revenue Bonds - Series 2006F 8/24/06 106,160,000 1/1/15 to 1/1/28 * 93,595,000 - 93,595,000
Refunding 2nd Senior Revenue Bonds - Series 2011A 10/5/11 524,010,000 1/1/12 to 1/1/28 0.20% to 5.00% 401,055,000 - 401,055,000
Construction 2nd Senior Revenue Bonds - Series 2011B 12/7/11 159,650,000 1/1/14 to 1/1/31 2.00% to 5.00% 117,440,000 - - 117,440,000
Construction 2nd Senior Revenue Bonds - Series 2017A 2/8/17 456,070,000 1/1/32 to 1/1/47 3.50% to 5.00% 456,070,000 - 456,070,000
Refunding 2nd Senior Revenue Bonds - Series 2017B 2/8/17 23,930,000 1/1/18 to 1/1/22 2.00% to 4.00% 23,930,000 - 23,930,000
U.S. Bank Credit Facility** 12/1/15 15,000,000 12/1/16 to 12/1/25 90-day LIBOR + 0.725% 15,000,000 - - 15,000,000
Totals $ 1,294,280,000 $ - $ - $ 1,294,280,000
OKLAHOMA TURNPIKE AUTHORITY
PROCEEDS FROM SALE OF SURPLUS PROPERTY
FOR THE QUARTER ENDED JUNE 30, 2017
DATE DESCRIPTION PROCEEDS
2QTR 06/30/17 Total Sale of Surplus Property
& Insurance Proceeds $ 443,271
Total $ 443,271
* The Series 2006B, E & F Bonds are variable rate bonds. The Series 2006B & E bear interest at a rate reset on a weekly basis, and the Series 2006F bears interest at a rate reset on a daily basis.
** The proceeds of this credit facility were invested in a certificate of deposit with U.S. Bank to fund the balance of the revenue bond requirement previously provided by surety bonds from
Financial Guaranty Insurance Company. The maximum annual debt service requirements are such that only $15,000,000 is currently necessary to satisfy reserve requirements.
Re
po
rt to B
on
dh
old
ers
-Q
ua
rter e
nd
ing
Ju
ne
30
, 20
17
-P
ag
e 1
8