graphic taskforce geneva - unece
TRANSCRIPT

UNESCOUNESCO--IHPIHP
GRAPHICGRAPHICGroundwater Resources Assessment
under the Pressures
of Humanity and Climate Change

OutlineOutline
UNESCOUNESCO--IHP VII and GRAPHIC IHP VII and GRAPHIC GRAPHIC GRAPHIC –– whatwhat’’s it all about?s it all about?Subjects and MethodsSubjects and MethodsGRAPHIC Regions & Case StudiesGRAPHIC Regions & Case StudiesOther UNESCOOther UNESCO--IHP initiatives of interestIHP initiatives of interest

International Hydrological International Hydrological ProgrammeProgramme
The only global intergovernmental scientific The only global intergovernmental scientific programmeprogrammeon water resources in the UN systemon water resources in the UN systemCreated in 1975 after the International Hydrological Created in 1975 after the International Hydrological DecadeDecade6 year phases, unifying theme 6 year phases, unifying theme Member States define needs and plans of phases Member States define needs and plans of phases Growing emphasis on management and social aspectsGrowing emphasis on management and social aspects

IHP VII (2008IHP VII (2008--2013)2013)
Water dependencies: Systems under Stress and Water dependencies: Systems under Stress and Societal ResponsesSocietal Responses5 Themes, 22 Focal Areas5 Themes, 22 Focal AreasTheme 1: Adapting to the impacts of global changes on Theme 1: Adapting to the impacts of global changes on river basins and aquifer systemsriver basins and aquifer systemsFocal Area 1.4: Managing groundwater systemFocal Area 1.4: Managing groundwater system’’s s response to global changes response to global changes GRAPHICGRAPHIC

Groundwater is an extremely important natural resource as a primary source for agriculture, domestic, and industrial water supplies in many countries.
Groundwater resources are under threat by climate change and coupled human activities
Urgent need to improve our knowledge on how groundwater resources might react to these impacts
Identify indicators of climate change impacts on groundwater resources and to evaluate tools and methods that could contribute to adaptation measures
GRAPHIC GRAPHIC –– whatwhat’’s it all about?s it all about?

Vision
GRAPHIC promotes and advances sustainable groundwater management in the face of climate change and linked human impacts.
MissionGRAPHIC provides a platform for exchange of information through
case studies, thematic working groups, research, and communication.GRAPHIC serves the global community through providing
scientifically-based recommendations that are policy relevant.GRAPHIC uses regional and global networks to improve capacity to
manage groundwater resources.
GRAPHIC Vision and MissionGRAPHIC Vision and Mission

GRAPHIC is a global network of scientists aimed at bringing scientists together (from different countries,
different scientific disciplines)conduct case studies, covering a wide range of subjects,
scientific methods, and geographical and climatic settingsderive policy-relevant recommendations from scientific
findings and communicate them to decision makersOrganize meetings, sessions at conferences and congresses
and training coursesPublications
GRAPHIC GRAPHIC –– how does it work?how does it work?

SubjectsSubjects and and MethodsMethodsMultidisciplinaryMultidisciplinary scientificscientific approachapproachSubjectsSubjects::
GW GW QuantityQuantityGW GW QualityQuality, , geochemicalgeochemical indicatorsindicators of of climateclimate and and linkedlinked human human impactsimpactsPaleoPaleo--IndicatorsIndicators of of environmentalenvironmental changeschangesManagement and Management and PolicyPolicy
MethodsMethodsGeophysicalGeophysical MethodsMethodsRemoteRemote SensingSensingDatabase and Information SystemsDatabase and Information SystemsSimulation and Simulation and ModelingModeling

Subjects and MethodsSubjects and MethodsGRAPHIC Framework GRAPHIC Framework DocumentDocument

GRAPHIC GRAPHIC –– Latin Latin AmericaAmerica & & CaribbeanCaribbean
GRAPHIC GRAPHIC –– AsiaAsia & Pacific & Pacific
GRAPHIC GRAPHIC –– AfricaAfrica
GRAPHIC GRAPHIC –– Europe Europe
GRAPHIC GRAPHIC –– NorthNorth AmericaAmerica
RegionalRegional componentscomponents ofof GRAPHICGRAPHIC

GRAPHIC Case Studies
New GRAPHIC case New GRAPHIC case studiesstudies??

Impact Assessment of Combined Climate and Management Scenarios on Groundwater Resources. Application to the Inca-Sa Pobla Hydrogeological Unit and associated wetland (Majorca, Spain)
MAJORCA ISLANDMAJORCA ISLAND
Prof. Lucila Candela
Dep. de Ingenieria del Terreno
Universidad Politécnica de Catalunya

GROUNDWATER BALANCEGROUNDWATER BALANCE--MAJORCAMAJORCA((hmhm33//yearyear))
NET INFILTRATION BY PRECIPITATION 305.4
IRRIGATION LOSSES 21.9
WASTE WATER LOSSES 9.6
SUPPLY SYSTEM LOSSES 12.7
SURFACE WATER RECHARGE 24.5
SEA WATER INTRUSION 22.3
DOMESTIC SUPPLY 83.1
IRRIGATION 136.1
TO SEA 128.3
Mal
lorc
a SPRING AND STREAMS 49.3

MODELLING & SCENARIOS METHODOLOGYMODELLING & SCENARIOS METHODOLOGY
Groundwater Model(Visual Modflow)
Recharge estimation(Visual Balan)
Input Parameter(Bibliography & data
collection)
Calibration: 1986-03Validation: 2003-2005
Future scenarios
Climatic scenarios
Management scenarios

Impermeable boundary
Springs
Irrigated area
Supply wells
INCA BASIN
SA POBLA BASIN
SEA
Wetland
Alcudia wells
Palma wells
FSSJ springs
IrrigatedIrrigated areaarea: 4800 ha: 4800 ha
SupplySupply wellswells::
-- LlubiLlubi--Muro Muro wellswells
-- Alcudia Alcudia wellswells
IrrigationIrrigation wellswells
4 4 layerslayers
Visual MODFLOWVisual MODFLOW
MathematicalMathematical ModelModel (II)(II)INCA INCA –– SA POBLA HYDROLOGIC UNITSA POBLA HYDROLOGIC UNIT
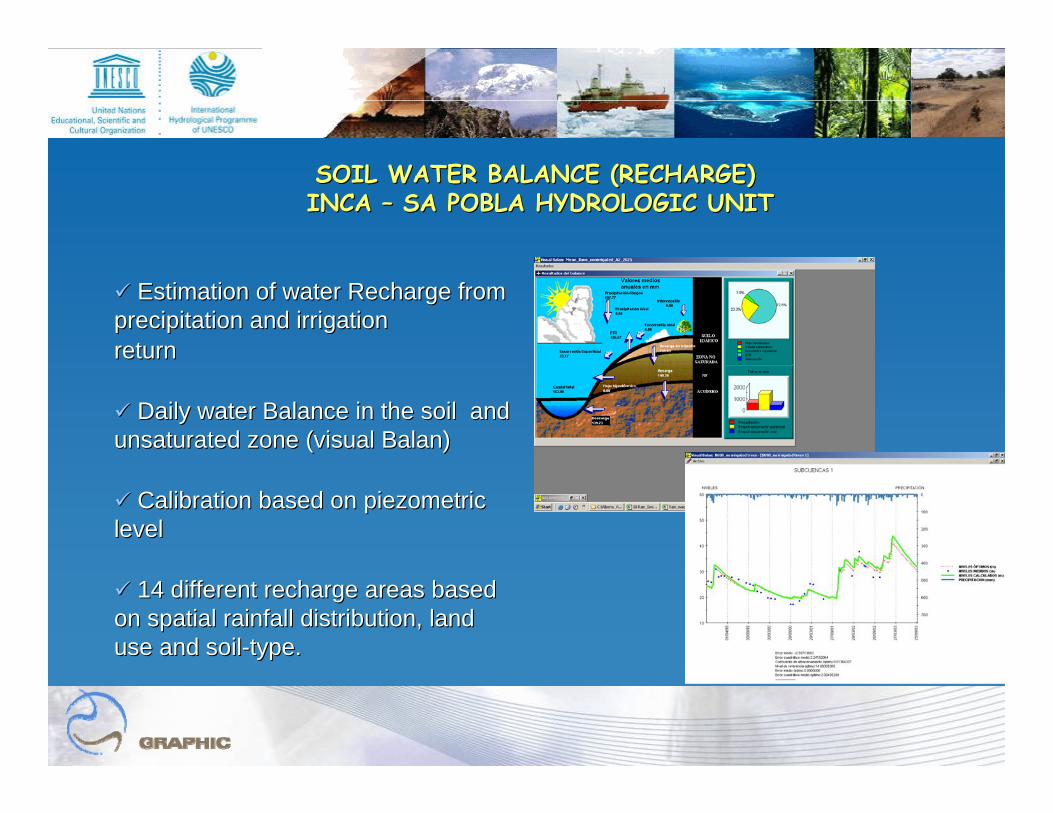
Estimation of water Recharge from Estimation of water Recharge from precipitation and irrigationprecipitation and irrigationreturnreturn
Daily water Balance in the soil and Daily water Balance in the soil and unsaturated zone (visual unsaturated zone (visual BalanBalan))
Calibration based on Calibration based on piezometricpiezometriclevellevel
14 different recharge areas based 14 different recharge areas based on spatial rainfall distribution, land on spatial rainfall distribution, land use and soiluse and soil--type.type.
SOIL WATER BALANCE (RECHARGE) SOIL WATER BALANCE (RECHARGE) INCA INCA –– SA POBLA HYDROLOGIC UNITSA POBLA HYDROLOGIC UNIT

Climatic Scenarios (HadCM3, IPCC, 2001)Climatic Scenarios (HadCM3, IPCC, 2001)A2A2B2B2
Simulated time slice 2025Simulated time slice 2025Management ScenariosManagement Scenarios
Changes of water supply (present, increase, decrease)Changes of water supply (present, increase, decrease)Changes of Irrigated Agriculture (present, increase, Changes of Irrigated Agriculture (present, increase, decrease)decrease)
Combination of management and climatic scenariosCombination of management and climatic scenarios
OBJECTIVE: OBJECTIVE: WetlandWetland impactsimpacts

Llubí-wells (Supply) (1.0-1.3)
Sa Pobla Agri (0.8-1.0)
Springs
Alcudia wells (Supply) (0.9-1.1)
INCA BASIN
SA POBLA BASIN
SEA
Wetland
Inca Agri
(0.6-1.0)
Albufera Agri
(0.8-1.0) Whatmanagementmeasures are more effective?
(Springs (Springs impactimpact II) II)

CONCLUSIONSCONCLUSIONS
To avoid the partial or complete disappearance of S’Albuferawetland under climate change it is necessary to decrease groundwater abstraction, as well as the reallocation of the agricultural pumping wells.
Sensitivity analysis has allowed the identification of the most effective management actions to control spring discharges to theS’Albufera wetland. The results allow quantifying the technical advantages of the management options to be put alongside socio-economic criterion for decision making.
The obtained uncertainties in spring discharges are quantified giving a range of confidence in the model predictions and consequently in water planning measures implication.
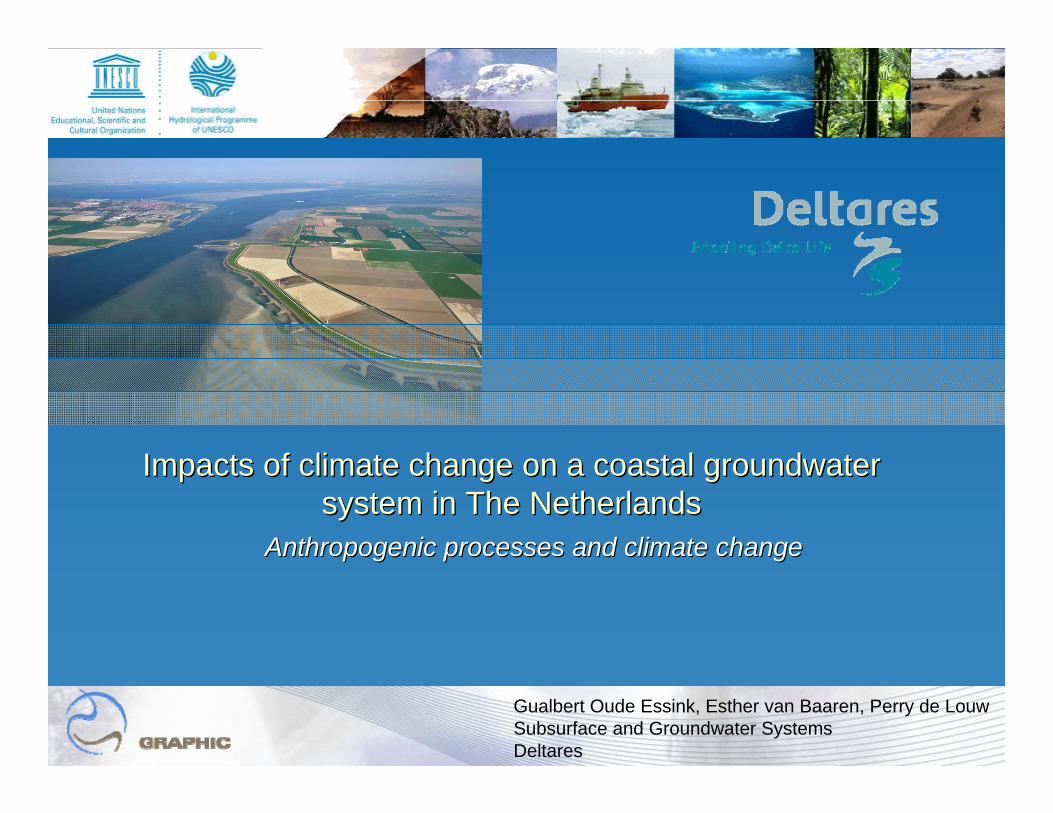
Impacts of climate change on a coastal groundwater Impacts of climate change on a coastal groundwater system in The Netherlandssystem in The Netherlands
AnthropogenicAnthropogenic processesprocesses and and climateclimate changechange
Gualbert Oude Essink, Esther van Baaren, Perry de LouwSubsurface and Groundwater SystemsDeltares

A (Dutch) groundwater system under stressA (Dutch) groundwater system under stress
Let us make a numeric model of these concepts

Model input (3/5): initial salinity distributionModel input (3/5): initial salinity distribution
Very important input for swi models, but diffic
ult to obtain!

Model input (4/5): land subsidenceModel input (4/5): land subsidence

KNMI’06 W+2100
Model input (5/5): Change in groundwater rechargeModel input (5/5): Change in groundwater recharge

backwatereffect
Zone of influence is limited!
Zone of influence of sea level riseZone of influence of sea level rise

Past reclamation of polders will dominate
future salinisation of coastal groundwater system

Zone of Zone of influnceinflunce SLR:SLR:Zone of influence of sea level rise is rather limited, due to geZone of influence of sea level rise is rather limited, due to geological ological ‘‘shortcutsshortcuts’’
Salt load to surface water:Salt load to surface water:Past reclamation of polders will dominate future Past reclamation of polders will dominate future salinisationsalinisation and freshening of and freshening of coastal groundwater systemcoastal groundwater system
Future plans:Future plans:Assess the (Assess the (un)feasibilityun)feasibility of regional measures to stop of regional measures to stop salinisationsalinisationIncorporate local processes into regional models, such as preferIncorporate local processes into regional models, such as preferential saline ential saline seepage through boilsseepage through boils
Article in Water Resources Research (from half Article in Water Resources Research (from half octoct. 2010):. 2010):Oude Essink, G.H.P., Oude Essink, G.H.P., BaarenBaaren, E.S., van, De , E.S., van, De LouwLouw, P.G.B., Effects of climate change on coastal, P.G.B., Effects of climate change on coastalgroundwater systems: a groundwater systems: a modelingmodeling study in the Netherlandsstudy in the Netherlands
MainMain conclusionsconclusions

Role of Groundwater in adaptation to the Role of Groundwater in adaptation to the impacts of climate change?impacts of climate change?
- world’s largest accessible store of freshwater
However…

…… it is not yet sufficiently taken into considerationit is not yet sufficiently taken into consideration
“groundwater is the major source of drinking water across much of the world… but there has been very little research on the potential effects of climate change”.
Inter-governmental Panel on Climate Change (IPCC) in both their 3rd (2001) and 4th (2007) Assessment Reports

GRAPHIC Side Event on Groundwater and GRAPHIC Side Event on Groundwater and Climate at the WCCClimate at the WCC--3 (Sept 2009)3 (Sept 2009)
(1) to formally consider groundwater in both the generation and the use of climate information in order to inform adaptation and to improve climate prediction; and
(2) to initiate dialogue between groundwater and climate scientists at the global level. The latter is expected to lead to improved consideration of groundwater in climate adaptation and

GRAPHIC international group of experts and GRAPHIC international group of experts and partnershipspartnerships
Partners:Geological Surveys (TNO, USGS, BGR, GSI), USDA, UCI, NASA, RIHN, IGRAC, IAH-Commission on GW&C, Universities, WWAP, UNU-EHS, UNECE and others
Linkages with other UNESCO-IHP projects and programmes (ISARM, GWES, G-WADI and others)

GRAPHIC recent activitiesGRAPHIC recent activities
Training course and Workshop on Training course and Workshop on Methods for the study of longMethods for the study of long��term term groundwater dynamicsgroundwater dynamics (Nov 1(Nov 1��5, 2010, 5, 2010, TozeurTozeur, Tunisia), Tunisia)
Lectures and training on stable isotopes, noble gases and radiocLectures and training on stable isotopes, noble gases and radiocarbon arbon dating of groundwater, and application of GRACE (remote sensing dating of groundwater, and application of GRACE (remote sensing technology to detect changes in groundwater storage)technology to detect changes in groundwater storage)
Participants from Tunisia, Morocco, Ethiopia, Kenya, Sudan, EgypParticipants from Tunisia, Morocco, Ethiopia, Kenya, Sudan, Egypt, Benint, Benin
International Symposium on "Groundwater as a key for adaptation International Symposium on "Groundwater as a key for adaptation to to changing climate and societychanging climate and society““ and GRAPHIC expert group meeting, and GRAPHIC expert group meeting, Nov 14Nov 14--16, Kyoto, Japan)16, Kyoto, Japan)

Next stepsNext stepsXXV IUGG General Assembly XXV IUGG General Assembly Earth on the Edge: Science Earth on the Edge: Science for a Sustainable Planetfor a Sustainable Planet, 28 June , 28 June -- 7 July 2011, 7 July 2011, Melbourne, AustraliaMelbourne, AustraliaGRAPHIC Conference, Latin America and the CaribbeanGRAPHIC Conference, Latin America and the CaribbeanTraining course Groundwater Dynamics, China, Sept Training course Groundwater Dynamics, China, Sept 20112011The Impact of Climate Change on Groundwater The Impact of Climate Change on Groundwater Resources with special reference to Hard rock Terrain. Resources with special reference to Hard rock Terrain. IGWC 2011 IGWC 2011 -- 4th International Groundwater Conference, 4th International Groundwater Conference, Madurai, INDIA. 27Madurai, INDIA. 27--30 Sept 2011 30 Sept 2011