grav-d field operations handbook - national geodetic survey
TRANSCRIPT
GRAV-D Field Operations Handbook
Table of Contents Field Standards and General Procedures .............................................................................................1
Purpose ..................................................................................................................................................... 1
Background ............................................................................................................................................... 1
Reconnaissance Operations Specifications ............................................................................................... 1
Reconnaissance Operations Deliverables ................................................................................................. 5
Airborne Operations Specifications .......................................................................................................... 5
Airborne Operations Deliverables .......................................................................................................... 10
Contact Information ................................................................................................................................ 12
Field Worksheets ............................................................................................................................. 13
Ground Testing Worksheet for Installation ............................................................................................ 13
Flight Log Worksheet .............................................................................................................................. 18
GRAV-D Instruments and Software.............................................................................................. 20
Summary of Instruments and Software .................................................................................................. 20
User Guides and Help Files ............................................................................................................... 21
Issac User Guide and Help File ................................................................................................................ 21
Detailed Field Procedures ................................................................................................................. 47
Abbreviated TAGS Procedures (Checklist for Experienced Operators) .................................................. 47
Detailed TAGS Procedures ...................................................................................................................... 50
Edited on 10/16/12 by M. Youngman Published by NOAA’s National Geodetic Survey
Field Standards and General Procedures
Purpose The overall goal is to collect high quality airborne gravity data for use in producing a geoid accurate to 1 cm. Gravity surveys are designed to collect a high-resolution “snapshot” of gravity data in the planned blocks near the base of operations (airport). This document describes standards and general procedures for reconnaissance and airborne field operations.
Background The National Geodetic Survey (NGS) has launched the Gravity for the Redefinition of the American Vertical Datum (GRAV-D) project as a way to improve how elevations (heights) are determined. GRAV-D requires that airborne gravity data is collected over the entire US and its holdings. Each airborne gravity survey will be based from a particular airport and work with a Fixed Base Operator (FBO) where fuel can be obtained at government contract rates, if available. The airborne survey will provide a gravity field measurement at medium-to-long range resolution to provide a bridge for blending the more than 2 million surface gravity measurements in the NGS data base with the GRACE (Gravity Recovery And Climate Experiment) and GOCE (Gravity Field and steady-State Ocean Circulation Explorer) satellite gravity. A gravimetric geoid will be created from the blended gravity field that will form the new vertical datum, the reference for all elevation (or height) determinations. The new vertical datum will be released after 2022.
Reconnaissance Operations Specifications The reconnaissance surveyor will have four primary responsibilities for each location surveyed: assess and propose appropriate locations for base stations; perform the terrestrial gravity survey; coordinate with each airport and/or FBO on logistics of the airborne survey including providing a shipping address to the GRAV-D project manager; and deliver the GPS data, terrestrial gravity data, and a field report to the GRAV-D project manager. These four primary responsibilities, including procedures and data submission guidelines are described in detail below.
All records in connection with each location will be labeled as described in the project instructions. Backups of transmitted data must be held until notified by the GRAV-D Team (Observation and Analysis Division, Survey Section B).
1. GPS Base Station Positions The reconnaissance survey will identify, position, and submit the data for three base station locations per airport. These base station locations will need to be well documented such that future airborne surveys will be able to reuse these locations
a. Selection of Location At each location, three GPS base stations sites will be established. These sites: will be easily accessible for multiple visits per day by the airborne field team, will be secure to protect the GPS instrumentation, will have a 360° clear view of the sky down to 10 degrees above the horizon,
Page 1 of 55
and will be in an environment with limited possibilities for multi-path interference. The locations chosen for the GPS base locations will meet the criteria set down in Section B.2.a through B.2.c in the “Guidelines for New and Existing Continuously Operating Reference Stations (CORS)”, February 2006. For those locations selected that do not have a pre-existing geodetic survey mark, at a minimum a PK (Parker-Kalon1) nail should be set with a cone or stake marking the spot.
As indicated in the “NGS Operations Handbook,” a site description/log/layout sketch must be made. The sketch must include the location of the marks, tripod, antennae, buildings, and any other identifying characteristics of the area on the sketch, as well as the exact height of the antenna reference point above the geodetic mark. Photographs will be taken of the antenna, site layout, reference stations, and any unusual situations, including at least a close up of the mark, an eye view of the mark, and a horizon shot of the set up antenna and tripod, facing each of the cardinal directions. There are also requirements for collecting digital photos of marks, as specified in “REQUIREMENTS FOR DIGITAL PHOTOGRAPHS OF SURVEY MARKS AND CORS ANTENNAS”, Version 13C, January 31, 2008 regarding requirements for collecting digital photos of marks. In addition, photographs will be taken of any unusual situations.
b. GPS Base Station Positioning During the reconnaissance the preliminary GPS base station positions will be determined. Data collection will be accomplished at 30 second epoch intervals and satellites tracked down to a 10-degree elevation mask. Stations will be observed using geodetic quality dual-frequency receivers for a minimum 24 hours. Station occupation and observing procedures will be conducted in accordance with the "NGS Operations Handbook" and appropriate equipment user manuals. The position will be determined by OPUS-S. If possible and convenient, a Primary Airport Control Station (PACS) or Secondary Airport Control Station (SACS) will be used as a GPS base station and/or gravity mark.
Antenna set-up is critical to the success of this project. Fixed-height tripods are required for all receivers. The plumbing bubbles on the antenna pole of the fixed-height tripod must be shaded when plumbing is performed. Plumbing bubbles must be shaded for 3 minutes before checking and/or re-plumbing. The perpendicularity of the poles will be checked at the beginning of the project, periodically throughout the observation, and any other time there is suspicion of a problem. For information on how to orient the GPS antenna, refer to Section B.6 of the “Guidelines for New and Existing Continuously Operating Reference Stations (CORS),” version February 2006. Refer to those same guidelines in Section B.7, paragraphs 1 and 2 for specifications regarding the antenna cable.
c. Data Submission The GPS data will be submitted with the corresponding field report and all metadata will be part of the report. When submitting GPS data to OPUS-S, the height of the antenna will be specified as 0.00 meters in order for OPUS-S computes the location of the ARP. The OPUS-S solutions will be attached to the field report as an Appendix and the final positions from OPUS (latitude, longitude, ellipsoidal height, and errors in all directions) in ITRF00 coordinates will be entered into the summary document within the
1 Parker-Kalon Company was the original manufacturer. Any manufacturer is acceptable as long as it matches the original specifications.
Page 2 of 55
field report. As part of the field report, the GPS data will be submitted in its raw format and in RINEX. The data will be submitted on a DVD along with the gravity data (see below).
2. Gravity Tie Absolute and relative gravity observations will be performed in accordance with the "NGS Operations Handbook", as defined in Gravity Surveys, Section 2.6.5.
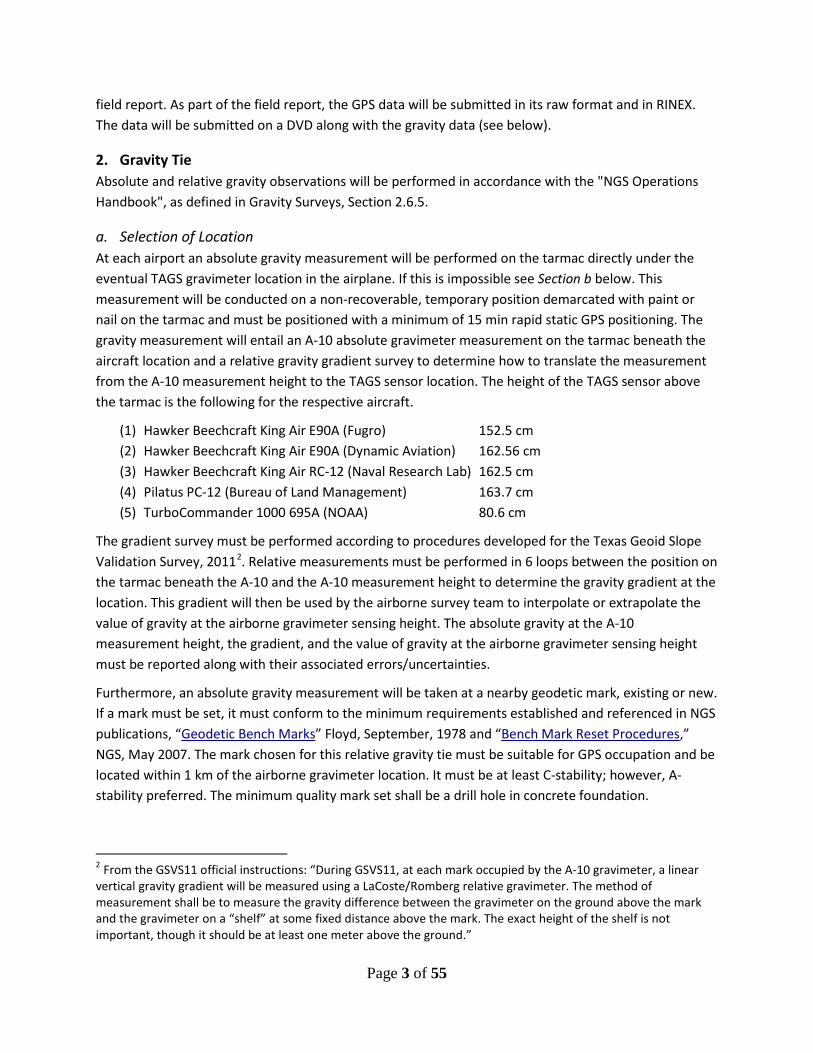
a. Selection of Location At each airport an absolute gravity measurement will be performed on the tarmac directly under the eventual TAGS gravimeter location in the airplane. If this is impossible see Section b below. This measurement will be conducted on a non-recoverable, temporary position demarcated with paint or nail on the tarmac and must be positioned with a minimum of 15 min rapid static GPS positioning. The gravity measurement will entail an A-10 absolute gravimeter measurement on the tarmac beneath the aircraft location and a relative gravity gradient survey to determine how to translate the measurement from the A-10 measurement height to the TAGS sensor location. The height of the TAGS sensor above the tarmac is the following for the respective aircraft.
(1) Hawker Beechcraft King Air E90A (Fugro) 152.5 cm (2) Hawker Beechcraft King Air E90A (Dynamic Aviation) 162.56 cm (3) Hawker Beechcraft King Air RC-12 (Naval Research Lab) 162.5 cm (4) Pilatus PC-12 (Bureau of Land Management) 163.7 cm (5) TurboCommander 1000 695A (NOAA) 80.6 cm
The gradient survey must be performed according to procedures developed for the Texas Geoid Slope Validation Survey, 20112. Relative measurements must be performed in 6 loops between the position on the tarmac beneath the A-10 and the A-10 measurement height to determine the gravity gradient at the location. This gradient will then be used by the airborne survey team to interpolate or extrapolate the value of gravity at the airborne gravimeter sensing height. The absolute gravity at the A-10 measurement height, the gradient, and the value of gravity at the airborne gravimeter sensing height must be reported along with their associated errors/uncertainties.
Furthermore, an absolute gravity measurement will be taken at a nearby geodetic mark, existing or new. If a mark must be set, it must conform to the minimum requirements established and referenced in NGS publications, “Geodetic Bench Marks” Floyd, September, 1978 and “Bench Mark Reset Procedures,” NGS, May 2007. The mark chosen for this relative gravity tie must be suitable for GPS occupation and be located within 1 km of the airborne gravimeter location. It must be at least C-stability; however, A-stability preferred. The minimum quality mark set shall be a drill hole in concrete foundation.
2 From the GSVS11 official instructions: “During GSVS11, at each mark occupied by the A-10 gravimeter, a linear vertical gravity gradient will be measured using a LaCoste/Romberg relative gravimeter. The method of measurement shall be to measure the gravity difference between the gravimeter on the ground above the mark and the gravimeter on a “shelf” at some fixed distance above the mark. The exact height of the shelf is not important, though it should be at least one meter above the ground.”
Page 3 of 55
b. Tie from Relative Gravity Survey If taking an absolute gravimeter measurement on the tarmac is not possible, then a relative gravity survey will be conducted as described in the "NGS Operations Handbook," to translate the absolute value from the nearest Absolute Gravity Base Station that satisfies the specified conditions to the TAGS sensor location. If a suitable existing Absolute Gravity Base Station cannot be found, a new one must be set. If needed a list of suitable stations will be provided by the GRAV-D project manager.
The relative gravity tie must be transferred from an absolute base station measured by a standardized3 absolute gravimeter accurate to within ± 10 µGal (0.01 mGal). The gravity tie must be accurate to 50 μGal (0.05 mGal), which translates to a second-order survey as defined in “Standards and Specifications for Geodetic Control Networks,” Federal Geodetic Control Subcommittee, September, 1984.
Success in meeting the accuracy standards will be based on repeatability of measurements and analysis of six loop misclosures. The tie locations used must already have site descriptions or new descriptions will be written using NGS’ WinDesc software for inclusion in the final report. Station monumentation, occupation, and observing procedures will be carried out in accordance with approved NGS guidelines and appropriate equipment user manuals.
c. Data Submission Data and the field report will be submitted individually for each location following the survey completion at that location. Data formats and digital file definitions are given in "Input Formats and Specifications of the National Geodetic Survey Data Base," Volume III, Gravity Control Data, Federal Geodetic Control Subcommittee, September 1994, reprinted with updates December 1997. Of particular note are the following:
Gravity Data: Gravity data will be submitted in its raw formats, according to the “Terrestrial Gravity Standards and Specifications,” version 2010/2011.
Gravity Marks: All gravity marks established during this survey must be plotted on the best available map and the positions of marks determined with GPS. Submit the maps and coordinates with the field report.
Gravity data will be submitted on a DVD along with the GPS data (see above).
3. Coordination with Airport and FBO Management In order to ensure a smooth airborne survey at each airport location, a number of logistical items must be coordinated with the airport and/or FBO. The reconnaissance surveyor will need to determine whether the airport manager and/or the FBO manager need to be involved for each of the following components: (All of the information listed below will be included in the field report on DVD with the GPS and gravity data.)
1. Aircraft Parking: A perpetual parking space for the aircraft must be identified and its use confirmed with the appropriate authority. The space must be within 200 feet of a power outlet
3 A standardized absolute gravimeter has participated in comparison observations with other absolute gravimeters in accordance to accepted international Absolute Gravimeter Intercomparison measuring protocols
Page 4 of 55
so that extension cords can reach the aircraft. The location of the parking space that is approved by the owner of the space (including wheels and gravimeter location) must be marked in a way that both will last until the aircraft arrives. Pictures and sketches must be provided in the field report.
2. Office Space: Determine if office space is available for rent, the security of the space, available furniture (table space, chairs, etc.), proximity to the aircraft, proximity to pedestrian gate or door to ramp, and cost.
3. High-Speed Internet Access: Determine if internet access is available at the FBO, the speed of upload and download, access restrictions, and internet security issues (i.e. is the wireless not password protected).
4. Airport and FBO Security: Determine contact information for airport/FBO staff, the badges needed, process to get them, escorts required, nearby restricted areas, access for driving on the ramp, and access to GPS base station locations.
Reconnaissance Operations Deliverables 1. Field Report (mailed copy, email)
a. Includes summary of survey, contact information, diagrams, maps, and conclusions 2. Gravity and GPS Data (mailed CD or DVD)
Airborne Operations Specifications Information from the appropriate reconnaissance survey will be provided by the GRAV-D project manager in advance of this airborne survey or as soon as possible. Airborne gravity and GPS data (for positioning) will be collected based on the information provided from the previous reconnaissance survey and according to the specifications given below.
The airborne operators have three primary responsibilities: instrument management, data collection, and data quality control. These three responsibilities are described in detail below. The deliverables will be the GPS data, gravity data, supporting metadata (including log books and worksheets), and a final report provided to the GRAV-D project manager. Contact will be maintained between the GRAV-D project manager (or the manager’s alternate designated point of contact) and the field team throughout this survey to provide and receive feedback on data collection progress and quality. All records in connection with this survey will be titled with the survey name (e.g. “AK12”) and the block name (e.g. “AN07”) as specified in the project instructions. Specific records required are detailed in each section below. Backups of transmitted data must be held until otherwise notified by the Silver Spring office (Observation and Analysis Division, Survey Section B).
1. Instrument Management: Set-up, Operation, and Maintenance The survey team is responsible for the operation and security of all equipment listed above as well as any supporting computer equipment. This includes installation on the aircraft and removal of equipment at the end of the survey, as well as monitoring the operational status during the survey. Access to the instruments should follow the NGS Access Control Plan. In the case of an instrument malfunction, the survey team may troubleshoot and do repairs as necessary in the field. If the survey crew is unable to fix the problem then they will contact the following people for instructions: the NGS IT
Page 5 of 55
Helpdesk for laptop problems, the GRAV-D data manager for software and data processing issues, or the GRAV-D project manager for all other problems. All instrument changes (including simple cable or part swaps) after the initial installation will be recorded in the Master Register log. Changes to the TAGS will be recorded in the instrument’s green book, which is kept with the instrument at all times.
a. Base Station Set-up Three dual-frequency GPS receiver set-ups will be established during the survey at the sites determined by the reconnaissance survey. GPS base station positions will be provided from the reconnaissance survey and must be used unless the established monumentation or markers have been disturbed or destroyed. If this is the case, see Sections 1.a.i and 1.a.ii (below) for determining new base station locations and positions.
Antenna set-up is critical to the success of this project. Fixed-height tripods are required for all receivers. The plumbing bubbles on the antenna pole of the fixed-height tripod must be shaded when plumbing is performed. Plumbing bubbles must be shaded for 3 minutes before checking and/or re-plumbing. The perpendicularity of the poles must be checked at the beginning of the project and any other time there is suspicion of a problem. For information on how to orient the GPS antenna, refer to Section B.6 of the “Guidelines for New and Existing Continuously Operating Reference Stations (CORS),” version February 2006. Refer to those same guidelines in Section B.7, paragraphs 1 and 2 for specifications regarding the antenna cable.
i. Identifying New Base Station Locations (only if needed) Three GPS base station sites that are easily accessible for multiple visits per day, secure to protect the GPS instrumentation, have a 360° clear view of the sky down to 10 degrees above the horizon, and are in an environment with limited possibilities for multi-path interference will be established. The locations chosen for the GPS base locations will meet the criteria in Section B.2.a through B.2.c in the “Guidelines for New and Existing Continuously Operating Reference Stations (CORS),” version February 2006. If possible and convenient, a Primary Airport control Station (PACS) or Secondary Airport Control Station (SACS) should be used as a GPS base station. For those locations selected that do not have a pre-existing geodetic survey mark, at a minimum, a PK (Parker-Kalon) nail will be set with a cone or stake marking the spot.
As indicated in the “NGS Operations Handbook,” a site description, log, and layout sketch must be made. The sketch must include the location of the marks, tripod, antennae, buildings, and any other identifying characteristics of the area on the sketch, as well as the exact height of the antenna reference point above the geodetic mark. Photographs will be taken of the antenna, site layout, reference stations, and any unusual situations, including at least a close up of the mark, an eye view of the mark, and a horizon shot of the set up antenna and tripod, facing each of the cardinal directions. Requirements for collecting digital photos of marks are specified in “REQUIREMENTS FOR DIGITAL PHOTOGRAPHS OF SURVEY MARKS AND CORS ANTENNAS,” Version 13C, January 31, 2008.
ii. Positioning New Base Station Locations (only if needed)
Page 6 of 55
Positions of the base stations must be accurate to 1 cm in the ellipsoidal reference frame. Data collection will be accomplished at 30 second epoch intervals and satellites tracked down to a 10-degree elevation mask. A minimum 24-hour session will be observed with geodetic quality dual-frequency receivers. Station occupation and observing procedures will be carried out in accordance with the "NGS Operations Handbook" and appropriate equipment user manuals.
Initial positions will be processed through NGS’ OPUS (On-line Positioning User Service). The height of the unit should be specified as 0.00 meters so that OPUS-S returns the ARP (antenna reference point). The OPUS-S solutions must be attached to the field report as an Appendix and the final positions from OPUS (latitude, longitude, ellipsoidal height, and errors in all directions) in ITRF00 coordinates entered into the summary document within the field report. The GPS data will be submitted as part of the field report in its raw format and in RINEX. The data will be submitted on a DVD along with the gravity data (see Data Collection below).
b. Aircraft Installation Airborne instruments will be installed aboard the aircraft in accordance with the pre-engineered specifications, which will be provided by the GRAV-D project manager in advance of the installation date. Lever arm measurements will be taken between the TAGS gravimeter, all IMU(s), all GPS antenna(s), and the aircraft center of gravity. Lever arm distances will be measured to within an accuracy of 1cm and recorded on the required installation worksheets. The lever arm will be measured, if possible, with surveying instruments. If this is not possible, a tape measure will be used. The survey team will be provided with the reconnaissance report that will include an absolute gravity value at the location of the aircraft and at the height of the gravimeter.
When the TAGS gravimeter is installed on the aircraft, TAGS calibrations (such as Beam Zero, Level and Gain Adjustment/Calibration) will be performed as outlined in the TAGS manual and calibration results will be recorded on the required installation worksheets. At least one test flight of sufficient length will be performed to verify that all instruments and the aircraft autopilot are operating according to specifications. The raw data from the test flight will be immediately uploaded and a notification sent to the GRAV-D office team. The field team will use the Issac software to verify the data on the ground as well as the test flight to demonstrate that all instruments and aircraft equipment are working. Survey data collection will proceed when either the test flight data have been verified by the GRAV-D project manager (or a designated alternate) or 24 hours have elapsed since notification.
2. Data Collection
The survey layout and flight plans will be provided to the field team prior to the survey. Flights may be flown on days when the field team and pilots deem the weather to be sufficiently clear of turbulence and clouds at the designated 20,000 ft (FL200) flying altitude. However, flight altitude may be adjusted a maximum of 3,000 ft higher or lower than the designated altitude on any given flight, if pilots suspect that flight conditions will be less turbulent and more cloud-free at that level. While the altitude may change between lines, the altitude should not change during a flight line. In addition, flights may only be flown when all of the following instruments (at a minimum) are fully functional: gravimeter, one
Page 7 of 55
IMU, one GPS on the plane, and one GPS base station. The field team and pilot may cancel or abort flights as needed based on their evaluation of the weather, aircraft, personnel, and instrument status.
During the survey the field team will maintain daily logs that provide a status update to the GRAV-D project manager and a record of events for use in post-processing. A Master Register for the survey, including events or facts worthy of note, will be kept on Google Docs in order to inform office staff of daily happenings. The notes in the register are often useful during data processing. In addition, the Survey and Hours Log will be updated on Google Docs after each flight (takeoff to landing) and provide, at a minimum, the date, start and stop times, lines collected, latitude and longitude where data started and stopped for each line, operators, flight hours, and any flight events (such as weather, instrument malfunction, etc.). An entry must be made in the Survey and Hours Log every day, even during down days, with the reason for the down day being recorded (e.g. weather, instrument or aircraft problems).
Data, flights and all references to data or flights will conform to the following standard naming convention:
• Planned flights will be labeled with the block name (two letters and two numbers) followed by a progression count of two digits (e.g. AN07_01).
• Flight lines will be labeled with the block name followed by a numeric indication of the type of line. Data lines will be numbered in the 100s with re-flights of data lines in the 200s, 300s or 400s having the same last two digits.
• Cross lines will be numbered in the 500s with re-flights of cross lines starting in the 600s. • Lines of opportunity, often transit lines, will be labeled in the 900s.
For example, AN07101 would be the first data line planned in block AN07 and AN07201 the first re-flight of that data line. The adjacent data line would be AN07102, followed by AN07103, AN07104, etc.
a. GPS Data During airborne gravity observations GPS data collection shall be accomplished at 1-second epoch intervals and will track satellites down to a 5-degree or less elevation angle. GPS base stations and aircraft antenna must operate continuously while gravity flights are in progress. At least 15 minutes of stationary GPS data must be collected on both the base stations and receivers on the aircraft prior to departure. During each station occupation, the operators will carefully monitor the operation of the receivers. Any irregularities in the data due to equipment malfunction, DOD adjustment of the satellite orbit, obstructions, etc., must be reported to the GRAV-D project manager as soon as possible. If the quality of observations for an observing session is questionable, notify the GRAV-D project manager. Loss of base station and/or airborne GPS data may require re-flights.
b. Gravity Data During gravity data collection, events will be recorded on flight logs and all flights and major events recorded post-flight on the Survey and Hours Log. Flight log notes should include any large variation in accelerations, beam velocity, turbulence, wind and ground speed measurements from the pilot three times per line, and unexpected in-flight changes. The relative gravity measurement aboard the aircraft must be calibrated to the absolute gravity measurement from the reconnaissance survey. Immediately before and after each flight a still reading will be done where the total correction is less than +/- 0.6
Page 8 of 55
counter units. During the flight, cross-track and along-track accelerometers on the TAGS should not regularly exceed 15-20 Gals, or data quality may be suspect. The TAGS beam voltage must not meet or exceed +/- 5 volts for the data to be recoverable. Operator will also note if the meter drift exceeds 1 mGal and notify the GRAV-D project manager. If these metrics are not met during a flight it is likely the line(s) will need to be re-flown. See Section 3. “Field Quality Control.”
c. Data Submission During the survey all raw and processed data will be backed up daily to a primary survey hard drive, a transfer drive, and the raw data to the Survivor thumb drive. At the conclusion of the survey, the transfer drive with the complete version of the raw and processed data will be shipped to the GRAV-D project manager. All metadata, including the logbooks, worksheets, and final report, will be included with the final data submission.
All data submissions will be checked for completion by the Silver Spring office. A “Data Ingestion Report” will be provided to the field team shortly after each data submission and any problems or questions identified on the report will be addressed by the field team before the data submission is considered complete. This could include sending additional data or documentation to the GRAV-D project manager.
3. Data Quality Control
During the survey the GPS and gravity data will be monitored to ensure a minimum quality level. This requires reviewing the data from all sensors to verify that data is able to be processed and to identify whether or not a flight should be re-flown. The GRAV-D project manager will be notified of and approve all proposed re-flights. One additional re-flight will be done over two data lines already collected and known to be of good quality. This re-flight is for use in validating final data processing methodology. This required re-flight will be proposed by the field team and approved by the GRAV-D project manager prior to flight by the middle of the survey.
All data will be downloaded at the end of the day and copied to the field laptop for Quality Control (QC) processing. QC processing and downloads will be recorded each day in the QC Processing Log and the Download and Backup log respectively. During normal operations, QC processing is to be done daily, if possible, and prior to the next day’s flight(s). If problems are suspected, data should be downloaded and evaluated after each flight.
QC processing will be done for GPS and gravity data using the ITRF00 datum and WGS-84 ellipsoid. GPS data will be evaluated using the latest version of Waypoint Inertial Explorer (IE). Cycle slips will be checked daily on both L1 and L2 frequencies for all GPS units (ground and rover).Cycle slips that occur often, in a regular pattern across time or satellites or in satellites high in the sky will be reported to the GRAV-D Project Manager. Processing will use the precise base station positions provided in the reconnaissance report. A tightly coupled GPS+IMU combined solution will be calculated with Multipass, followed by a pass of the IE smoother. After smoothing, an acceptal GPS solution will have vertical combined separations of +/- 0.1 meters or less and PDOP below 5. The solution will be exported using the GRAV-D “TAGS.txt” format.
Page 9 of 55

Gravity data will be processed using the GPS+IMU combined solution with the best software available to produce a free-air gravity QC product. That product will be examined with the tools on hand (mapped, compared to a global gravity field, etc.) to determine its quality and whether a re-flight may be necessary. Using the Isaac results, the difference from EGM08 should not exceed a range of 10 mGals (+/-5 mGals from the mean). All processing details will be recorded in the QC Processing log book and any QC maps/plots made available to the Silver Spring office team.
In addition to the correspondence to EGM08 criteria for choosing to re-fly a line, obvious errors with the instrument or aircraft, or unexpected jumps, spikes, and inconsistencies would indicate the need for a re-flight. If there is any uncertainty on whether a line should be re-flown, data for that flight and any QC processing results should be sent to the support staff in Silver Spring for processing and the final call will be made by the GRAV-D project manager.
Should there be any reason to believe there may be a chronic problem, such as instrument or aircraft malfunction, the field team will contact the GRAV-D project manager immediately. Catching problems early is critical to reduce the costs of re-flights. To assist communication between the field and office there will be a bi-weekly teleconference to coordinate activities and address any problems.
Airborne Operations Deliverables A summary of the deliverables described above is provided below with specific details on storage location. This list is the minimum requirement and other documents or data may be shared or requested. Changes to the items below or the minimum sections of the Field Report Outline must be approved by the GRAV-D project manager.
1. Minimum Deliverables a. Field Report (Email)
b. Includes summary of survey, photographs, diagrams, maps, and worksheets b. Log Books (Google Docs)
a. Master Register b. Survey and Hours Log c. QC Processing Log d. Download and Backup Log
c. Gravity and GPS Data (mailed on a hard drive) d. Intermediate Products During Survey
a. Flight Plans b. Preliminary Gravity Maps
2. Field Report Outline Title Page Table of Contents I. Introduction II. Survey Overview
a. Airport, location, blocks, dates, personnel, collaborators III. Instrument Set-up and Operations
a. Base Stations b. Aircraft Instrumentation c. Gravity Tie
Page 10 of 55

IV. Data Collection a. Flight Plans b. Actual Flights c. GPS Data d. Gravity Data
V. Quality Control Appendices added as appropriate
3. Folder Structure for Data Delivery a. Base – all information related to the base stations
i. Base 1 ii. Base 2
iii. Base 3 b. Grav – all information related to Gravity
i. Includes .dat, .env and screenshots of still readings c. Metadata – any metadata related to data collection
i. Includes filled out meta_f##.txt and scanned flight logs d. Remote – all information related to GPS remote
i. DLV (or other additional remote) ii. SPAN (.log file)
Page 11 of 55

Contact Information The street address for those located in building SSMC3 is: 1315 East-West Highway Silver Spring, MD 20910-3282 Questions concerning general survey operations shall be directed to: Mark Eckl Chief, Observation and Analysis Division SSMC3 -- N/NGS4, Station 8558 Telephone: (301) 713-3176, ext. 117 FAX: (301) 713-4327 E-mail: [email protected] Questions concerning project design and execution shall be directed to: Vicki Childers Chief, Survey Section B and GRAV-D Project Manager SSMC3 -- N/NGS412, Station 8535 Telephone: (301) 713-3211, ext. 161 FAX: (301) 713-4327 E-mail: [email protected] Questions concerning flight planning shall be directed to: Monica Youngman ` Management and Budget Analyst SSMC3 – N/NGS, Station Telephone: (301) 713-3234, ext. 149 FAX: E-mail: [email protected] Questions concerning GPS or Gravity processing, or data management shall be directed to: Carly Weil Contractor, Survey Section B SSMC3 -- N/NGS412, Station 8414 Telephone: (301) 713-3215 FAX: (301) 713-4327 E-mail: [email protected]
Page 12 of 55
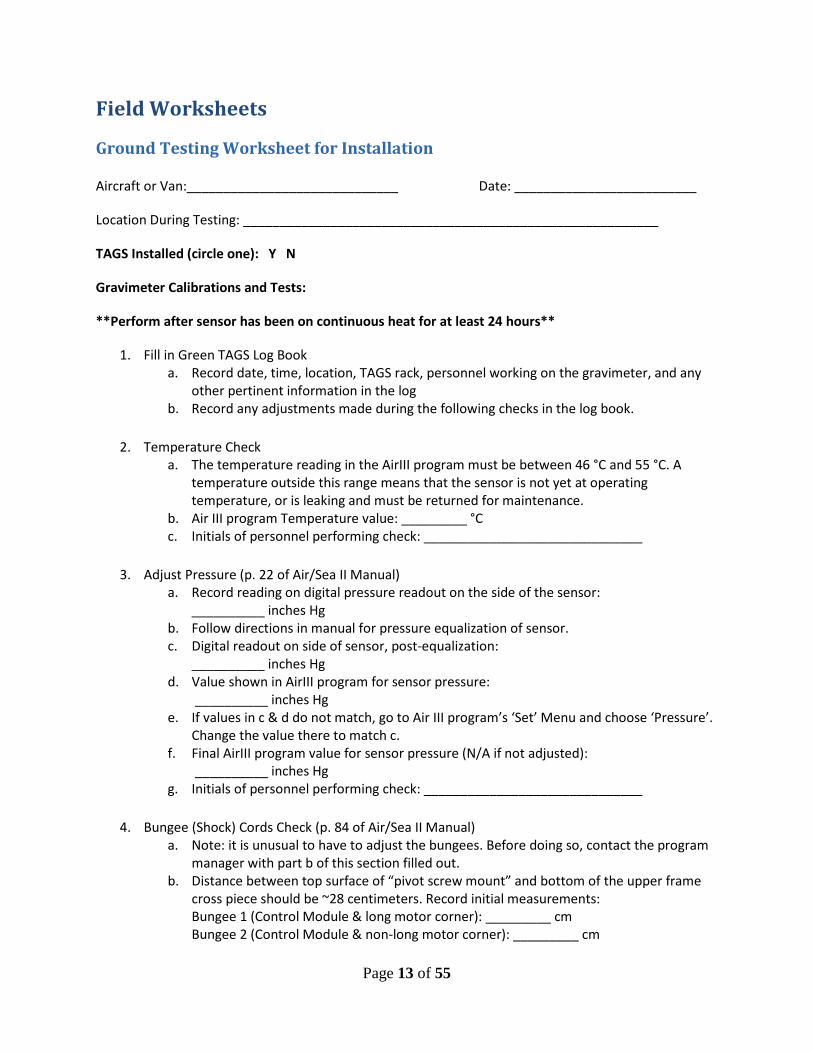
Field Worksheets
Ground Testing Worksheet for Installation
Aircraft or Van:_____________________________ Date: _________________________
Location During Testing: _________________________________________________________
TAGS Installed (circle one): Y N
Gravimeter Calibrations and Tests:
**Perform after sensor has been on continuous heat for at least 24 hours**
1. Fill in Green TAGS Log Book a. Record date, time, location, TAGS rack, personnel working on the gravimeter, and any
other pertinent information in the log b. Record any adjustments made during the following checks in the log book.
2. Temperature Check
a. The temperature reading in the AirIII program must be between 46 °C and 55 °C. A temperature outside this range means that the sensor is not yet at operating temperature, or is leaking and must be returned for maintenance.
b. Air III program Temperature value: _________ °C c. Initials of personnel performing check: ______________________________
3. Adjust Pressure (p. 22 of Air/Sea II Manual)
a. Record reading on digital pressure readout on the side of the sensor: __________ inches Hg
b. Follow directions in manual for pressure equalization of sensor. c. Digital readout on side of sensor, post-equalization:
__________ inches Hg d. Value shown in AirIII program for sensor pressure:
__________ inches Hg e. If values in c & d do not match, go to Air III program’s ‘Set’ Menu and choose ‘Pressure’.
Change the value there to match c. f. Final AirIII program value for sensor pressure (N/A if not adjusted):
__________ inches Hg g. Initials of personnel performing check: ______________________________
4. Bungee (Shock) Cords Check (p. 84 of Air/Sea II Manual)
a. Note: it is unusual to have to adjust the bungees. Before doing so, contact the program manager with part b of this section filled out.
b. Distance between top surface of “pivot screw mount” and bottom of the upper frame cross piece should be ~28 centimeters. Record initial measurements: Bungee 1 (Control Module & long motor corner): _________ cm Bungee 2 (Control Module & non-long motor corner): _________ cm
Page 13 of 55

Bungee 3 (Power Module & long motor corner): _________ cm Bungee 4 (Power Module & non-long motor corner): _________ cm
c. Note here which, if any, bungees were adjusted and their final measurements: _________________________________________________________________
d. Initials of personnel performing check/adjustment: ________________________
5. Accelerometer Adjustment (p. 85 of Air/Sea II Manual) a. If bubble levels are not in the center, after 5-10 minutes of the aircraft/van being still,
perform an adjustment. *Be patient and wait 5-10 minutes after each adjustment for the platform to adjust its level*
b. Note here which, if any, accelerometers were adjusted: _____________________ c. If it is not a windy day and the plane/van is still, do the following c through f:
In the AirIII program, the accelerometers appear to vary around: ______ +/- ______ Gals in the cross axis ______ +/- ______ Gals in the long axis
d. If these values are not 0.0 Gals +/- 0.1 Gals, bring up the AirIII ‘Set’ Menu. When the accelerometers both read close to zero, click ‘Set accelerometers’.
e. The accelerometers now vary around: ______ +/- ______ Gals in the cross ______ +/- ______ Gals in the long
f. Initials of personnel performing adjustment: ______________________________
6. Beam Zero (p. 82 of Air/Sea II Manual) a. Initial galvanometer voltage while clamped:
________ +/- ________ b. If voltage is not 0.000 V +/- 0.010 V, follow directions on p. 82 c. Final voltage on Galvanometer (enter N/A if not adjusted):
________ +/- ________ d. Initials of personnel performing calibration: ______________________________
7. Beam Gain (p. 82 of Air/Sea II Manual)
a. Initial galvanometer voltage at upper stop: ________ +/- ________
b. If voltage is not 5.000 V +/- 0.010 V, follow directions on p. 82 c. Final galvanometer voltage at upper stop (enter N/A if not adjusted):
_______ +/- ________ d. Initials of personnel performing calibration: ______________________________
8. Still Reading
a. Allow the gravimeter to settle. Time: _________________ UTC Total Correction: __________ CU Spring Tension: _____________ CU Gravity: ________________ CU QC Gravity: _________________ mGal
Page 14 of 55

b. Initials of personnel performing still reading: _____________________________
9. Spring Tension (p. 65 of Air/Sea II Manual) a. After still reading, value on sensor’s spring tension counter:
________________ CU b. Value in AirIII program for spring tension:
________________ CU c. If values in a & b do not match, go to Air III program’s ‘Set’ Menu and choose ‘Spring
Tension’. Change the value there to match c. d. Final AirIII value for spring tension (enter N/A if not adjusted):
________________ CU e. Initials of personnel performing calibration: ______________________________
10. K-Factor Check (p.83 of Air/Sea Manual)
a. While gravimeter is still, follow directions on p. 83. b. Before slew:
Spring Tension _____________ CU Total Correction ____________ CU
c. Slew +30 CU, wait 5 minutes: Spring Tension _____________ CU Total Correction ____________ CU
d. Slew -60 CU, wait 5 minutes: Spring Tension _____________ CU Total Correction ____________ CU
e. Difference between two Total Corrections (c & d): _______________ CU
f. If value in e is within 60 CU +/- 3 CU, open the configuration file and record the existing K-Factor here: ____________________
g. If the value in e is not within 60 CU +/- 3 CU, recheck the beam zero and gain. Was beam zero readjusted? ______ If yes, record values to right of previous result Was bean gain readjusted? ______ If yes, record values to right of previous result If yes to either above, take another still reading & record values to right of previous reading. Then redo K-Factor Check and write values to right of previous results. If TC difference still not within tolerance, follow directions in manual to calculate a new one. New K-Factor (N/A if not adjusted): _______________ Open configuration file and replace old K-Factor with new one.
h. Initials of personnel performing calibration: ______________________________
Page 15 of 55
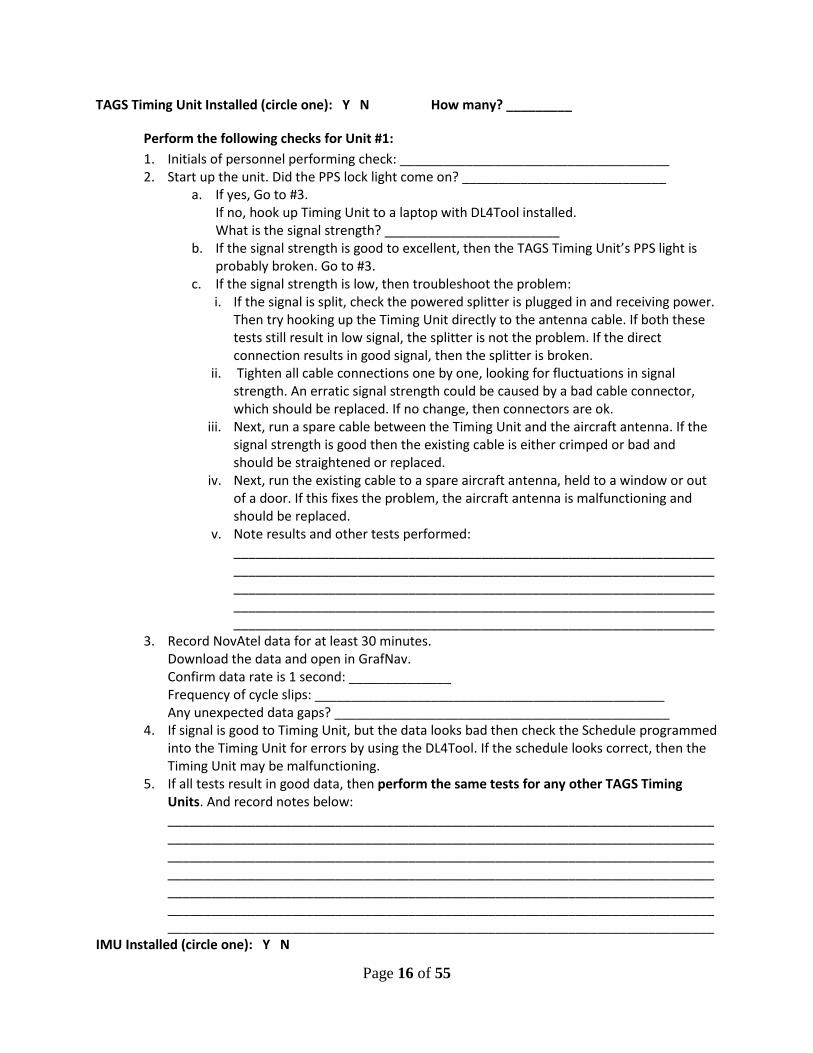
TAGS Timing Unit Installed (circle one): Y N How many? _________
Perform the following checks for Unit #1: 1. Initials of personnel performing check: _____________________________________ 2. Start up the unit. Did the PPS lock light come on? ____________________________
a. If yes, Go to #3. If no, hook up Timing Unit to a laptop with DL4Tool installed. What is the signal strength? ________________________
b. If the signal strength is good to excellent, then the TAGS Timing Unit’s PPS light is probably broken. Go to #3.
c. If the signal strength is low, then troubleshoot the problem: i. If the signal is split, check the powered splitter is plugged in and receiving power.
Then try hooking up the Timing Unit directly to the antenna cable. If both these tests still result in low signal, the splitter is not the problem. If the direct connection results in good signal, then the splitter is broken.
ii. Tighten all cable connections one by one, looking for fluctuations in signal strength. An erratic signal strength could be caused by a bad cable connector, which should be replaced. If no change, then connectors are ok.
iii. Next, run a spare cable between the Timing Unit and the aircraft antenna. If the signal strength is good then the existing cable is either crimped or bad and should be straightened or replaced.
iv. Next, run the existing cable to a spare aircraft antenna, held to a window or out of a door. If this fixes the problem, the aircraft antenna is malfunctioning and should be replaced.
v. Note results and other tests performed: __________________________________________________________________________________________________________________________________________________________________________________________________________________________________________________________________________________________________________________________________________
3. Record NovAtel data for at least 30 minutes. Download the data and open in GrafNav. Confirm data rate is 1 second: ______________ Frequency of cycle slips: ________________________________________________ Any unexpected data gaps? ______________________________________________
4. If signal is good to Timing Unit, but the data looks bad then check the Schedule programmed into the Timing Unit for errors by using the DL4Tool. If the schedule looks correct, then the Timing Unit may be malfunctioning.
5. If all tests result in good data, then perform the same tests for any other TAGS Timing Units. And record notes below: _____________________________________________________________________________________________________________________________________________________________________________________________________________________________________________________________________________________________________________________________________________________________________________________________________________________________________________________________________________________________________________________________________________
IMU Installed (circle one): Y N
Page 16 of 55

Follow usual start-up procedures and note any problems plus their solutions: ______________________________________________________________________________ ______________________________________________________________________________ ______________________________________________________________________________ ______________________________________________________________________________ ______________________________________________________________________________ ______________________________________________________________________________ ______________________________________________________________________________ ______________________________________________________________________________ ______________________________________________________________________________ ______________________________________________________________________________ ______________________________________________________________________________ Initials of personnel performing check: _____________________________________ Magnetometer Installed (circle one): Y N Follow install procedures and note any problems plus their solutions: ______________________________________________________________________________ ______________________________________________________________________________ ______________________________________________________________________________ ______________________________________________________________________________ ______________________________________________________________________________ ______________________________________________________________________________ ______________________________________________________________________________ ______________________________________________________________________________ ______________________________________________________________________________ ______________________________________________________________________________ ______________________________________________________________________________ Initials of personnel performing check: _____________________________________
Page 17 of 55
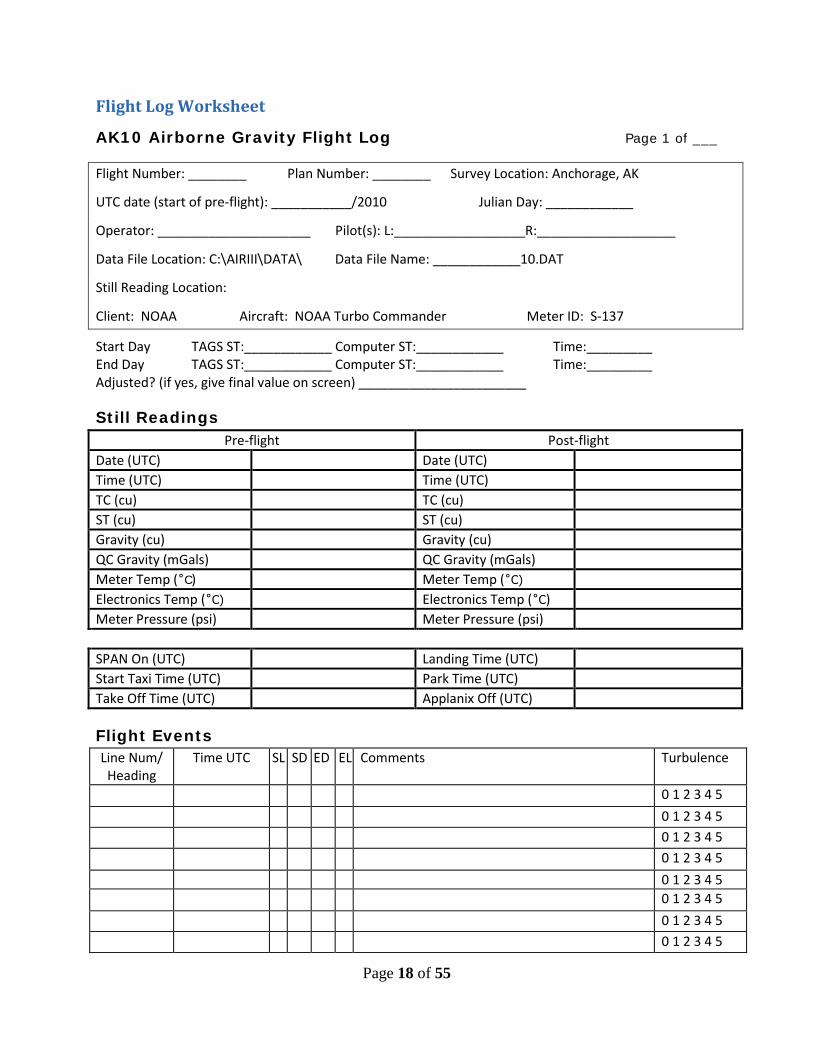
Flight Log Worksheet
AK10 Airborne Gravity Flight Log Page 1 of ___
Flight Number: ________ Plan Number: ________ Survey Location: Anchorage, AK
UTC date (start of pre-flight): ___________/2010 Julian Day: ____________
Operator: _____________________ Pilot(s): L:__________________R:___________________
Data File Location: C:\AIRIII\DATA\ Data File Name: ____________10.DAT
Still Reading Location:
Client: NOAA Aircraft: NOAA Turbo Commander Meter ID: S-137
Start Day TAGS ST:____________ Computer ST:____________ Time:_________ End Day TAGS ST:____________ Computer ST:____________ Time:_________ Adjusted? (if yes, give final value on screen) _______________________
Still Readings Pre-flight Post-flight
Date (UTC) Date (UTC) Time (UTC) Time (UTC) TC (cu) TC (cu) ST (cu) ST (cu) Gravity (cu) Gravity (cu) QC Gravity (mGals) QC Gravity (mGals) Meter Temp (˚C) Meter Temp (˚C) Electronics Temp (˚C) Electronics Temp (˚C) Meter Pressure (psi) Meter Pressure (psi) SPAN On (UTC) Landing Time (UTC) Start Taxi Time (UTC) Park Time (UTC) Take Off Time (UTC) Applanix Off (UTC)
Flight Events Line Num/
Heading Time UTC SL SD ED EL Comments Turbulence
0 1 2 3 4 5 0 1 2 3 4 5 0 1 2 3 4 5 0 1 2 3 4 5 0 1 2 3 4 5 0 1 2 3 4 5 0 1 2 3 4 5 0 1 2 3 4 5
Page 18 of 55

Flight Number: _____ Plan Number: ______ Survey Location: ______________ Page 2 of ___
Flight Events Line Num/
Heading Time UTC SL SD ED EL Comments Turbulence
0 1 2 3 4 5 0 1 2 3 4 5 0 1 2 3 4 5 0 1 2 3 4 5 0 1 2 3 4 5 0 1 2 3 4 5 0 1 2 3 4 5 0 1 2 3 4 5 0 1 2 3 4 5 0 1 2 3 4 5 0 1 2 3 4 5 0 1 2 3 4 5 0 1 2 3 4 5 0 1 2 3 4 5 0 1 2 3 4 5 0 1 2 3 4 5 0 1 2 3 4 5 0 1 2 3 4 5 0 1 2 3 4 5 0 1 2 3 4 5 0 1 2 3 4 5 0 1 2 3 4 5 0 1 2 3 4 5 0 1 2 3 4 5 0 1 2 3 4 5 0 1 2 3 4 5 0 1 2 3 4 5 0 1 2 3 4 5 0 1 2 3 4 5 0 1 2 3 4 5 0 1 2 3 4 5 0 1 2 3 4 5 0 1 2 3 4 5 0 1 2 3 4 5
Page 19 of 55
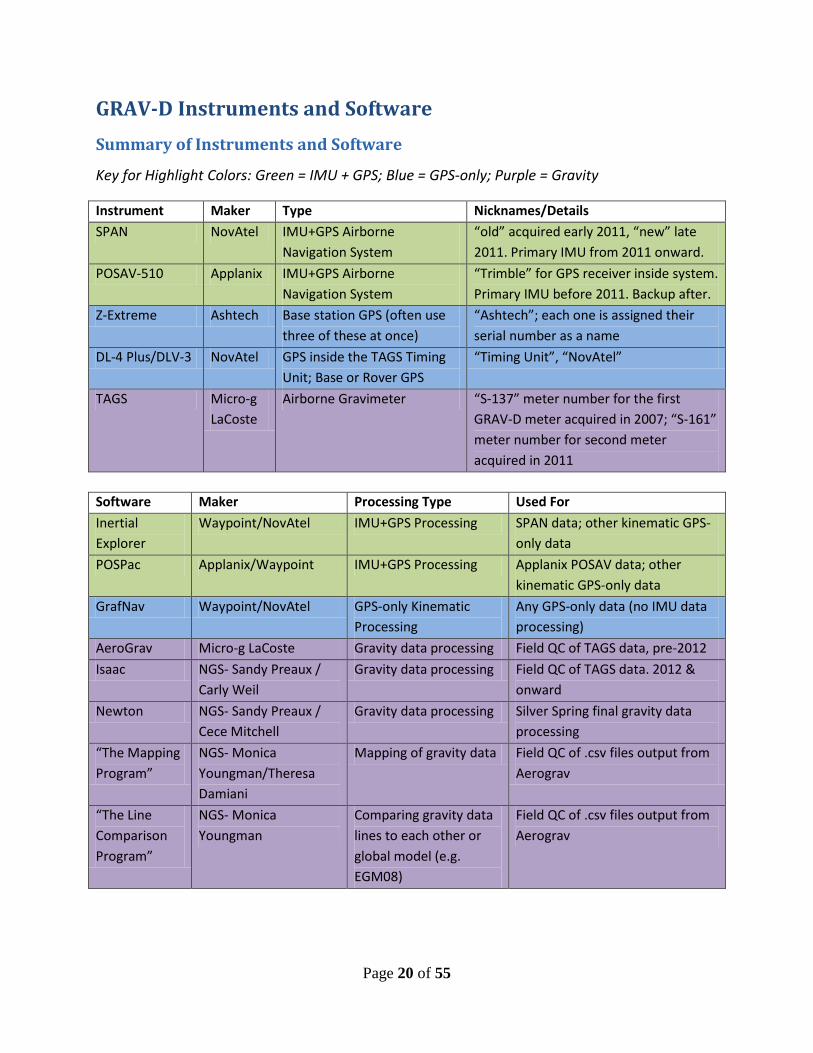
GRAV-D Instruments and Software Summary of Instruments and Software
Key for Highlight Colors: Green = IMU + GPS; Blue = GPS-only; Purple = Gravity
Instrument Maker Type Nicknames/Details SPAN NovAtel IMU+GPS Airborne
Navigation System “old” acquired early 2011, “new” late 2011. Primary IMU from 2011 onward.
POSAV-510 Applanix IMU+GPS Airborne Navigation System
“Trimble” for GPS receiver inside system. Primary IMU before 2011. Backup after.
Z-Extreme Ashtech Base station GPS (often use three of these at once)
“Ashtech”; each one is assigned their serial number as a name
DL-4 Plus/DLV-3 NovAtel GPS inside the TAGS Timing Unit; Base or Rover GPS
“Timing Unit”, “NovAtel”
TAGS Micro-g LaCoste
Airborne Gravimeter “S-137” meter number for the first GRAV-D meter acquired in 2007; “S-161” meter number for second meter acquired in 2011
Software Maker Processing Type Used For Inertial Explorer
Waypoint/NovAtel IMU+GPS Processing SPAN data; other kinematic GPS-only data
POSPac Applanix/Waypoint IMU+GPS Processing Applanix POSAV data; other kinematic GPS-only data
GrafNav Waypoint/NovAtel GPS-only Kinematic Processing
Any GPS-only data (no IMU data processing)
AeroGrav Micro-g LaCoste Gravity data processing Field QC of TAGS data, pre-2012 Isaac NGS- Sandy Preaux /
Carly Weil Gravity data processing Field QC of TAGS data. 2012 &
onward Newton NGS- Sandy Preaux /
Cece Mitchell Gravity data processing Silver Spring final gravity data
processing “The Mapping Program”
NGS- Monica Youngman/Theresa Damiani
Mapping of gravity data Field QC of .csv files output from Aerograv
“The Line Comparison Program”
NGS- Monica Youngman
Comparing gravity data lines to each other or global model (e.g. EGM08)
Field QC of .csv files output from Aerograv
Page 20 of 55

User Guides and Help Files
Issac User Guide and Help File
Preparing to Run Isaac ..................................................................................................................... 22
Downloading and Installing the Program ............................................................................................... 22 Where to Run the Program ..................................................................................................................... 22 Necessary Input Files .............................................................................................................................. 22
Step-by-Step Instructions for Running the Program ........................................................................... 23 Overview of Isaac Plots and Output Files .................................................................................... 29
Time Delay Plot ....................................................................................................................................... 29 Trim Track Plots ....................................................................................................................................... 29 Gravity vs. Time” Stoplight Plot .............................................................................................................. 29 Difference from EGM08” Plot ................................................................................................................. 30 Free-Air Disturbance” Plot ...................................................................................................................... 30 Output Files from Isaac ........................................................................................................................... 30
QC Guidelines .................................................................................................................................. 32
Time Delay Plot ....................................................................................................................................... 32 Trim Tracks Plots ..................................................................................................................................... 34 Gravity vs. Time” Stoplight Plot .............................................................................................................. 35 Difference From EGM08” Plot ................................................................................................................ 36 Free Air Disturbance” Plot ...................................................................................................................... 37
QC Cheat Sheet ................................................................................................................................ 38 Examples of Excellent Quality Data ................................................................................................... 39 Examples of Suspect Data ................................................................................................................ 44 Additional Tools for use with Isaac Output Files ................................................................................ 46
Page 21 of 55
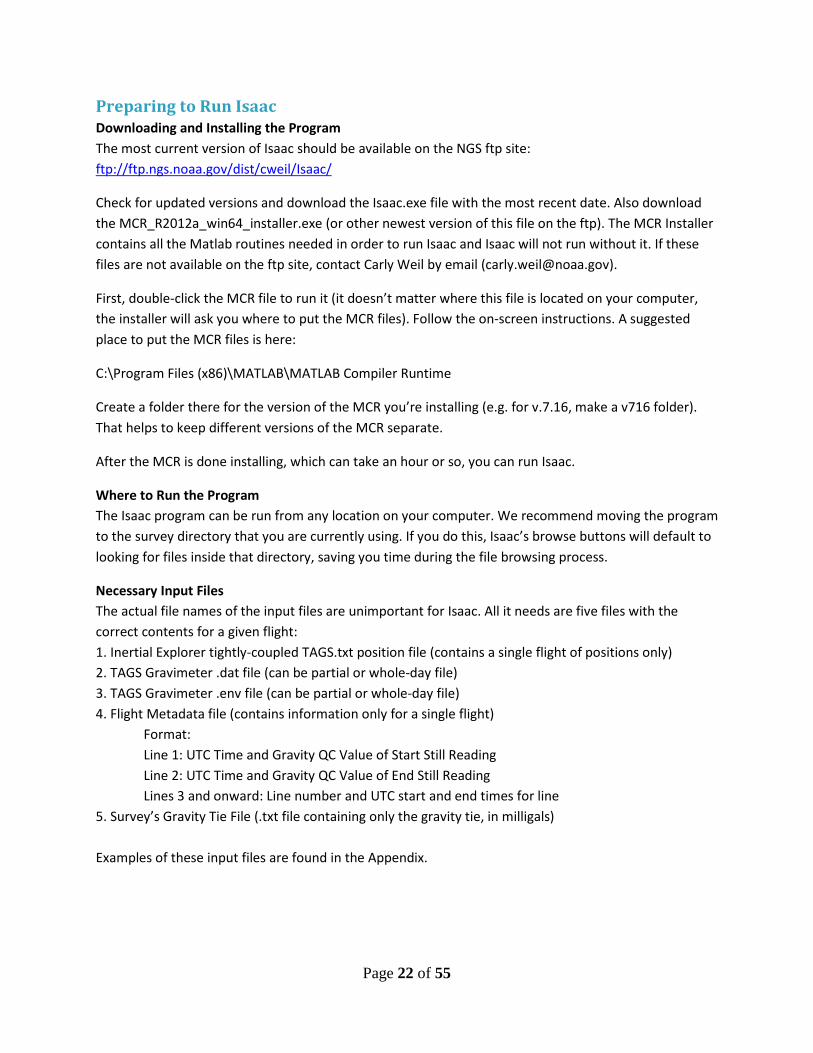
Preparing to Run Isaac Downloading and Installing the Program The most current version of Isaac should be available on the NGS ftp site: ftp://ftp.ngs.noaa.gov/dist/cweil/Isaac/
Check for updated versions and download the Isaac.exe file with the most recent date. Also download the MCR_R2012a_win64_installer.exe (or other newest version of this file on the ftp). The MCR Installer contains all the Matlab routines needed in order to run Isaac and Isaac will not run without it. If these files are not available on the ftp site, contact Carly Weil by email ([email protected]).
First, double-click the MCR file to run it (it doesn’t matter where this file is located on your computer, the installer will ask you where to put the MCR files). Follow the on-screen instructions. A suggested place to put the MCR files is here:
C:\Program Files (x86)\MATLAB\MATLAB Compiler Runtime
Create a folder there for the version of the MCR you’re installing (e.g. for v.7.16, make a v716 folder). That helps to keep different versions of the MCR separate.
After the MCR is done installing, which can take an hour or so, you can run Isaac.
Where to Run the Program The Isaac program can be run from any location on your computer. We recommend moving the program to the survey directory that you are currently using. If you do this, Isaac’s browse buttons will default to looking for files inside that directory, saving you time during the file browsing process.
Necessary Input Files The actual file names of the input files are unimportant for Isaac. All it needs are five files with the correct contents for a given flight: 1. Inertial Explorer tightly-coupled TAGS.txt position file (contains a single flight of positions only) 2. TAGS Gravimeter .dat file (can be partial or whole-day file) 3. TAGS Gravimeter .env file (can be partial or whole-day file) 4. Flight Metadata file (contains information only for a single flight) Format: Line 1: UTC Time and Gravity QC Value of Start Still Reading Line 2: UTC Time and Gravity QC Value of End Still Reading Lines 3 and onward: Line number and UTC start and end times for line 5. Survey’s Gravity Tie File (.txt file containing only the gravity tie, in milligals) Examples of these input files are found in the Appendix.
Page 22 of 55
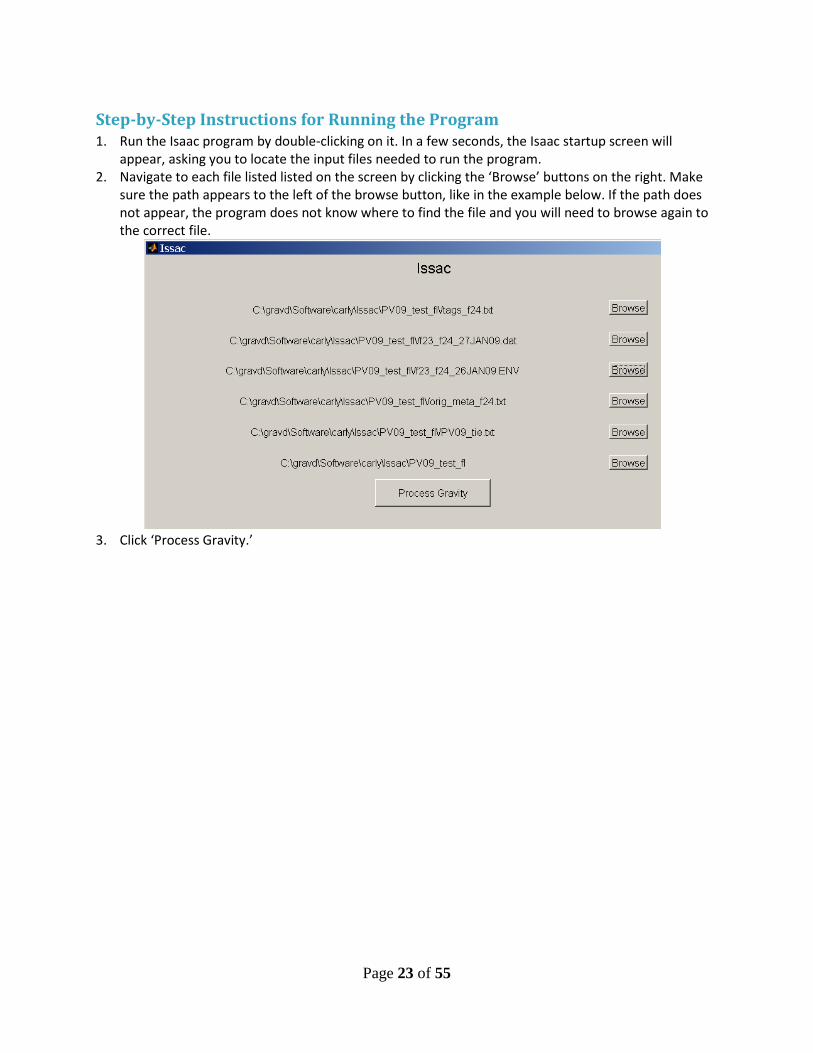
Step-by-Step Instructions for Running the Program 1. Run the Isaac program by double-clicking on it. In a few seconds, the Isaac startup screen will
appear, asking you to locate the input files needed to run the program. 2. Navigate to each file listed listed on the screen by clicking the ‘Browse’ buttons on the right. Make
sure the path appears to the left of the browse button, like in the example below. If the path does not appear, the program does not know where to find the file and you will need to browse again to the correct file.
3. Click ‘Process Gravity.’
Page 23 of 55
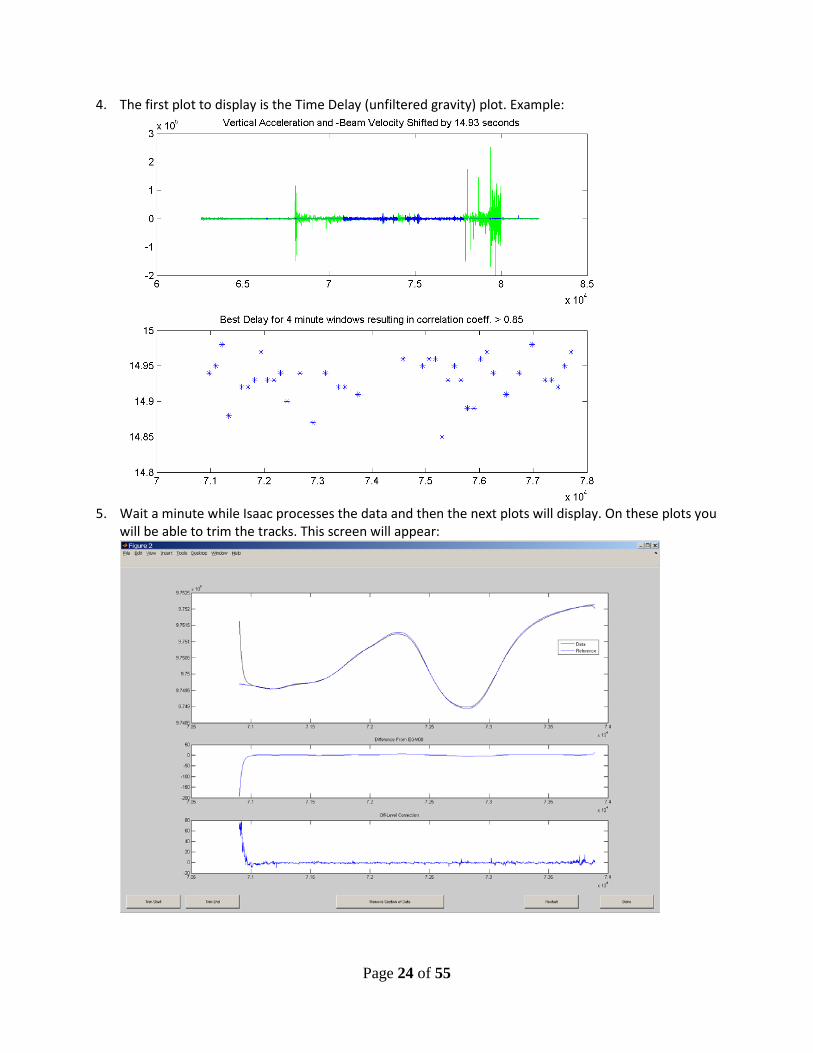
4. The first plot to display is the Time Delay (unfiltered gravity) plot. Example:
5. Wait a minute while Isaac processes the data and then the next plots will display. On these plots you
will be able to trim the tracks. This screen will appear:
Page 24 of 55
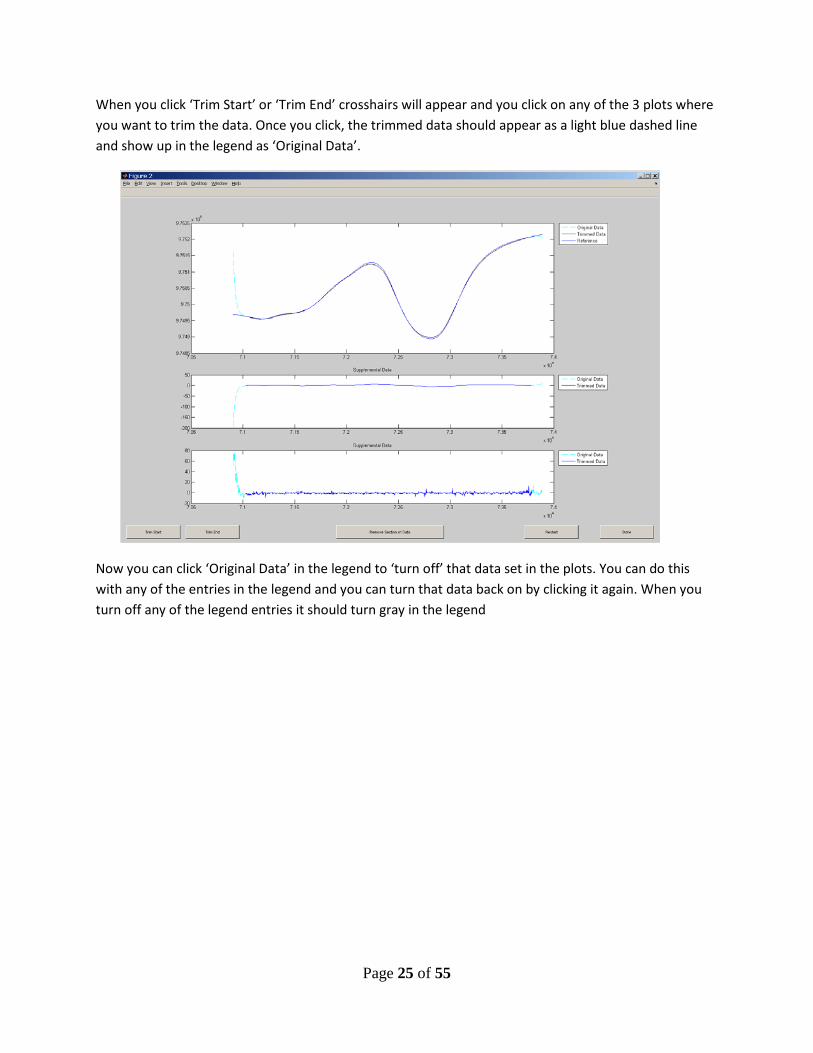
When you click ‘Trim Start’ or ‘Trim End’ crosshairs will appear and you click on any of the 3 plots where you want to trim the data. Once you click, the trimmed data should appear as a light blue dashed line and show up in the legend as ‘Original Data’.
Now you can click ‘Original Data’ in the legend to ‘turn off’ that data set in the plots. You can do this with any of the entries in the legend and you can turn that data back on by clicking it again. When you turn off any of the legend entries it should turn gray in the legend
Page 25 of 55
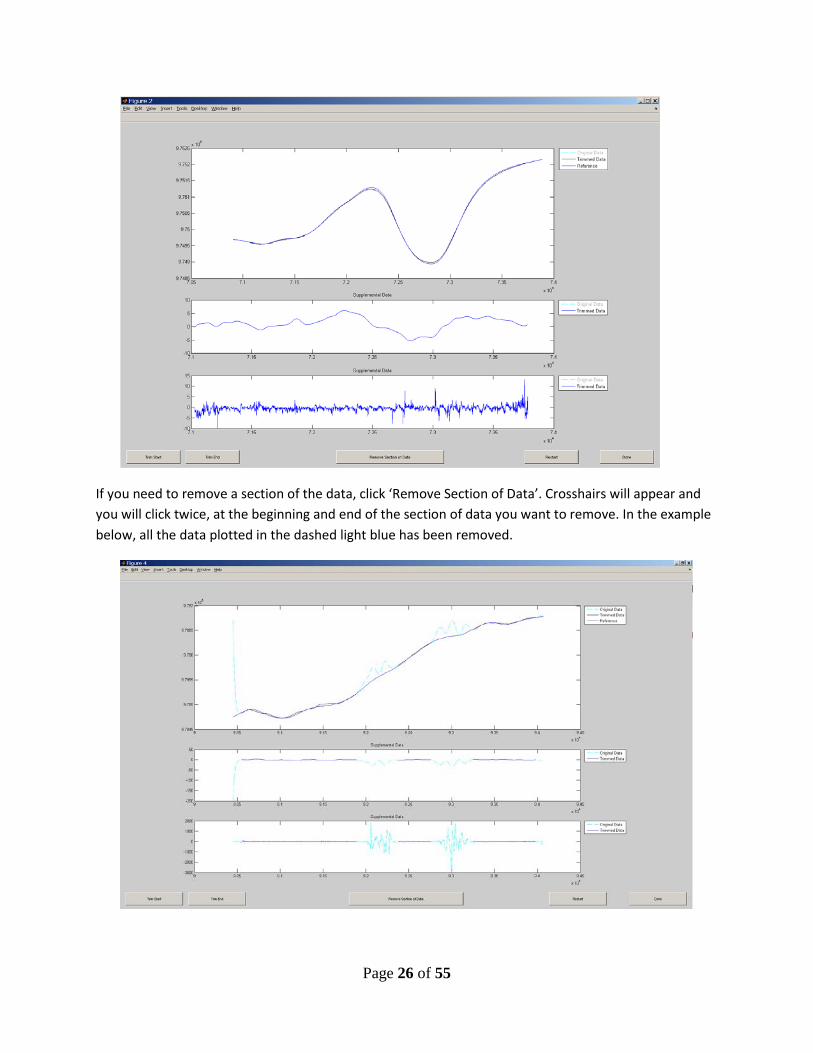
If you need to remove a section of the data, click ‘Remove Section of Data’. Crosshairs will appear and you will click twice, at the beginning and end of the section of data you want to remove. In the example below, all the data plotted in the dashed light blue has been removed.
Page 26 of 55
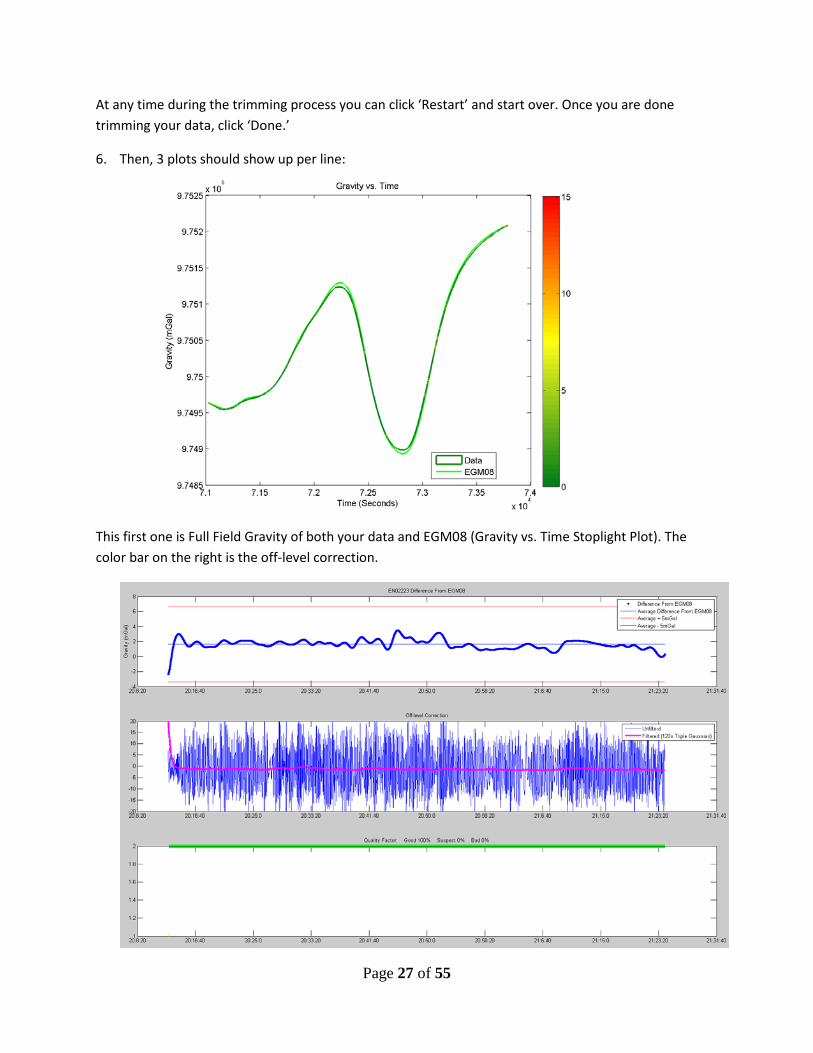
At any time during the trimming process you can click ‘Restart’ and start over. Once you are done trimming your data, click ‘Done.’
6. Then, 3 plots should show up per line:
This first one is Full Field Gravity of both your data and EGM08 (Gravity vs. Time Stoplight Plot). The color bar on the right is the off-level correction.
Page 27 of 55

This second plot is the difference of your data and EGM08.
And this third plot is the Free Air Disturbance of both your data and EGM08.
All of these plots (including the unfiltered plot) will be saved in the directory you choose on the Isaac startup screen.
Page 28 of 55

Overview of Isaac Plots and Output Files
Each time Isaac is run, it creates a series of diagnostic plots and displays them on the screen. These plots describe the health of the gravimeter/GPS and the quality of the final gravity values. This overview QC section describes the purpose of each plot and later sections describe how to best interpret the plots for QC (quality control).
Time Delay Plot After you’ve chosen all the input data files for Isaac and clicked ‘Process Gravity’, Isaac will generate the “Time Delay” plot. The purpose of this plot is to account for known and unknown lags between UTC time used by the gravimeter and GPS time. GPS time is the universally-accepted time standard, so the gravimeter’s time must be adjusted to match. There are 16 seconds (as of 7/1/12) of known lag between UTC time and GPS time since 1980 (called ‘leap seconds’, see: http://en.wikipedia.org/wiki/Leap_second). For the GRAV-D time period, the known time lag was 14 seconds until Dec. 30, 2008; then 15 seconds from January 1, 2009 until June 30, 2012; and now 16 seconds. There is also a sub-second time delay incurred as the data is physically sent from the gravimeter to the recording device along cabling and is buffered for writing to the data card. These sub-second delays vary slightly for each flight, but should generally be similar from day to day for the same instrument setup.
Trim Track Plots The next plots Isaac displays are one plot per flight line to trim data tracks. Each plot allows user-interactive trimming of the gravity data so that bad data are kept out of the final QC gravity solution. These plots also serve as the processor’s first look at the final gravity that Isaac will produce and shows how the data compares to two important metrics: a. the EGM08 global gravity model’s values of gravity along the flight line (Earth Gravity Model 2008, see: http://earth-info.nga.mil/GandG/wgs84/gravitymod/egm2008/) and b. the off-level correction applied to the gravity data. These two metrics are explained more in later sections of the guide.
“Gravity vs. Time” Stoplight Plot This plot displays the final full-field gravity (FFG) results from the Isaac processing and compares them to the best global gravity field model available (currently EGM08). Full-field gravity is the full strength of the gravity field at the latitude, longitude, and altitude that the aircraft flew. This means the FFG will be a very large number (9.7-9.9 m/s2, which is 970,000 – 990,000 mGal) with large variations along the flight line due to changes in altitude and horizontal position (details in sections below). However, when plotted along with the FFG of the EGM08 model, large differences between the model and the airborne data are easy to see.
Also, the airborne gravity data is color-coded along the line by the magnitude of the off-level correction (this is where this plot gets its “stoplight” nickname from). The off-level correction is one correction that Isaac applies to the raw gravity data to correct for motion of the aircraft sensed by the gravimeter during flight. The off-level correction is a measure of how much the gravimeter’s sensor has tilted “off its local level”. For instance, if the sensor weren’t moving
Page 29 of 55
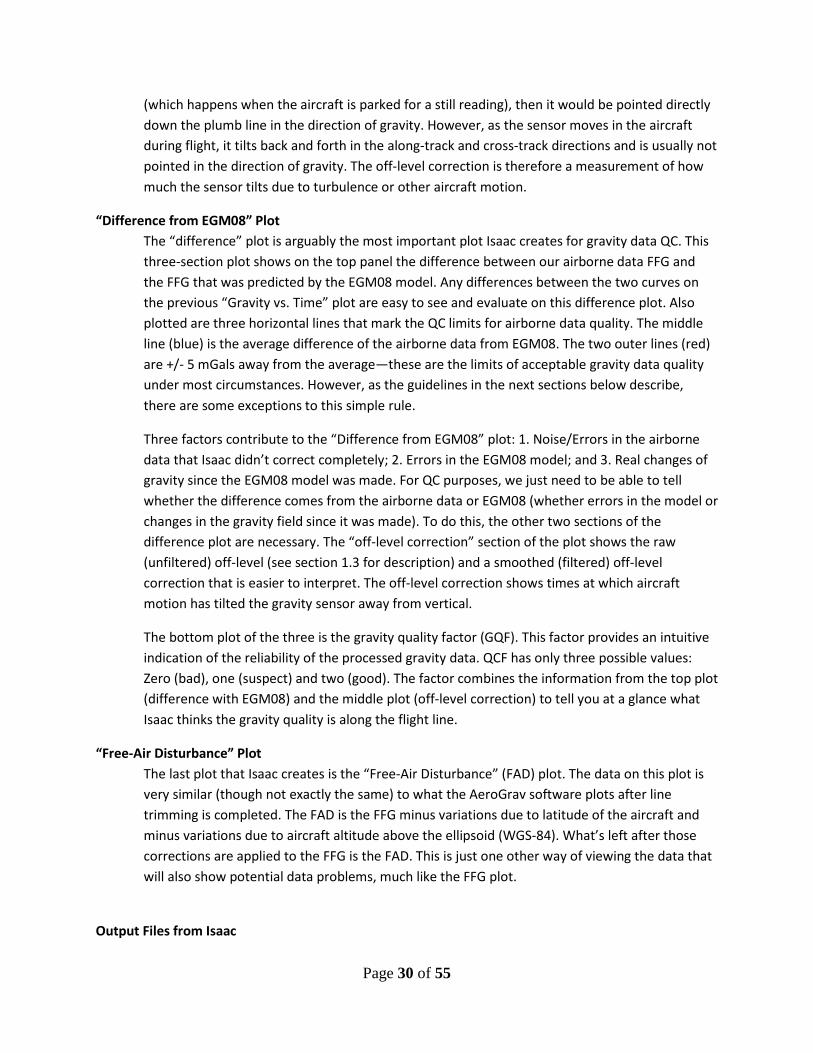
(which happens when the aircraft is parked for a still reading), then it would be pointed directly down the plumb line in the direction of gravity. However, as the sensor moves in the aircraft during flight, it tilts back and forth in the along-track and cross-track directions and is usually not pointed in the direction of gravity. The off-level correction is therefore a measurement of how much the sensor tilts due to turbulence or other aircraft motion.
“Difference from EGM08” Plot The “difference” plot is arguably the most important plot Isaac creates for gravity data QC. This three-section plot shows on the top panel the difference between our airborne data FFG and the FFG that was predicted by the EGM08 model. Any differences between the two curves on the previous “Gravity vs. Time” plot are easy to see and evaluate on this difference plot. Also plotted are three horizontal lines that mark the QC limits for airborne data quality. The middle line (blue) is the average difference of the airborne data from EGM08. The two outer lines (red) are +/- 5 mGals away from the average—these are the limits of acceptable gravity data quality under most circumstances. However, as the guidelines in the next sections below describe, there are some exceptions to this simple rule.
Three factors contribute to the “Difference from EGM08” plot: 1. Noise/Errors in the airborne data that Isaac didn’t correct completely; 2. Errors in the EGM08 model; and 3. Real changes of gravity since the EGM08 model was made. For QC purposes, we just need to be able to tell whether the difference comes from the airborne data or EGM08 (whether errors in the model or changes in the gravity field since it was made). To do this, the other two sections of the difference plot are necessary. The “off-level correction” section of the plot shows the raw (unfiltered) off-level (see section 1.3 for description) and a smoothed (filtered) off-level correction that is easier to interpret. The off-level correction shows times at which aircraft motion has tilted the gravity sensor away from vertical.
The bottom plot of the three is the gravity quality factor (GQF). This factor provides an intuitive indication of the reliability of the processed gravity data. QCF has only three possible values: Zero (bad), one (suspect) and two (good). The factor combines the information from the top plot (difference with EGM08) and the middle plot (off-level correction) to tell you at a glance what Isaac thinks the gravity quality is along the flight line.
“Free-Air Disturbance” Plot The last plot that Isaac creates is the “Free-Air Disturbance” (FAD) plot. The data on this plot is very similar (though not exactly the same) to what the AeroGrav software plots after line trimming is completed. The FAD is the FFG minus variations due to latitude of the aircraft and minus variations due to aircraft altitude above the ellipsoid (WGS-84). What’s left after those corrections are applied to the FFG is the FAD. This is just one other way of viewing the data that will also show potential data problems, much like the FFG plot.
Output Files from Isaac
Page 30 of 55

For each flight that is processed, Isaac will save the Time Delay plot (unfilt_plot.png) and will create a processing log file (log.txt) that keeps a running record of each time the flight is processed.
For each line processed, Isaac saves all three QC plots as image files (file name examples are for block EN02 Line 222, whose data is shown in the Example Excellent Data Section at the end of this Guide): Gravity vs. Time Stoplight (EN02222_fg120_1.2.png), Difference from EGM08 (EN02222_fg120_1.2._quality.png), and Free-Air Disturbance (EN02222_fg120_1.2._FAD.png).
Isaac also automatically exports the final gravity results for the line in a file called EN02222_fg120_1.2.txt (or similar). The file format is: Time since the start of the UTC day (seconds), latitude (decimal degrees), longitude (decimal degrees), ellipsoidal height (meters), Full-field gravity (mGal), and Free-Air Disturbance (mGal).
These exported data files can be used with supplementary QC programs such as the Mapping Program or Line Comparison Program for further QC of troublesome data, or for creating maps to report progress of the survey to the Project Manager.
Page 31 of 55
QC Guidelines Time Delay Plot
Description:
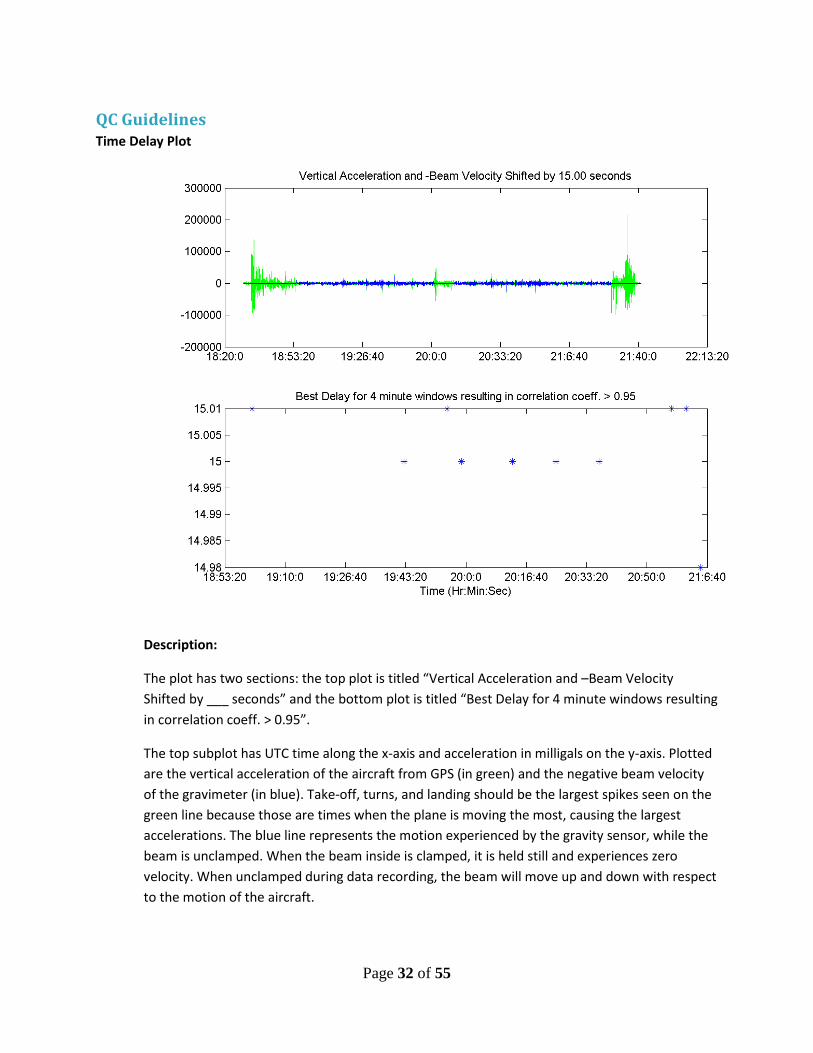
The plot has two sections: the top plot is titled “Vertical Acceleration and –Beam Velocity Shifted by ___ seconds” and the bottom plot is titled “Best Delay for 4 minute windows resulting in correlation coeff. > 0.95”.
The top subplot has UTC time along the x-axis and acceleration in milligals on the y-axis. Plotted are the vertical acceleration of the aircraft from GPS (in green) and the negative beam velocity of the gravimeter (in blue). Take-off, turns, and landing should be the largest spikes seen on the green line because those are times when the plane is moving the most, causing the largest accelerations. The blue line represents the motion experienced by the gravity sensor, while the beam is unclamped. When the beam inside is clamped, it is held still and experiences zero velocity. When unclamped during data recording, the beam will move up and down with respect to the motion of the aircraft.
Page 32 of 55

Since both the GPS and the gravimeter’s beam are sensitive to the airplane motion, we expect the two signals to be very similar. Only, there is a time delay between the two signals (see the previous section for why) and we need to figure out how many seconds the gravimeter signal lags behind the GPS signal.
So, we can perform a correlation between the two. A correlation takes one signal (the gravimeter’s beam velocity) and shifts it forward in time by a small increment, then compares how well it matches the other signal (the GPS vertical acceleration). If it’s a bad match, the correlation is low and results in a small coefficient. If it’s a good match, the correlation is high and results in coefficients between 0.95 and 1.
Plotted on that top subplot are both signals after the best correlation has been found. Isaac lists in the title of the plot what that time delay is (near 16 seconds for data collected after June 30, 2012). Looking closely, you should see spikes in the blue and green data lined up perfectly during the data collection.
In the bottom subplot, Isaac shows the different time lags it calculated as having very high correlations. The y-axis is the time lag in seconds and the x-axis is UTC time.
QC guide:
1. Check that the time delay is near 16 seconds, plus or minus a small fraction of a second (usually less than 0.5 s).
2. Check that the two signals on the top plot look aligned (peaks happen on both signals at the same time).
3. Check that the bottom subplots’ y-axis does not have points more than +/- 0.02 seconds away from the best time delay found (for example above, the delay is 15.00 seconds and the points on the bottom plot should not be greater than 15.02 seconds or less than 14.98 seconds. Since they are not, this passes time delay QC).
4. Look for any drift in the points on the bottom subplot. If the points at the right side of the plot end up 0.04 seconds or more away from the points at the left side of the plot, there is a problem with the instrument timing that must be IMMEDIATELY reported to the project manager.
Page 33 of 55
Trim Tracks Plots
Description:
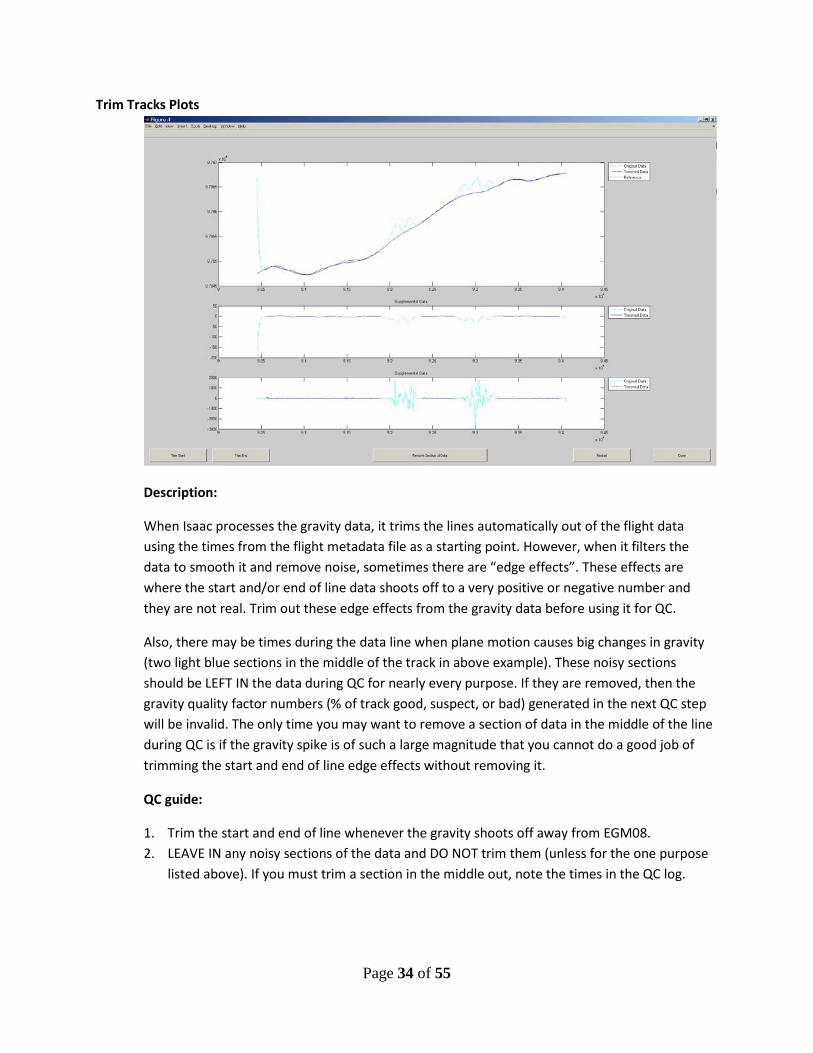
When Isaac processes the gravity data, it trims the lines automatically out of the flight data using the times from the flight metadata file as a starting point. However, when it filters the data to smooth it and remove noise, sometimes there are “edge effects”. These effects are where the start and/or end of line data shoots off to a very positive or negative number and they are not real. Trim out these edge effects from the gravity data before using it for QC.
Also, there may be times during the data line when plane motion causes big changes in gravity (two light blue sections in the middle of the track in above example). These noisy sections should be LEFT IN the data during QC for nearly every purpose. If they are removed, then the gravity quality factor numbers (% of track good, suspect, or bad) generated in the next QC step will be invalid. The only time you may want to remove a section of data in the middle of the line during QC is if the gravity spike is of such a large magnitude that you cannot do a good job of trimming the start and end of line edge effects without removing it.
QC guide:
1. Trim the start and end of line whenever the gravity shoots off away from EGM08. 2. LEAVE IN any noisy sections of the data and DO NOT trim them (unless for the one purpose
listed above). If you must trim a section in the middle out, note the times in the QC log.
Page 34 of 55
“Gravity vs. Time” Stoplight Plot
Description:
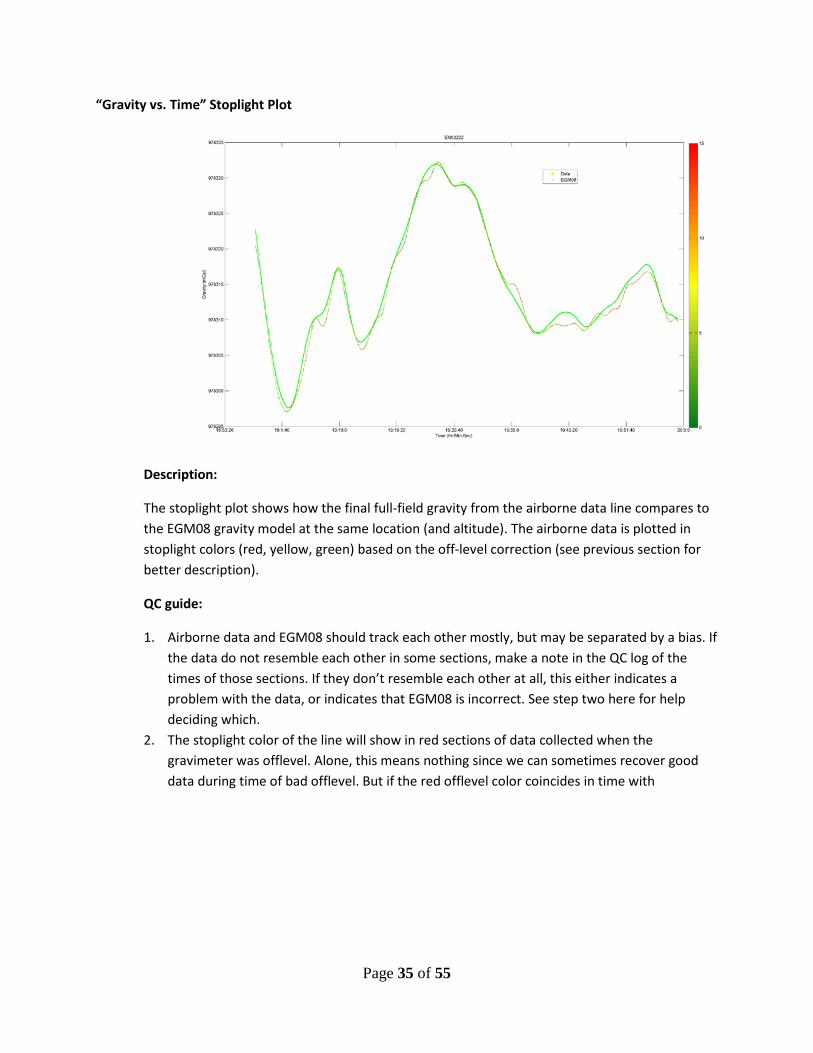
The stoplight plot shows how the final full-field gravity from the airborne data line compares to the EGM08 gravity model at the same location (and altitude). The airborne data is plotted in stoplight colors (red, yellow, green) based on the off-level correction (see previous section for better description).
QC guide:
1. Airborne data and EGM08 should track each other mostly, but may be separated by a bias. If the data do not resemble each other in some sections, make a note in the QC log of the times of those sections. If they don’t resemble each other at all, this either indicates a problem with the data, or indicates that EGM08 is incorrect. See step two here for help deciding which.
2. The stoplight color of the line will show in red sections of data collected when the gravimeter was offlevel. Alone, this means nothing since we can sometimes recover good data during time of bad offlevel. But if the red offlevel color coincides in time with
Page 35 of 55
“Difference From EGM08” Plot
Description:
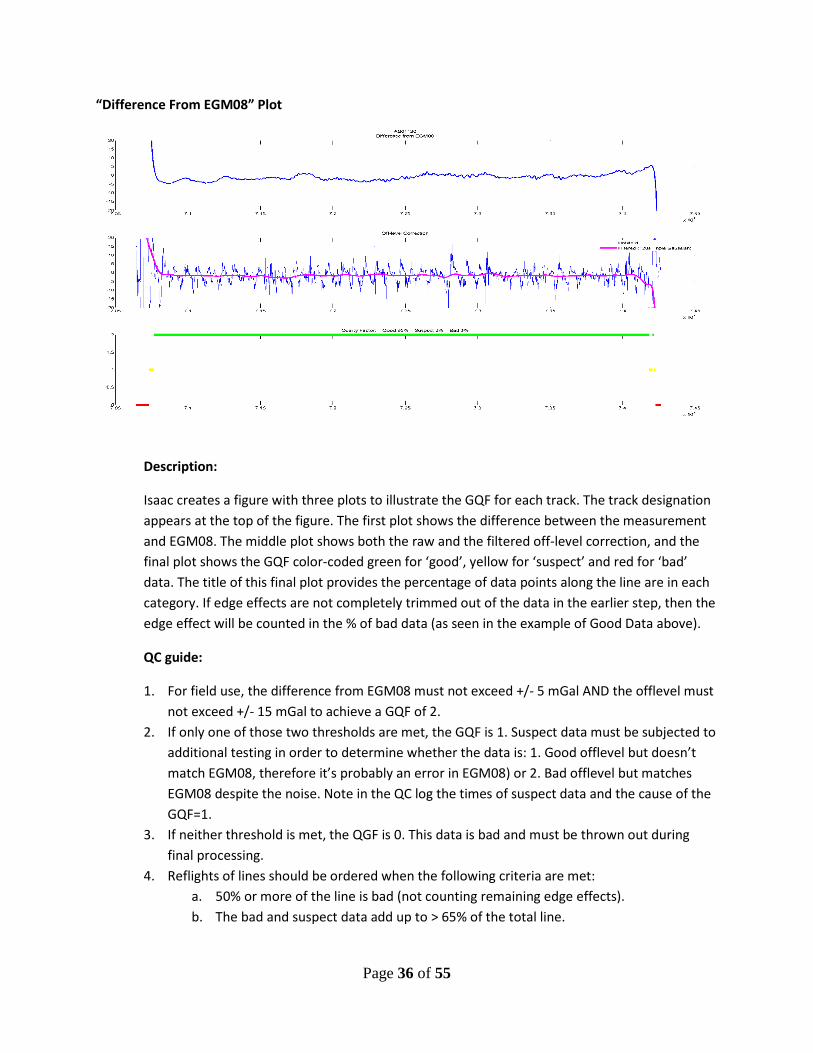
Isaac creates a figure with three plots to illustrate the GQF for each track. The track designation appears at the top of the figure. The first plot shows the difference between the measurement and EGM08. The middle plot shows both the raw and the filtered off-level correction, and the final plot shows the GQF color-coded green for ‘good’, yellow for ‘suspect’ and red for ‘bad’ data. The title of this final plot provides the percentage of data points along the line are in each category. If edge effects are not completely trimmed out of the data in the earlier step, then the edge effect will be counted in the % of bad data (as seen in the example of Good Data above).
QC guide:
1. For field use, the difference from EGM08 must not exceed +/- 5 mGal AND the offlevel must not exceed +/- 15 mGal to achieve a GQF of 2.
2. If only one of those two thresholds are met, the GQF is 1. Suspect data must be subjected to additional testing in order to determine whether the data is: 1. Good offlevel but doesn’t match EGM08, therefore it’s probably an error in EGM08) or 2. Bad offlevel but matches EGM08 despite the noise. Note in the QC log the times of suspect data and the cause of the GQF=1.
3. If neither threshold is met, the QGF is 0. This data is bad and must be thrown out during final processing.
4. Reflights of lines should be ordered when the following criteria are met: a. 50% or more of the line is bad (not counting remaining edge effects). b. The bad and suspect data add up to > 65% of the total line.
Page 36 of 55
“Free Air Disturbance” Plot
Description:
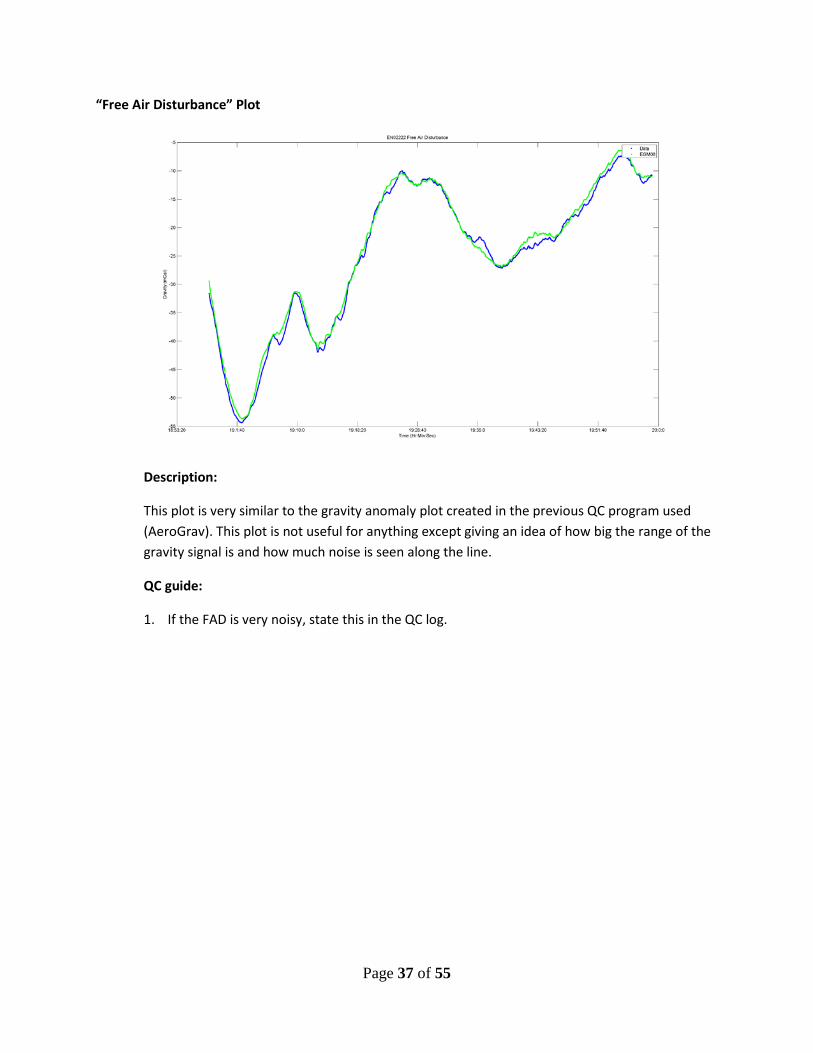
This plot is very similar to the gravity anomaly plot created in the previous QC program used (AeroGrav). This plot is not useful for anything except giving an idea of how big the range of the gravity signal is and how much noise is seen along the line.
QC guide:
1. If the FAD is very noisy, state this in the QC log.
Page 37 of 55
QC Cheat Sheet Time Delay
1. Time delay is near 16 seconds a. If so, do nothing. b. If not, report to project manager.
2. Top subplot: Two signals on the top plot look aligned. a. If so, do nothing. b. If not, report to project manager.
3. Bottom subplot: All points are within +/- 0.02 seconds from the best time delay found. a. If so, do nothing. b. If a couple points are outside that range, make a note in QC log. c. If many are, report to project manager.
4. Bottom subplot: Look for drift in the points (> 0.04 seconds over the length of the flight). a. If no drift, do nothing. b. If drift < 0.04 seconds, make a note in QC log. c. If drift > 0.04 seconds, contact project manager immediately.
Trim Tracks 1. Trim the start and end of the track to remove edge effects.
a. If you trim off large sections due to edge effects (>30% of the track) note in QC log that a reflight may be needed to recover this data.
2. LEAVE IN any noisy sections of gravity data. a. Make a note of the times of noisy sections in the QC log. b. If you must trim the noisy section in order to see the edge effects, note that in the QC
log. Do NOT do this regularly. Gravity vs. Time Stoplight
1. The two gravity signals track each other most of the line, but may be separated by a bias. a. If so, do nothing. b. If not, look at the times that look different and note them in the QC log.
Difference from EGM08 1. If GQF is 1, examine the suspect data for the cause
a. If good offlevel but doesn’t match EGM08, note in QC log an error in EGM08 b. If bad offlevel but matches EGM08, do nothing.
2. If neither threshold is met, the QGF is 0. a. If so, the data is bad and note in the QC log for data editing in final processing.
3. Reflights of lines should be ordered when the following criteria are met: a. 50% or more of the line is bad (not counting remaining edge effects). b. The bad and suspected bad data add up to > 65% of the total line. c. The amount of data trimmed off the line from edge effects was >30% and there is 30%
more bad data within the line. Free-Air Disturbance
1. If the FAD is very noisy, state this in the QC log.
Page 38 of 55
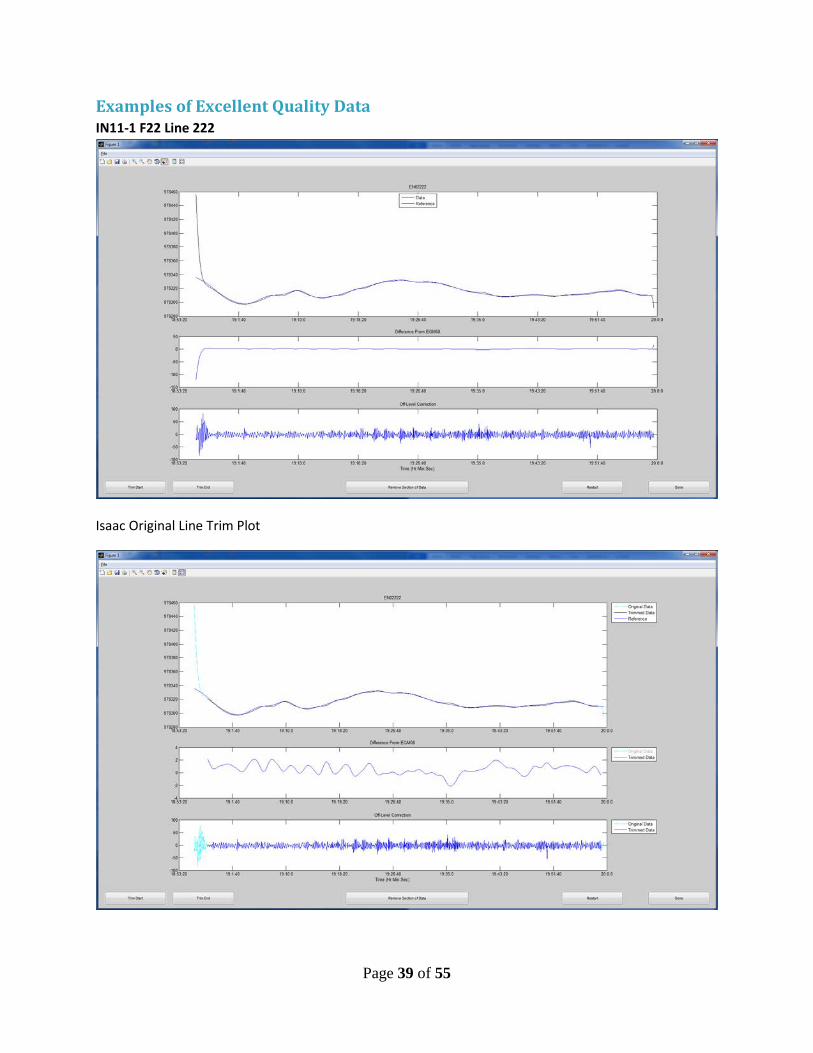
Examples of Excellent Quality Data IN11-1 F22 Line 222
Isaac Original Line Trim Plot
Page 39 of 55
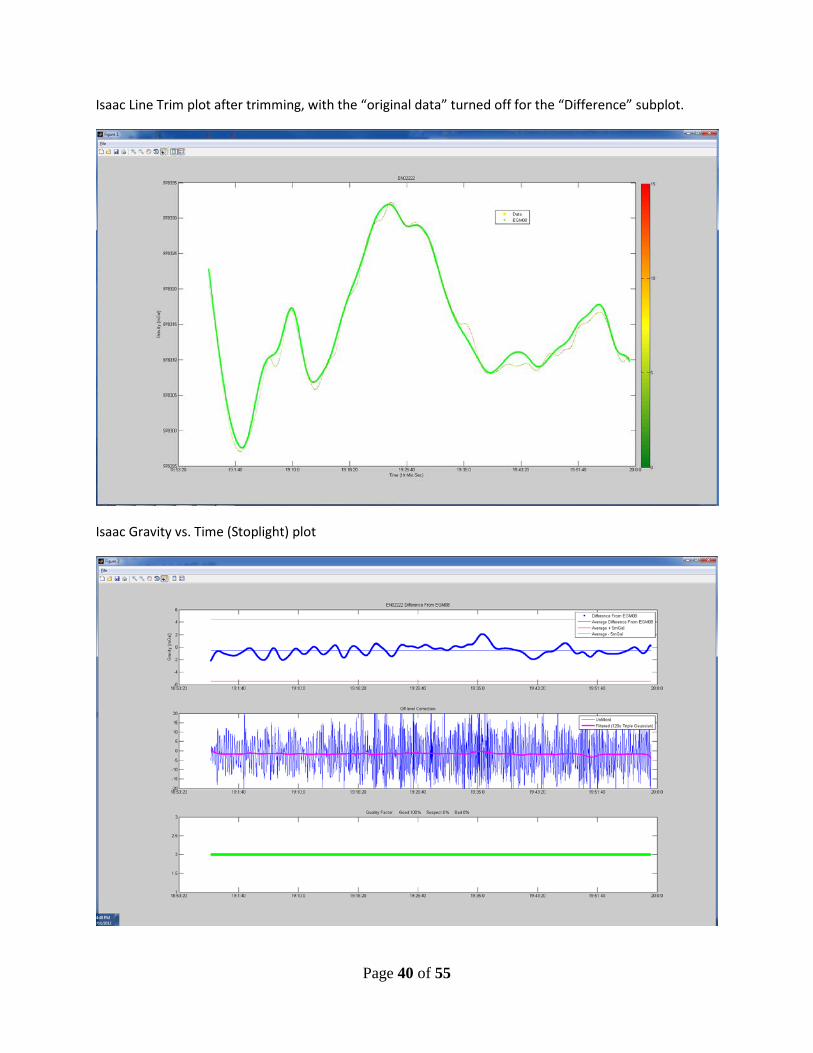
Isaac Line Trim plot after trimming, with the “original data” turned off for the “Difference” subplot.
Isaac Gravity vs. Time (Stoplight) plot
Page 40 of 55
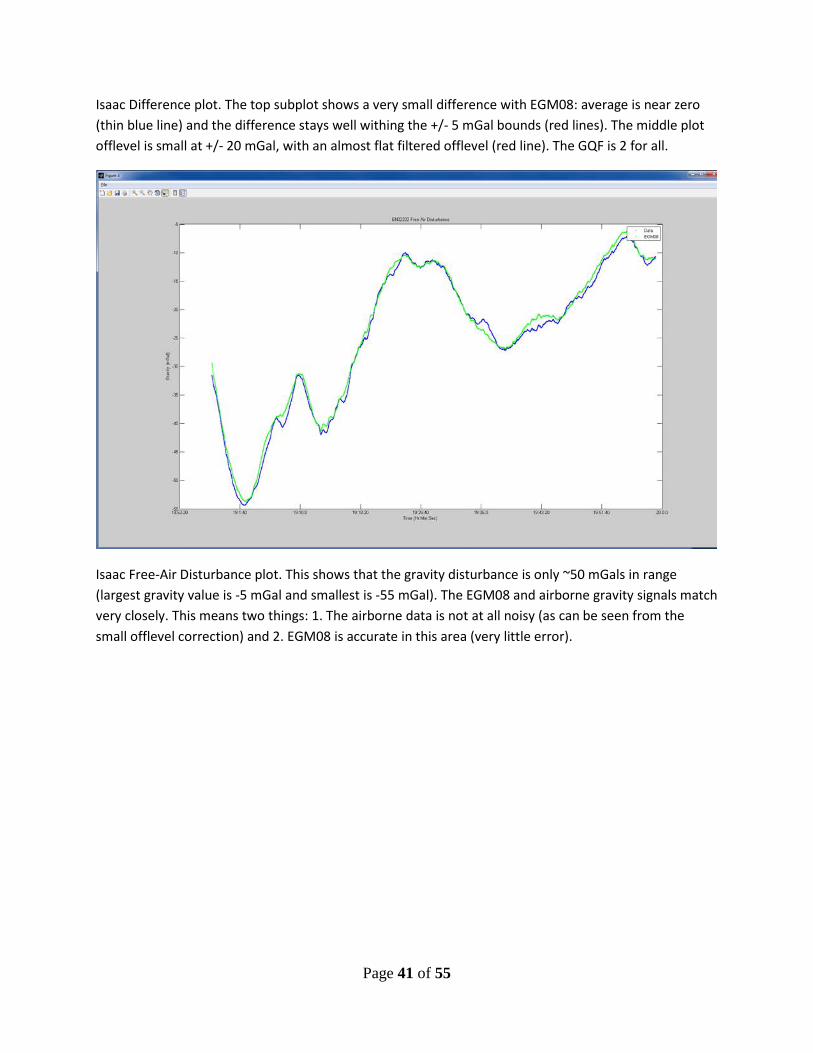
Isaac Difference plot. The top subplot shows a very small difference with EGM08: average is near zero (thin blue line) and the difference stays well withing the +/- 5 mGal bounds (red lines). The middle plot offlevel is small at +/- 20 mGal, with an almost flat filtered offlevel (red line). The GQF is 2 for all.
Isaac Free-Air Disturbance plot. This shows that the gravity disturbance is only ~50 mGals in range (largest gravity value is -5 mGal and smallest is -55 mGal). The EGM08 and airborne gravity signals match very closely. This means two things: 1. The airborne data is not at all noisy (as can be seen from the small offlevel correction) and 2. EGM08 is accurate in this area (very little error).
Page 41 of 55
IN11-1 F22 Line 223
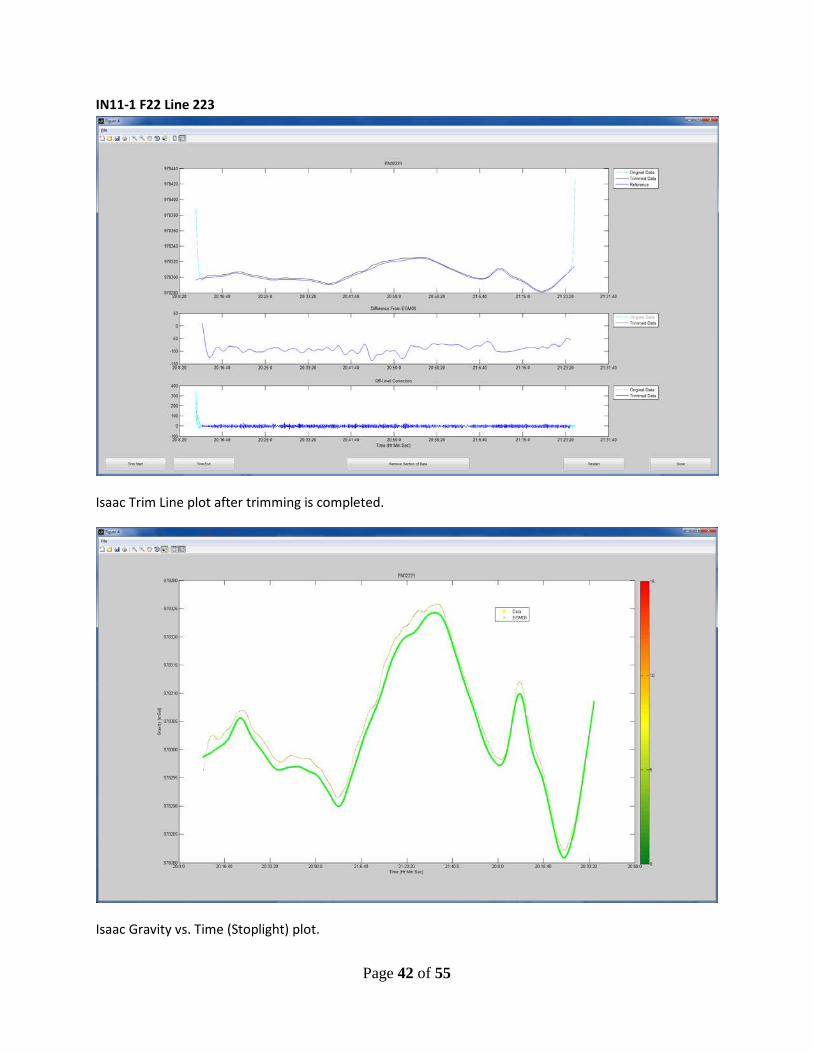
Isaac Trim Line plot after trimming is completed.
Isaac Gravity vs. Time (Stoplight) plot.
Page 42 of 55
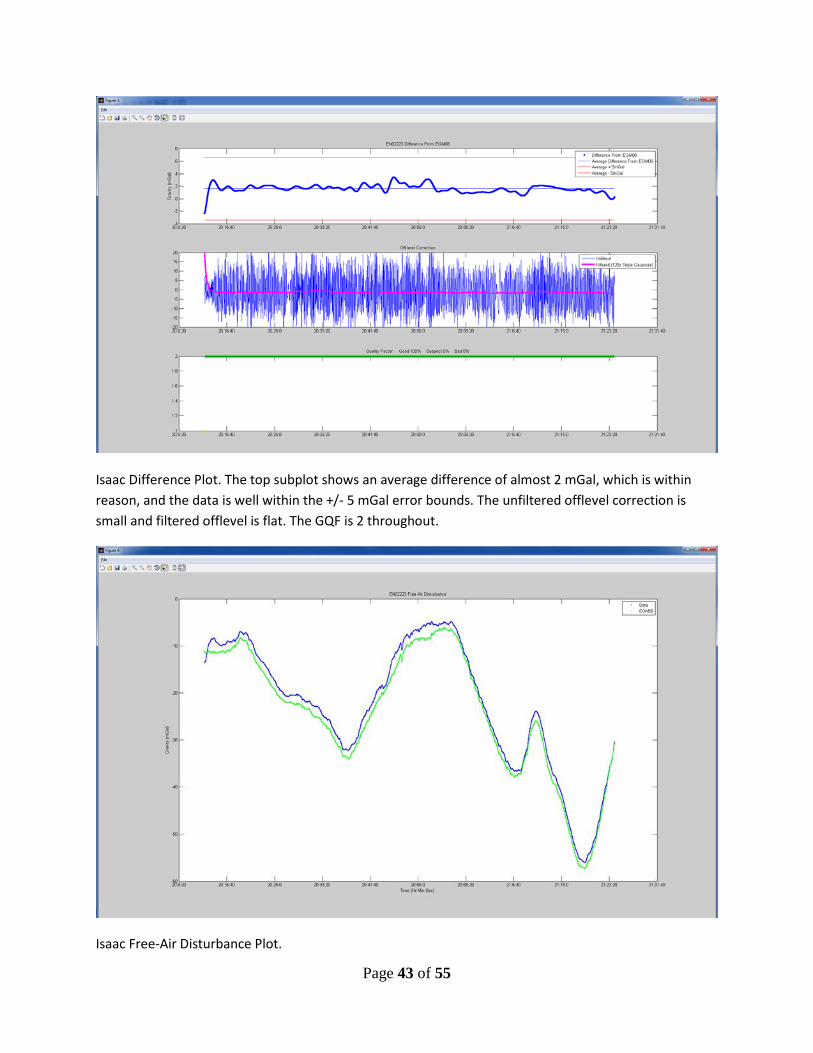
Isaac Difference Plot. The top subplot shows an average difference of almost 2 mGal, which is within reason, and the data is well within the +/- 5 mGal error bounds. The unfiltered offlevel correction is small and filtered offlevel is flat. The GQF is 2 throughout.
Isaac Free-Air Disturbance Plot.
Page 43 of 55
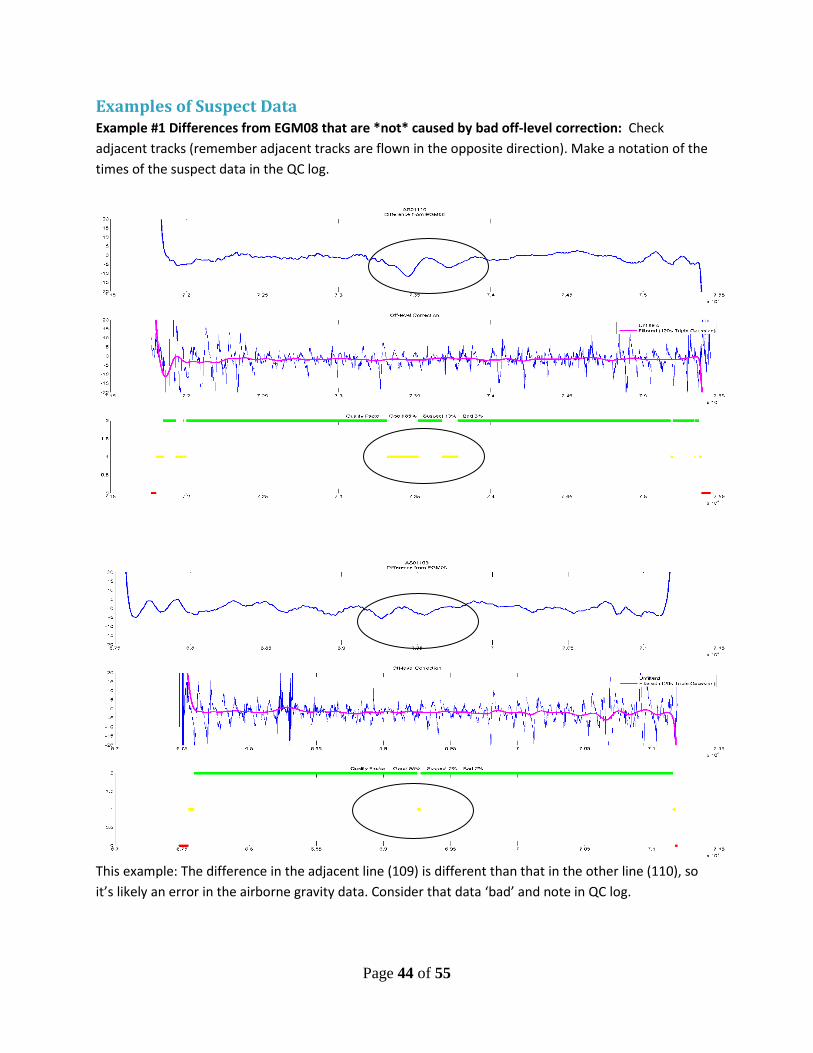
Examples of Suspect Data Example #1 Differences from EGM08 that are *not* caused by bad off-level correction: Check adjacent tracks (remember adjacent tracks are flown in the opposite direction). Make a notation of the times of the suspect data in the QC log.
This example: The difference in the adjacent line (109) is different than that in the other line (110), so it’s likely an error in the airborne gravity data. Consider that data ‘bad’ and note in QC log.
Page 44 of 55
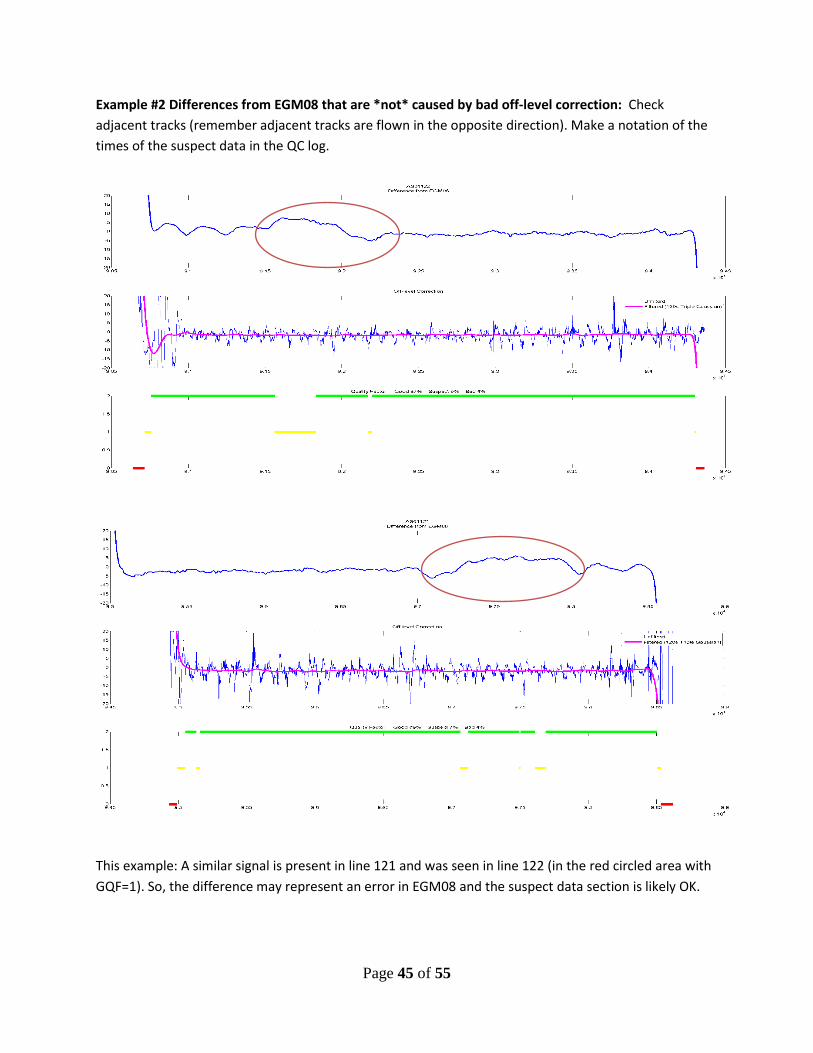
Example #2 Differences from EGM08 that are *not* caused by bad off-level correction: Check adjacent tracks (remember adjacent tracks are flown in the opposite direction). Make a notation of the times of the suspect data in the QC log.
This example: A similar signal is present in line 121 and was seen in line 122 (in the red circled area with GQF=1). So, the difference may represent an error in EGM08 and the suspect data section is likely OK.
Page 45 of 55
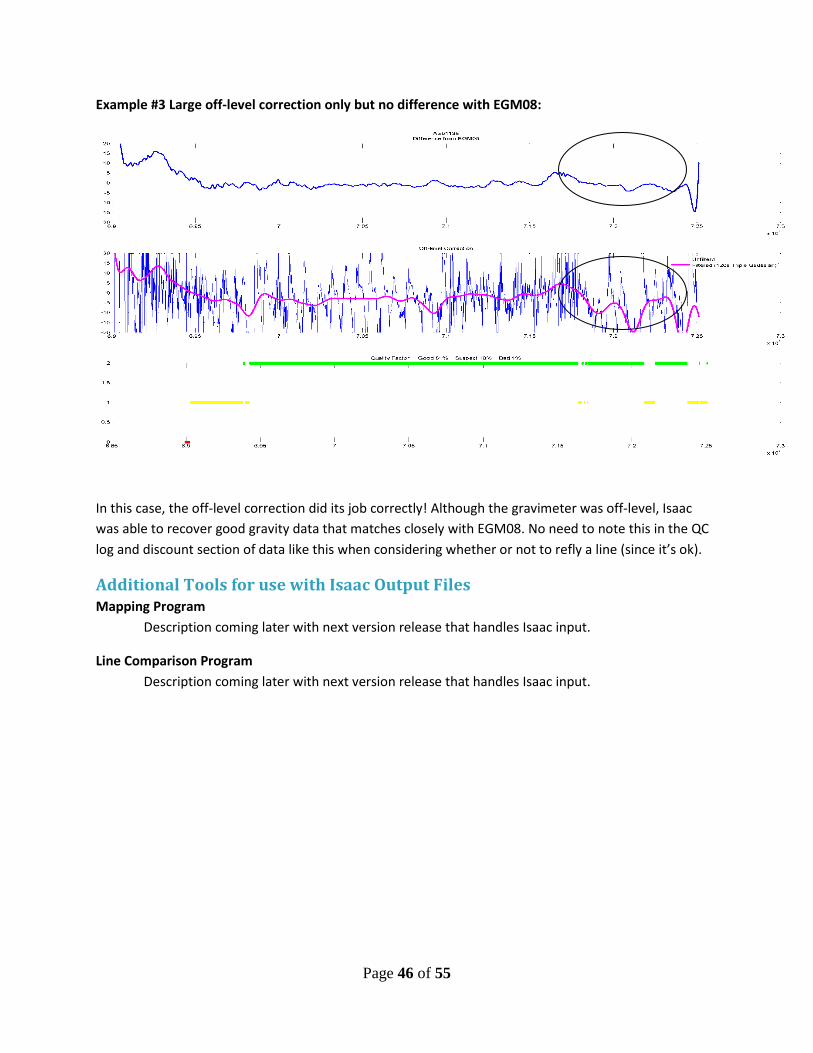
Example #3 Large off-level correction only but no difference with EGM08:
In this case, the off-level correction did its job correctly! Although the gravimeter was off-level, Isaac was able to recover good gravity data that matches closely with EGM08. No need to note this in the QC log and discount section of data like this when considering whether or not to refly a line (since it’s ok).
Additional Tools for use with Isaac Output Files Mapping Program Description coming later with next version release that handles Isaac input.
Line Comparison Program Description coming later with next version release that handles Isaac input.
Page 46 of 55

Detailed Field Procedures
Abbreviated TAGS Procedures (Checklist for Experienced Operators) Required Materials - Clipboard USB Thumbdrive Compact Flash Cards Air Pump (50psi) Pens Survey Flight Plans Extendable Mirror Flashlight Flight Log Blanks
Daily Startup (45 - 60 minutes) Check sensor heater LED on Turn on Power Module Turn on Timing Unit Test TAGS platform - pull connector inside Control Module, if needed Inspect the TAGS shocks, bubble levels, and freedom from obstructions Insert cards into NovAtel and SPAN Start base GPS Return to the aircraft When two blue lights on Timing Unit, turn on the NovAtel DL4+ “Config Logging” “Schedule: TAGS” “Apply: Yes”
Start AirIII program Enter the file name (ex. “04JUL2012”) Verify ‘GPS time sync’, Altitude, and Heading fields ok Hit “Online” for Still Reading Take a screenshot (shift+PrtScrn) Open Paint and save screenshot Record all still reading data to the flight log Close paint Clamp the Beam with the 'Ferry' button (F-1) For the first flight of the day, record TAGS ST, computer ST, TAGS pressure, and time Return to the FBO and process yesterday morning’s gravity data
Pre-Flight (10 - 15 minutes) Five minutes before door closes, plug in the SPAN When four lights are green and steady, start logging Record time of start SPAN logging Power off your cell phone(s) or put them in airplane mode Stow your equipment, gear, and tools After pilots board the plane, change over TAGS power cord Make sure at least 5 minutes elapse from the start of SPAN logging before taxi begins
Page 47 of 55
Taxi (10 - 25 minutes) Record taxi time Record take off time
In-Flight (3-5 hours) For transit to N/S lines: Leave the TAGS in Ferry Mode all the way until the Start of Line
For transit to E/W lines or lines more than 15 degrees away from N/S: During ascent, change from 'Ferry' mode to 'Landing' mode Click the Move button, enter the approximate ST value, and click ‘Go’ Verify the ST reaches the entered value in advance of the survey line
On-line: When aircraft on line, record the Start of Line (SL) time to the flight log When accels below +/-10 Gal (ideally) or below +/-30 Gal (at the worst), click ‘OnLine’ (F-2) Verify the Beam unclamps and ST Tracking activates Record the Start of Data (SD) Ask the pilots for flight stats: Ground speed, Wind speed and direction Record the Meter Pressure, Meter Temperature, and Ambient Temperature
Log any events of turbulence, bumps, autopilot movement, pilot changes to controls, etc. At half-way, record the flight stats and meter environmental numbers (pressure & temps) again 2 minutes before EOL, record the flight stats and meter environmental numbers (pressure & temps)
again
For turning onto N/S lines: At the end of the line, click ‘Ferry’ Record time, End of Data (ED), and End of Line (EL) When the beam is clamped, notify pilots that it is safe to turn
For turning onto E/W lines or line more than 15 degrees away from N/S: At the end of the line, click ‘Landing’ Record time, End of Data (ED), and End of Line (EL) When the beam is clamped, notify pilots that it is safe to turn Click the Move button, enter the approximate ST value, and click ‘Go’ Verify the ST reaches the entered value well in advance of the start of the survey line
For all remaining lines: Repeat On-line procedures
At the end of the last line: Click “Landing” (F-4) Record time, End of Data (ED), and End of Line (EL) When the beam has clamped, notify the pilot that it is safe to turn back to the airport Click the Move button, enter the pre-flight still reading ST value, and click ‘Go’
Page 48 of 55
TAGS Landing Procedures (10-40 minutes) Stow your equipment, gear, and tools Record landing time Record park time
TAGS Post-Flight Procedures, another flight planned (45 minutes) Switch over TAGS power cord Plug the extension cord into the side of the aircraft Click “OnLine” and being still teadin After 5 minutes since parking, stop logging on SPAN Unplug the SPAN Remove the SD card & take it with you Stop logging on one base station GPS (choose a different one each day) and remove the card In the FBO, download and clear the two cards Return the card to the base & restart logging Complete still reading, save, and record in log Click “Ferry” Return the card to the SPAN, but do not restart Backup data, fill out GoogleDocs Logs, and process GPS before leaving for the day
TAGS Post-Flight Procedures, last flight of day (45 minutes) Switch over TAGS power cord Plug the extension cord into the side of the aircraft Click “Online” and begin still reading 5 minutes since parking, stop logging on SPAN Record the time, unplug the SPAN, and remove the SD card 10 minutes since parking, stop logging on base GPS Remove all cards & take external batteries to be charged When the meter is still, save the screenshot and fill out the log Record the TAGS ST, computer ST, meter pressure, and time Click the Exit button Insert thumb drive into Control Module Copy .DAT and .ENV and still reading images to the thumb drive. Shut down Windows and close/stow the folding monitor Turn off DLV4+ & remove the data card Remove the thumb drive from the Control Module Turn off the Timing unit and Power Module Secure the aircraft & alert ground support that you are finished with the aircraft for the evening Download & Backup all data to all drives Process GPS and gravity data from the flight before leaving for the day Fill out GoogleDocs Logs Take the Survivor with you
Page 49 of 55
Detailed TAGS Procedures Required Materials - Clipboard USB Thumbdrive Compact Flash Cards Air Pump (50psi) Pens Survey Flight Plans Extendable Mirror Flashlight Flight Log Blanks
Daily Startup (45 - 60 minutes) Upon boarding the aircraft, verify the TAGS is on external power and the sensor heater LED on the
Power Module is on Turn on the Power Module (a second red light goes on) Turn on the TAGS Timing Unit/GPS After one minute, push on the platform in each direction and watch to see if it rights itself - if it
does, this means that the TAGS platform is working correctly If it does not look like the platform is righting itself, open the Control Module on the back of the
TAGS. Unplug the small 2-hole connector off of the Platform control board, wait 10 seconds, plug it back in. Wait one minute for the meter to reset and then try pushing on the platform again to test it. Repeat if necessary.
Inspect the TAGS system: Verify the Air Shocks are properly inflated to between 30 – 40 psi (use 35 psi). Verify nothing is touching or leaning against the platform frame. Check that the bubble levels are centered. Adjust them if needed (see TAGS manual).
• Insert Compact Flash card into the NovAtel DL-V4+ and insert SD card into SPAN IMU system. • While waiting for two blue lights on the Timing Unit, drive to and start up the three GPS base
stations. Insert PCMCIA cards and charged external batteries. Turn on the Ashtechs and wait until the logging light (marked with a satellite icon) is blinking.
Then close the pelican case lid. If it is a very hot day with no chance of rain, leave the pelican case lids open so that the Ashtechs do not overheat.
Return to the aircraft. When both TAGS Timing Unit blue lights are lit, turn on the NovAtel DL4+ by holding the power
button until it beeps once. After the NovAtel starts up, hit the right arrow button until you see “Config Logging”. Hit the down arrow until you see “Schedule: Default”. Hit Enter, Hit down (you will see TAGS, underlined), then hit Enter again to accept this. Hit the down arrow and you will see “Apply: Yes”. Hit Enter, then hit enter again. This will apply the TAGS schedule to the NovAtel and start Group
Logging. You will see “Schedule”, “Group”, “Logging” flash in sequence in the upper right corner of the NovAtel.
From the operator seat, open the folding monitor and double-click on the TAGS III Icon. Enter the desired file name, usually similar to “04JUL2012”.
Page 50 of 55
As the TAGS starts up, verify ‘GPS time sync’ is lit bright green and that there are values in the Altitude and Heading fields. (If there are not, you have no GPS signal to the meter and it will not work properly.)
After the QC Gravity number stops changing, hit “Online” and begin a Pre-Flight Still Reading (20 - 30 minutes).
Wait until the meter is settled: Beam is at 0 Volts, the TC is +/- 0.8, and the QC gravity has been stable near the same value for a few minutes.
Take a screenshot (shift+PrtScrn). Open Paint using the shortcut button Paste the screen shot into the program, clicking “Yes” when prompted to enlarge the bitmap. Save the file in My Pictures, in a folder named with today’s date. Record all still reading data to the flight log. Close Paint. Clamp the Beam with the 'Ferry' button (F-1). For the first flight of the day, use an extendable mirror and flashlight (or iPhone) to record the value
on the TAGS Spring Tension dial into the flight log. Also record the Spring Tension shown on the computer screen, the pressure shown on the digital readout on the sensor, and the time.
Return to the FBO and process yesterday morning’s gravity data in Isaac, while waiting for the pilots.
Pre-Flight (10 - 15 minutes) About five minutes before the pilots board the plane, plug in the SPAN\IMU System. When four lights are green and steady (all but GPS 2), press the black button to the right of the SD
card to begin logging. If the left-most light (“SD Card”) starts blinking, you are logging. Record the time of start SPAN logging. Power off your cell phone(s) or put them in airplane mode. Inspect the cabin and secure your equipment, gear, and tools. If you’re not holding onto it, it should
be stowed away for takeoff. After pilots board the plane, disconnect TAGS power cord from ground AC power and connect to
UPS output. Watch the time. Make sure at least 5 minutes elapses from the start of SPAN logging before taxi
begins. Request that the pilots wait if they want to taxi sooner than that.
Taxi (10 - 25 minutes) Record on the flight log the time of start taxi. Record on the flight log the time of wheels lift off.
In-Flight (3-5 hours) For transit to N/S lines: Leave the TAGS in Ferry Mode all the way until the Start of Line.
For transit to E/W lines or lines more than 15 degrees away from N/S: During aircraft ascent, change from 'Ferry' mode to 'Landing' mode. The beam remains clamped, but
Spring Tracking is stopped. Click the Move button, enter the approximate ST value, and click ‘Go’.
Page 51 of 55

Verify the ST reaches the entered value well in advance of the start of the survey line. An easy way to do this is that the ‘Move’ window clears after ST reaches the desired value.
On-line: When the pilot reports that the plane is on line, record the Start of Line (SL) time to the flight log.
The plane should be straight and level by this waypoint. If there is post-waypoint maneuvering, remind the pilots that they must complete the maneuvering BEFORE the waypoint on all future lines.
When the accelerometers have settled below +/-10 Gal (ideally) or at least below +/-30 Gal (at the worst), click ‘OnLine’ (F-2) and begin data acquisition.
Verify the Beam unclamps and ST Tracking activates (both boxes turn green). Record the Start of Data (SD) time to the flight log. Ask the pilots for flight stats: Ground speed, Wind speed and direction. Record the Meter Pressure, Meter Temperature, and Ambient Temperature. Monitor the various TAGS channels during the line, particularly the Cross and Long Accelerometers
and the Beam Position. The Beam ‘noise envelope’ should not exceed l.5V peak-to-peak. Log any incidents of turbulence, bumps, autopilot movement, pilot changes to controls, or
anything else that may impact the gravity data. Ask the pilots to notify you at the half-way point of the line, then record the flight stats and meter
environmental numbers (pressure & temps) again. Ask the pilots to notify you approximately 2 minutes before the end of line, then record the flight
stats and meter environmental numbers (pressure & temps) again
For turning onto N/S lines: At the end of the line, click ‘Ferry’. Record time, End of Data (ED), and End of Line (EL). When the beam is clamped, notify pilots that it is safe to turn.
For turning onto E/W lines or line more than 15 degrees away from N/S: At the end of the line, click ‘Landing’. Record time, End of Data (ED), and End of Line (EL). When the beam is clamped, notify pilots that it is safe to turn. Click the Move button, enter the approximate ST value, and click ‘Go’. Verify the ST reaches the entered value well in advance of the start of the survey line. An easy way
to do this is that the ‘Move’ window clears after ST reaches the desired value.
For all remaining lines: Repeat On-line procedures
At the end of the last line: Click “Landing” (F-4). Record time, End of Data (ED), and End of Line (EL). When the beam has clamped, notify the pilot that it is safe to turn back to the airport. Click the Move button, enter the pre-flight still reading ST value, and click ‘Go’.
Page 52 of 55
TAGS Landing Procedures (10-40 minutes) Inspect the cabin and secure your equipment, gear, and tools. If you’re not holding onto it, it should
be stowed away for landing. Record the time of wheels touch down to the flight log. Record the time of aircraft parking to the flight log.
TAGS Post-Flight Procedures, another flight planned (45 minutes) Once parked, move the TAGS power cord from aircraft power to external power. Wait for the props to stop spinning, then get out and plug the extension cord into the side of the
aircraft. Back in the plane, click “OnLine” and begin a post-flight Still Reading (~20-30 minutes). After at least 5 minutes has elapsed since parking, push the black logging button on the SPAN (the
“SD card” light will go steady green). Unplug the SPAN and remove the SD card. Follow the pre-flight procedures to take this post-flight still reading. While waiting for the still reading, go to the base station GPS units, and stop logging on one (choose
a different one each day). Push and hold down the power button- it will beep twice. Remove the card.
Take the SPAN and Ashtech data cards inside the FBO. Download the data to two locations on the laptop and clear the cards. Return the cards to the Ashtech base and SPAN IMU. Restart the Ashtech base, but do not restart
the SPAN. When the still reading is complete and screenshot saved, click “Ferry”. The 1st flight operator will backup data to the Iomega HD, and process the GPS data in Inertial
Explorer before leaving for the day.
TAGS Post-Flight Procedures, last flight of day (45 minutes) Once parked, move the TAGS power cord from aircraft power to external power. Wait for the props to stop spinning, then get out and plug the extension cord into the side of the
aircraft. Back in the plane, click “OnLine” and begin a post-flight Still Reading (~20-30 minutes). After at least 5 minutes has elapsed since parking, push the black logging button on the SPAN (the
“SD card” light will go steady green). Record the time on the log, unplug the SPAN, and remove the SD card. Follow the pre-flight procedures to take this post-flight still reading. While waiting for the still reading (and at least 10 minutes after the aircraft has parked), drive out to
the base station GPS units and stop logging on all three. Push and hold down the power button- it will beep twice. Remove the data cards. Unclamp the external batteries and load them in the vehicle. Drive the batteries to the charging station and clamp them onto the charging units.
Go back to the aircraft.
Page 53 of 55

When the meter is still, save the screenshot and fill out the log. Use an extendable mirror and flashlight (or iPhone) to record the value on the TAGS Spring Tension
dial into the flight log. Also record the Spring Tension shown on the computer screen, the pressure shown on the digital readout on the sensor, and the time.
Click the Exit button inside the AirIII software program. Insert a thumb drive into the USB port on the Control Module. Using Windows Explorer, copy the .DAT and .ENV gravity data files and the pre- and post-flight still
reading images to the thumb drive. There are shortcut buttons to the data and picture locations on the bottom toolbar.
Shut down Windows and close/stow the folding monitor. Press and hold the power button on the DL-V3 until it powers down, then remove the data card. Remove the thumb drive from the Control Module Turn off the Timing unit and Power Module Secure the aircraft & alert ground support that you are finished with the aircraft for the evening. Download & Backup all data to laptop, iomega HD, and Survivor thumbdrive. Process GPS and gravity data from the flight before leaving for the day. Take the Survivor with you.
Page 54 of 55