the grav-d project · 11/14/2007 · the grav-d project: gravity for the redefinition of the...
TRANSCRIPT

The GRAV-D Project:Gravity for the Redefi nitionof the American Vertical Datum
A NOAA contribution to the
Global Geodetic Observing System (GGOS)
component of the Global Earth Observation
System of Systems (GEOSS)
National Oceanic and Atmospheric Administration ● National Ocean Service ● National Geodetic Survey

Approved for public distribution by the NGS Executive Steering CommitteeNovember 14, 2007
For more information, contact:Dr. Dru SmithNOAA/National Geodetic Survey1315 East-West HighwaySilver Spring, MD [email protected]/GRAV-D

The GRAV-D Project: Gravity for the Redefinition of the American Vertical Datum
Page �12/19/07
Background The National Geodetic Survey (NGS) has a clearly stated mission to “define, maintain and provide access to the National Spatial Reference System” (NSRS). This mission is founded in Congressional mandates and Executive orders and has been the basic mission of NGS since its inception as part of the Survey of the Coast in 1807. One critical component of the NSRS is the determination of “height”—specifically ellipsoid height, orthometric height, and dynamic height—of any point in the United States or its territories. Because NGS defines these heights in the official datums of the United States, and because all federal mapping activities are meant to be based on these datums, NGS has the critical role of proving the foundational information for all federal mapping activities in the nation.
Gravity and Height Accurate gravity data is the foundation for the Federal government’s determination of heights, and whereas this document is not the appropriate place for a thorough dissertation on the definition of “height” and its inseparable connection to gravity— significant information on the subject of height and gravity has been documented in literature over the last century—a brief primer on the connection between gravity and height is provided below.
One critical point to be made is that in the past 20 years, the use of GPS technology for determining fast and accurate ellipsoid heights has created a pressing desire for a similarly fast and accurate determination of orthometric heights. (For details, see Appendix B). Ellipsoid heights cannot be used to determine where water will flow, and therefore are not used in topographic/floodplain mapping. Orthometric heights are related to water flow and are more useful (and are colloquially—although not quite appropriately—referred to by the more common term “height above sea level”). In order to transform from ellipsoid heights to orthometric heights, a model of the geoid must be computed, and geoid modeling can only be done with measurements of the acceleration of gravity near the Earth’s surface.
With the use of GPS Continuously Operating Reference Stations (CORS), NGS has been tracking and predicting changes to the ellipsoid heights in the United States for some time. A similar tracking of orthometric heights would not only fulfill NOAA’s mission, but would also allow users of heights to know changes over time for hurricane evacuation route planning, levee heights, and other critical coastal elevations that require tracking in a dynamic world.
NGS has done an excellent job collecting existing gravity information for the United States and computing geoid models to determine orthometric heights from GPS. Unfortunately, these efforts are insufficient at the highest levels of accuracy, due to the extremely disparate nature of the

The GRAV-D Project: Gravity for the Redefinition of the American Vertical Datum
Page � 12/19/07
available data (with thousands of surveys, conducted by hundreds of sources, over dozens of years, and with no attempt to monitor changes in gravity over time in this data). Unfortunately, with no committed large-scale tracking of gravity changes over time being conducted by any agency in the United States, the situation will only worsen as crustal motion (from subsidence to glacial isostatic adjustments) continues to change the nature of the land. A new, self-consistent and temporally tracked measure of the gravity field is the only way to ensure fast, accurate, useful heights at all times in the future.
Additional justification The mission of NOAA is:for a new gravity survey “To understand and predict changes in the Earth’s
environment and conserve and manage coastal and marine resources to meet our nation’s economic, social and environmental needs”
The nation requires a gravity survey, because the existing national gravity holdings are insufficient for NGS to properly perform its mission to the degree of accuracy necessary for fulfilling its obligation to the greater NOAA mission.
In recognition of the need to predict changes to heights (derived from predicted changes in the gravity field, specifically the geoid), counterpoised with the inability to frequently perform a high resolution gravity survey, the appropriate (and only practical) solution is a dual-mode approach:
A. High resolution snapshot to repair and improve existing gravity holdings—a one-time survey with dense spatial coverage, but with a short temporal span.
B. Low resolution movie to track the temporal changes to the gravity field on a broad scale—a re-occurring survey with very coarse spatial coverage and a long temporal span.
In addition to these two predominantly NGS-performed tasks, a third component, likely to be financed and performed predominantly at the local level would be:
C. Terrestrial Partnership Surveys to measure and/or track very localized gravity values of particular importance to the fine-scale local determination of heights.
The problems being addressed by such a new survey are:
1. Data gaps There are, particularly in the littoral regions up to 100 km offshore of all United States territories, very few gravity measurements. Satellite altimetry (a useful tool for monitoring gravity in deep waters) will not work as a replacement in such regions. These regions are too shallow for

The GRAV-D Project: Gravity for the Redefinition of the American Vertical Datum
Page �12/19/07
shipborne gravimetry and impossible for terrestrial meters. Filling these data gaps can be done only via airborne gravimetry.
2. Aged data Much of the gravity data held at NGS was collected in the middle of the last century, and the most recent gravity surveys collected in the 1970s and 1980s were used to support the North American Vertical Datum of 1988 (NAVD 88). Considering the amount of crustal motion known to have occurred in the last 30-50 years, these holdings do not accurately represent the gravity field today, and consequently are inappropriate for addressing today’s height issues.
3. Discontinuities While nearly two million gravity measurements exist in the holdings of NGS, measurements were collected in vastly different ways. There are literally thousands of surveys, conducted by hundreds of sources, over dozens of years.
4. Imbalance of spatial coverage Much of the gravity data did not come from NGS field crews, and as a result, there is a disparity on spatial coverage. Often, some regions were densely surveyed while surrounding regions were not.
5. Lack of information regarding gravity change over time Even if discrepancies were totally driven out of the existing terrestrial gravity holdings, the fact remains that there has been no effort to model changes in the gravity field—and thus changes in the geoid and orthometric heights—over time. The long-term view of a new survey would include episodic re-visits of key locales and the use of those repeated surveys to model the slow-change orthometric heights (through gravity) over time.
6. Inability to maintain the current vertical datum realization NAVD 88 is the current vertical datum of the United States, but it is realized (accessed by users) through the publication, by NGS, of “known” heights at hundreds of thousands of passive marks in the ground. Because the heights on these marks are not regularly checked, and because they are destroyed by construction, the maintenance of a vertical datum by this method cannot be perpetuated. Only a new method—through GPS and gravity—can allow NOAA to maintain a quality level of service to the nation in the definition of the vertical datum.
In order to exemplify the disparity in spatial coverage, the plot below shows the existing holdings in the CONUS (conterminous United States) data set.

The GRAV-D Project: Gravity for the Redefinition of the American Vertical Datum
Page � 12/19/07
The gaps in littoral coverage can be seen in the next few plots. Notice the absolute lack of data in the near-shore shallow regions, except for ports.
The plot to the right shows the Pacific Northwest region of the United States. Fortunately, in this region, a significant drop-off in bathymetry allowed ship gravity to be acquired much closer to the shore than in the East coast. Nonetheless, a 50-70 km gap occurs off the entire coast of the state of Washington.
The next plot shows the sparseness of gravity off the Northeast coast. There are very few ship tracks, even in the deep water region off the coast of Maine. Note the varying terrestrial coverage for western Massachusetts, Rhode Island, and Northern Maine.

The GRAV-D Project: Gravity for the Redefinition of the American Vertical Datum
Page �12/19/07
Finally, the plot below shows the Gulf Coast region, where some of the largest gaps in existing gravity coverage occur. Additionally, extensive study of these particular ship tracks has been conducted by NGS scientists over the years, and many of them are found to be systematically biased. This entire region, with its need for accurate heights, should be surveyed early in this campaign.

The GRAV-D Project: Gravity for the Redefinition of the American Vertical Datum
Page � 12/19/07
Additional supporting In order to accurately model the geoid and track its changes through data collection time, supporting information—in addition to the gravity survey—will
be necessary. Much of the supporting information already exists in-house, though it may require updates, calibration, or re-processing to be fully utilized:
1. Digital Elevation Models
2. Geoid slopes from co-located (temporally and spatially) leveling and GPS surveys over large regions
3. Rock densities of the largest mountain ranges of the United States
4. Bathymetry of all major lakes and near-shore regions of the United States
5. Deflection of the vertical for testing upward continuation algorithms, as needed
6. Gravity gradiometry
7. Satellite derived gravity models (e.g. GRACE and GOCE)
Campaign I: High-Resolution Snapshot of Gravity
Commitments Time: Medium (seven to ten years)
Money: High ($38.5M, including new personnel and equipment)
Personnel: High [14 dedicated full-time employees (FTEs)]
Goal As part of its data holdings, NGS will have a high-resolution, instantaneous (geologically speaking), consistent view of the entire near-surface terrestrial gravity field for the United States and its territories in a modern epoch.
Overarching Strategy 1. Acquire the necessary equipment for executing a country-wide gravity campaign.
2. Train field parties in the use of existing equipment, as well as new equipment when it becomes available.
3. Train personnel in the management (acceptance, processing, cleaning, distributing) of gravity data.
4. Collect new data to fill existing gaps.
5. Collect new data to overlap and correct (or validate) existing disparate data sets.

The GRAV-D Project: Gravity for the Redefinition of the American Vertical Datum
Page �12/19/07
Firstly, the two largest “gaps” in terrestrial gravity coverage for the United States are the littoral regions and much of the southern half of the state of Alaska.
Secondly, the existing terrestrial gravity coverage consists of thousands of diverse surveys, taken by operators with dozens of instruments, spanning decades. There is no simple way to correct the systematic errors, or account for the changes in the gravity field, between these data sets in the decades since much of the data was last collected. The best, most efficient approach is to have a unified campaign to overlap much of the data and provide a baseline of comparison.
Because no alternative for collecting data in the “gap” regions is as accurate and efficient as airborne gravity data—also because no other method will allow a cross-country consistent and efficient survey of gravity data to act as the baseline for correcting existing holdings—the basic approach to Campaign I is to rely heavily upon airborne gravity collection, combined with on-the-ground (absolute and relative) gravity confirmation.
Airborne gravity, being a relative operation, requires the calibration of the instrument against absolute meters, both at the airport, as well as overflying such meters. Additionally, where airborne gravity overflies existing gravity holdings and significant discrepancies occur, limited scope field data checks with terrestrial relative meters should be performed to provide an independent check in the regions.
The proposed airborne survey campaign would proceed in the following steps, though subject to change depending on multiple variables.
Phase I: Testing
1. Test flights for determination of optimal flight parameters
2. Small area proof of operations (likely to be Puerto Rico and the Virgin Islands)
Phase II: Operational Data Collection
1. Alaskan Littoral regions, excluding the Aleutians
2. Southern Alaska
3. CONUS littoral regions
4. Hawaii, Pacific Island territories, and the Aleutian chain
5. Inland CONUS
6. Northern Alaska
The GRAV-D Project: Gravity for the Redefinition of the American Vertical Datum
Page � 12/19/07
Phase III: Extras or Follow-Ons
1. Collaborative flights with neighboring governments (Canada, Mexico, Central America, Caribbean)
2. Re-flight of PR/VI, if step 2 exhibited any issues
Computational Variables
Before describing the individual phases of the survey, it is necessary to establish a nominal set of variables for estimating costs. Recent collaborative airborne gravity surveys between NOAA and the Naval Research Laboratory (NRL) in the Gulf coast region have helped establish these nominal values.
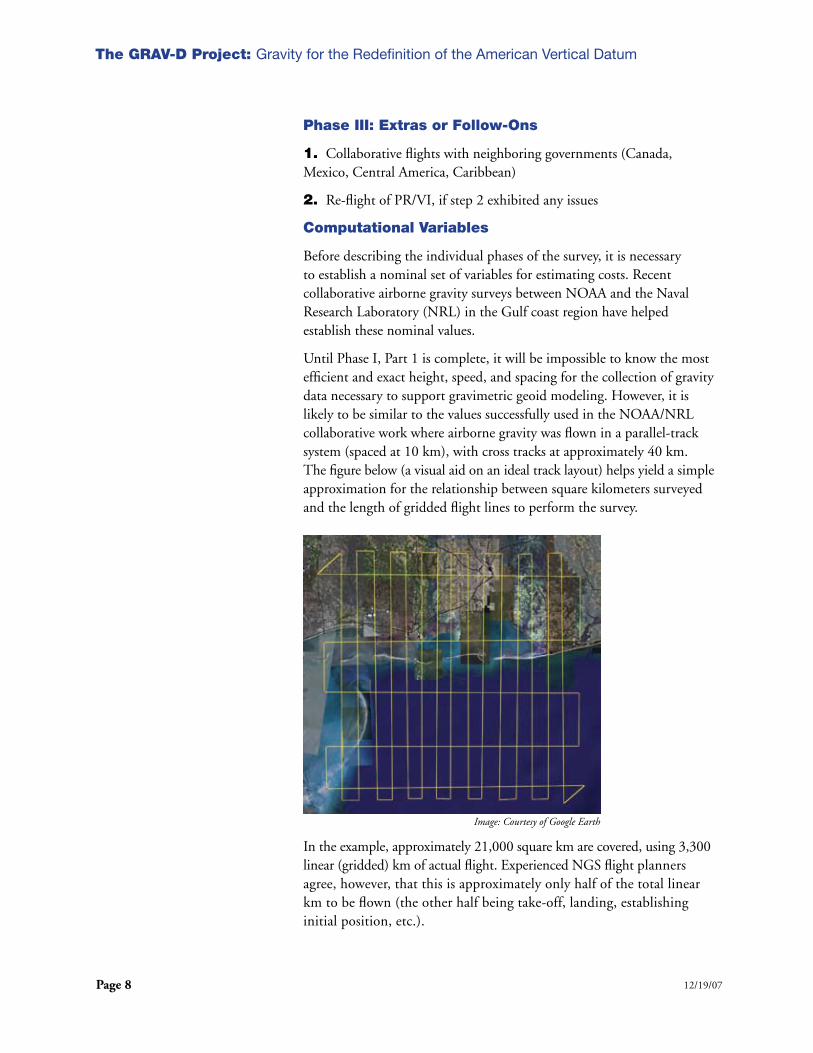
Until Phase I, Part 1 is complete, it will be impossible to know the most efficient and exact height, speed, and spacing for the collection of gravity data necessary to support gravimetric geoid modeling. However, it is likely to be similar to the values successfully used in the NOAA/NRL collaborative work where airborne gravity was flown in a parallel-track system (spaced at 10 km), with cross tracks at approximately 40 km. The figure below (a visual aid on an ideal track layout) helps yield a simple approximation for the relationship between square kilometers surveyed and the length of gridded flight lines to perform the survey.
In the example, approximately 21,000 square km are covered, using 3,300 linear (gridded) km of actual flight. Experienced NGS flight planners agree, however, that this is approximately only half of the total linear km to be flown (the other half being take-off, landing, establishing initial position, etc.).
Image: Courtesy of Google Earth

The GRAV-D Project: Gravity for the Redefinition of the American Vertical Datum
Page �12/19/07
To validate the approximation from the simple example above, professional flight planning software was applied to a large test portion of Alaska. A polygon consisting of 2,001,182 square km was outlined, and flights were planned at an optimal cardinal direction (to maximize coverage, while maintaining 10 x 40 km spacing). For the 10 km tracks, approximately 248,972 gridded flight km were computed. The total gridded flight km for the 40 km cross tracks was 63,128 km. Thus, a total of 312,100 gridded flight km were necessary for a 2,001,182 square km area, equating to approximately 3,275 gridded flight km per 21,000 square km, an almost perfect match for the previous estimate of 3,300 to 21,000.
The following table, therefore, represents equivalences used to compute the estimates throughout this plan:
Additionally, the flight height and speed used for estimating costs will be those nominally available with the existing NOAA Citation [35,000 ft altitude, 325 kts (~600 kmh)]. The table below shows the nominal values used to estimate some of the costs of performing the airborne surveys.
Nominal Values for Estimating Costs
Flight Speed 325 kts (~600 kmh)Fuel Cost $3,000 / flight hourFlight Crew 4 @ 100% (2 pilots, 2 operators)Support Crew 2 @ 50% (2 terrestrial surveyors)Flying Time between Maintenance Stops 5 days / week
6 hours / day (30 flight hours / week)Thus, 150 flight hours / 5 weeks
Aircraft Maintenance Time 2 weeks off after every 150 flight hoursThus, “5 weeks on, 2 weeks off ”
Total Flight Hour Efficiency 150 hours / 7 weeksor 1,110 flight hours / 365 calendar days
Per Diem Costs $200 / person / calendar day Using the above tables, the following formulae have been derived to
compute various quantities (including costs) to perform an airborne gravity survey over a region:
Square km surveyed Gridded Flight km Total Flight km (non-Alaska)
Total Flight km(Alaska)
21,000 3,300 6,600 8,250** For Alaska, the sparseness of airports necessitates a factor of 2.5, not 2.0, when converting gridded flight km to total flight km.

The GRAV-D Project: Gravity for the Redefinition of the American Vertical Datum
Page �0 12/19/07
Total Flight Hours (Alaska) = (Sq km surveyed) × 8,250 Flight km × 1 Flight Hour
Total Flight Hours (Non-Alaska) = (Sq km surveyed) × 6,600 Flight km × 1 Flight Hour
Total Calendar Days = Total Flight Hours × 365 Days
Total Fuel Cost = Total Flight Hours × ($3,000 / hr)
Per Diem Costs: A. “Flight Crew” to consist of two pilots and two instrument operators, operating the full number of calendar days allocated.
B. “Support Crew” to consist of two field surveyors operating either relative or absolute gravimeters or other geodetic equipment. The crew will not operate full-time with the airborne gravimeter, but will be needed for in-field checks, calibrations at airports, and other quality control surveys. For estimation purposes, the crew is expected to operate only 50% of the total calendar days for any given area to be surveyed.
Flight Crew Cost = Total Calendar Days × (4 persons × 100%) × ($200 / person / day)
Support Crew Cost = Total Calendar Days × (2 persons × 50%) × ($200 / person / day)
Total Per Diem Cost = Flight Crew Cost + Support Crew Cost
Total Cost = (Total Fuel Cost + Total Per Diem Cost) × 110%
(The addition of 10% simulates additional known—but difficult to pre-estimate—costs, such as shipping, etc.).
Phase I The two parts of Phase I will be dedicated to testing the instrument parameters, determining optimal field collection routines, and verifying proofs of concept on vertical datum determination from a gravimetric geoid.
Phase I, Part 1 Test flights for determination of optimal flight parameters
A well-surveyed and well-studied gravity field test area will be chosen, including modern, existing airborne surveys. Most likely, the test area will be in the coastal region of the Gulf of Mexico. Recent collaborative work between NOAA and NRL using the NRL airborne gravimeter have yielded good in-situ data in reasonable agreement with much of the existing terrestrial data. This component of Phase I will concentrate on repeatedly flying the same test area, but with varying flight parameters (track spacing, cross-over spacing, flight speed, and flight height). At the
21,000 Sq km 600 Flight km
1,110 Flight Hours
21,000 Sq km 600 Flight km

The GRAV-D Project: Gravity for the Redefinition of the American Vertical Datum
Page ��12/19/07
same time, new absolute gravity sites in the test area will be observed to serve as calibration points.
Scientists at NGS will analyze the data and attempt to develop optimal flight parameters, as well as optimal data processing schemes. It must be recalled that the ultimate goal of airborne gravity for NGS specifically is not gravity at flight altitude, but rather gravity at the Earth’s surface. The ability to replicate the absolute gravity calibration points, using the most cost-efficient flight parameters and data processing schemes, will be of maximum importance in this phase.
Some preliminary work on answering these questions has already begun, as mentioned above. While these initial numbers will be used throughout this plan, it may become necessary to alter cost and time estimates slightly if this part of Phase I yields varying optimal flight parameters than those assumed above.
The final step will be the publishing of aManual on the Collection of Airborne Gravity in the Accomplishment of the NOAA Mission. The manual could be used to derive statements of work for contractual airborne gravity surveys—a likely course of action for timely completion of the operational phase of this survey.
Because these first flights entail overflying the same regions in an experimental mode, it will be difficult to gage the exact number of flight hours needed. At least three different heights, a variety of speeds, and probably one highly dense (5 km spacing) track should be attempted.
Phase I, Part 1 Square Km = 42,000 (but repeated at three different elevations, and(Gulf Coast Testing) at least once with a track density × 2)Approximate Cost Thus, total Square Km = 42,000 × 4 = 168,000
Total Flight Hours = 88 Total Calendar Days = 29 Total Fuel Cost = $264,000 Total Per Diem Cost = $29,000
Total Cost = $322,300
Phase I, Part 2 Once optimal flight parameters are established in Part 1, a small areaSmall area proof will be flown with airborne gravity. A most likely choice at this time isof operations the Puerto Rico and U.S. Virgin Islands territory. The region has
long had sparse gravity coverage (see plot on next page). Note, in the figure below, along the north shore, the main island of Puerto Rico has reasonably good gravity coverage, however the remainder of the island is less well covered—a function of the population distribution, as well as topography. The use of airborne gravimetry will insure full coverage of the entire island, including the region directly to the north where the Puerto Rico trench has some of the largest gravity gradients on Earth.

The GRAV-D Project: Gravity for the Redefinition of the American Vertical Datum
Page �� 12/19/07
Similarly, the U.S. Virgin Islands region (in the next figure) is seen to have even less acceptable coverage. Specifically, the island of St. John shows only shoreline measurements (the ruggedness of the inland topography explains this), and the southernmost island of St. Croix has only 18 measured gravity marks, despite being the largest of the three major islands. Further complicating the issue is the question of how the absolute values of gravity were determined on the islands. While metadata on this issue is missing, the likely answer is that no absolute gravity meters were used on the islands themselves, but rather a boat or airplane was used to transport a relative gravity meter from some known absolute site (in Florida, possibly) to establish “excenters” on the islands. Excenters serve the function of an absolute site, without the high accuracy and repeatability associated with an actual absolute gravity measurement site. For this reason, at least three permanent absolute gravity sites on each of the three main islands will be established as part of this survey.
Furthermore, considering the scarcity of relative data on each of these islands (and the lack of metadata regarding the absolute sites or excenters they refer to), and the need to validate the use of airborne as a sole-source gravity collection platform in an operational mode, there will be the need

The GRAV-D Project: Gravity for the Redefinition of the American Vertical Datum
Page ��12/19/07
to densify on-the-ground relative gravity measurements on each island. These measurements will be based on the new absolute marks and will serve as ground validation of the airborne data.
Success in this part of Phase I will be declared by the ability of the airborne data to yield gravimetric information that not only matches the terrestrial measurements, but which can be used to compute an accurate gravimetric geoid model (to 1 cm accuracy), without needing those terrestrial marks. If this can be proven, then Phase II should begin. If there are failures during this proof-of-concept, then further tests will need to be designed prior to beginning the Phase II.
Initial flight estimates will be used for the rest of this report, though they may be slightly modified once Phase I, Part 1 yields the optimal combination of flight height, spacing, and speed.
The area necessary to survey Puerto Rico and the Virgin Islands area, including the Puerto Rico Trench, is about 190,000 square km (see figure above).
Phase I, Part 2 (PR/VI) Total Square Km = 190,000Approximate Cost Total Flight Hours = 100
Total Fuel Cost = $300,000 Total Per Diem Cost = $33,000
Total Cost = $366,300
Image: Courtesy of Google Earth

The GRAV-D Project: Gravity for the Redefinition of the American Vertical Datum
Page �� 12/19/07
Phase II Phase II, the largest component of the survey, encompasses the operational observation of airborne gravity over the entire region of the United States, including an average of 100 km of littoral regions surrounding the land areas. These surveys will be performed in the order of need and fund availability, but are subject to change, based on a variety of factors.
Phase II, Part 1 For the first part of operational flights, the Alaskan littoral regions willAlaskan Littoral Regions be covered (due to the sparseness of data in both Alaska and any littoral(excluding the Aleutians) regions). From a broad planning perspective, there are approximately
6,500 linear kilometers of non-Aleutian coastline1 to fly (see figure below).
The approximate area covered is shown in light purple in the next figure.This region encompasses approximately 1,040,000 square km.
Phase II, Part 1 Total Square Km = 1,040,000(Alaskan Littoral) Total Flight Hours = 681Approximate Cost Total Calendar Days = 224 Total Fuel Cost = $2,043,000 Total Per Diem Cost = $224,000
Total Cost = $2,493,700
� This is a highly coarse figure, and does not represent the fractal nature of the shoreline, but merely a broad linear generalization upon which to plan littoral flight patterns. See Appendix A.
Phase II, Part 2 There is sparse terrestrial gravity coverage for the entire southern half of the state of Alaska (see figure below). The sparse coverage could be rectified with an intense “boots-on-the-ground” survey, however the required time and effort necessary would be significantly higher than an airborne campaign.
Because an existing Arctic Gravity Project was coordinated by the National Geospatial Intelligence Agency (NGA) in 1998-2000 (not shown in the figure above), this survey will treat the areas of Alaska south of 64 degrees north latitude as the most critical part of the state to be covered (shown in blue in the next figure). It will be possible to fly much longer flight lines, because the relatively small (150 km) flight lines of the littoral region will no longer constrain the survey, and increased efficiency (reduced number of turns) will be possible.
Image: Courtesy of Google Earth

The GRAV-D Project: Gravity for the Redefinition of the American Vertical Datum
Page ��12/19/07
Phase II, Part 2 There is sparse terrestrial gravity coverage for the entire southern half of the state of Alaska (see figure below). The sparse coverage could be rectified with an intense “boots-on-the-ground” survey, however the required time and effort necessary would be significantly higher than an airborne campaign.
Because an existing Arctic Gravity Project was coordinated by the National Geospatial Intelligence Agency (NGA) in 1998-2000 (not shown in the figure above), this survey will treat the areas of Alaska south of 64 degrees north latitude as the most critical part of the state to be covered (shown in blue in the next figure). It will be possible to fly much longer flight lines, because the relatively small (150 km) flight lines of the littoral region will no longer constrain the survey, and increased efficiency (reduced number of turns) will be possible.
Image: Courtesy of Google Earth

The GRAV-D Project: Gravity for the Redefinition of the American Vertical Datum
Page �� 12/19/07
The estimates for the south, inland Alaska survey are as follows:
Phase II, Part 2(Alaska, South)Approximate Cost
Total Square Km = 465,500 Total Flight Hours = 305 Total Calendar Days = 100 Total Fuel Cost = $915,000 Total Per Diem Cost = $100,000
Total Cost = $1,116,500
Phase II, Part 3 The coastal regions of the conterminous United States will be flownLittoral CONUS regions next, due to the lack of existent littoral gravity data and the population
living near the coast of CONUS. For the computation of flight lines, the linear km of coastline are approximately (see figures):
Image: Courtesy of Google Earth
Images: Courtesy of Google Earth

The GRAV-D Project: Gravity for the Redefinition of the American Vertical Datum
Page ��12/19/07
Pacific CONUS: ~2300 km Atlantic CONUS: ~5200 km
These ~7500 km of coastline translate into approximately 1,386,000 square km of flown area, from 100 km offshore to 50 km on shore.
The approximate areas to be covered can be seen in orange in the next figure:
Phase II, Part 3 Total Square Km = 1,386,000(CONUS, Littoral) Total Flight Hours = 726Approximate Cost Total Calendar Days = 239 Total Fuel Cost = $2,178,000 Total Per Diem Cost = $239,000
Total Cost = $2,658,700
Phase II, Part 4 There are a number of disparate regions to be covered in the PacificPacific Oceanic Regions region. Each region will be flown as its own mission, using local(Hawaii, Aleutians, Guam airports as the base of operations, prior to moving the airborne and the Northern gravimeter to another region for coverage.Marianas, Samoa)
Flexibility will be required for the order of coverage of the next four regions, however considering the lack of attention each of these regions has had in gravity surveying and geoid modeling over the years, all are due for updates.
Reference the figures showing the regions to be covered.
Image: Courtesy of Google Earth

The GRAV-D Project: Gravity for the Redefinition of the American Vertical Datum
Page �� 12/19/07
Guam and Northern Marianas Existing Coverage
Proposed Coverage for new Airborne Gravity Survey
The total 585,000 Sq km area covered in this survey yields the following estimates:
Phase II, Part 4a Total Square Km = 585,000(Guam and Northern Marianas) Total Flight Hours = 306Approximate Cost Total Calendar Days = 101 Total Fuel Cost = $918,000 Total Per Diem Cost = $101,000
Total Cost = $1,120,900
Image: Courtesy of Google Earth

The GRAV-D Project: Gravity for the Redefinition of the American Vertical Datum
Page ��12/19/07
Hawaii
Coverage for the entire state of Hawaii would be flown, entailing a predominantly linear northwest/southeast pattern. It will be the first time airborne gravity will be flown over the region, and it will provide the systematic definition of a single vertical datum for the entire state, consistent island-to-island. As previous vertical datums in the region were defined one island at a time, the consistency of this datum will be a significant advantage for modeling the environmental impacts of ocean rise across the state, both in the more populated southeast portion and the more wildlife dominated northwest portion.
Note in the coverage plot (below) the extreme sparsity of existing terrestrial gravity coverage. With almost no data on the highest points of most islands, the coverage tends to support biased geoid determination, and the new airborne survey would help rectify the situation.
The proposed airborne survey region can be seen in the next figure. The size of this region is approximately 687,000 Sq km.
Phase II, Part 4b Total Square Km = 687,000(Hawaii) Total Flight Hours = 360Approximate Cost Total Calendar Days = 119 Total Fuel Cost = $1,080,000 Total Per Diem Cost = $119,000
Total Cost = $1,318,900

The GRAV-D Project: Gravity for the Redefinition of the American Vertical Datum
Page �0 12/19/07
Samoa The American Samoa region—much like Guam and the Northern Marianas—has had no significant efforts put forth by NGS to either survey gravity or model the geoid. As such, coverage of gravity comes from outside of NGS and is much sparser than needed to accurately model the geoid.
(Points shown outside the boundary of the island indicate errors in either the boundary or the reported location of point gravity, further calling into question the need for an improved data set).
Image: Courtesy of Google Earth

The GRAV-D Project: Gravity for the Redefinition of the American Vertical Datum
Page ��12/19/07
The proposed airborne survey region, covering some 160,000 Sq km, is shown below:
Phase II, Part 4c Total Square Km = 160,000(Samoa) Total Flight Hours = 84Approximate Cost Total Calendar Days = 28 Total Fuel Cost = $252,000 Total Per Diem Cost = $28,000
Total Cost = $308,000
Aleutian Islands The Aleutian island chain compromises a long linear survey region, allowing for longer survey flight lines (which may be required to work between the few appropriate airports in the region). The entire region is tectonically active and has never been adequately surveyed for gravity. The Aleutians is a region requiring significant attention in the second campaign, tracking gravity over time.
The region to be covered will run approximately 100 km on both the north and south edge of the Aleutians, extended slightly more to the south to encompass the region of the Aleutian trench.
Image: Courtesy of Google Earth
Image: Courtesy of Google Earth

The GRAV-D Project: Gravity for the Redefinition of the American Vertical Datum
Page �� 12/19/07
The proposed airborne survey region covers approximately 720,000 square kilometers.
Phase II, Part 4d Total Square Km = 720,000(Aleutians) Total Flight Hours = 472Approximate Cost Total Calendar Days = 156 Total Fuel Cost = $1,416,000 Total Per Diem Cost = $156,000
Total Cost = $1,729,200
Phase II, Part 5 While the mainland CONUS regions are well covered with historicalInland CONUS terrestrial gravity coverage, the consistency and accuracy of the data
is called into question when one considers the thousands of different surveys, hundreds of sources, and the decades which are part of the ~two million data points. As described earlier, the use of gravity data to define a vertical datum requires accuracy and consistency not supported by the existing gravity holdings. Only an airborne gravity campaign can provide the required data in a timely fashion.
With the littoral regions already covered, the interior is what will remain of CONUS. The region of interest is shown in blue in the figure below (to contrast with the orange littoral regions):
The combination of airport availability and the extensive size of the region to be covered will allow for long lines to be flown—much longer than in the littoral regions. Longer lines will aid in the efficiency of the survey, as less turns will be required. By the best estimates in flight planning, it will take approximately 2,250 flight hours to cover the inland CONUS region of 6,923,945 sq km.
Image: Courtesy of Google Earth
The GRAV-D Project: Gravity for the Redefinition of the American Vertical Datum
Page ��12/19/07
Phase II, Part 5 Total Square Km = 6,923,945(Inland CONUS) Total Flight Hours = 3,627Approximate Cost Total Calendar Days = 1,193 Total Fuel Cost = $10,881,000 Total Per Diem Cost = $1,193,000
Total Cost = $13,281,400
Phase II, Part 6 Northern Alaska
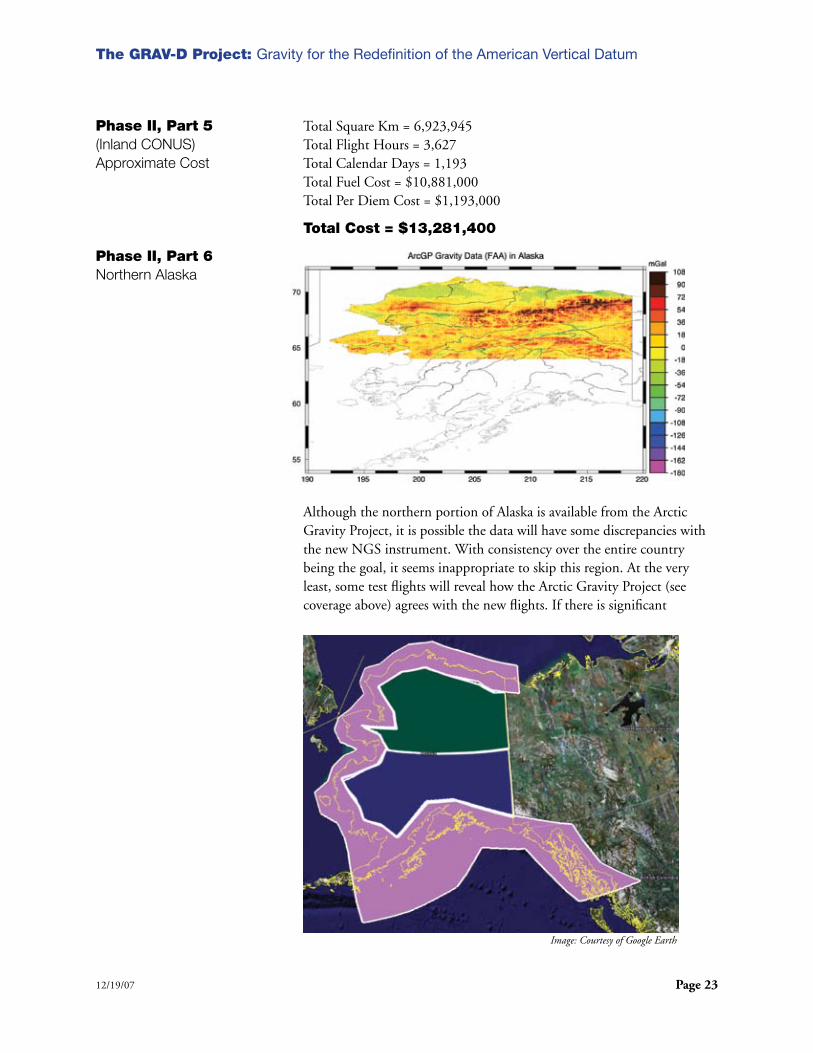
Although the northern portion of Alaska is available from the Arctic Gravity Project, it is possible the data will have some discrepancies with the new NGS instrument. With consistency over the entire country being the goal, it seems inappropriate to skip this region. At the very least, some test flights will reveal how the Arctic Gravity Project (see coverage above) agrees with the new flights. If there is significant
Image: Courtesy of Google Earth
The GRAV-D Project: Gravity for the Redefinition of the American Vertical Datum
Page �� 12/19/07
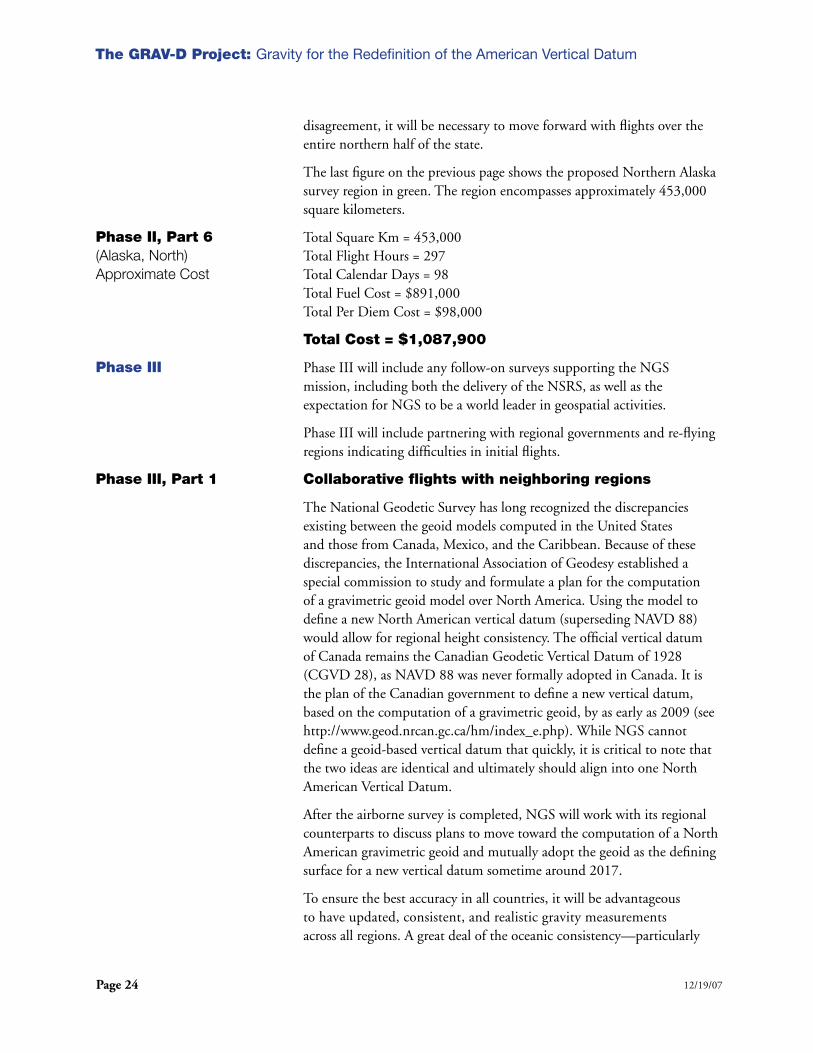
disagreement, it will be necessary to move forward with flights over the entire northern half of the state.
The last figure on the previous page shows the proposed Northern Alaska survey region in green. The region encompasses approximately 453,000 square kilometers.
Phase II, Part 6 Total Square Km = 453,000(Alaska, North) Total Flight Hours = 297Approximate Cost Total Calendar Days = 98 Total Fuel Cost = $891,000 Total Per Diem Cost = $98,000
Total Cost = $1,087,900
Phase III Phase III will include any follow-on surveys supporting the NGS mission, including both the delivery of the NSRS, as well as the expectation for NGS to be a world leader in geospatial activities.
Phase III will include partnering with regional governments and re-flying regions indicating difficulties in initial flights.
Phase III, Part 1 Collaborative flights with neighboring regions
The National Geodetic Survey has long recognized the discrepancies existing between the geoid models computed in the United States and those from Canada, Mexico, and the Caribbean. Because of these discrepancies, the International Association of Geodesy established a special commission to study and formulate a plan for the computation of a gravimetric geoid model over North America. Using the model to define a new North American vertical datum (superseding NAVD 88) would allow for regional height consistency. The official vertical datum of Canada remains the Canadian Geodetic Vertical Datum of 1928 (CGVD 28), as NAVD 88 was never formally adopted in Canada. It is the plan of the Canadian government to define a new vertical datum, based on the computation of a gravimetric geoid, by as early as 2009 (see http://www.geod.nrcan.gc.ca/hm/index_e.php). While NGS cannot define a geoid-based vertical datum that quickly, it is critical to note that the two ideas are identical and ultimately should align into one North American Vertical Datum.
After the airborne survey is completed, NGS will work with its regional counterparts to discuss plans to move toward the computation of a North American gravimetric geoid and mutually adopt the geoid as the defining surface for a new vertical datum sometime around 2017.
To ensure the best accuracy in all countries, it will be advantageous to have updated, consistent, and realistic gravity measurements across all regions. A great deal of the oceanic consistency—particularly

The GRAV-D Project: Gravity for the Redefinition of the American Vertical Datum
Page ��12/19/07
non-littoral, deep water regions—will be controlled by satellite altimeter data. However, much of the terrestrial and littoral regions in this area have either sparse or aged terrestrial gravity data. NGS plans to work with regional governments interested in collaborating on airborne gravity surveys in their own regions, either through technology transfers or other joint efforts.
In order to cover a minimum of all of Alaska, Hawaii, CONUS, Canada and Mexico, Central America, and the Caribbean, the area of computation for a North American geoid would fall within the following simply described region:
On the north by the North Pole On the south by 5° North latitude On the west by 172°E longitude (8 degrees west of the International
Date Line) On the east by 50°W longitude.
See Figure below for the computational area of a single North American Geoid Model.
Approximate Cost Unknown—depends on need, partnerships, and funding opportunities.(Regional Surveys)
Phase III, Part 2 No standing plan for this Phase III, Part 2 exists, but it is reserved for re-flights of regions whose initial data showed any problems. For example, since the Puerto Rico/Virgin Islands portion of the survey occurs early in testing, it is possible that a re-flight of portions of that region may be necessary, though it is hoped such a contingency will not be required.
Image: Courtesy of Google Earth
The GRAV-D Project: Gravity for the Redefinition of the American Vertical Datum
Page �� 12/19/07
Approximate Cost Unknown—depends on need and funding opportunities.(Re-flights)
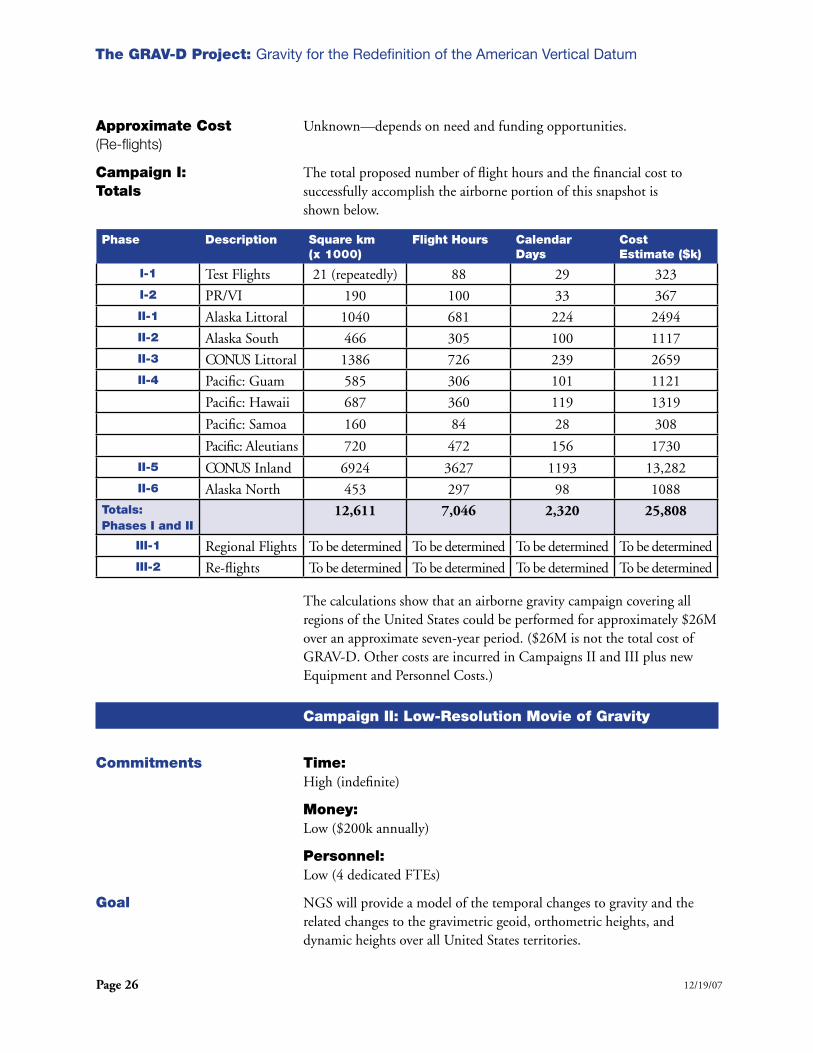
Campaign I: The total proposed number of flight hours and the financial cost toTotals successfully accomplish the airborne portion of this snapshot is
shown below.
The calculations show that an airborne gravity campaign covering all regions of the United States could be performed for approximately $26M over an approximate seven-year period. ($26M is not the total cost of GRAV-D. Other costs are incurred in Campaigns II and III plus new Equipment and Personnel Costs.)
Campaign II: Low-Resolution Movie of Gravity
Commitments Time: High (indefinite)
Money: Low ($200k annually)
Personnel: Low (4 dedicated FTEs)
Goal NGS will provide a model of the temporal changes to gravity and the related changes to the gravimetric geoid, orthometric heights, and dynamic heights over all United States territories.
Phase Description Square km (x 1000)
Flight Hours Calendar Days
Cost Estimate ($k)
I-1 Test Flights 21 (repeatedly) 88 29 323I-2 PR/VI 190 100 33 367II-1 Alaska Littoral 1040 681 224 2494II-2 Alaska South 466 305 100 1117II-3 CONUS Littoral 1386 726 239 2659II-4 Pacific: Guam 585 306 101 1121
Pacific: Hawaii 687 360 119 1319
Pacific: Samoa 160 84 28 308
Pacific: Aleutians 720 472 156 1730II-5 CONUS Inland 6924 3627 1193 13,282II-6 Alaska North 453 297 98 1088
Totals:Phases I and II
��,��� �,0�� �,��0 ��,�0�
III-1 Regional Flights To be determined To be determined To be determined To be determinedIII-2 Re-flights To be determined To be determined To be determined To be determined

The GRAV-D Project: Gravity for the Redefinition of the American Vertical Datum
Page ��12/19/07
Overarching Strategy 1. Determine critical “episodic gravity sites” around the United States.
2. Set up and execute a regular schedule of absolute gravity measurements at these locales.
3. Using this data, in addition to other temporal gravity information (such as historic re-surveys and modern satellite missions, e.g. GRACE), produce a map of gravity velocities on a broad geographic scale.
4. Apply the gravity velocities toward gravimetric geoid undulation velocities, orthometric height velocities and dynamic height velocities
For now, the following table and figures show the approximate count of points required for surveying in a repeated, episodic fashion.
For CONUS, it will be necessary to have a broad coverage of points well spaced, but with essential locales covered. For example, in order to model known height changes, there must be points near the Great Lakes, Southern California, and Louisiana. Additionally, NGS has a long historical re-survey record in Arizona and should make use of that site. Finally, NGS has been running a superconducting gravimeter at Table Mountain Gravity Observatory in Boulder, Colorado for many years. Such a site represents excellent gravity velocity tracking which should be calibrated relative to repeated absolute gravity measurements episodically. Nonetheless, the exact number and location of all other sites remains open for exact mission planning sessions.
Location CONUS Alaska Hawaii PR/VI Guam Samoa
# sites 12 8 7 4 2 2
Image: Courtesy of Google Earth
The GRAV-D Project: Gravity for the Redefinition of the American Vertical Datum
Page �� 12/19/07
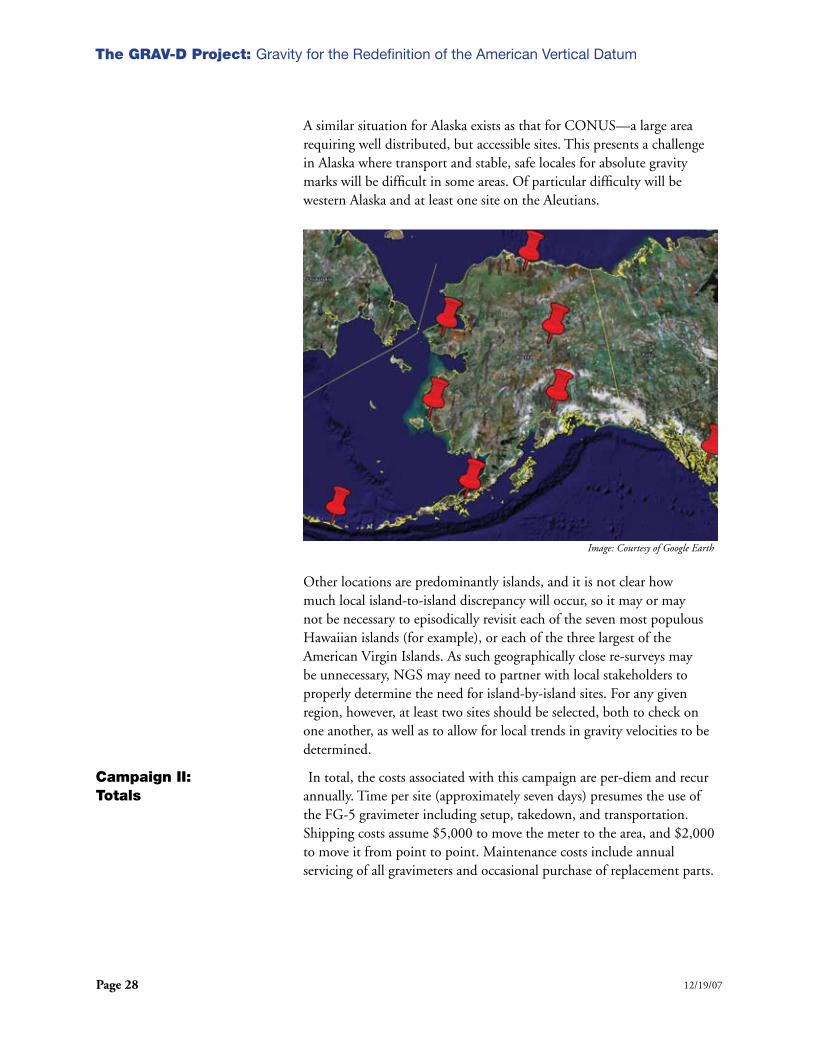
A similar situation for Alaska exists as that for CONUS—a large area requiring well distributed, but accessible sites. This presents a challenge in Alaska where transport and stable, safe locales for absolute gravity marks will be difficult in some areas. Of particular difficulty will be western Alaska and at least one site on the Aleutians.
Other locations are predominantly islands, and it is not clear how much local island-to-island discrepancy will occur, so it may or may not be necessary to episodically revisit each of the seven most populous Hawaiian islands (for example), or each of the three largest of the American Virgin Islands. As such geographically close re-surveys may be unnecessary, NGS may need to partner with local stakeholders to properly determine the need for island-by-island sites. For any given region, however, at least two sites should be selected, both to check on one another, as well as to allow for local trends in gravity velocities to be determined.
Campaign II: In total, the costs associated with this campaign are per-diem and recurTotals annually. Time per site (approximately seven days) presumes the use of
the FG-5 gravimeter including setup, takedown, and transportation. Shipping costs assume $5,000 to move the meter to the area, and $2,000 to move it from point to point. Maintenance costs include annual servicing of all gravimeters and occasional purchase of replacement parts.
Image: Courtesy of Google Earth

The GRAV-D Project: Gravity for the Redefinition of the American Vertical Datum
Page ��12/19/07
Results indicating an episodic campaign to measure absolute gravity—and thus track gravity, geoid, and height changes over time—can be performed for approximately $200,000 per year. (This is not the total cost of GRAV-D. Other costs are incurred in Campaigns I and III, plus new equipment and personnel costs.)
Campaign III: Terrestrial Partnership Surveys
If high resolution gravity changes in time were available everywhere, the National Geodetic Survey would plan to incorporate them into future height change models. However, NGS does not have the resources to track such localized features.
Additionally, NGS would prefer to have a “boots-on-the-ground” re-check of each place where new airborne gravity surveys disagree with existing terrestrial gravity data. In some cases, re-checks may be possible with NGS field parties, but in general such surveys are expected to rely heavily upon the partnerships NGS has formed, and will form, through a National Height Modernization program.
In both cases, regional features of the gravity field will require occasional spot checks, or (in the case of areas with significant subsidence issues), will require regularly scheduled, dense re-surveys in a small region. NGS will engage local partners in the surveys, including loaning equipment and providing training in the use of the equipment, and submittal of processed data to NGS.
Furthermore, as mentioned earlier in this plan, there is the potential for localized geoid slopes to be directly determined from field surveys of co-located (space and time) leveling and GPS. NGS has a duty to
Area Number ofSites
Per Diem Costs ($k)
Shipping Costs ($k)
Annual Cost Estimate
CONUS 12 16.8 29 45.8Alaska 8 11.2 21 32.2Hawaii 7 9.8 19 28.8Guam 2 2.8 9 11.8Samoa 2 2.8 9 11.8PR/VI 4 5.6 13 18.6Survey Total �� ��.0 �00 ���EquipmentMaintenance
��
Grand Total �00

The GRAV-D Project: Gravity for the Redefinition of the American Vertical Datum
Page �0 12/19/07
produce a manual on how surveys should be conducted, but in the interim, any geodetic quality GPS surveys conducted within weeks of 1st order leveling surveys, and which have not been adjusted to pre-published passive mark coordinates, will be useful.
Further details on this section will not be fleshed out, as the nature and scope of such work is of such potential diversity as to preclude any formal plan.
Equipment and Personnel Changes
The National Geodetic Survey has performed an impressive log of accomplishments on geoid modeling while maintaining minimal personnel and equipment. Compared to many projects, these efforts have been highly successful, relative to the resources assigned. Nonetheless, a radical shift in emphasis upon determination of heights (meaning geoid modeling, and thus gravity surveying) at NGS as explained in this plan must mean serious changes to personnel and equipment associated with the effort.
Required Changes: As much of this plan requires the collection, processing, and storageEquipment of field data, some equipment upgrades will obviously be necessary.
And while it is possible (maybe even likely) that the airborne portion of this plan will be executed by partnering with multiple groups, it will be necessary to prepare for the worst-case scenario—for NGS to perform the collection solely with one airborne instrument.
The table below captures the minimal equipment needed on hand, compared with the current situation.
* As of October 25, 2007 NGS has acquired an airborne gravimeter.
Description Fully Equipped
Current Number
Shortage Cost ($k)
Airborne Gravimeter(including all peripherals, GPS,software, and training)
1 1* 0 ___
FG-5 Absolute Gravimeter 1 1 0 ___
A-10 Absolute Gravimeter 1 0 � $�00
Relative Gravimeters (non-digital) 4 4 0
Relative Gravimeters (digital) 2 0 � $��0
Data Storage RAID 1 0 � $�0
Total New Equipment Costs $��0

The GRAV-D Project: Gravity for the Redefinition of the American Vertical Datum
Page ��12/19/07
Required Changes: The performance of all tasks in the plan will require a team ofPersonnel & Training dedicated, full-time personnel, either government employees or
contractors. Other long-term staffing solutions may also be sought, provided the funding source is stable and long-term. At a very minimum, the table on the next page shows the final, full staff, compared with the current situation:
Some of the changes may be accomplished simply by training existing personnel on new equipment. Still, the sheer scope of this work compared with the size of the NGS staff indicates it may be prudent to advertise for specific jobs. At a minimum, the following new hires should be advertised as soon as possible:
New Hires (immediate) One Absolute Gravimeter Operator (Both FG-5 and A-10)Two Airborne Gravimeter Operators One Gravity Database Manager One Gravity Data Programmer and Processor
New Training (immediate) Six to 10 persons on the use of existing relative gravimeters in the NGS holdings One to two persons on the complete operational capability of the NGS FG-5
Once new hires and new training are in place, a re-evaluation of the shortfalls will tell whether to pursue more hires or more training to complete the team.
Description Fully Staffed
Current Number
Shortage
Research Geodesists(Gravimetric)
5 3 �
Airborne GravimeterOperator
2 0 �
FG-5 / A-10 Operator 3 2 �
Relative GravimeterOperator
10 (@10%) 1 (@10%) � (@�0%)
Gravity Database Manager 1 0 �
Applications Programmers 2 1 �
Total Number of NewPersonnel
�.�
X $��0k /person X �0 years
New Personnel Costs ($k)—over ten-year span of this project
��,��0

The GRAV-D Project: Gravity for the Redefinition of the American Vertical Datum
Page �� 12/19/07
Total Cost of the GRAV-D Project
Campaign I $26.0 M Campaign II $ 0.2 M (annually)Campaign III To be determined (likely through external funds)New Equipment $ 0.6 MPersonnel $11.9 M
Totals $38.5 M (one time cost) $ 0.2 M (annual maintenance)
The expected cost of GRAV-D, over the course of an approximately seven-to-ten year highly active period, is $38.5M above base funding, with a follow-up cost of $0.2M (coming directly from base funding).

The GRAV-D Project: Gravity for the Redefinition of the American Vertical Datum
Page ��12/19/07
Appendix A: The coastline of the United States is fractal in nature, its level of“Length of the shoreline” complexity is infinite, and the exact length of the shoreline is incalculable
as length can always be increased by increasing the level of complexity.
In order to compute flight plans, however, a coarse estimate of the actual length of the coastline must be determined. Known as “generalization”, the estimate can be equated—for the purposes of this discussion—with “digitization”. Examples for the east and west coasts of CONUS, the non-Aleutian Alaskan coast, and the Aleutians themselves are presented in the next four figures.
With approximately 17,000 km of shoreline to cover, there is about �00,000 km of flight distance for the entire littoral region of the United States (including Hawaii, Puerto Rico and the Virgin Islands, and other island territories.), flown in perpendicular-to-the-coast lines spaced 10 km apart, from 50 km onshore to 100 km offshore, with crossing tracks at about 40 km.
Figure � Digitization of the East Coast of CONUS showing ~5200 km of shoreline.
Image: Courtesy of Google Earth

The GRAV-D Project: Gravity for the Redefinition of the American Vertical Datum
Page �� 12/19/07
Figure � Digitization of the West Coast of CONUS showing ~2300 km of shoreline.
Figure � Digitization of the non-Aleutian Alaskan coast showing ~6500 km of shoreline.
Image: Courtesy of Google Earth
Image: Courtesy of Google Earth

The GRAV-D Project: Gravity for the Redefinition of the American Vertical Datum
Page ��12/19/07
Figure � Digitization of the Aleutians showing ~1700 km of shoreline. (In this case, however, flights will not go “inland” and “out to sea”, but rather “sea to sea, crossing over the island chain”).
These four shorelines add up to approximately 15,700 km. Since Alaska and CONUS represent 93% of the coastline of the United States (the other 7% being the Great Lakes, Hawaii, Puerto Rico, the Virgin Islands and other island territories), the approximate length of coastline to be surveyed by airborne gravimetry is approximately 17,000 km. This figure is presented solely because the airborne gravity survey will likely be done “Littoral first, inland later”, and it is necessary to plan for the amount of littoral regions being surveyed by generalizing the shoreline length.
Image: Courtesy of Google Earth

The GRAV-D Project: Gravity for the Redefinition of the American Vertical Datum
Page �� 12/19/07
Appendix B: The word “height” has no singular meaning—there are many types ofOrthometric Height, “height,” and in the United States alone, there are three primary height Ellipsoid Height, systems in every day use. The two heights of primary concern to this planand the Geoid are “orthometric height” and “ellipsoid height”. Some basic definitions follow:
Orthometric Height (H) The distance (in a positive outward direction) along the plumb line from the geoid to the point of interest
Ellipsoid Height (h) The distance (in a positive outward direction) along the ellipsoidal normal from some chosen ellipsoid to the point of interest
The orthometric height is often colloquially, though somewhat incorrectly, referred to as a “height above sea level”. Also, these definitions use terms that themselves require defining:
The Plumb Line The locus of points connecting two points which is everywhere parallel to the direction of gravity. (For clarification purposes, gravity does not merely point “downward”, but in fact tilts slightly, based on the local distribution of masses)
EllipsoidA simple mathematical shape formed by spinning an ellipse around its semi-minor axis. (For clarification purposes, such a shape is used to provide a grid for latitude and longitude by placing the center of the ellipsoid at or near the Earth’s center of mass and aligning the semi-minor axis with Earth’s rotational axis. Note that many shapes, sizes, and orientations with respect to the actual Earth have been used by scientists over the years and adopted by various countries as “official”. Thus, there is no way to define a singular “the ellipsoid” the way there is for “the geoid”.
The Geoid The equipotential surface which best fits (in a least squares sense) to global mean sea level. (Note that this is why orthometric heights are often called “heights above sea level”)
Equipotential Surface A surface in Earth’s gravity field where all values of gravity potential energy are constant
Finally, to complete the puzzle, a quantity called a geoid undulation must be defined:
Geoid Undulation (N) The distance (in a positive outward direction) along the ellipsoidal normal from some chosen ellipsoid to the geoid

The GRAV-D Project: Gravity for the Redefinition of the American Vertical Datum
Page ��12/19/07
The figure below shows geometrically how these quantities interrelate.
As can be seen, the orthometric height, being measured along the plumb line, may be curved, while both the ellipsoid height and geoid undulation are along the straight ellipsoidal normal. This yields the approximation of H=h-N, which is generally accurate to approximately one mm accuracy at any location in the United States.
All of this is important because of a few simple facts:
1. The use of GPS technology has made the determination of ellipsoid heights very fast (minutes) and very accurate (a few cm).
2. Most maps use orthometric heights.
Specific to fact number two above, orthometric heights are predominantly used because they have a humanly intuitive meaning (you are more or less at height = 0 at the coastline), and because orthometric heights have a very strong correlation (>99%) with the direction of water flow. That is, water will almost always flow from values of larger orthometric heights to values of smaller orthometric heights. The same cannot be said of ellipsoid heights!
Unfortunately, orthometric heights can only be determined with high precision through geodetic leveling, a very costly method (in terms of both time and money), particularly when compared with the relative ease and low cost of GPS. The accuracy of orthometric heights depends upon the accuracy of the chosen vertical datum surface relative to the geoid, and in CONUS, this would be the separation between the NAVD 88 reference surface and the geoid. Current estimates at NGS place the separation at several decimeters, with geographically dependent variations.

The GRAV-D Project: Gravity for the Redefinition of the American Vertical Datum
Page �� 12/19/07
It would be of greatest service to cartographers (that is to say, hundreds of federal, state and municipal governments) if orthometric heights could be determined with the same speed and accuracy as ellipsoid heights. If the geoid undulations were known to a high accuracy (1 cm), the use of GPS, combined with a geoid model, would rival the most accurate geodetic leveling precisions (though not accuracies) while costing ten or more times less in both time and money.
The theory necessary to compute a model of the geoid has long been known for accuracies of a meter or more, and over the last few decades, that theory has been refined to the level of a few decimeters. Theoretical improvements are expected to reach the “one centimeter geoid” capability within ten years. Unfortunately, that theory is useless if the data necessary to exploit it is not available. And while many different types of data go into modeling the geoid, the single most important value are measurements of the acceleration of gravity near the surface of the Earth. Without those measurements, no model of the geoid can be created to fulfill the ultimate goal of yielding orthometric heights anywhere with the speed of GPS.
For this reason alone, one must know gravity—and track its changes through time—to model and monitor the geoid and, therefore, continue to provide up-to-date orthometric heights with the use of GPS technology.