greater mekong subregion: opportunities and challenges · greater mekong subregion: opportunities...
TRANSCRIPT

Greater Mekong Subregion:
Opportunities and Challenges
Craig Craig SteffensenSteffensen
DirectorDirector
Asian Development Bank/ThailandAsian Development Bank/Thailand
Presentation• Introduction: Asian Development Bank (ADB)
• ADB’s Role in Developing Regional Infrastructure- Greater Mekong Subregion (GMS) Economic Cooperation Program
• Myanmar in Transition
• Conclusion
2
Brief Introduction: ADB• ADB aims for an Asia and Pacific free from poverty.
Approximately 1.8 billion people in the region are poor and unable to access essential goods, services, assets and opportunities.
• Established in 1966, with 67 members - of which 48 are from within Asia and the Pacific and 19 outside. Japan and USA are the largest shareholders. 3,042 employees from 59 countries.
• First Loan (#0001): Industrial Finance Corporation of Thailand (Dec. 1967)
• Key operational modalities: sovereign and non-sovereign (private) lending, equity investments, guarantees, co-financing / syndications, grants, technical assistance, policy dialogue, knowledge and capacity development – to both public and private entities.
3
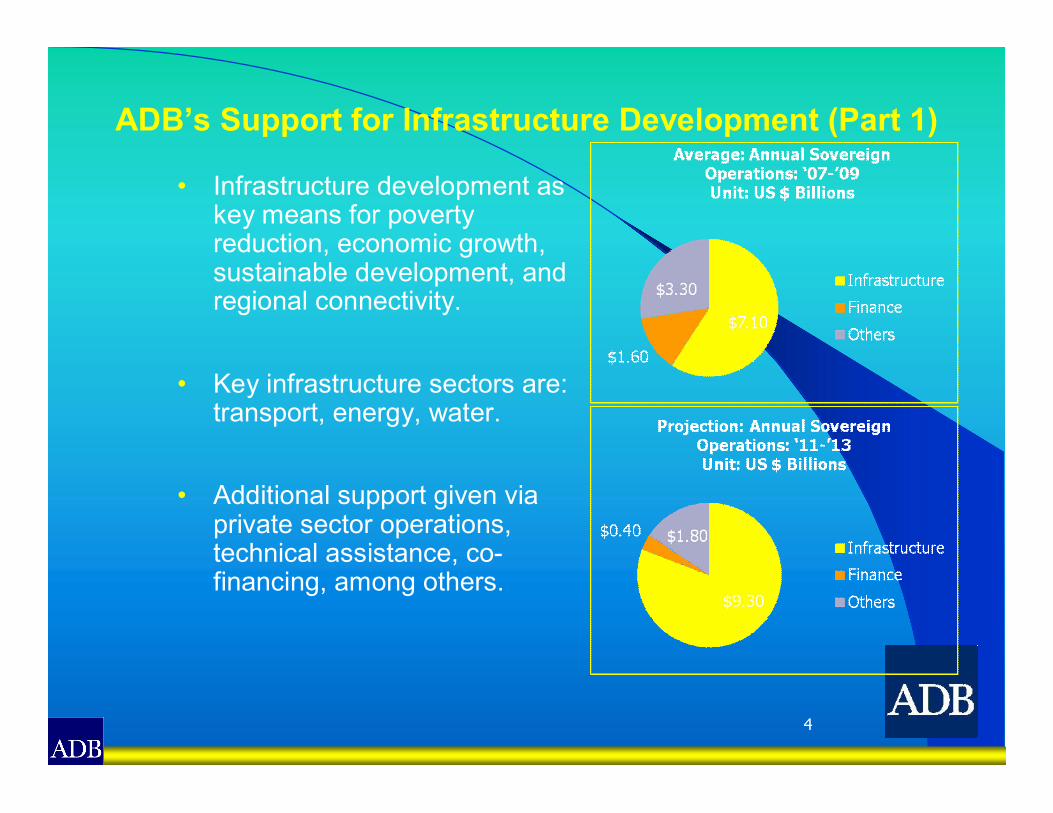
ADB’s Support for Infrastructure Development (Part 1)
• Infrastructure development as key means for poverty reduction, economic growth, sustainable development, and regional connectivity.
• Key infrastructure sectors are: transport, energy, water.
• Additional support given via private sector operations, technical assistance, co-financing, among others.
4

5
ADB’s Support for Infrastructure Development (Part 2)• Despite efforts by ADB &
others, demands are increasing.
• ADB & ADBI (2009) Infrastructure for a Seamless Asia identified around $8 trillion in needs over the next decade.
• Private infrastructure investment is limited. During 1990-2008, it was $1,640 billion for the world and $472 billion for Asia-Pacific.
• The PRC and India represent almost 50% of new private investments into the region during 2001-2008 .

6
ADB’s Support for Infrastructure Development (Part 3)• The large
infrastructure financing requirements reflect the requirements of the region.
• Quality / quantity is still behind the developed world, and disparity within the region remains.
ASEAN = Association of Southeast Asian Nations, km = kilometer, OECD = Organisation for Economic Co-operation and Development. Source: ADB, UNDP, and UNESCAP.2010. Paths to 2015: MDG Priorities in Asia and the Pacific.
Item Roads (km)
Rail (km)
Phones (number)
Electri-fication
Clean Water
Per 1,000 people PercentageASEAN 10.51 0.27 3.53 71.69 86.39
Asia 12.83 0.53 3.47 77.71 87.72
OECD 211.68 5.21 13.87 99.80 99.63
Latin America
14.32 2.48 6.11 92.70 91.37
Africa n.a. 0.95 1.42 28.50 58.36
Global Comparison in Infrastructure Coverage (2008)
With intra-regional trade increasing so quickly, the requirements will increase.

7
Recent Initiative: Asian Highway and Trans-Asian Railway (Part 1)
Major region-wide project • Asia Highway / Trans-
Asia Railway: almost 250,00km
• Connecting all major cities, capitals, and commercial areas
• Actively supported by the UNESCAP
ADB has been a major financier of AH: around 20% with $20 billion
An ongoing study with UNESCAP: updated information, prioritization of key projects, identification of possible financing
8
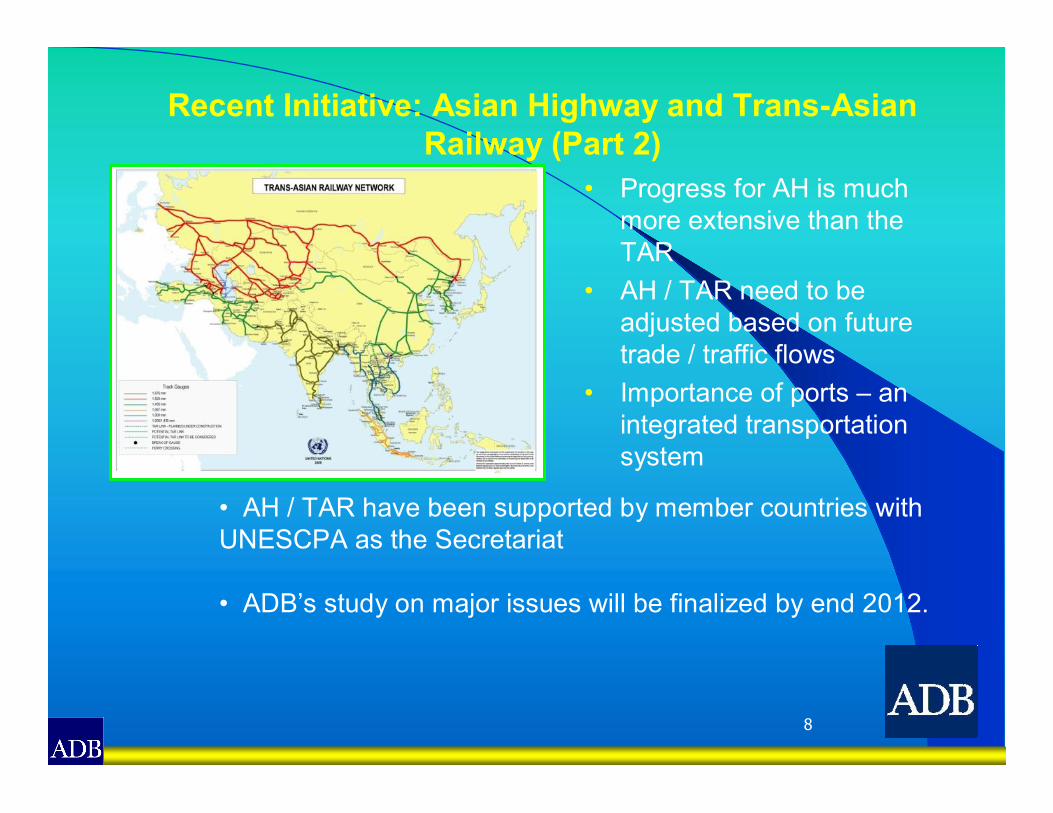
Recent Initiative: Asian Highway and Trans-Asian Railway (Part 2)
• Progress for AH is much more extensive than the TAR
• AH / TAR need to be adjusted based on future trade / traffic flows
• Importance of ports – an integrated transportation system
• AH / TAR have been supported by member countries with UNESCPA as the Secretariat
• ADB’s study on major issues will be finalized by end 2012.

GMS Program
•Participating Countries: Cambodia, People’s Republic of China, Lao PDR, Myanmar, Thailand, and Viet Nam
•Strategic Priorities:o Vision – a more integrated,
prosperous, and harmonious subregion
o “3Cs” – Connectivity, Competitiveness, Community
•GMS Projects:$14 billion as of June 2011$14 billion as of June 2011

10
GMS: Enhancing “Connectivity, Competitiveness and Community”
Strategic Framework: 2002Strategic Framework: 2002--20122012
Strategic ThrustsStrategic Thrusts GoalsGoalsVisionVision
••Strengthen Strengthen infrastructure linkagesinfrastructure linkages
••Facilitate crossFacilitate cross--border border trade, investment & trade, investment &
tourismtourism
••Enhance private sector Enhance private sector participation & participation &
competitivenesscompetitiveness
••Develop human Develop human resources & skills resources & skills
competenciescompetencies
••Protect environment & Protect environment & promote sustainable use promote sustainable use
of shared natural of shared natural resourcesresources
•• More More IntegratedIntegrated
•• ProsperousProsperous
•• HarmoniousHarmonious
•• SubregionSubregion
Action PlanAction Plan
•• Accelerated and Accelerated and sustained economic sustained economic growthgrowth
•• Reduced poverty & Reduced poverty & income disparitiesincome disparities
•• Improved quality of lifeImproved quality of life
•• Sustainable Sustainable management of management of environment & natural environment & natural resourcesresources
•• TransportTransport
•• TelecommunicationsTelecommunications
•• EnergyEnergy
•• EnvironmentEnvironment
•• Tourism Tourism
•• TradeTrade
•• InvestmentInvestment
•• Human Resource Human Resource DevelopmentDevelopment
•• AgricultureAgriculture

11
Institutional Structure
National Coordinating
Committee in Each Country
Ministerial-level Conference
Senior Officials’Meeting
Forums/Working Groups in Nine Priority Sectors
GMS Summit
ADB GMS
Secretariat
Priority Areas of Priority Areas of Cooperation:Cooperation:1.1.TransportTransport2.2.EnergyEnergy3.3.TelecommunicationsTelecommunications4.4.EnvironmentEnvironment5.5.AgricultureAgriculture6.6.TourismTourism7.7.Human resource Human resource developmentdevelopment8.8.Trade and transport Trade and transport facilitationfacilitation9.9.Investment Investment
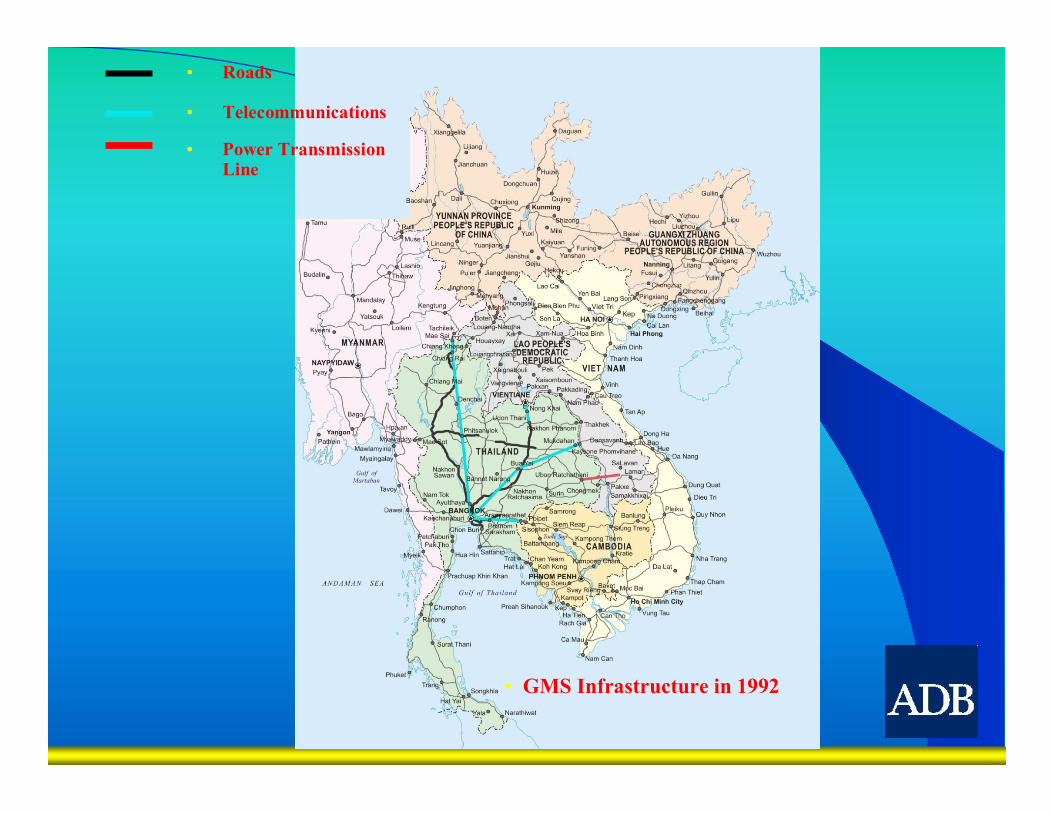
• Roads
• Telecommunications
• Power Transmission Line
• GMS Infrastructure in 1992

GMS Infrastructure in 2010
• Roads
• Telecommunications
• Power Transmission Line

GMS Infrastructure in 2015-2020
• Roads
• Telecommunications
• Power Transmission Line


20
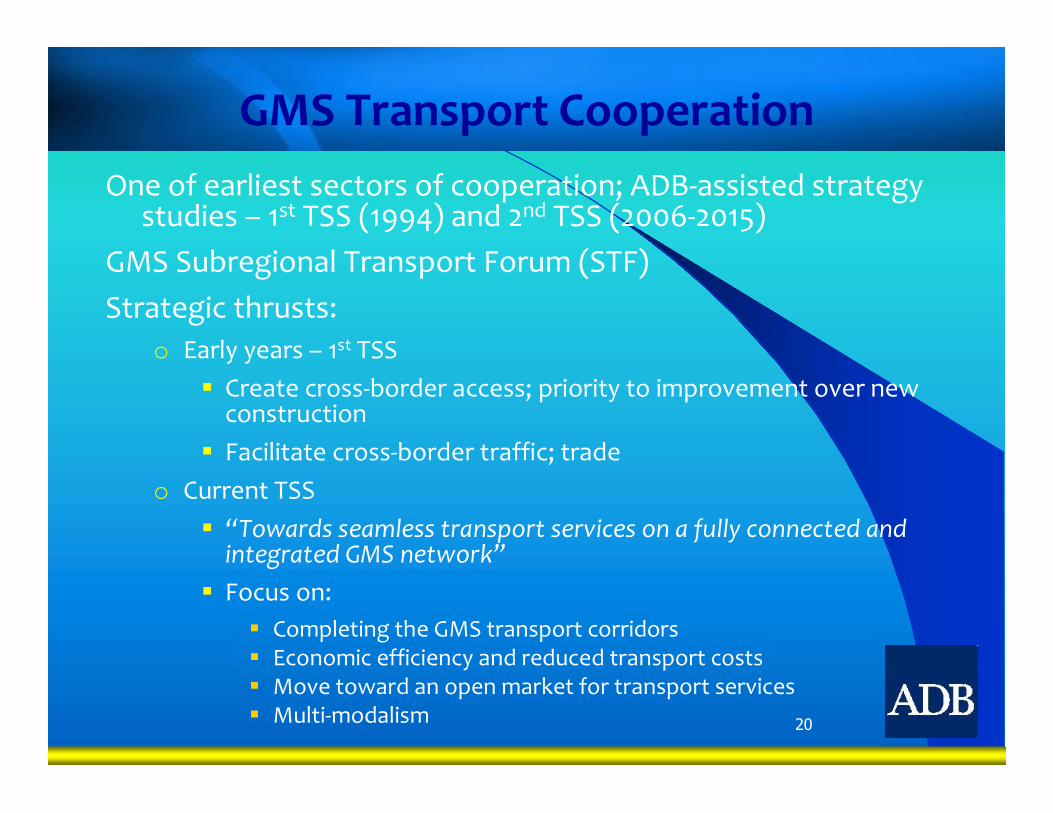
GMS Transport CooperationOne of earliest sectors of cooperation; ADB-assisted strategy
studies – 1st TSS (1994) and 2nd TSS (2006-2015)GMS Subregional Transport Forum (STF)Strategic thrusts:
o Early years – 1st TSS Create cross-border access; priority to improvement over new
construction Facilitate cross-border traffic; trade
o Current TSS “Towards seamless transport services on a fully connected and
integrated GMS network” Focus on:
Completing the GMS transport corridors Economic efficiency and reduced transport costs Move toward an open market for transport services Multi-modalism

21
ADB-assisted GMS Projects
(1992- December 2011)
No. of Financing (US $ millions)
Projects Total Cost ADB Government Cofinancing
All GMS Projects 55 15,006.6 5,102.8 4,311.5 5,592.3
Of Which:
Transport 34 11,788.8 4,418.4 4,127.7 3,242.7
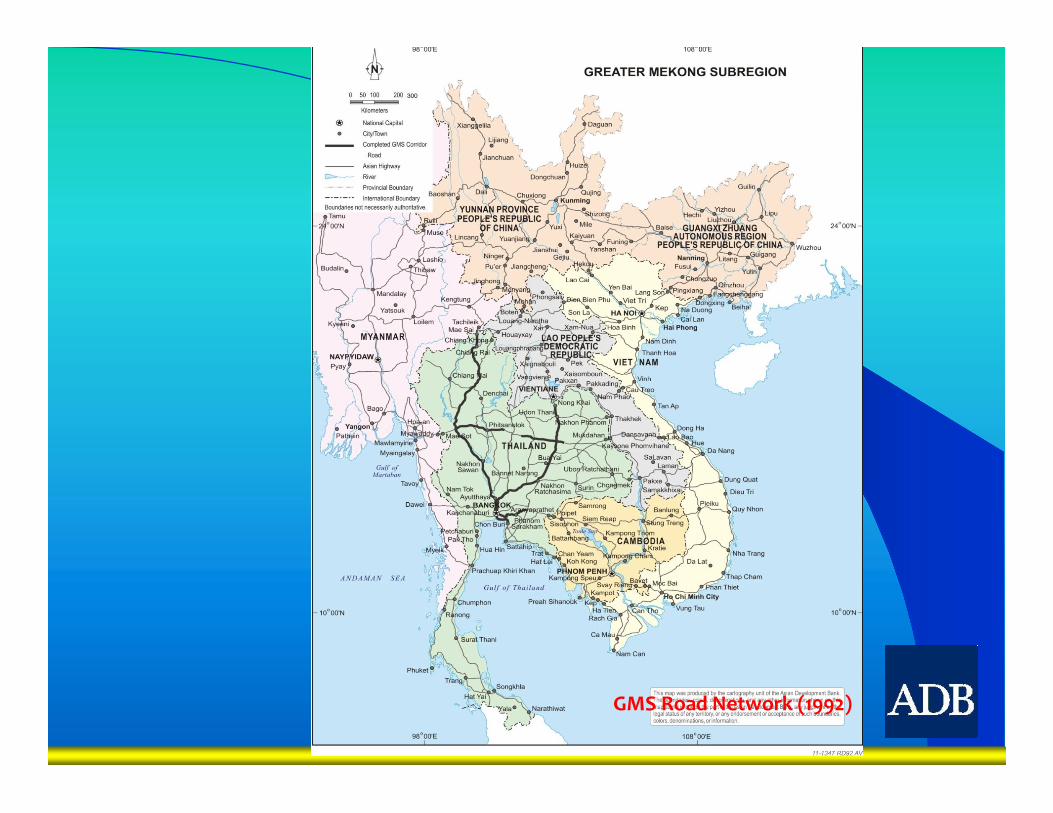
GMS Road Network (1992)

GMS Road Network (2010)

GMS Road Network (2015―2020)

25
Southern Transport Corridor : Phnom Penh-Ho Chi Minh City Highway Improvement Project
Key Outcomes
Travel time and cost savingsBilateral trade up 40%Border crossings up 50%Special border economic zones creating
jobs
East-West Transport Corridor Project
Travel time and cost savingsFDI: US$18M to US$200MImproved access to schools and
safe waterPoverty down by 35% in
Savannakhet
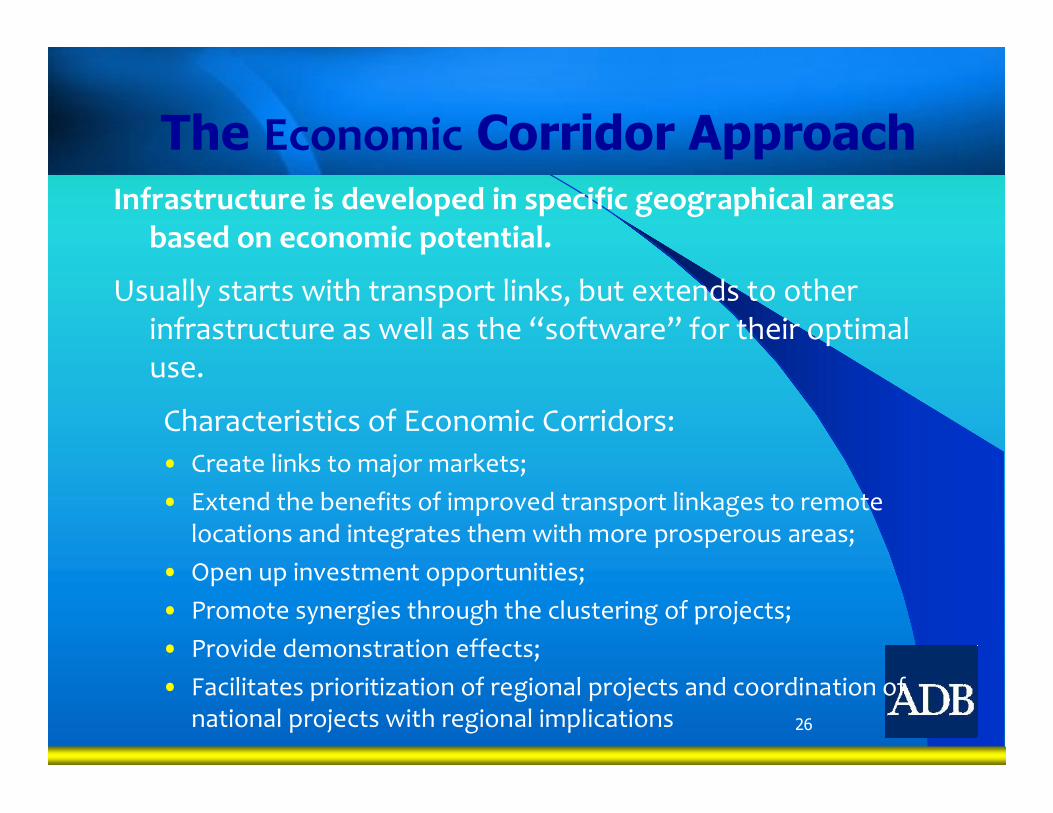
The Economic Corridor ApproachInfrastructure is developed in specific geographical areas
based on economic potential.
Usually starts with transport links, but extends to other infrastructure as well as the “software” for their optimal use.
Characteristics of Economic Corridors:• Create links to major markets;• Extend the benefits of improved transport linkages to remote
locations and integrates them with more prosperous areas;• Open up investment opportunities;• Promote synergies through the clustering of projects;• Provide demonstration effects;• Facilitates prioritization of regional projects and coordination of
national projects with regional implications 26
27

28
The New GMS Strategic Framework
New GMS SF endorsed by 4th Summit in December 2011, to ensure GMS Program’s sustainability and effectiveness in the challenging new decade
Continued central role of corridor developmentBroadening/deepening of economic corridors -- inter-
linkages across sectors, multi-sector approach, ensuring wide spread of benefits, accelerating implementation of TTF measures, logistics development and investments along the corridors, and attention to social and human resource, food and energy security, and climate change concerns
Need for a regional investment framework (RIF) -- new generation of cooperative undertakings based on solid analytical work and knowledge platform
29
• Transport and Trade Facilitation: the GMS Cross- Border Transport Agreement
• Core Environment Program (CEP)
• Promoting GMS as a single tourist destination
• Core Agricultural Support Program
• Building capacity for development management; comprehensive HRD Strategy
Competitiveness and Community: The “Softer”Aspects of Regional Cooperation and Development

30
Major Challenges• Transforming the GMS connectivity or transport corridors into
genuine economic corridors: institutional/policy reform; privatesector engagement
• Exploiting emerging opportunities in a resurgent and dynamic Asia, e.g. linking with PRC and India/South Asia; complementarities with ASEAN
• Addressing global warming and climate change: “low carbon”development path; mitigation and adaptation
• Addressing potential negative effects of increased connectivity:communicable disease control; human trafficking and transnational crime; flood and drought management; biodiversity protection
• Responding to changing demographics and increased urbanization: HRD, labor and migration; urban development
• Increasing mobilization of private investments for the GMS program, including public-private partnerships
• Preparing a new GMS Long Term Strategic Framework to address these and other issues.

Myanmar in Transition: Opportunities and Challenges

Highlights• Strong potential for growth
• If reforms stay on track:
7%-8% annual growth
Myanmar a middle income nation
Per capita income triples by 2030
• Multiple constraints and risks
• Need to prioritize actions

Development Strategies
33
•Strong growth is imperative for poverty alleviation and improved standards of living
•Regional connectivity will measurably enhance growth, benefit people
•Inclusiveness, environmental sustainability crucial to maintaining growth momentum

Key Development Agendas
34
•Maintain macroeconomic stability
•Mobilize resources for investment
•Improve infrastructure and human capital
•Diversify into industry and services, while
improving agriculture
•Reduce the state’s role in production
•Strengthen government institutions

Myanmar poised to accelerate growth
35
Near-term outlook positive
2012 2013
G D P G row th 6 6 .3
In fla tion 6 .2 6 .3
C u rren t Ac c oun t (% o f G D P ) -2 .7 -4 .4
G ros s R es e rves ( in m on ths o f im ports ) 9 .7 9 .9
S e le c te d e co n o mic in d icato rs (% )
S o u rce : AD B e s tim a te s , IMF Artic le IV.

Myanmar Today
36
Sources: ADB Key Indicators 2011; Government of Myanmar; IHLSources: ADB Key Indicators 2011; Government of Myanmar; IHLCS 2010;CS 2010;
WB World Development IndicatorsWB World Development Indicators
Cambodia Myanmar Viet Nam
GDP per capita ($, current) 900 (2011) 857 (2011)1,411 (2011)
Population below poverty line (%) 30 (2007) 26 (2010) 14 (2008)
Share of agriculture in GDP (%) 36 (2010) 36 (2010) 20 (2010)
Access to electricity (% of population) 24 (2009) 26 (2011) 98 (2009)
Access to safe water (% of population)
64 (2010) 69 (2010) 83 (2010)

37
Per Capita GDP of Selected ASEAN Countries($, PPP)
Growing – but from a low base
• Per capita GDP among lowest in Asia
• Growing by how much?
• Official figures: 12.2%/yr (2000-2010)
• ADB/IMF estimates much lower: 4.7%/yr
ASEAN = Association of Southeast Asian Nations, GDP = gross domestic product, Lao PDR = Lao People’s Democratic Republic, PPP = purchasing power parity.Source: Economy Watch 2012.

‘Second Mover’ Advantages
38
•The Asian Century: Asia is the new economic center of the world. Myanmar lies at the center of Asia.
•Growing ASEAN / Intra-regional Trade & Investment: Reduced tariffs on intra-regional trade by 2015
•Risks:
- Inequality can destabilize, undermine growth
- Rapid growth can have high environmental costs

39
Age and Sex Distribution in Myanmar, 2011
Strength: Youthful population to generate a demographic dividend
40
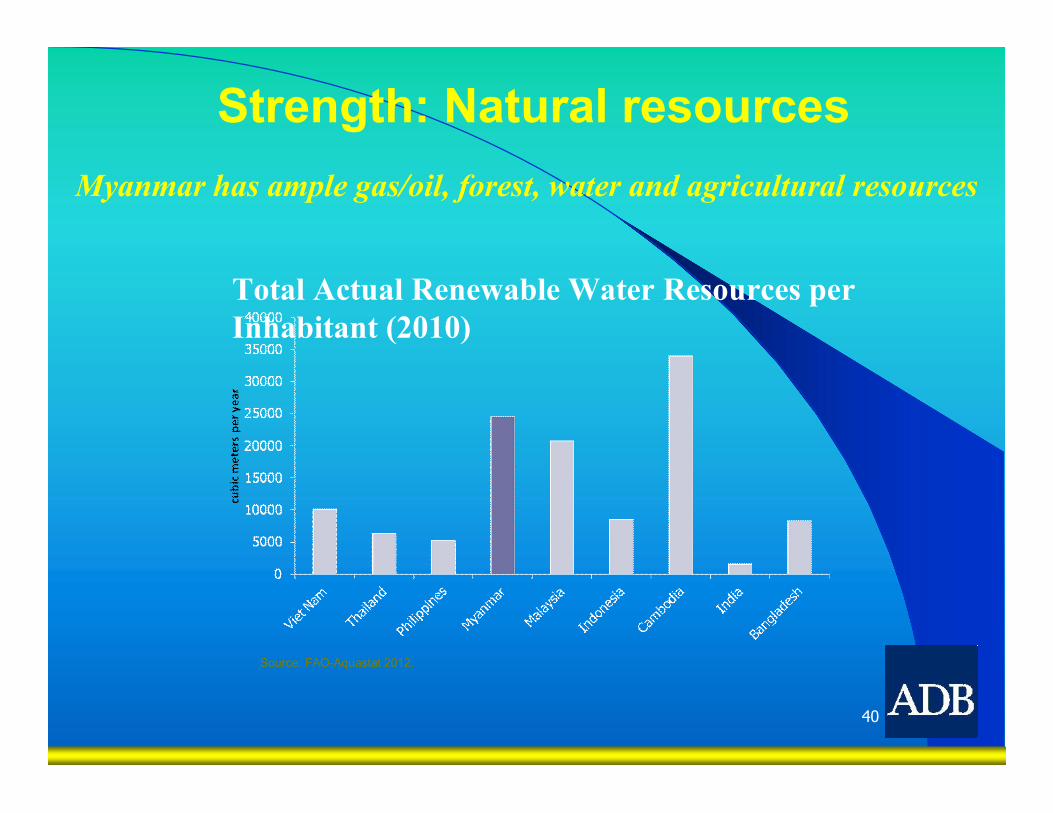
Total Actual Renewable Water Resources per Inhabitant (2010)
Strength: Natural resources
Source: FAO-Aquastat 2012.
Myanmar has ample gas/oil, forest, water and agricultural resources
41
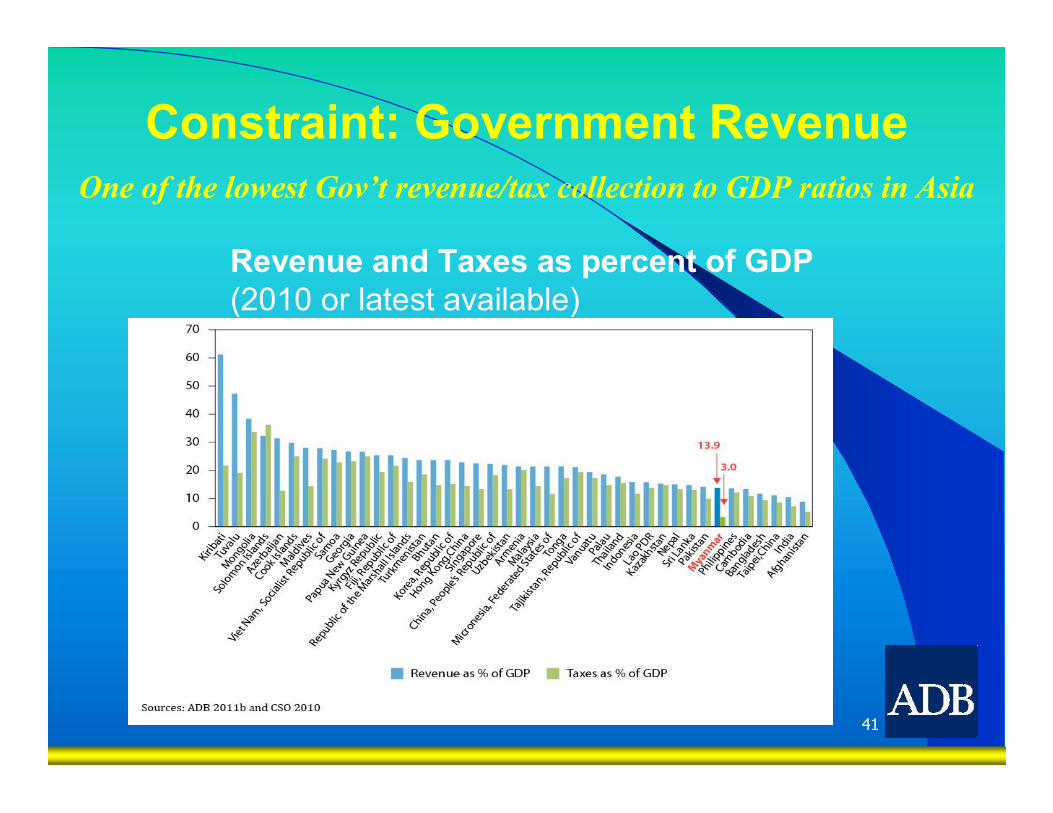
Constraint: Government Revenue
Revenue and Taxes as percent of GDP (2010 or latest available)
One of the lowest Gov’t revenue/tax collection to GDP ratios in Asia
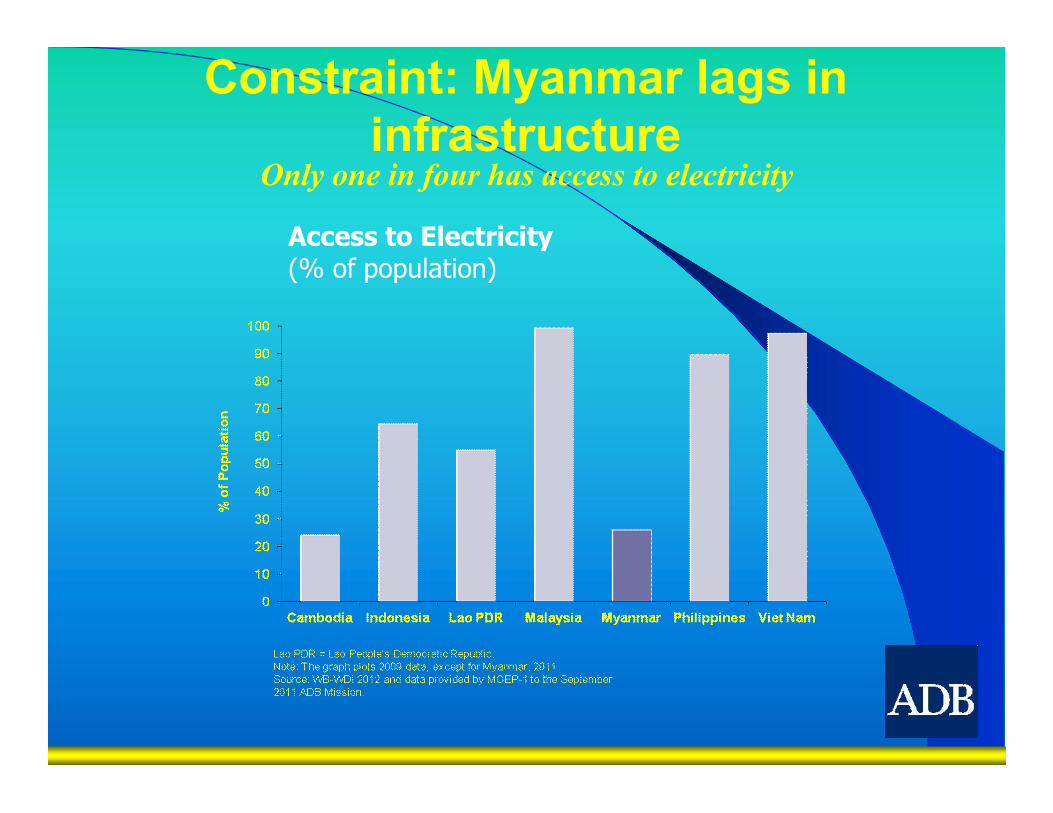
Access to Electricity (% of population)
Constraint: Myanmar lags in infrastructure
Only one in four has access to electricity

43
Government Expenditure on Health, 1995–2009 (% of GDP)
Constraint: Low education and health attainment
Lao PDR = Lao People’s Democratic Republic.Source: For Cambodia, staff estimates using ADB 2011b data; for Lao PDR, Myanmar, and Viet Nam, staff estimates using UNESCAP database 2012.
Building human capital is key to Myanmar’s future

Opportunity: Strategic time and location
44
2030: People’s Republic of China, India, SE Asia--$32 trillion total consumption; 43% of global total
2015: ASEAN economic community
Myanmar should expedite economic reform process and enhance business and investment climate to maximize benefits of integration.

Opportunity: Agriculture
Crop Year
1990 1995 2000 2005 2010 1. Rice Paddy Area (‘000 ha) 4,760 6,032 6,302 7,384 8,051 Production (‘000 metric tons 13,971 17,956 21,323 27,683 33,204 2. Beans Area (‘000 ha) 433 1,104 1,762 2,184 2,745 Production (‘000 metric tons) 263 752 1,285 2,175 3,029 3. Sesame Seed Area (‘000 ha) 924 1,131 964 1,337 1,570 Production (‘000 metric tons) 206 304 295 503 722 4. Vegetables Area (‘000 ha) 136 167 207 238 277 Production (‘000 metric ton) 163 226 280 336 371
Increase in Food Crop Area and Production, 1990–2010
ha = hectare.Source: Food and Agriculture Organization statistics (FAOSTAT).
• Sector currently generates more than half of all employment• Only 20% crop land currently irrigated• Big potential for greater crop yields, household income

Opportunity: Foreign investment
46
FDI Inflows by Sector (US$ million)
SectorFiscal Year
2005/06 2006/07 2007/08 2008/09 2009/10 2010/11 2005-2010
Oil and Gas 229.9 417.2 478.4 743.2 750.0 287.9 2,906.6
Mining 2.2 2.6 3.2 46.6 200.0 160.3 415.0
Power 0 0 220.0 170.0 0 0 390.0
Manufacturing 1.1 1.6 13.2 14.2 11.6 1.5 43.2
Hotel and Tourism 2.7 6.3 0.1 1.0 0 0.3 10.4
Livestock and Fisheries 0 0 0 0.6 1.6 0.2 2.4
Total 235.9 427.7 714.9 975.6 963.3 450.2 3,767.6FDI = foreign direct investment.Note: Figures denote actual FDI inflows. Figures may not total exactly due to rounding. Data for FY2010/11 cover April-September 2010 only. No FDI was received in agriculture, construction, industrial estate, real estate, transport, and other services during the period.Source: Directorate of Investment and Company Administration, Ministry of National Planning and Economic Development, Myanmar (data provided to ADB).
Growing FDI presents opportunity for more diverse economic sectors, job growth

Myanmar’s Strengths & Weaknesses Strengths• Abundant natural resources
(agriculture, gas, oil, minerals, precious stones)
• Less population pressure on land (Land population ratio is relatively high.)
• Half of arable land area fallow
• Abundant trainable labor force with basic education
• Well connected to major Asian market: ASEAN, China and India
• Strategic location: Geopolitical
• Importance for regional connectivity as the tri-junction of East Asia, Southeast Asia and South Asia
• Benefit of late comer in development: can leapfrog
• Significant foreign exchange reserves
••
Weakness• Macroeconomic instability associated
with a number of policy inconsistencies and weak institutions
• Low saving and investment rates• Lack of implementing capacity and
governance issue• Underdeveloped banking and financial
system• High dependence on natural resource
extraction and agriculture sector• Poor infrastructure, institutional and
business environment• High poverty, low HDI, low income and
high outmigration rate• Lack of comprehensive approach
and appropriate funding to human capital formation
• Absence of accurate and reliable economic data to provide exact diagnostics of the economy

Myanmar’s Opportunities & Threats
Opportunities• Regional hub for multimodal
transportation and potential supply route by passing the Malacca Strait
• Sole land-bridge between two giant economics; China and India
• High potential to be a “food basket” and “energy source” for Asia
• Huge industrial potential for FDI from ASEAN and global supply chains
Threats
• Resource Curse: lack of balancing economic growth and environmental sustainability
• Danger of Dutch disease• Social and Spatial inequality• Increase in corruption• Political instability and ethnic
insurgency• International pressures and
economic sanctions• Strong influence of China

The Challenges Ahead• Strengthen institutions and governance
systems
• Improve macroeconomic management and introduce structural reforms
• Diversify the economy and develop the agricultural sector
• Foster human capital
• Diversify economic sectors and build an industrial base
• Develop economic infrastructure

Key MessagesIf Myanmar implements across-the-board reforms:
• 7-8% annual economic expansion
• Tripling of per capita income by 2030
• Middle class Myanmar
Strong growth will alleviate poverty
• Inclusiveness and environmental sustainability key to sustaining growth momentum
• Regional integration will bring immense benefits

Thank you
Craig SteffensenCountry Director
Thailand Resident MissionAsian Development Bank