greenhouse gas emissions in minnesota: 1970-2006 peter ciborowski anne claflin october 2009
TRANSCRIPT

Greenhouse Gas Emissions in Minnesota: 1970-2006
Peter CiborowskiAnne Claflin
October 2009

Legislative Request The Next Generation Energy Act established the
following GHG reduction goals: 15 % reduction from 2005 levels by 2015; 30 % reduction by 2025; and 80 % reduction by 2050.
The MPCA is obligated to report on statewide progress toward these GHG reduction goals. Annual legislative proposal Biennial Reduction Progress Report
The request included some specifications, such as estimating electricity imported to service Minnesota demand and separate tracking of emissions or sequestration associated with biomass
(Minn. Stat. § 216H)
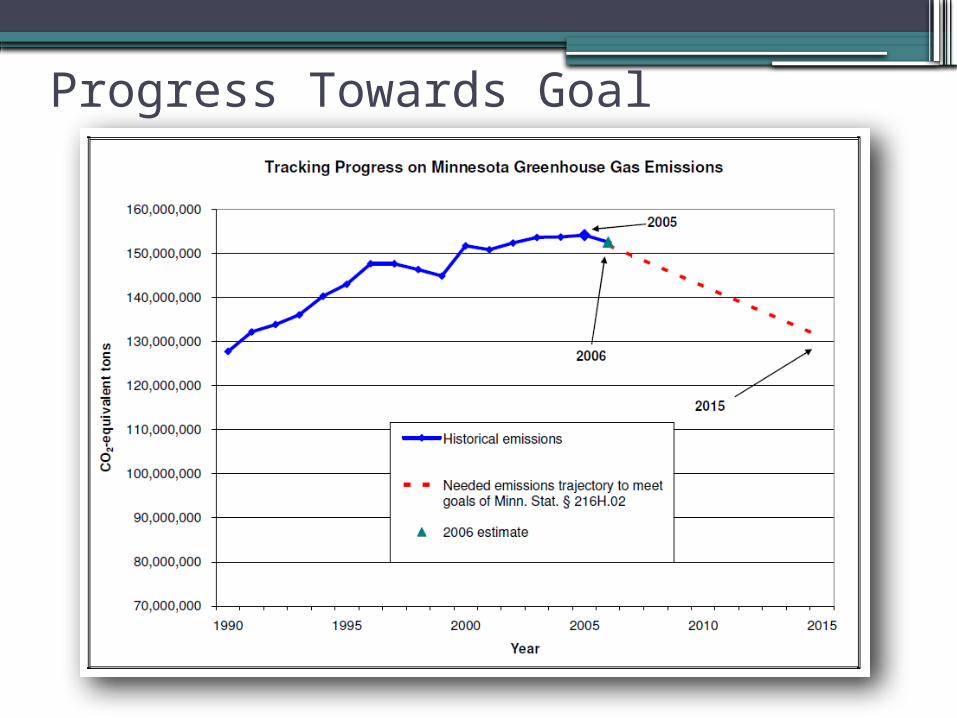
Progress Towards Goal
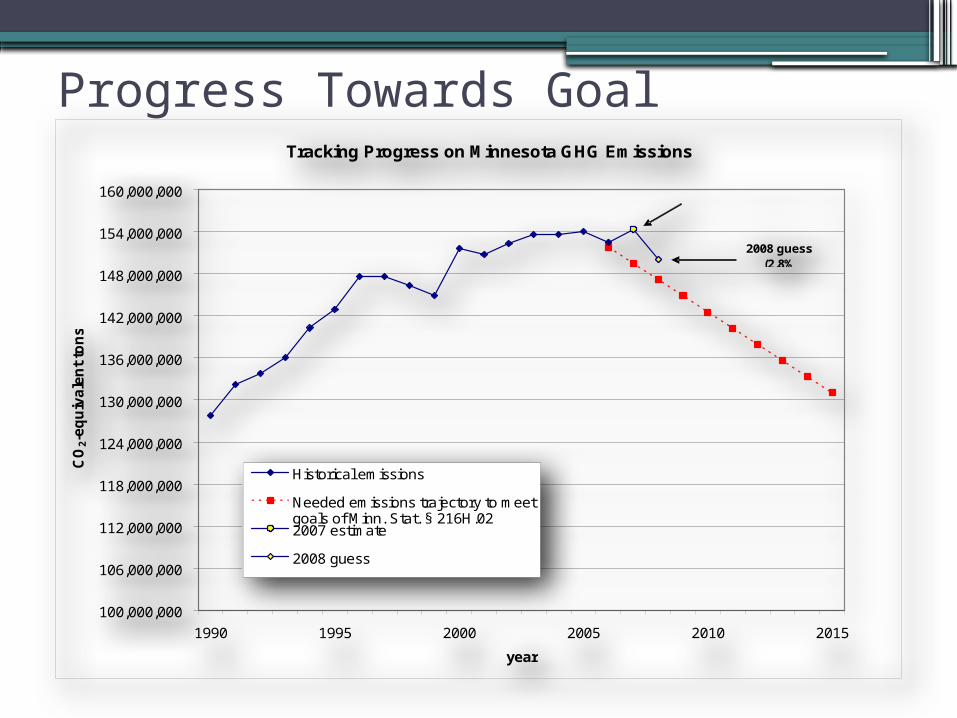
Progress Towards GoalTracking Progress on Minnesota GHG Emissions
100,000,000
106,000,000
112,000,000
118,000,000
124,000,000
130,000,000
136,000,000
142,000,000
148,000,000
154,000,000
160,000,000
1990 1995 2000 2005 2010 2015
year
CO
2-e
qu
iva
len
t to
ns
Historical emissions
Needed emissions trajectory to meetgoals of Minn. Stat. § 216H.022007 estimate
2008 guess
2007 estimate
2008 guess (2.8%
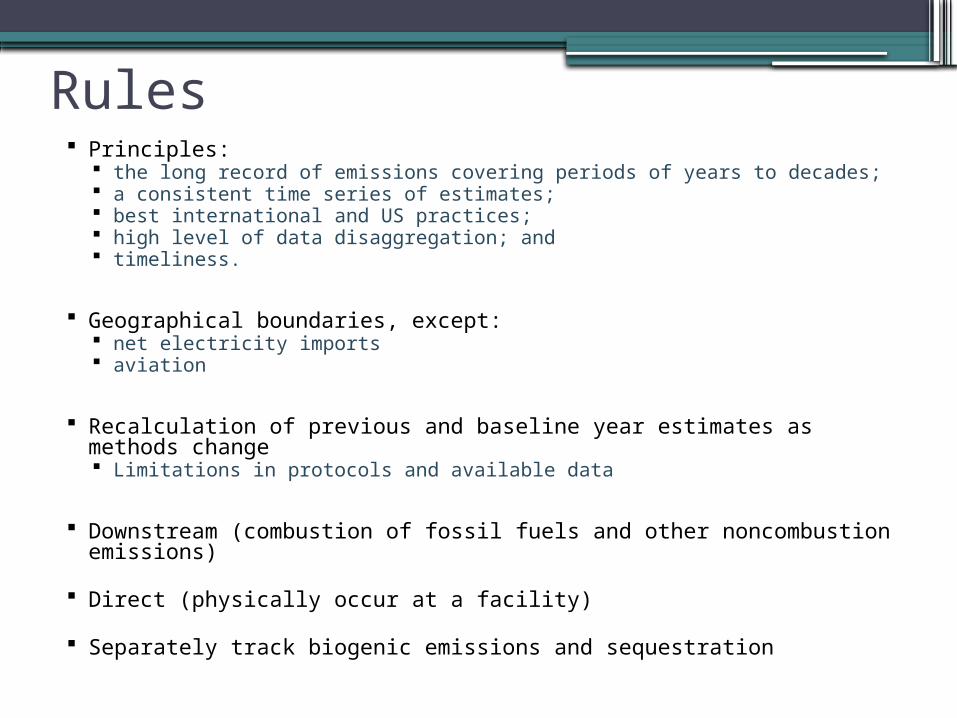
Rules Principles:
the long record of emissions covering periods of years to decades; a consistent time series of estimates; best international and US practices; high level of data disaggregation; and timeliness.
Geographical boundaries, except: net electricity imports aviation
Recalculation of previous and baseline year estimates as methods change Limitations in protocols and available data
Downstream (combustion of fossil fuels and other noncombustion emissions)
Direct (physically occur at a facility)
Separately track biogenic emissions and sequestration

Emissions by Sector
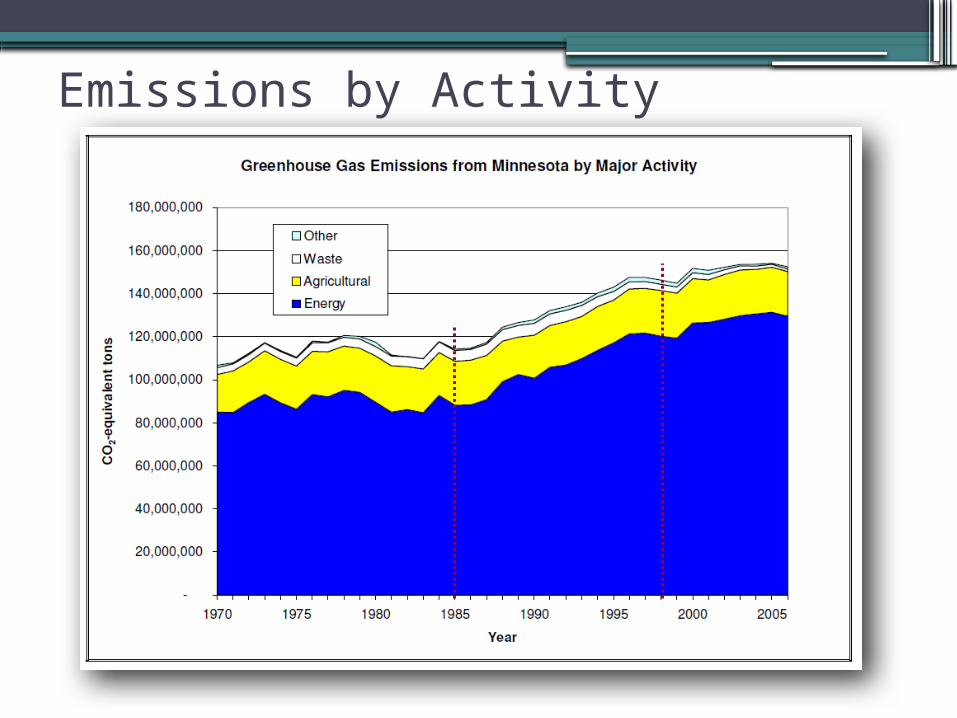
Emissions by Activity
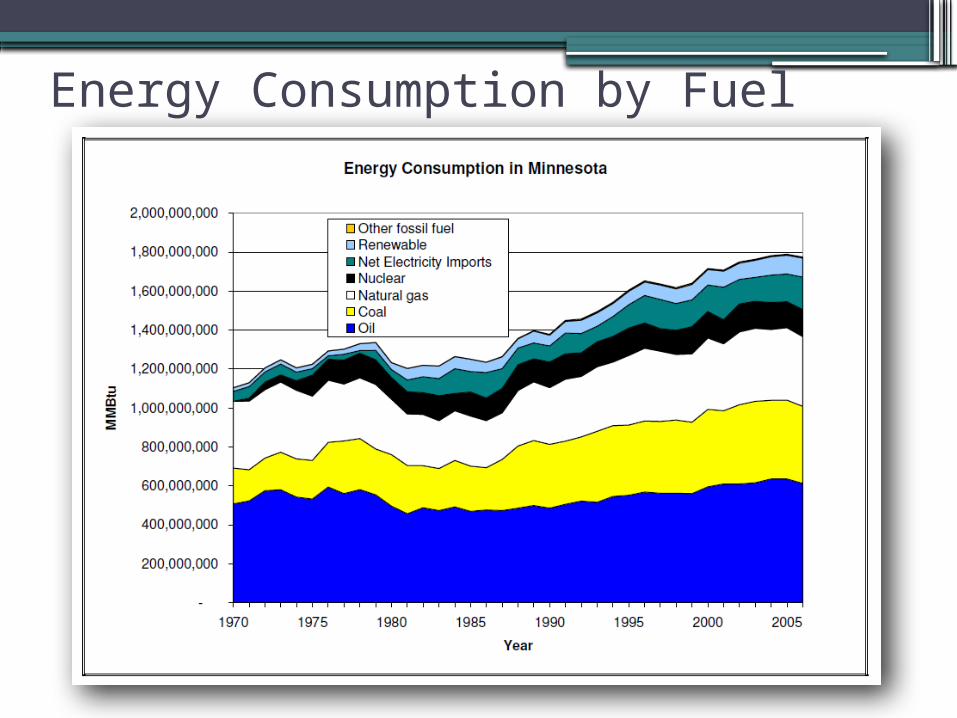
Energy Consumption by Fuel

Emissions from Electric Power Generation
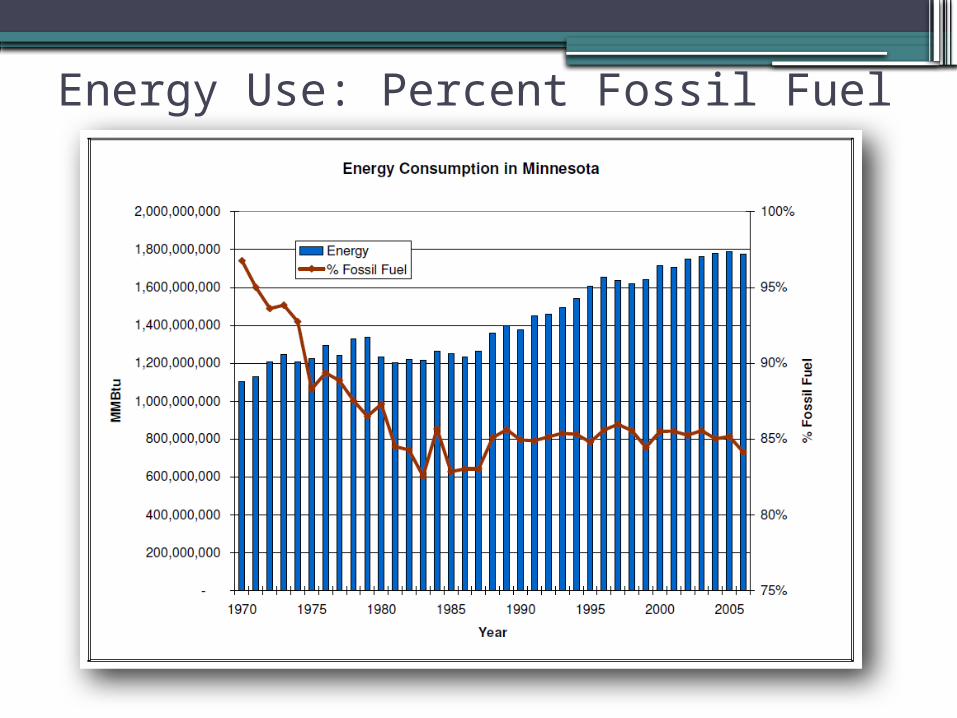
Energy Use: Percent Fossil Fuel
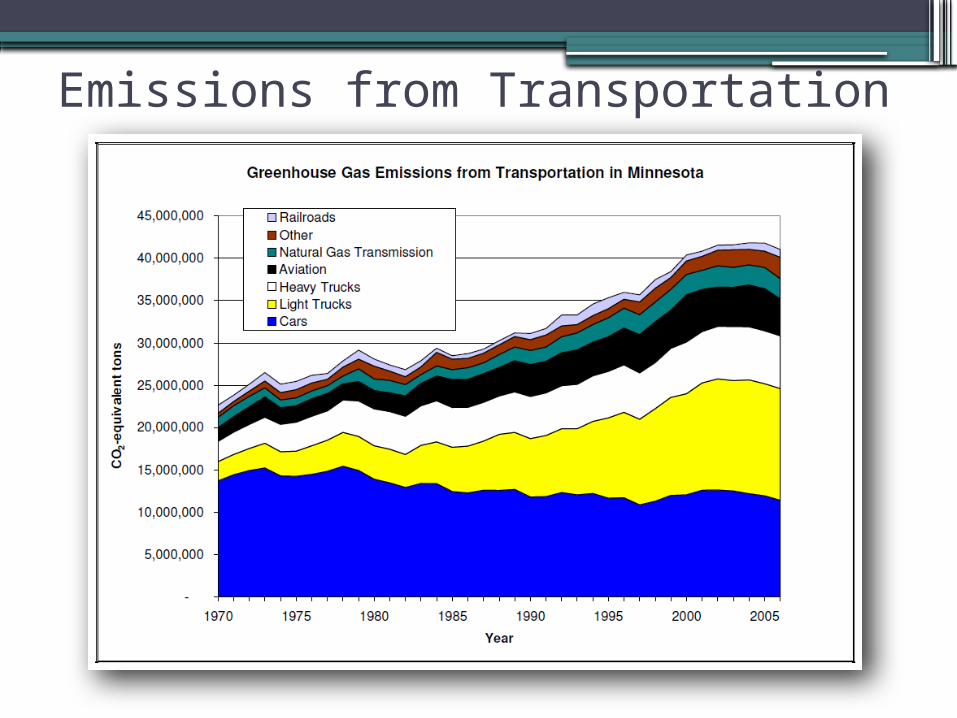
Emissions from Transportation
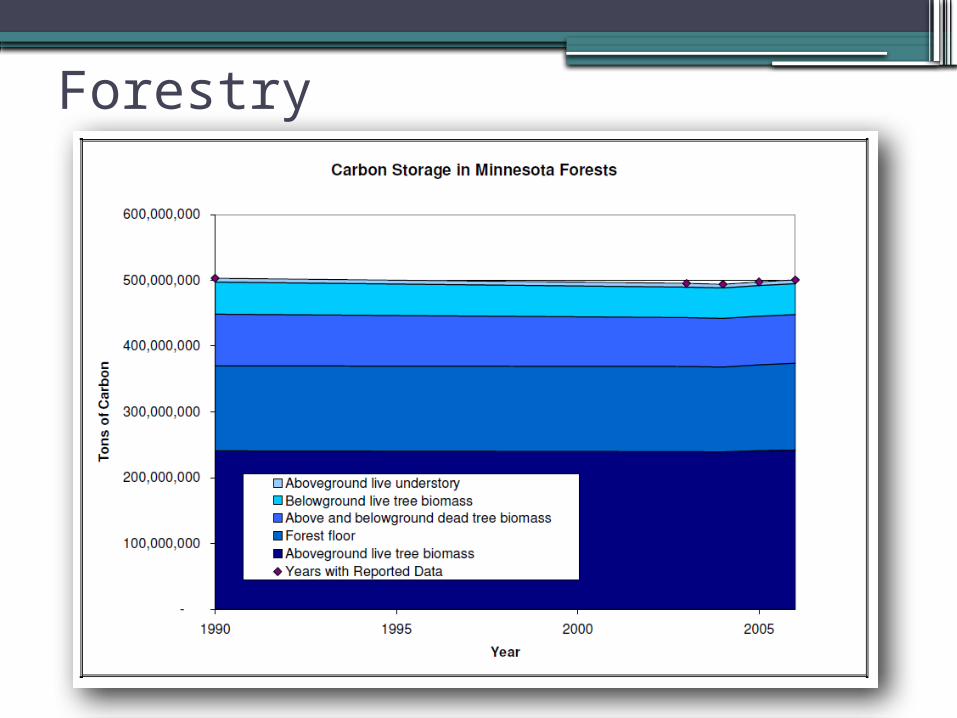
Forestry

Indicators
1970
1971
1972
1973
1974
1975
1976
1977
1978
1979
1980
1981
1982
1983
1984
1985
1986
1987
1988
1989
1990
1991
1992
1993
1994
1995
1996
1997
1998
1999
2000
2001
2002
2003
2004
2005
2006
-
0.50
1.00
1.50
2.00
2.50
3.00
Minnesota Greenhouse Gas Emissions, Emissions Intensity, and Economy
Real Gross State Product
GHG Emissions
GHG Emissions Intensity
Year
Facto
r In
cre
ase
(1970=
1)

Indicators
1970
1971
1972
1973
1974
1975
1976
1977
1978
1979
1980
1981
1982
1983
1984
1985
1986
1987
1988
1989
1990
1991
1992
1993
1994
1995
1996
1997
1998
1999
2000
2001
2002
2003
2004
2005
2006
0.40
0.60
0.80
1.00
1.20
1.40
1.60
Indicators of Greenhouse Gas Emission Intensity
Greenhouse Gaseslb GHGs/ $ real Gross State ProductTons GHGs/Capita
Year
Facto
r In
cre
ase (
19
70
=1
)
Indicators
1970
1971
1972
1973
1974
1975
1976
1977
1978
1979
1980
1981
1982
1983
1984
1985
1986
1987
1988
1989
1990
1991
1992
1993
1994
1995
1996
1997
1998
1999
2000
2001
2002
2003
2004
2005
2006
0.5
0.8
1.0
1.3
1.5
1.8
2.0
2.3
2.5
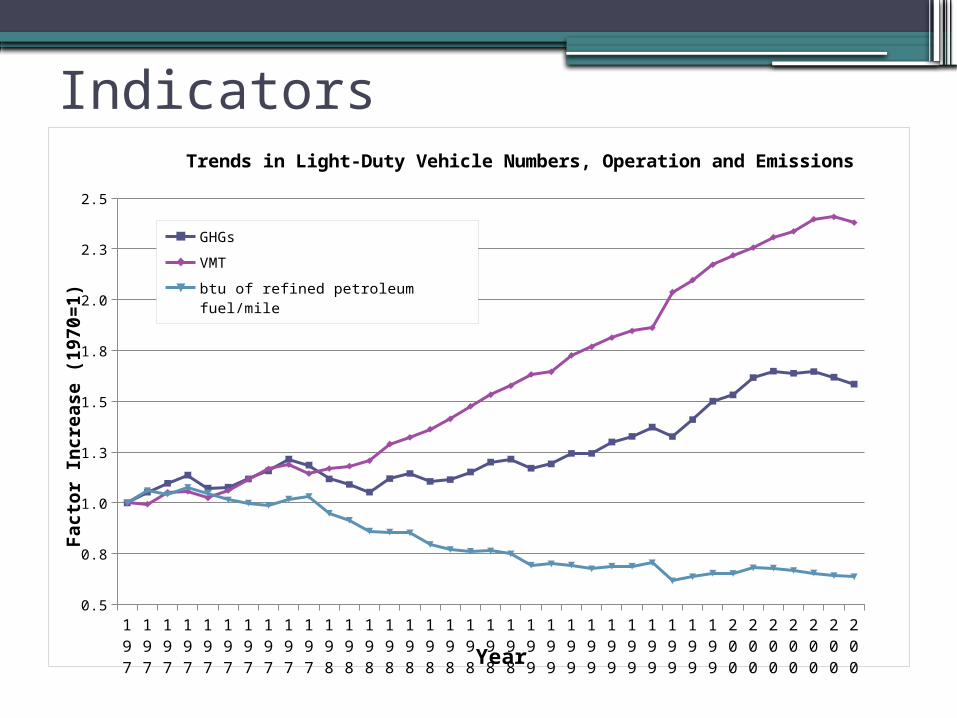
Trends in Light-Duty Vehicle Numbers, Operation and Emissions
GHGs
VMT
btu of refined petroleum fuel/mile
Year
Facto
r In
cre
ase (
1970=
1)

Next Steps…

EPA Actions• Mandatory GHG Reporting Rule
• Proposed Prevention of Significant Deterioration and Title V Greenhouse Gas Tailoring Rule
• Proposed Rulemaking: Light-duty Vehicle Greenhouse Gas Emissions Standards and Corporate Average Fuel Economy Standards
• Proposed Endangerment and Cause or Contribute Findings for Greenhouse Gases under the Clean Air Act
• Waxman/Markey and Kerry/Boxer
Full Report Available:
Climate Change page: http://www.pca.state.mn.us/climatechange/
Legislative Reports page http://www.pca.state.mn.us/hot/legislature/reports/index.html