greenhouse schools - tntp · pdf filegreenhouse schools also helped their students learn more....
TRANSCRIPT

2012
GREENHOUSE SCHOOLSHow Schools Can Build Cultures Where Teachers and Students Thrive
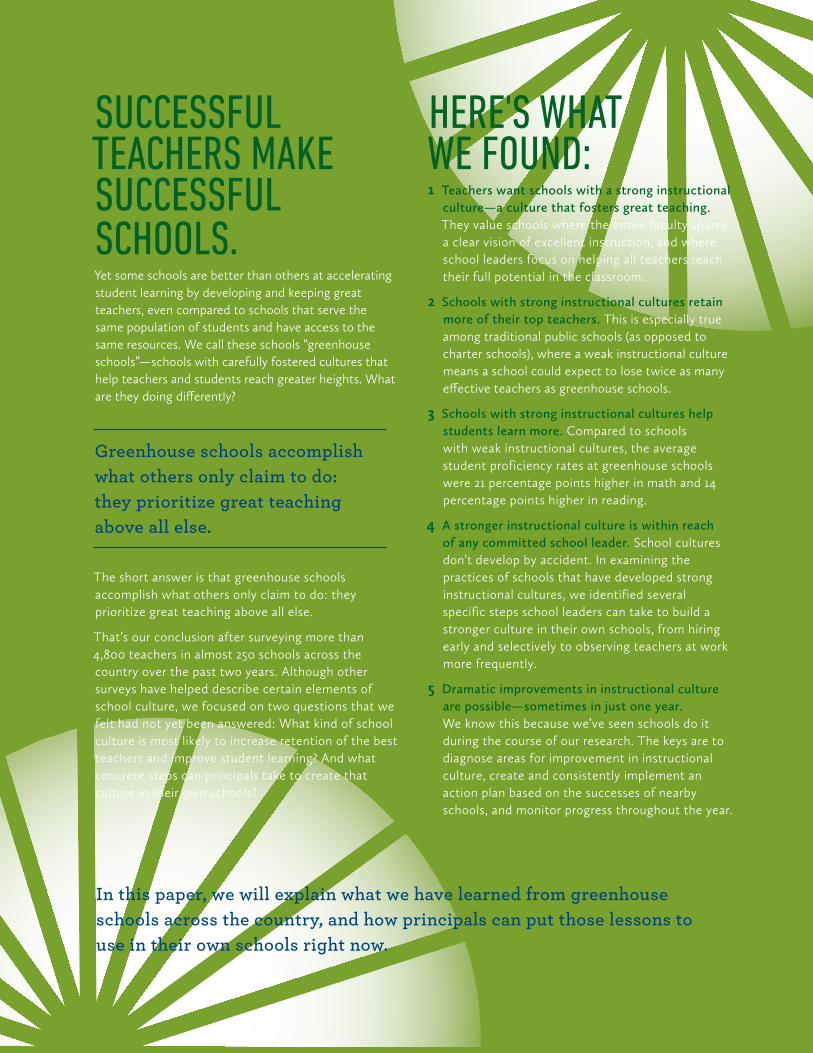
SUCCESSFUL TEACHERS MAKE SUCCESSFUL SCHOOLS. Yet some schools are better than others at accelerating student learning by developing and keeping great teachers, even compared to schools that serve the same population of students and have access to the same resources. We call these schools “greenhouse schools”—schools with carefully fostered cultures that help teachers and students reach greater heights. What are they doing differently?
The short answer is that greenhouse schools accomplish what others only claim to do: they prioritize great teaching above all else.
That’s our conclusion after surveying more than 4,800 teachers in almost 250 schools across the country over the past two years. Although other surveys have helped describe certain elements of school culture, we focused on two questions that we felt had not yet been answered: What kind of school culture is most likely to increase retention of the best teachers and improve student learning? And what concrete steps can principals take to create that culture in their own schools?
HERE'S WHAT WE FOUND:1 Teachers want schools with a strong instructional
culture—a culture that fosters great teaching. They value schools where the entire faculty shares a clear vision of excellent instruction, and where school leaders focus on helping all teachers reach their full potential in the classroom.
2 Schools with strong instructional cultures retain more of their top teachers. This is especially true among traditional public schools (as opposed to charter schools), where a weak instructional culture means a school could expect to lose twice as many effective teachers as greenhouse schools.
3 Schools with strong instructional cultures help students learn more. Compared to schools with weak instructional cultures, the average student proficiency rates at greenhouse schools were 21 percentage points higher in math and 14 percentage points higher in reading.
4 A stronger instructional culture is within reach of any committed school leader. School cultures don’t develop by accident. In examining the practices of schools that have developed strong instructional cultures, we identified several specific steps school leaders can take to build a stronger culture in their own schools, from hiring early and selectively to observing teachers at work more frequently.
5 Dramatic improvements in instructional culture are possible—sometimes in just one year. We know this because we’ve seen schools do it during the course of our research. The keys are to diagnose areas for improvement in instructional culture, create and consistently implement an action plan based on the successes of nearby schools, and monitor progress throughout the year.
Greenhouse schools accomplish what others only claim to do: they prioritize great teaching above all else.
In this paper, we will explain what we have learned from greenhouse schools across the country, and how principals can put those lessons to use in their own schools right now.
Numerous researchers have explored the overall importance of school culture. In 1997, Eric Hanushek analyzed hundreds of studies and found no significant link between a school’s resources and student achievement after controlling for demographic factors, suggesting that school environment is more important.1 More recently, several studies have linked specific elements of school culture to student achievement, most notably Roland Fryer’s 2011 analysis of “no excuses” charter schools in New York City,2 which attributed 50 percent of the variation in school effectiveness to cultural factors similar to those we identify here.
As an organization that works closely with schools and districts to help them find, develop and keep great teachers, our interest in the issue of school culture is even more pragmatic. We wanted to understand how principals can use culture to meet their most important responsibilities: retaining successful teachers and helping students learn.
We studied nearly 250 schools in six cities across the country over the past two years. Some are public charter schools and some are traditional public schools, but they all serve an almost entirely high-need student population.
To get a picture of the culture at these schools, we started with the people who know school culture best—teachers. More than 4,800 teachers responded to a 15-minute survey spanning several dimensions of school culture, such as the rigor of the hiring pro-cess for new teachers, the type of feedback teachers receive from supervisors, and how teachers collaborate with their colleagues.
To gather information about retention, we included survey questions that asked teachers how long they planned to remain at their current school and where they planned to go when they leave.3 We combined these answers with performance ratings for participating teachers (provided by principals on a confidential basis) and student achievement results for participating schools.
We found that positive responses to three questions on our survey had the strongest connection with greater retention of successful teachers and higher student achievement in reading and math. All three ask teachers how much they agree with the following statements:
“Teachers at my school share a common vision of what effective teaching looks like.”
“The expectations for effective teaching are clearly defined at my school.”
“My school is committed to improving my instructional practice.”
We believe the lesson is clear: Teachers want work envi-ronments that are a lot like the classroom environments they strive to create for their students. They value work-ing with their colleagues toward clearly defined goals, with the help of leaders committed to each teacher’s success. In other words, they want a strong instructional culture: a culture that prioritizes, protects, and develops great teaching above all else.
We created an instructional culture score—the “Insight index”—based on teachers’ responses to the three ques-tions above. This allowed us to describe each school’s instructional culture in a single number from 1 to 10; the more teachers at a school who agreed with the three questions, the higher the school’s Insight index. We then grouped schools into quartiles based on their scores and the scores of other schools in their district or charter sector, allowing us to compare the practices of high- and low-scoring schools.4 Greenhouse schools are those at the top.
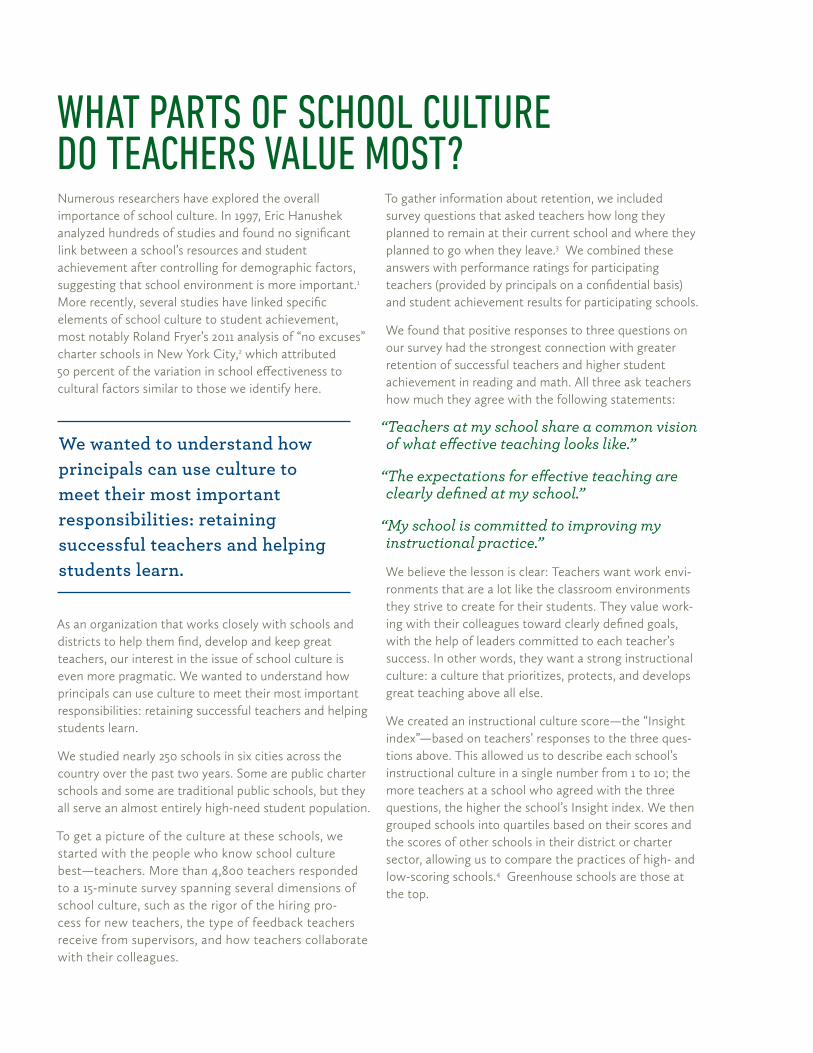
WHAT PARTS OF SCHOOL CULTURE DO TEACHERS VALUE MOST?
We wanted to understand how principals can use culture to meet their most important responsibilities: retaining successful teachers and helping students learn.
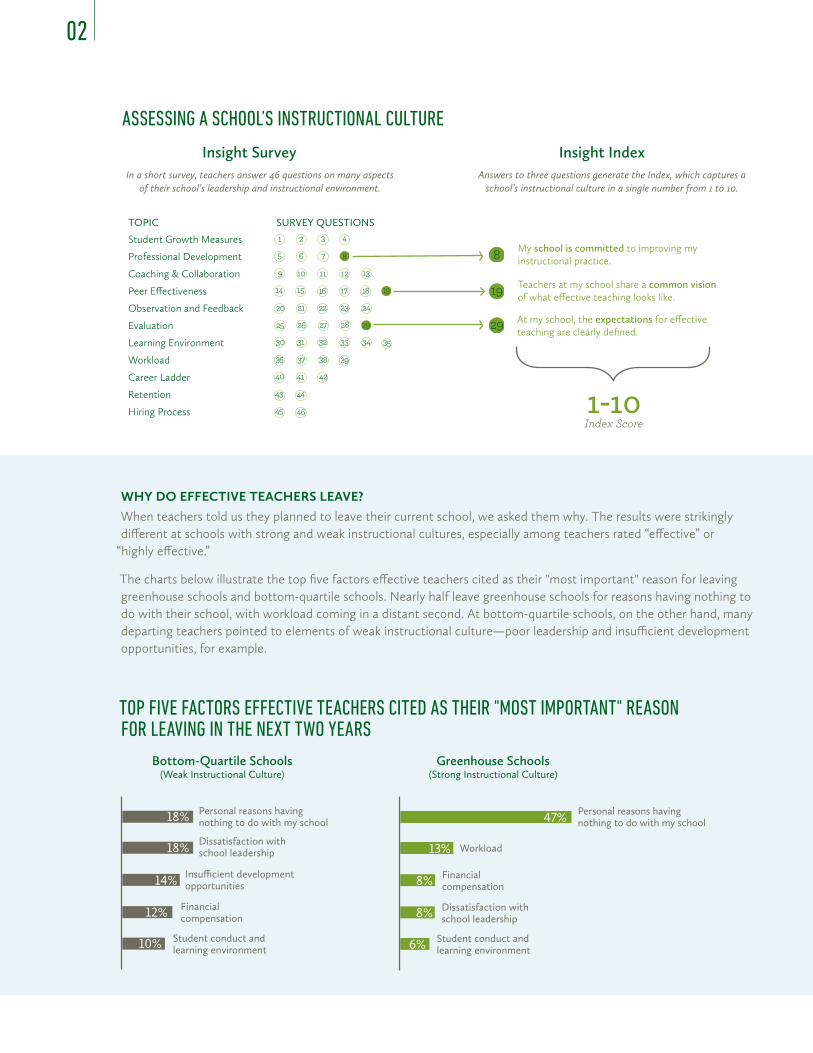
ASSESSING A SCHOOL’S INSTRUCTIONAL CULTURE
TOPIC SURVEY QUESTIONS
Student Growth Measures
Professional Development
Coaching & Collaboration
Peer Effectiveness
Observation and Feedback
Evaluation
Learning Environment
Workload
Career Ladder
Retention
Hiring Process
1 2 3 4
5 6 7 8
109 11 12 13
45 46
43 44
40 41 42
36 37 38 39
2120 22 23 24
My school is committed to improving myinstructional practice.
Teachers at my school share a common visionof what effective teaching looks like.
At my school, the expectations for effectiveteaching are clearly defined.
1514 16 17 18 19
25 26 27 28 29
30 3531 32 33 34
8
19
29
Insight SurveyIn a short survey, teachers answer 46 questions on many aspects
of their school’s leadership and instructional environment.
Insight Index
1-10Index Score
Answers to three questions generate the Index, which captures a school’s instructional culture in a single number from 1 to 10.
WHY DO EFFECTIVE TEACHERS LEAVE? When teachers told us they planned to leave their current school, we asked them why. The results were strikingly different at schools with strong and weak instructional cultures, especially among teachers rated “effective” or
“highly effective.”
The charts below illustrate the top five factors effective teachers cited as their "most important" reason for leaving greenhouse schools and bottom-quartile schools. Nearly half leave greenhouse schools for reasons having nothing to do with their school, with workload coming in a distant second. At bottom-quartile schools, on the other hand, many departing teachers pointed to elements of weak instructional culture—poor leadership and insufficient development opportunities, for example.
TOP FIVE FACTORS EFFECTIVE TEACHERS CITED AS THEIR "MOST IMPORTANT" REASON FOR LEAVING IN THE NEXT TWO YEARS
Greenhouse Schools(Strong Instructional Culture)
47%
13%
8%
8%
6%
Personal reasons havingnothing to do with my school
Financialcompensation
Workload
Student conduct andlearning environment
Dissatisfaction withschool leadership
Bottom-Quartile Schools(Weak Instructional Culture)
18%
18%
14%
12%
10%
Personal reasons havingnothing to do with my school
Financialcompensation
Student conduct andlearning environment
Dissatisfaction withschool leadership
Insu�cient developmentopportunities
02

THE BENEFITS OF STRONG INSTRUCTIONAL CULTUREJust how much does a strong instructional culture matter? The contrast in outcomes between greenhouse and bottom-quartile schools was staggering.
Greenhouse schools kept more of their top teachers. This was especially true among traditional public schools, where schools in the bottom quartile could expect to lose twice as many effective teachers as greenhouse schools within the next two years (38 percent compared to 18 percent).5 More than one-third of the effective teachers planning to leave all bottom-quartile schools said they planned to continue teaching in their current city or region, suggesting that they plan to leave because they are dissatisfied with the school, not because they wish to relocate or dislike teaching in general. In comparison, at greenhouse schools, only 13 percent of the effective teachers who planned to leave said they would continue teaching in the same city.
Overall, each one-point increase in a school’s Insight index corresponded to a 19 percent decrease in the likelihood that any given teacher will leave at the end of the current school year.
Greenhouse schools also helped their students learn more. On average, student proficiency rates were 21 percentage points higher in math and 14 percentage points higher in reading at greenhouse schools com-pared to bottom-quartile schools in the same district or charter sector. Each one-point increase in a school’s Insight index corresponded to student proficiency rates that were 6 percentage points higher in math and 3.6 percentage points higher in reading.
These are significantly different results among schools that serve very similar student populations—demograph-ics do not even come close to explaining the differ-ences.6 Results obviously vary among individual schools, but the overall trend across two years has been remark-ably consistent. A strong instructional culture can help schools hold on to more of their top teachers and fulfill their primary mission: helping students learn.
INSTRUCTIONAL CULTURE MATTERS FOR TEACHERS AND STUDENTS
Bottom-quartile district schools can expect tolose twice as many of their effective teachers in the next two years...
...and in greenhouse schools,student proficiency rates are 21 percentage points higher
in math and 14 percentage points higher in reading.
Greenhouse Schools(Strong Instructional Culture)
Bottom-Quartile Schools(Weak Instructional Culture)
03
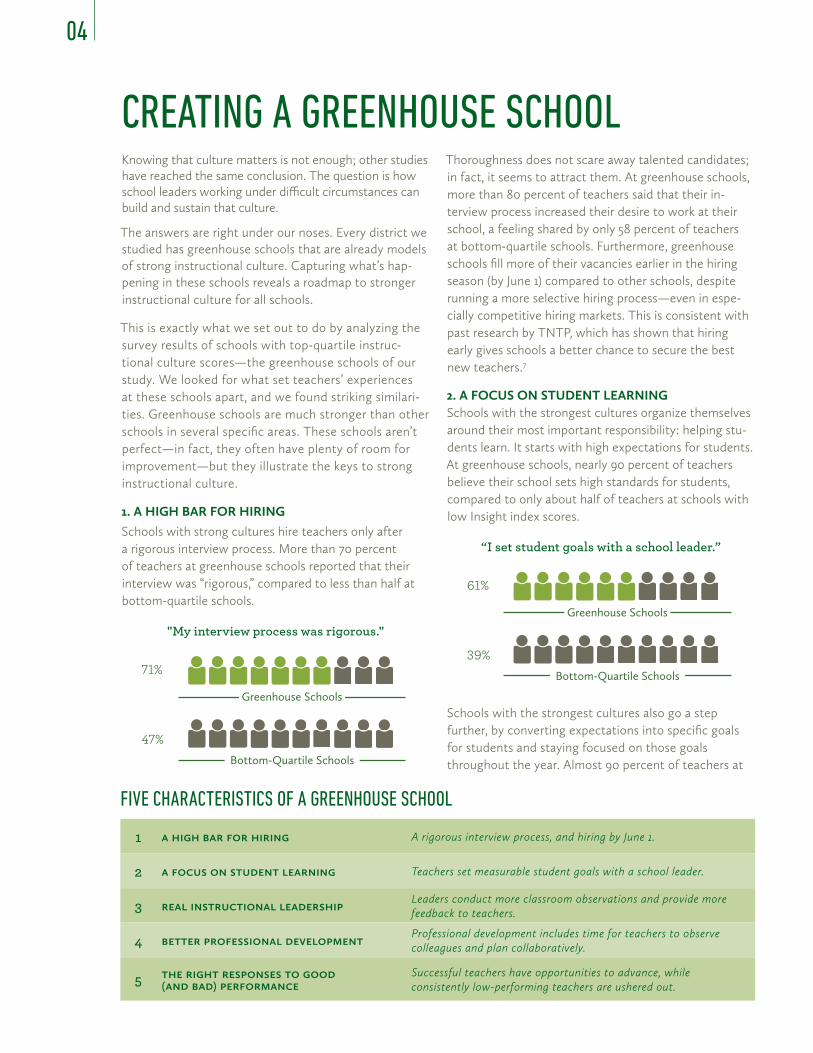
Knowing that culture matters is not enough; other studies have reached the same conclusion. The question is how school leaders working under difficult circumstances can build and sustain that culture.
The answers are right under our noses. Every district we studied has greenhouse schools that are already models of strong instructional culture. Capturing what’s hap-pening in these schools reveals a roadmap to stronger instructional culture for all schools.
This is exactly what we set out to do by analyzing the survey results of schools with top-quartile instruc-tional culture scores—the greenhouse schools of our study. We looked for what set teachers’ experiences at these schools apart, and we found striking similari-ties. Greenhouse schools are much stronger than other schools in several specific areas. These schools aren’t perfect—in fact, they often have plenty of room for improvement—but they illustrate the keys to strong instructional culture.
1. A HIGH BAR FOR HIRING Schools with strong cultures hire teachers only after a rigorous interview process. More than 70 percent of teachers at greenhouse schools reported that their interview was “rigorous,” compared to less than half at bottom-quartile schools.
"My interview process was rigorous."
Greenhouse Schools
Bottom-Quartile Schools
71%
47%
Thoroughness does not scare away talented candidates; in fact, it seems to attract them. At greenhouse schools, more than 80 percent of teachers said that their in-terview process increased their desire to work at their school, a feeling shared by only 58 percent of teachers at bottom-quartile schools. Furthermore, greenhouse schools fill more of their vacancies earlier in the hiring season (by June 1) compared to other schools, despite running a more selective hiring process—even in espe-cially competitive hiring markets. This is consistent with past research by TNTP, which has shown that hiring early gives schools a better chance to secure the best new teachers.7
2. A FOCUS ON STUDENT LEARNING Schools with the strongest cultures organize themselves around their most important responsibility: helping stu-dents learn. It starts with high expectations for students. At greenhouse schools, nearly 90 percent of teachers believe their school sets high standards for students, compared to only about half of teachers at schools with low Insight index scores.
“I set student goals with a school leader.”
Greenhouse Schools
Bottom-Quartile Schools
61%
39%
Schools with the strongest cultures also go a step further, by converting expectations into specific goals for students and staying focused on those goals throughout the year. Almost 90 percent of teachers at
FIVE CHARACTERISTICS OF A GREENHOUSE SCHOOL
1 a high bar for hiring A rigorous interview process, and hiring by June 1.
2 a focus on student learning Teachers set measurable student goals with a school leader.
3 real instructional leadership Leaders conduct more classroom observations and provide more feedback to teachers.
4 better professional development Professional development includes time for teachers to observe colleagues and plan collaboratively.
5 the right responses to good (and bad) performance
Successful teachers have opportunities to advance, while consistently low-performing teachers are ushered out.
CREATING A GREENHOUSE SCHOOL
04
greenhouse schools reported tracking their students’ progress toward measurable academic goals throughout the year, compared to only 56 percent at the bottom-quartile schools.
Leaders of greenhouse schools set the tone by working with teachers to set these goals. At greenhouse schools, 61 percent of teachers said they set goals with a supervi-sor, compared to 39 percent at bottom-quartile schools. And three-quarters of teachers at greenhouse schools felt that the person who evaluates their performance knows how much progress their students are making, compared to just 38 percent at bottom-quartile schools.
3. REAL INSTRUCTIONAL LEADERSHIP School leaders who create strong instructional cultures are more than just building managers. They embrace their roles as instructional leaders and help teachers reach their full potential in the classroom.
Instructional leadership starts with giving teachers regular feedback on their performance. At greenhouse schools, leaders typically observed each teacher eight times a year—three more times than leaders at other schools. In addition, 77 percent of teachers at green-house schools said they “always” or “frequently” receive verbal feedback after an observation, and 81 percent said they usually received written feedback. At bottom-quartile schools, only 53 percent of teachers usually received verbal feedback after an observation, and only 56 percent usually received written feedback.
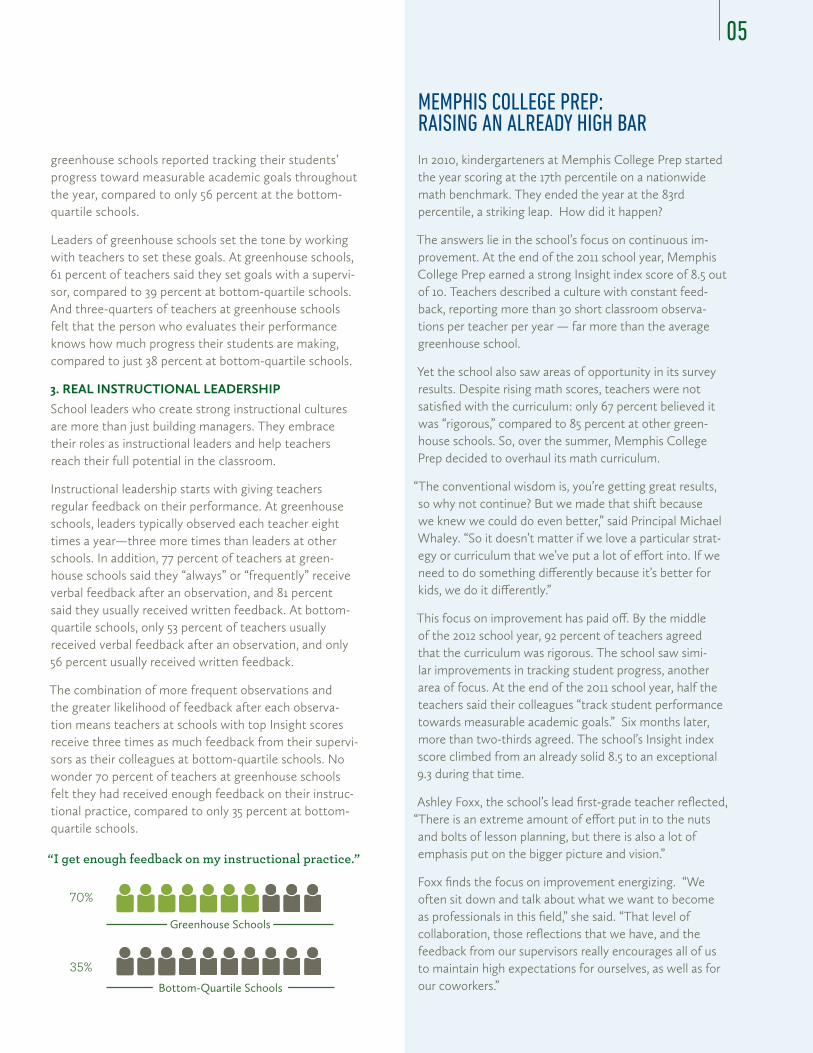
The combination of more frequent observations and the greater likelihood of feedback after each observa-tion means teachers at schools with top Insight scores receive three times as much feedback from their supervi-sors as their colleagues at bottom-quartile schools. No wonder 70 percent of teachers at greenhouse schools felt they had received enough feedback on their instruc-tional practice, compared to only 35 percent at bottom-quartile schools.
“I get enough feedback on my instructional practice.”
Greenhouse Schools
Bottom-Quartile Schools
70%
35%
MEMPHIS COLLEGE PREP: RAISING AN ALREADY HIGH BARIn 2010, kindergarteners at Memphis College Prep started the year scoring at the 17th percentile on a nationwide math benchmark. They ended the year at the 83rd percentile, a striking leap. How did it happen?
The answers lie in the school’s focus on continuous im-provement. At the end of the 2011 school year, Memphis College Prep earned a strong Insight index score of 8.5 out of 10. Teachers described a culture with constant feed-back, reporting more than 30 short classroom observa-tions per teacher per year — far more than the average greenhouse school.
Yet the school also saw areas of opportunity in its survey results. Despite rising math scores, teachers were not satisfied with the curriculum: only 67 percent believed it was “rigorous,” compared to 85 percent at other green-house schools. So, over the summer, Memphis College Prep decided to overhaul its math curriculum.
“The conventional wisdom is, you’re getting great results, so why not continue? But we made that shift because we knew we could do even better,” said Principal Michael Whaley. “So it doesn’t matter if we love a particular strat-egy or curriculum that we’ve put a lot of effort into. If we need to do something differently because it’s better for kids, we do it differently.”
This focus on improvement has paid off. By the middle of the 2012 school year, 92 percent of teachers agreed that the curriculum was rigorous. The school saw simi-lar improvements in tracking student progress, another area of focus. At the end of the 2011 school year, half the teachers said their colleagues “track student performance towards measurable academic goals.” Six months later, more than two-thirds agreed. The school’s Insight index score climbed from an already solid 8.5 to an exceptional 9.3 during that time.
Ashley Foxx, the school’s lead first-grade teacher reflected, “There is an extreme amount of effort put in to the nuts and bolts of lesson planning, but there is also a lot of emphasis put on the bigger picture and vision.”
Foxx finds the focus on improvement energizing. “We often sit down and talk about what we want to become as professionals in this field,” she said. “That level of collaboration, those reflections that we have, and the feedback from our supervisors really encourages all of us to maintain high expectations for ourselves, as well as for our coworkers.”
05
Instructional leadership also means helping teachers im-prove their skills by offering useful advice and taking an active role in professional development. Nearly 80 per-cent of teachers at greenhouse schools said the feedback they received after observations actually helped them do their job more effectively, compared to only 56 percent at bottom-quartile schools. Furthermore, 73 percent of teachers at greenhouse schools said that a school leader helped them set professional development goals, com-pared to only 55 percent at bottom-quartile schools.
4. BETTER PROFESSIONAL DEVELOPMENT Schools with the strongest cultures give their teachers more valuable professional development opportuni-ties. At greenhouse schools, 81 percent of teachers felt that professional development opportunities are “well planned and well facilitated,” compared to just 28 per-cent of teachers at bottom-quartile schools. When asked about any specific development opportunity, teachers at greenhouse schools were twice as likely to rate it “highly effective” than teachers at bottom-quartile schools.
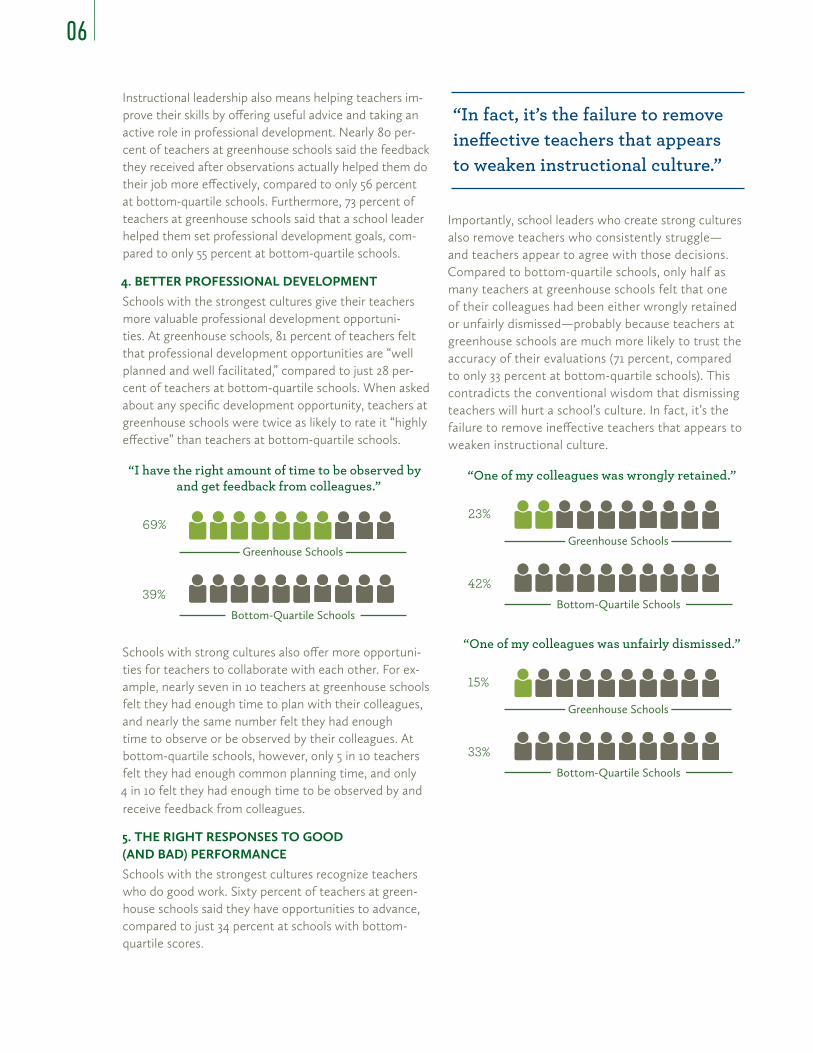
“I have the right amount of time to be observed by and get feedback from colleagues.”
Greenhouse Schools
Bottom-Quartile Schools
69%
39%
Schools with strong cultures also offer more opportuni-ties for teachers to collaborate with each other. For ex-ample, nearly seven in 10 teachers at greenhouse schools felt they had enough time to plan with their colleagues, and nearly the same number felt they had enough time to observe or be observed by their colleagues. At bottom-quartile schools, however, only 5 in 10 teachers felt they had enough common planning time, and only 4 in 10 felt they had enough time to be observed by and receive feedback from colleagues.
5. THE RIGHT RESPONSES TO GOOD (AND BAD) PERFORMANCE Schools with the strongest cultures recognize teachers who do good work. Sixty percent of teachers at green-house schools said they have opportunities to advance, compared to just 34 percent at schools with bottom-quartile scores.
Importantly, school leaders who create strong cultures also remove teachers who consistently struggle—and teachers appear to agree with those decisions. Compared to bottom-quartile schools, only half as many teachers at greenhouse schools felt that one of their colleagues had been either wrongly retained or unfairly dismissed—probably because teachers at greenhouse schools are much more likely to trust the accuracy of their evaluations (71 percent, compared to only 33 percent at bottom-quartile schools). This contradicts the conventional wisdom that dismissing teachers will hurt a school’s culture. In fact, it’s the failure to remove ineffective teachers that appears to weaken instructional culture.
“One of my colleagues was wrongly retained.”
Greenhouse Schools
Bottom-Quartile Schools
23%
42%
“One of my colleagues was unfairly dismissed.”
Greenhouse Schools
Bottom-Quartile Schools
15%
33%
“In fact, it’s the failure to remove ineffective teachers that appears to weaken instructional culture.”
06
HILLCREST HIGH SCHOOL: A STRONG CULTURE, FOCUSED ON GETTING STRONGER
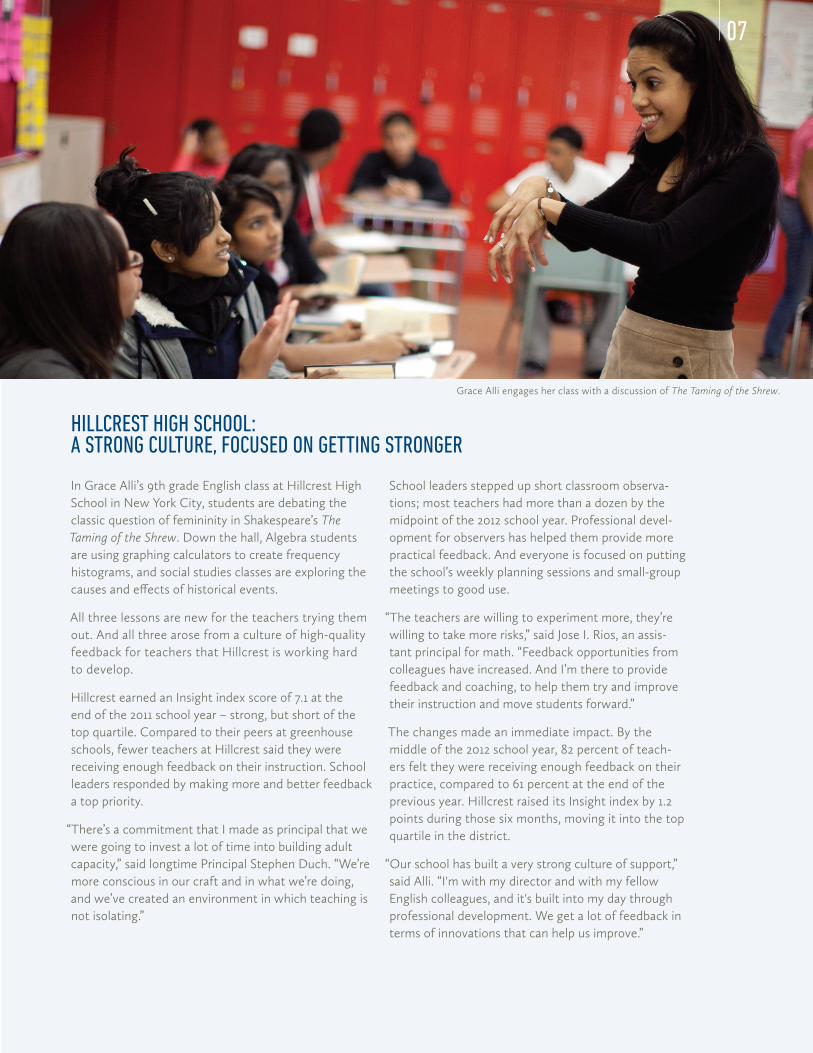
Grace Alli engages her class with a discussion of The Taming of the Shrew.
In Grace Alli’s 9th grade English class at Hillcrest High School in New York City, students are debating the classic question of femininity in Shakespeare’s The Taming of the Shrew. Down the hall, Algebra students are using graphing calculators to create frequency histograms, and social studies classes are exploring the causes and effects of historical events.
All three lessons are new for the teachers trying them out. And all three arose from a culture of high-quality feedback for teachers that Hillcrest is working hard to develop.
Hillcrest earned an Insight index score of 7.1 at the end of the 2011 school year – strong, but short of the top quartile. Compared to their peers at greenhouse schools, fewer teachers at Hillcrest said they were receiving enough feedback on their instruction. School leaders responded by making more and better feedback a top priority.
“There’s a commitment that I made as principal that we were going to invest a lot of time into building adult capacity,” said longtime Principal Stephen Duch. “We’re more conscious in our craft and in what we’re doing, and we’ve created an environment in which teaching is not isolating.”
School leaders stepped up short classroom observa-tions; most teachers had more than a dozen by the midpoint of the 2012 school year. Professional devel-opment for observers has helped them provide more practical feedback. And everyone is focused on putting the school’s weekly planning sessions and small-group meetings to good use.
“The teachers are willing to experiment more, they’re willing to take more risks,” said Jose I. Rios, an assis-tant principal for math. “Feedback opportunities from colleagues have increased. And I’m there to provide feedback and coaching, to help them try and improve their instruction and move students forward.”
The changes made an immediate impact. By the middle of the 2012 school year, 82 percent of teach-ers felt they were receiving enough feedback on their practice, compared to 61 percent at the end of the previous year. Hillcrest raised its Insight index by 1.2 points during those six months, moving it into the top quartile in the district.
“Our school has built a very strong culture of support,” said Alli. “I'm with my director and with my fellow English colleagues, and it's built into my day through professional development. We get a lot of feedback in terms of innovations that can help us improve.”
07
PUTTING THE ROADMAP TO WORK: PROGRESS IS POSSIBLEAll of the strategies in this paper are based on the successes of real schools. They don’t require extra funding, new laws or renegotiated union contracts. They are within reach of any dedicated school leader who decides to make instructional culture a top priority and do the hard work of implementing it consistently.
Of course, the roadmap we have presented is not one-size-fits-all. The ideal mix of the strategies above will vary in different districts or schools. That’s why it’s important for school leaders to gather regular feedback from teach-ers about the critical components of instructional culture. This process will help them diagnose the strengths and weaknesses of their particular school’s culture, identify specific areas for focus, and check in on their progress to-ward creating the culture they want. District leaders can help by surveying teachers annually and using the results to highlight the best practices of local schools with the strongest instructional cultures.
Although we have only been studying school culture for two years, we have already seen that schools can dramati-cally improve instructional culture in a short amount of time. It’s hard work, but it is also eminently possible—and it comes with enormous benefits for teachers and students.
FOR MORE INFORMATION To learn more about the Insight survey and how schools can use it to assess and strengthen their instructional culture, please visit tntp.org/insight
08

This appendix provides additional details on the scope of TNTP’s study of school culture, the Insight index, and third-party validation of the index by American Institutes for Research (AIR).
Scope of the Study
TNTP’s study included five school districts and three charter school sectors. Results reported throughout this paper reflect surveys completed by 4,818 teachers (61 percent of 7,866 teachers who received the survey) at 249 schools in the spring of 2011. Survey responses from an additional 4,515 teachers in one additional school district were used to validate the Insight index. Teachers in this district responded to a small subset of Insight questions as part of a separate survey. Because they were not asked to answer the more detailed questions about school culture that are part of the full Insight survey, we did not report results from this district in this paper.
City / Charter Sector Schools surveyed
Teachers surveyed
Survey responses (response
rate)
Schools with >40% response
rate
Mid-Atlantic City (charters) 49 1,284 1,112 (87%) 49
Northeast City #1 (district) 76 2,369 900 (38%) 36
Southern City #1 (district) 57 2,450 1,695 (69%) 57
Southern City #1 (charters) 9 169 137 (81%) 9
Midwest City (district) 29 880 660 (75%) 29
Northeast City #2 (charters) 5 126 78 (62%) 5
Southern City #2 (district) 24 588 236 (40%) 13
Total reported in paper 249 7,866 4,818 (61%) 198
Southern City #3 (district) 273 12,025 4,515 (38%) 120
Total used for validation 522 19,891 9,333 (47%) 318
TECHNICAL APPENDIX
09
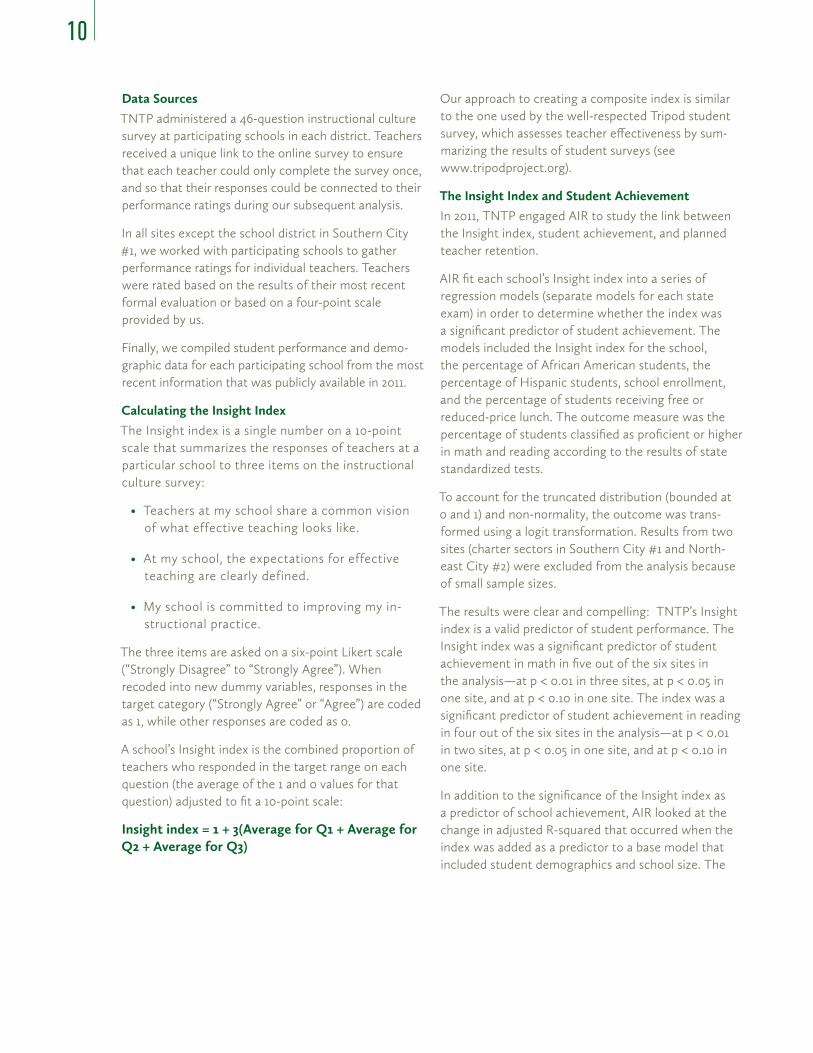
Data Sources
TNTP administered a 46-question instructional culture survey at participating schools in each district. Teachers received a unique link to the online survey to ensure that each teacher could only complete the survey once, and so that their responses could be connected to their performance ratings during our subsequent analysis.
In all sites except the school district in Southern City #1, we worked with participating schools to gather performance ratings for individual teachers. Teachers were rated based on the results of their most recent formal evaluation or based on a four-point scale provided by us.
Finally, we compiled student performance and demo-graphic data for each participating school from the most recent information that was publicly available in 2011.
Calculating the Insight Index
The Insight index is a single number on a 10-point scale that summarizes the responses of teachers at a particular school to three items on the instructional culture survey:
• Teachers at my school share a common vision of what effective teaching looks like.
• At my school, the expectations for effective teaching are clearly defined.
• My school is committed to improving my in-structional practice.
The three items are asked on a six-point Likert scale (“Strongly Disagree” to “Strongly Agree”). When recoded into new dummy variables, responses in the target category (“Strongly Agree” or “Agree”) are coded as 1, while other responses are coded as 0.
A school’s Insight index is the combined proportion of teachers who responded in the target range on each question (the average of the 1 and 0 values for that question) adjusted to fit a 10-point scale:
Insight index = 1 + 3(Average for Q1 + Average for Q2 + Average for Q3)
Our approach to creating a composite index is similar to the one used by the well-respected Tripod student survey, which assesses teacher effectiveness by sum-marizing the results of student surveys (see www.tripodproject.org).
The Insight Index and Student Achievement In 2011, TNTP engaged AIR to study the link between the Insight index, student achievement, and planned teacher retention.
AIR fit each school’s Insight index into a series of regression models (separate models for each state exam) in order to determine whether the index was a significant predictor of student achievement. The models included the Insight index for the school, the percentage of African American students, the percentage of Hispanic students, school enrollment, and the percentage of students receiving free or reduced-price lunch. The outcome measure was the percentage of students classified as proficient or higher in math and reading according to the results of state standardized tests.
To account for the truncated distribution (bounded at 0 and 1) and non-normality, the outcome was trans-formed using a logit transformation. Results from two sites (charter sectors in Southern City #1 and North-east City #2) were excluded from the analysis because of small sample sizes.
The results were clear and compelling: TNTP’s Insight index is a valid predictor of student performance. The Insight index was a significant predictor of student achievement in math in five out of the six sites in the analysis—at p < 0.01 in three sites, at p < 0.05 in one site, and at p < 0.10 in one site. The index was a significant predictor of student achievement in reading in four out of the six sites in the analysis—at p < 0.01 in two sites, at p < 0.05 in one site, and at p < 0.10 in one site.
In addition to the significance of the Insight index as a predictor of school achievement, AIR looked at the change in adjusted R-squared that occurred when the index was added as a predictor to a base model that included student demographics and school size. The
10

adjusted R-squared gives a measure of the amount of variance in the outcome measure that is explained by the terms included in the model, adjusted for the number of predictor variables. The models were fit first with only school characteristics (school size and student demographics) and then fit with the Insight in-dex score included for the school. The results showed that the Insight index explains between 5 percent and 20 percent of the variation in student performance between schools beyond what is explained by demo-graphics alone.
The difference in student achievement results between top- and bottom-quartile schools that we report is based on our own internal analysis. We first calculated the differences in mean proficiency levels between top- and bottom-quartile schools within each district or charter sector to account for the fact that standards and scoring scales vary on different state exams. We then averaged the differences across all sites and found a gap in student proficiency between top- and bottom-quartile schools of 21 percentage points in math and 14 percentage points in reading.
The difference in student achievement results for each one-point increase in Insight index was also based on our own internal analysis. We ran a series of regression models that included both student demographics and the Insight index as inputs to the model, with math proficiency and reading proficiency the outcomes of interest in two separate models for each site. The Insight index was a statistically significant input to the model in four of the six sites where it was run. In the math model, the index was significant at p < 0.01 in two sites and at p < 0.05 in two sites. In the read-ing model, the index was significant at p < 0.01 in one site, at p < 0.05 in two sites, and at p < 0.10 in one site. We then averaged the beta coefficients on the index variable in each model where it was statistically significant to determine that each one point increase in a school's Insight index corresponded to student proficiency rates that were 6 percentage points higher in math and 3.6 percentage points higher in reading.
The Insight Index and Planned Teacher Retention To model the relationship between the Insight index and planned teacher retention, AIR examined results from all the schools we studied and ran a series of generalized hierarchical linear models. Binomial regres-sion with a logistic link function was used to model the binary outcome (teachers planning to leave or planning to stay). Because these two possible outcomes were identical across all the sites—as opposed to student achievement results based on a variety of different standardized tests—AIR could run a single analysis to assess the predictive validity of the Insight index on teachers’ planned retention.
The two-level models nested teachers in schools, which were clustered in districts or charter networks. For most of the models, very little variance existed among sites once the between-campus variance was accounted for. Therefore, site-level fixed effects were used to account for variations in retention rates among the sites (since site-level random effects had near zero variance).
AIR found that the Insight index is a strong negative predictor that teachers will indicate they plan to leave the school. In other words, the higher the Insight index, the less likely it is that teachers intend to leave their school. The coefficients can be translated into to an odds-ratio of 0.81 for the likelihood that a teacher will leave their current school this year or next year, implying that for each unit increase in the Insight index, teachers are only 81 percent as likely to leave as before (or 19 percent less likely to leave).
Once again, the result was clear: Across all the par-ticipating sites, the Insight index is a valid predictor of planned teacher retention at the p = 0.05 level.
11
1 Hanushek, Eric. 1997. “Assessing the Effects of School Resources on Student Performance: An Update.” Educational Evaluation and Policy Analysis, 19(2): 141-164.
2 Dobbie, Will and Fryer, Roland G. 2011. “Getting Beneath the Veil of Effective Schools: Evidence from New York City.” NBER Working Paper No. 17632.
3 Many studies have shown that planned retention has a strong relationship with actual retention. See, e.g., Moynihan, D., & Landuyt, N. (2008). Explaining turnover intention in state government: Examining the roles of gender, life cycle, and loyalty. Review of Public Personnel Administration, 28(2), 120-143.
4 For more information on how we calculated the Insight index, see the Technical Appendix.
5 The same trend appeared within greenhouse charter schools, but to a lesser degree.
6 A school’s Insight index predicts as much as 20 percent of a school’s achievement results above and beyond what demographics alone can predict. For more information on the statistical links between teacher retention, student achievement and instructional culture index, see the Technical Appendix.
7 Levin, Jessica and Quinn, Meredith. 2003. Missed Opportunities: How We Keep High-Quality Teachers Out of Urban Classrooms. TNTP.
12
TNTP strives to end the injustice of educational inequality by providing excellent teachers to the students who need them most and by advancing policies and practices that ensure effective teaching in every classroom. A national nonprofit organization founded by teachers, TNTP is driven by the knowledge that effective teachers have a greater impact on student achievement than any other school factor. In response, TNTP develops customized programs and policy interventions that enable education leaders to find, develop and keep great teachers. Since its inception in 1997, TNTP has recruited or trained approximately 49,000 teachers - mainly through its highly selective Teaching Fellows programs - benefiting an estimated 8 million students. TNTP has also released a series of acclaimed studies of the policies and practices that affect the quality of the nation's teacher workforce, including The Widget Effect (2009) and Teacher Evaluation 2.0 (2010). Today TNTP is active in more than 25 cities, including 10 of the nation's 15 largest.
www.tntp.org
13

2012
GREENHOUSE SCHOOLSHow Schools Can Build Cultures Where Teachers and Students Thrive
www.tntp.org