oil security index oil security quarterly...
TRANSCRIPT
Oil Security IndexQuarterly Update
Oil Security Index
July 2014
2 Oil Security Index Quarterly Update – July 2014
2005 2006 2007 2008 2009 2010 2011 2012 2013 2014
RUSSIA
SAUDI ARABIA
INDIA
AUSTRALIA
MEXICO
CHINA
CANADA
UNITED KINGDOM
GERMANY
JAPAN 1
2
3
4
5
6
7
8
9
10
11
12
13
UNITED STATES
SOUTH AFRICA
BRAZIL
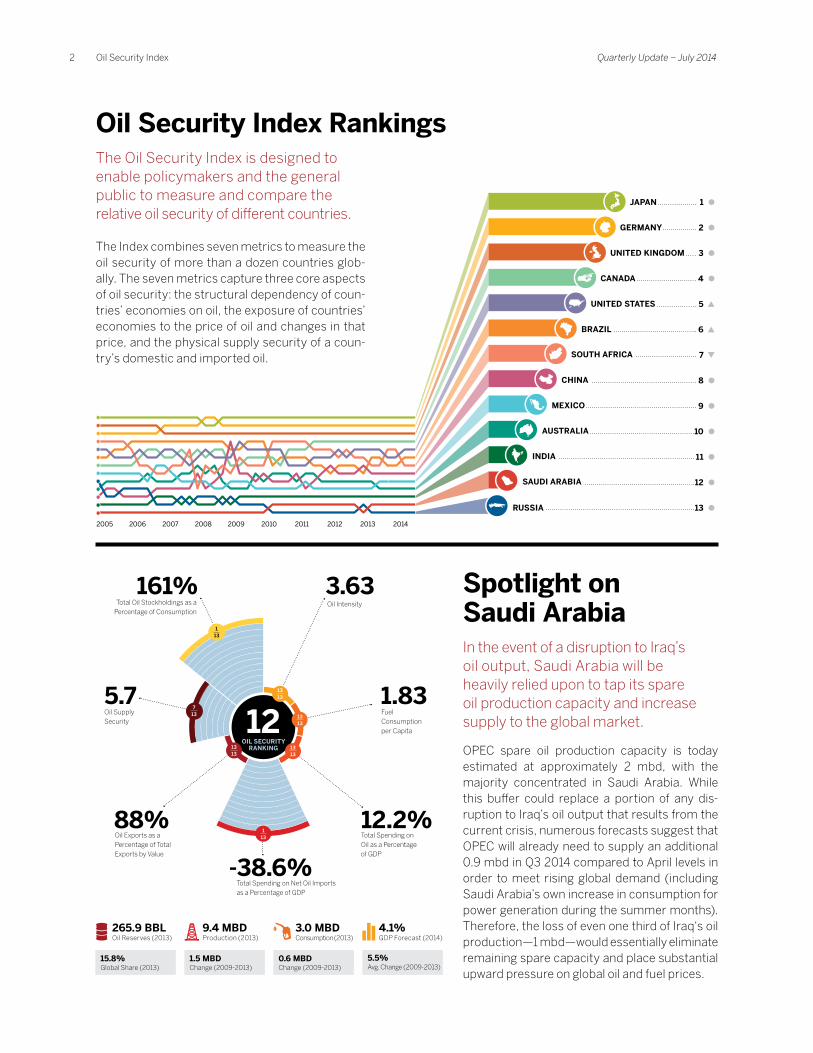
Spotlight on Saudi ArabiaIn the event of a disruption to Iraq’s oil output, Saudi Arabia will be heavily relied upon to tap its spare oil production capacity and increase supply to the global market.
OPEC spare oil production capacity is today estimated at approximately 2 mbd, with the majority concentrated in Saudi Arabia. While this buffer could replace a portion of any dis-ruption to Iraq’s oil output that results from the current crisis, numerous forecasts suggest that OPEC will already need to supply an additional 0.9 mbd in Q3 2014 compared to April levels in order to meet rising global demand (including Saudi Arabia’s own increase in consumption for power generation during the summer months). Therefore, the loss of even one third of Iraq‘s oil production—1 mbd—would essentially eliminate remaining spare capacity and place substantial upward pressure on global oil and fuel prices.
9.4 MBDProduction (2013)
1.5 MBDChange (2009-2013)
265.9 BBLOil Reserves (2013)
15.8%Global Share (2013)
3.0 MBDConsumption (2013)
0.6 MBDChange (2009-2013)
4.1%GDP Forecast (2014)
5.5%Avg. Change (2009-2013)
161% 3.63
88% 12.2%
1.83
-38.6%
5.7
Oil Exports as a Percentage of Total Exports by Value
Fuel Consumption per Capita
Oil Intensity
Total Spending on Net Oil Imports as a Percentage of GDP
Oil Supply Security
Total Spending on Oil as a Percentage of GDP
Total Oil Stockholdings as a Percentage of Consumption
12OIL SECURITY
RANKING
113
1313
713
1313
1313
1313
113
Oil Security Index RankingsThe Oil Security Index is designed to enable policymakers and the general public to measure and compare the relative oil security of different countries.
The Index combines seven metrics to measure the oil security of more than a dozen countries glob-ally. The seven metrics capture three core aspects of oil security: the structural dependency of coun-tries’ economies on oil, the exposure of countries’ economies to the price of oil and changes in that price, and the physical supply security of a coun-try’s domestic and imported oil.
Quarterly Update – July 2014 Oil Security Index 3
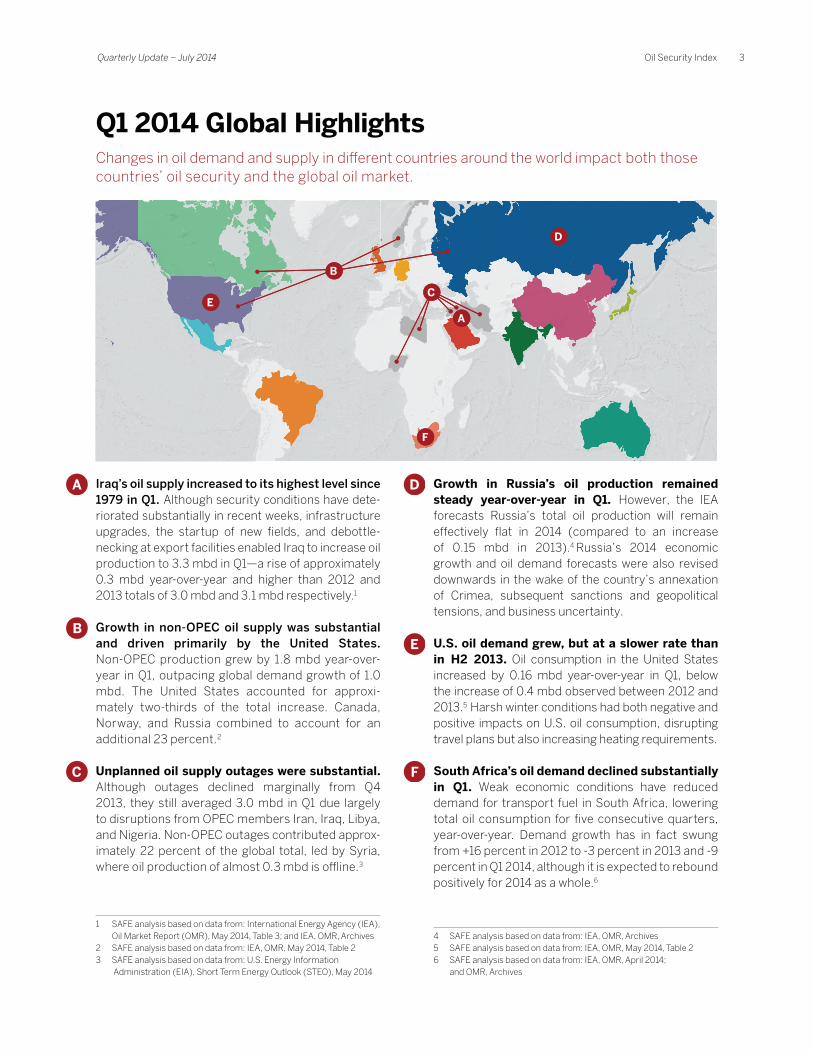
Iraq’s oil supply increased to its highest level since 1979 in Q1. Although security conditions have dete-riorated substantially in recent weeks, infrastructure upgrades, the startup of new fields, and debottle-necking at export facilities enabled Iraq to increase oil production to 3.3 mbd in Q1—a rise of approximately 0.3 mbd year-over-year and higher than 2012 and 2013 totals of 3.0 mbd and 3.1 mbd respectively.1
Growth in non-OPEC oil supply was substantial and driven primarily by the United States. Non-OPEC production grew by 1.8 mbd year-over-year in Q1, outpacing global demand growth of 1.0 mbd. The United States accounted for approxi-mately two-thirds of the total increase. Canada, Norway, and Russia combined to account for an additional 23 percent.2
Unplanned oil supply outages were substantial. Although outages declined marginally from Q4 2013, they still averaged 3.0 mbd in Q1 due largely to disruptions from OPEC members Iran, Iraq, Libya, and Nigeria. Non-OPEC outages contributed approx-imately 22 percent of the global total, led by Syria, where oil production of almost 0.3 mbd is offline.3
1 SAFE analysis based on data from: International Energy Agency (IEA), Oil Market Report (OMR), May 2014, Table 3; and IEA, OMR, Archives
2 SAFE analysis based on data from: IEA, OMR, May 2014, Table 23 SAFE analysis based on data from: U.S. Energy Information
Administration (EIA), Short Term Energy Outlook (STEO), May 2014
A
B
C
Growth in Russia’s oil production remained steady year-over-year in Q1. However, the IEA forecasts Russia’s total oil production will remain effectively flat in 2014 (compared to an increase of 0.15 mbd in 2013).4 Russia’s 2014 economic growth and oil demand forecasts were also revised downwards in the wake of the country’s annexation of Crimea, subsequent sanctions and geopolitical tensions, and business uncertainty.
U.S. oil demand grew, but at a slower rate than in H2 2013. Oil consumption in the United States increased by 0.16 mbd year-over-year in Q1, below the increase of 0.4 mbd observed between 2012 and 2013.5 Harsh winter conditions had both negative and positive impacts on U.S. oil consumption, disrupting travel plans but also increasing heating requirements.
South Africa’s oil demand declined substantially in Q1. Weak economic conditions have reduced demand for transport fuel in South Africa, lowering total oil consumption for five consecutive quarters, year-over-year. Demand growth has in fact swung from +16 percent in 2012 to -3 percent in 2013 and -9 percent in Q1 2014, although it is expected to rebound positively for 2014 as a whole.6
4 SAFE analysis based on data from: IEA, OMR, Archives5 SAFE analysis based on data from: IEA, OMR, May 2014, Table 26 SAFE analysis based on data from: IEA, OMR, April 2014;
and OMR, Archives
D
E
F
Q1 2014 Global HighlightsChanges in oil demand and supply in different countries around the world impact both those countries’ oil security and the global oil market.
F
E
D
A
C
B

4 Oil Security Index Quarterly Update – July 2014
Focus on China’s Oil SecurityRising demand for personal mobility is fueling the country’s growing oil consumption and increasing import dependence despite gains in efficiency and a recent slowdown in industrial and heavy-duty transportation oil use.
BACkGROUnDAlthough China is one of the world’s largest oil producers (4.2 mbd in 2013), the country is becoming increasingly reliant on imports to keep pace with demand that has risen from approximately 4.5 mbd at the turn of the century to 10.5 mbd today.1 In response to such rapid oil demand growth and the prospect of relying on imports for more than 75 percent of total oil supplies by 2035,2 Chinese leaders have in recent years set aggressive goals for vehicle effi-ciency similar to those established in the European Union and begun exploring alternative transportation fuels.
On the supply side, the country has sought to promote oil exploration and development in dozens of countries, investing billions of dollars through its national oil com-panies (NOCs) to strengthen vertical supply chains. China is also increasing the size of its oil stockholdings to provide insurance in the event of a future oil supply disruption and is estimated to have added to these reserves at a rate of approximately 0.7 mbd through the first four months of the year.3 These stockholdings have particular importance given China’s reliance on a group of historically unstable and unpredictable regimes in the Middle East and Africa, as well as Russia.
Q1 2014 InDEx SUMMARyChina remained eighth out of 13 countries in the latest rankings and has traded places with Brazil in the bottom half of the Index rankings since Q4 2011. China’s middle-tier ranking is a function of several top-tier and bottom-tier results across the seven metrics. For example, despite more than doubling since 2000, the country’s Fuel Consumption per Capita metric result remains the second lowest in the Index after India and would need to double again to match Brazil and South Africa. China’s Total Spending on Net Oil Imports and Oil Supply Security metric results are by contrast among the weakest in the Index due to the country’s rising dependence on imports—China over-took the United States to become the world’s largest
1 IEA, OMR, Archives2 SAFE analysis based on data from: IEA, World Energy Outlook (WEO)
2013, Tables 14.5 and 15.23 SAFE analysis based on data from: IEA, OMR, May 2014
oil importer in Q4 20134—and the relatively unstable nature of its oil supply network, which includes Angola, Iran, and Iraq, among others.
Substantial further improvement in efficiency and the use of alternative transportation fuels will be necessary to limit the country’s rapidly growing oil demand over the longer term. The development of China’s sizeable shale oil reserves—estimated at more than 30 billion barrels5—could also help mitigate the country’s rising import dependence and improve security of supply (as could, with respect to possible supply disruptions, completing the construction and filling of strategic stock-holdings). Ultimately, given the rate of economic growth and expansion of demand for personal mobility, reducing the oil intensity of the Chinese economy will most mean-ingfully affect a selection of Index metrics and prevent deterioration of China’s ranking over time.
4 U.S. EIA, Country Analysis Briefs, China, last updated February 4, 2014, last accessed June 2, 2014
5 U.S. EIA, Technically Recoverable Shale Oil and Shale Gas Resources: An Assessment of 137 Shale Formations in 41 Countries Outside the United States, Table 5, at 10 (June 2013)
FIGURE 1
Annual Change in Oil Demand by Country/Region
Source: SAFE analysis based on data from BP Statistical Review of World Energy 2014
0
-1
-2
1
2
3
2013201120092007200520032001M
ILLI
ON
BA
RR
ELS
PE
R D
AY
MIDDLE EASTCHINA INDIA OTHER
Quarterly Update – July 2014 Oil Security Index 5
Oil Security Index 5
Source: Bo. Itatibus, sum aspidel laborem intia vitissed quatur.um aspidel laborem intia vitissed quatur.
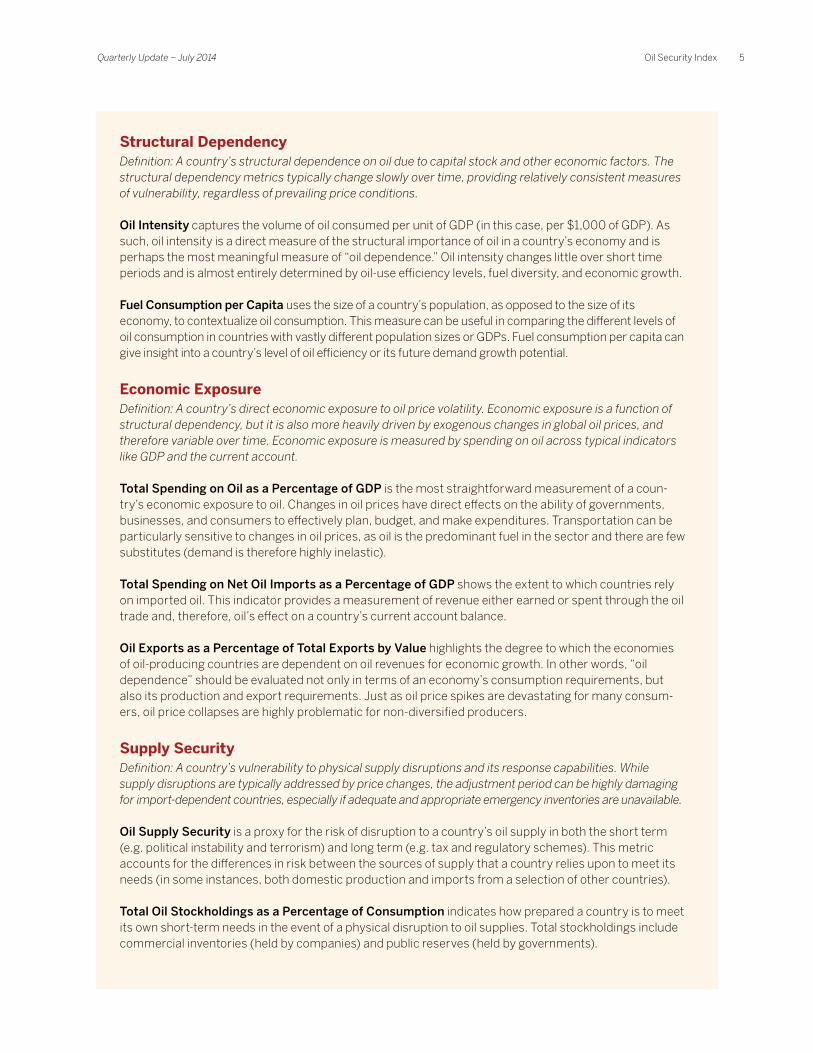
Structural DependencyDefinition: A country’s structural dependence on oil due to capital stock and other economic factors. The structural dependency metrics typically change slowly over time, providing relatively consistent measures of vulnerability, regardless of prevailing price conditions.
Oil Intensity captures the volume of oil consumed per unit of GDP (in this case, per $1,000 of GDP). As such, oil intensity is a direct measure of the structural importance of oil in a country’s economy and is perhaps the most meaningful measure of “oil dependence.” Oil intensity changes little over short time periods and is almost entirely determined by oil-use efficiency levels, fuel diversity, and economic growth.
Fuel Consumption per Capita uses the size of a country’s population, as opposed to the size of its economy, to contextualize oil consumption. This measure can be useful in comparing the different levels of oil consumption in countries with vastly different population sizes or GDPs. Fuel consumption per capita can give insight into a country’s level of oil efficiency or its future demand growth potential.
Economic ExposureDefinition: A country’s direct economic exposure to oil price volatility. Economic exposure is a function of structural dependency, but it is also more heavily driven by exogenous changes in global oil prices, and therefore variable over time. Economic exposure is measured by spending on oil across typical indicators like GDP and the current account.
Total Spending on Oil as a Percentage of GDP is the most straightforward measurement of a coun-try’s economic exposure to oil. Changes in oil prices have direct effects on the ability of governments, businesses, and consumers to effectively plan, budget, and make expenditures. Transportation can be particularly sensitive to changes in oil prices, as oil is the predominant fuel in the sector and there are few substitutes (demand is therefore highly inelastic).
Total Spending on Net Oil Imports as a Percentage of GDP shows the extent to which countries rely on imported oil. This indicator provides a measurement of revenue either earned or spent through the oil trade and, therefore, oil’s effect on a country’s current account balance.
Oil Exports as a Percentage of Total Exports by Value highlights the degree to which the economies of oil-producing countries are dependent on oil revenues for economic growth. In other words, “oil dependence” should be evaluated not only in terms of an economy’s consumption requirements, but also its production and export requirements. Just as oil price spikes are devastating for many consum-ers, oil price collapses are highly problematic for non-diversified producers.
Supply SecurityDefinition: A country’s vulnerability to physical supply disruptions and its response capabilities. While supply disruptions are typically addressed by price changes, the adjustment period can be highly damaging for import-dependent countries, especially if adequate and appropriate emergency inventories are unavailable.
Oil Supply Security is a proxy for the risk of disruption to a country’s oil supply in both the short term (e.g. political instability and terrorism) and long term (e.g. tax and regulatory schemes). This metric accounts for the differences in risk between the sources of supply that a country relies upon to meet its needs (in some instances, both domestic production and imports from a selection of other countries).
Total Oil Stockholdings as a Percentage of Consumption indicates how prepared a country is to meet its own short-term needs in the event of a physical disruption to oil supplies. Total stockholdings include commercial inventories (held by companies) and public reserves (held by governments).

6 Oil Security Index Quarterly Update – July 2014
ASSESSInG tHE OUtLOOk FOR CHInA’S OIL DEMAnDBetween 2000 and 2013, consumption of petroleum fuels outside of the OECD increased by 17.2 mbd.6 Demand within OECD member countries actually declined by nearly 3 mbd over the same period.7 No country was more central to this story than China. Between 2000 and 2013, oil demand in China increased by 6 mbd, accounting for approximately 42 percent of the global increase and adding the oil demand equiva-lent of today’s Canada, Mexico, and the United Kingdom combined to the marketplace.8
However, there are indications that a combination of factors, including more sluggish manufacturing activity, increasing gains in efficiency, and reduced heavy-duty transportation oil use (e.g. rail-based coal shipments) moderated overall demand growth over the past year or so, resulting in a decline in diesel demand of approx-imately 1.5 percent in 2013.9 Nevertheless, this decel-eration masked a more important trend: rising Chinese demand for personal mobility.
While few estimates suggest that the breakneck pace of China’s oil demand growth in the 2000s will continue, a significant slowdown in neither oil consumption nor overall economic growth should be expected. Perhaps more importantly, even if a sharp economic slowdown were to occur, the decline in China’s overall economic growth rate would likely not be met with a corresponding slowdown in oil demand growth over a sustained period of time. This is because China’s traditional growth model
6 BP, plc., Statistical Review of World Energy (Statistical Review) 2014, Historical data workbook, Consumption (thousand barrels daily)
7 Id.; OECD oil demand increased from 48.3 mbd in 2000 to a peak of 50.0 mbd in 2005 before declining to 45.6 mbd in 2013.
8 BP, plc., Statistical Review 2014, Historical data workbook, Consumption (thousand barrels daily)
9 IEA, OMR, February 2014, China: Demand by Product, at 8
has been driven primarily by exports, government spend-ing, and relatively high savings rates rather than con-sumer spending. Oil demand is instead chiefly a function of the transportation sector and will, therefore, correlate more closely with consumer spending than with the other factors that impact economic growth. As a result, wide-spread desire for personal mobility remains the primary driver of China’s oil demand growth and appears poised to endure as such for the foreseeable future.
China’s gasoline demand surged by 6.6 percent in 2013 and 11.3 percent in Q1 2014 year-over-year.10 Passenger vehicle sales in China have grown rapidly over the past decade and in fact exceeded those in the United States since 2010, driving a more than six-fold increase in the number of vehicles per 1,000 people between 2004 and 2013.11 This represents an increase of more than 90 million passenger vehicles on Chinese roads.12 However, there are still only approximately 80 passenger vehicles per 1,000 people in China, an order of magnitude fewer than the number in the United States (800 vehicles per 1,000 people).13 Nonetheless, this number continues to rise as China’s passenger vehicles sales grow. These sales proceeded apace through the global economic recession of the late 2000s and increased by approx-imately 10 percent year-over-year in Q1 2014.14 Over the longer term, China’s light-duty passenger vehicle stock is projected to increase more than four-fold to nearly 450 million by 2035.15 Moreover, demand for other petroleum products, particularly those used in transportation—such as diesel for heavy-duty road freight and jet fuel
10 Id., and SAFE analysis based on data from: IEA and Platts11 SAFE analysis based on data from: World Bank12 Id.13 Id.14 SAFE analysis based on data from: China Association of Automobile
Manufacturers15 IEA, WEO 2013, Figure 15.8, at 513
0.0
0.5
1.0
1.5
2.0
2.5
20142013201220112010200920082007200620052004200320020
4
8
12
16
20
MIL
LIO
N U
NIT
S S
OLD
(A
NN
UA
LIZ
ED
) M
ILLION
BA
RR
ELS
PE
R D
AY
U.S. SALES (LHS)CHINA SALES (LHS) CHINA GASOLINE (RHS, FOUR QUARTER ROLLING AVERAGE)
FIGURE 2
China Passenger Vehicle Sales and Gasoline Demand
Source: SAFE analysis based on data from: BEA, IEA, Platts, and China Association of Automobile Manufacturers
Quarterly Update – July 2014 Oil Security Index 7
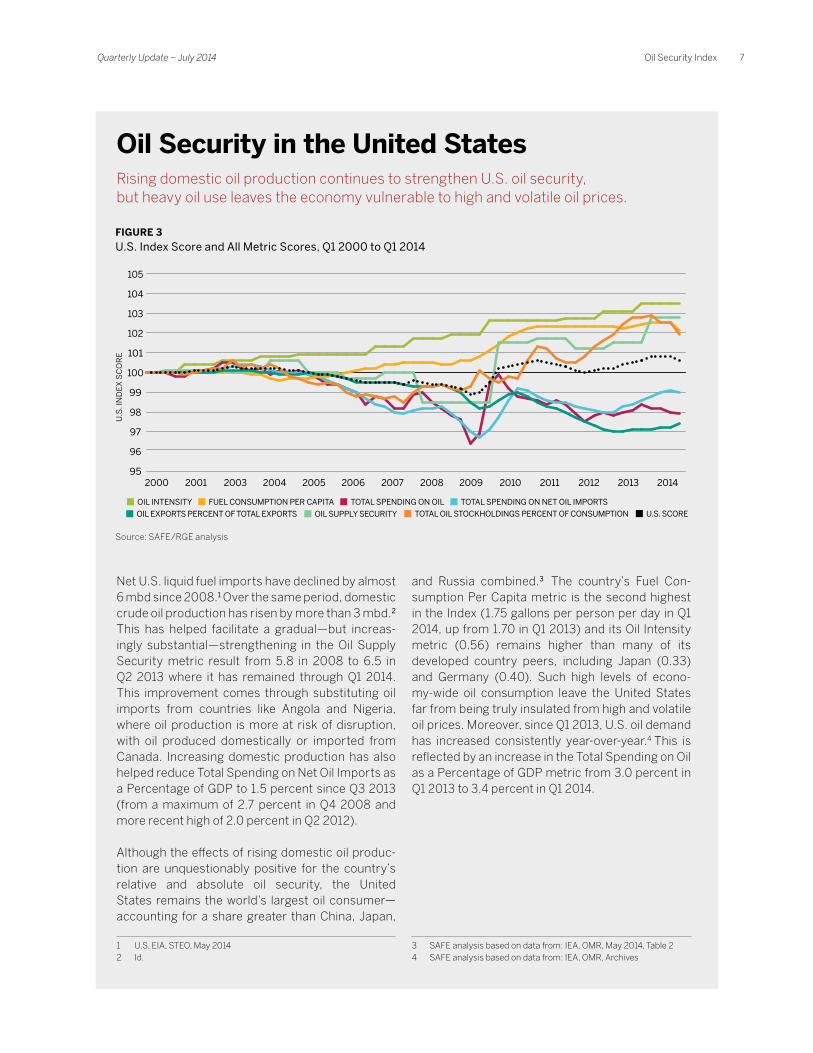
Oil Security in the United StatesRising domestic oil production continues to strengthen U.S. oil security, but heavy oil use leaves the economy vulnerable to high and volatile oil prices.
Net U.S. liquid fuel imports have declined by almost 6 mbd since 2008.1 Over the same period, domestic crude oil production has risen by more than 3 mbd.2 This has helped facilitate a gradual—but increas-ingly substantial—strengthening in the Oil Supply Security metric result from 5.8 in 2008 to 6.5 in Q2 2013 where it has remained through Q1 2014. This improvement comes through substituting oil imports from countries like Angola and Nigeria, where oil production is more at risk of disruption, with oil produced domestically or imported from Canada. Increasing domestic production has also helped reduce Total Spending on Net Oil Imports as a Percentage of GDP to 1.5 percent since Q3 2013 (from a maximum of 2.7 percent in Q4 2008 and more recent high of 2.0 percent in Q2 2012).
Although the effects of rising domestic oil produc-tion are unquestionably positive for the country’s relative and absolute oil security, the United States remains the world’s largest oil consumer— accounting for a share greater than China, Japan,
1 U.S. EIA, STEO, May 20142 Id.
and Russia combined.3 The country’s Fuel Con-sumption Per Capita metric is the second highest in the Index (1.75 gallons per person per day in Q1 2014, up from 1.70 in Q1 2013) and its Oil Intensity metric (0.56) remains higher than many of its developed country peers, including Japan (0.33) and Germany (0.40). Such high levels of econo-my-wide oil consumption leave the United States far from being truly insulated from high and volatile oil prices. Moreover, since Q1 2013, U.S. oil demand has increased consistently year-over-year.4 This is reflected by an increase in the Total Spending on Oil as a Percentage of GDP metric from 3.0 percent in Q1 2013 to 3.4 percent in Q1 2014.
3 SAFE analysis based on data from: IEA, OMR, May 2014, Table 24 SAFE analysis based on data from: IEA, OMR, Archives
FIGURE 3
U.S. Index Score and All Metric Scores, Q1 2000 to Q1 2014
2000 2003
100
98
96
102
104
105
103
101
99
97
952005 2007 2009 2011 201220102008200620042001 2013 2014
U.S
. IN
DE
X S
CO
RE
OIL SUPPLY SECURITY
FUEL CONSUMPTION PER CAPITA TOTAL SPENDING ON OILOIL INTENSITY TOTAL SPENDING ON NET OIL IMPORTS
TOTAL OIL STOCKHOLDINGS PERCENT OF CONSUMPTIONOIL EXPORTS PERCENT OF TOTAL EXPORTS U.S. SCORE
Source: SAFE/RGE analysis

for aviation—are also set to remain robust.16 Relatively stringent fuel economy regulations are expected to help temper increases in oil demand, but rising sales of large passenger vehicles, such as SUVs, will likely neutralize these efforts to some extent.17
Notably, the growth in future global mobility demand will be concentrated in developing countries like China. However, although today oil demand is expected to track mobility demand nearly one-for-one, the more widespread use of alternative transportation fuels could facilitate a meaning-ful decline in oil demand growth versus current forecasts—something that could have a positive impact on the ability of global oil supplies to meet global oil demand, and exert downward pressure on prices. Natural gas appears poised
16 IEA, Medium-Term Oil Market Report (MTOMR) 2014, at 3417 See, e.g., Bernstein Research, “Petrophilia – Can the Rise of China’s Auto-
Crazed Petro-Consumers Offset Slower Industrial Growth?”, August 16, 2013
to play a major role, especially in medium and heavy-duty vehicles where it has already observed an increase in use in major markets, including China. In fact, roughly half a million natural gas vehicles (NGVs) were added to Chinese roads in 2012 and the country is expected to become the world’s largest NGV market by 2015.18 In the passenger segment, electric vehicles that can be recharged at home and places of work—and are typically powered by a diverse group of non-petroleum fuels—could emerge as a preferred option. Hydrogen, advanced biofuels, and others may also establish themselves in the marketplace for particular transport applications.
Perhaps more than in any other major oil-consuming country, China’s government has the ability to quickly and unilaterally enact aggressive policies to reduce its oil demand growth. In its current (12th) Five-Year Plan, for example, the government announced plans to invest $15 billion in what it terms New Energy Vehicles (vehicles that are powered fully or partially by electricity).19 This invest-ment includes subsidies for buyers and manufacturing companies.20 Cities such as Beijing and Shenzhen have also offered incentives to buyers, including subsidies and free license plates.21 Still more forceful action could be sparked by a desire to further curb pollution (something that is being taken more and more seriously22), rein in a spiraling oil-trade balance, decrease the risk of disruption to its oil imports, reduce the oil intensity of the Chinese economy, or some combination of all these factors.
18 IEA, MTOMR 2014, at 3519 See, e.g., U.S. EIA, Today in Energy, “China promotes both fuel efficiency
and alternative-fuel vehicles to curb growing oil use,” May 13, 201420 Id.21 Id.22 See, e.g., Reuters, “Global auto component makers gear up for China’s
tougher emission rules,” June 8, 2014; and International Business Times, “China ‘Energy Revolution’ Needed to Meet Soaring Energy Demand and Cut Pollution Problems, President Xi Says,” June 16, 2014
0
100
200
300
400
500
20352030202520202015201020052000
MIL
LIO
N U
NIT
S
EUROPEAN UNIONUNITED STATES MIDDLE EASTCHINA
INDIA OTHER
FIGURE 4
Forecast Passenger Light-Duty Vehicle Stock Growth
Source: IEA and SAFE/RGE analysis based on data from: IEA
1111 19th Street, NW, Suite 406
Washington, DC 20036
(202) 461-2360
SecureEnergy.org
120 Broadway, Suite 2740
New York, NY 10271
(212) 645-0010
Roubini.com
The Oil Security Index is an analytical tool developed by Securing America’s Future Energy in partnership with Roubini Global Economics. The Index is designed to enable policymakers and the general public to measure and compare the relative oil security of more than a dozen countries around the world.
Learn more at OilSecurityIndex.org
Oil Security Index