groundwater characteristics in jakarta area,...
TRANSCRIPT
Kagabu Makoto, et.al / Riset Geologi dan Pertambangan Vol. 20 No. 2 (2010), 69 -79.
69
GROUNDWATER CHARACTERISTICS IN JAKARTA AREA,
INDONESIA
Makoto Kagabu, Robert M. Delinom, Rachmat Fajar Lubis, Jun Shimada and
Makoto Taniguchi
ABSTRACT In the Jakarta area (Indonesia),
excessive groundwater pumping due to the
rapidly increasing population has caused
groundwater-related problems such as brackish
water contamination in coastal areas and land
subsidence. In this study, we adopted multiple
hydrogeochemical techniques to understand
groundwater characteristic in the Jakarta area.
Although almost all groundwater existing in the
Jakarta basin is recharged at similar elevations,
the water quality and apparent residence time
demonstrates a clear difference between the
shallow and deep aquifers.
Naskah masuk : 12 Oktober 2010
Naskah diterima : 14 Desember 2010
Makoto Kagabu
Kumamoto University Email : [email protected]
Robert M. Delinom
Research Center for Geotechnology, Indonesian
Institute of Sciences, Bandung 40135 Email : [email protected]
Rachmat Fajar Lubis
Research Center for Geotechnology, Indonesian
Institute of Sciences, Bandung 40135 Email : [email protected]
Jun Shimada
Kumamoto University
Email : [email protected]
Makoto Taniguchi
Research Institute for Humanity and Nature, RIHN,
Kyoto, Japan
Email : [email protected]
Due to the rapid decrease in the groundwater
potential in urban areas, we found that the
seawater intrusion in shallow aquifer and the
shallow and deep groundwaters are mixing, a
conclusion confirmed by major ions, Br−:Cl
−
ratios and chlorofluorocarbon (CFC)-12 analysis.
Keywords: groundwater hydrogeochemistry,
excessive groundwater pumping, chlorofluoro
carbon (CFC), Jakarta, Indonesia
ABSTRAK Di Jakarta, Indonesia, pemompaan
airtanah yang terus menerus karena
penambahan jumlah penduduk telah
menyebabkan terjadinya beberapa masalah yang
berhubungan dengan sumberdaya air, seperti
adanya kontaminasi air payau di sekitar pantai
dan penurunan muka tanah. Dalam penelitian
ini, telah digunakan berbagai teknik kimia
airtanah untuk mengetahui karakteristik dari
airtanah di Daerah Jakarta. Meskipun hampir
semua airtanah di Jakarta diresapkan pada
ketinggian yang sama, kualitas air dan waktu
tinggal memperlihatkan perbedaan yang jelas
antara akifer dangkal dan akifer dalam. Karena
adanya penurunan airtanah potesial yang cepat
di daerah perkotaan, ditemukan bahwa intrusi
airlaut dalam airtanah bebas dan adanya
percampuran antara airtanah bebas dan
tertekan, kesimpulan ini dikonfirmasi oleh ion
utama, rasio Br−:Cl
- dan analisis chlorofluoro-
carbon (CFC)-12.
Kata Kunci: airtanah, hidrogeokimia,
pemompaan airtanah berlebih, khlorofluoro
karbon (CFC), Jakarta, Indonesia
Kagabu Makoto, et.al / Riset Geologi dan Pertambangan Vol. 20 No. 2 (2010), 69 -79.
70
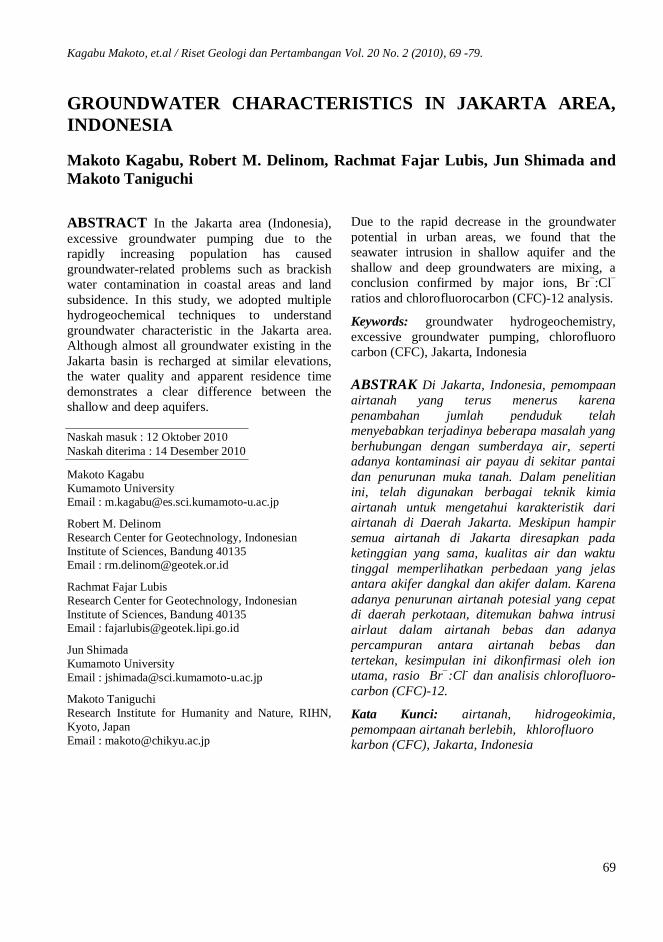
Figure 1 Maps showing (a) study area and sampling locations and (b) the land use divided into
eight components. A cross line (A-A’) in Fig. 1a corresponds to the cross sections in
Figs. 4 and 7.
INTRODUCTION
Subsurface environmental problems, such as land
subsidence due to excessive groundwater
abstraction and groundwater contamination, have
occurred consecutively in large Asian cities
(Foster and Chilton, 2003) with some time lag
between each city. Most of these growing Asian
mega-cities are located in coastal areas (Jiang et
al., 2001) where basement geologies are
composed of quaternary marine or fluvial
unconsolidated deposits. Jakarta, the capital city
of Indonesia, is one of the cities that suffer from
groundwater related problems.Researchers have
recently conducted hydrogeochemical studies of
the Jakarta Groundwater Basin. Delinom et al.
(2009) classified regional groundwater into
hydrochemical groups on the basis of major ion
chemistry by using Stiff diagrams. Umezawa et
al. (2008) and Onodera et al. (2008) showed
nitrate contamination in agricultural fields and
mentioned the possibility of seawater intrusion
into groundwater in coastal areas. Lubis et al.
(2008) identified recharge and discharge areas by
groundwater temperature profile measurements
in deep observation wells. However, an
integrated study that employs multiple
hydrogeochemical techniques has not yet been
performed in the Jakarta groundwater basin.
STUDY AREA
The Java Sea borders Jakarta, the capital city of
the Republic of Indonesia, to the north (Fig. 1a).
The province of Jakarta (DKI Jakarta; 6°00'-
6°20″ S, 106°42'-107°00″ E) has a surface area
of approximately 652 km2 and a humid tropical
climate that is significantly influenced by
monsoon winds. The long-term mean annual
rainfall in this city ranges between 1,500 and
2,500 mm/year, with a dry season (<100
mm/month) that lasts 7–8 months in coastal
areas, 2–4 months at elevations of 30–50 m
above sea level (asl), and less at higher
elevations. Peak rainfall usually occurs
throughout the region in January, while the least
rainfall occurs between June and August. The
long-term mean monthly temperature ranges
between 26°C and 28°C, and the mean annual air
temperature is 27°C. The mean potential
evapotranspiration for the Jakarta region is 1,606
mm/year (Tambunan, 2007).
The Jakarta Groundwater Basin, in which the city
of Jakarta resides, is one of the most developed
basins in Indonesia. The aquifer system in this
basin is classified (upper to lower order) into the
following five zones (Fachri et al., 2003).
Zone 1 is a shallow aquifer layer composed of
sandstone, conglomerate, and claystone.

Kagabu Makoto, et.al / Riset Geologi dan Pertambangan Vol. 20 No. 2 (2010), 69 -79.
71
Zones 2 and 4 are aquiclude layers composed of
claystone with sand infixes.
Zone 3 is a deep aquifer layer composed of
sandstone with infixes of breccias and claystone.
Zone 5 is the basement of the Jakarta
Groundwater Basin, composed of impermeable
rocks such as limestone and claystone.
The vertical cross section of the local
hydrogeology along the line (A-A’) in Figure. 1a
(south to north) is shown in Figures. 4 and 7.
METHODOLOGY
We collected 46 groundwater, 5 spring water, 2
hot spring, and 3 river water samples between
February and March, 2008 (Fig. 1a). The
Groundwater samples were collected from
observation wells, production wells, and dug
wells.
Temperature, pH, and electric conductivity (EC)
of the water samples collected in this study were
measured in the field by using a portable EC/pH
meter (WM-22EP, TOA DKK, Japan). Samples
for stable isotope (δ18
O and δD) and major ion
(Na+, K
+, Ca
2+, Mg
2+, Cl
−, NO3
−, and SO4
2−)
analyses were collected in 100-mL polyethylene
bottles at the hydrology laboratory of Kumamoto
University.
We analyzed the major ions by ion
chromatography (Compact IC 761, Metrohm,
Switzerland) with the analytical error typically
within 10%; the alkalinity titration could be
substituted for the activity of HCO3−. Stable
isotope ratios and D/H ratios of water were
determined by the CO2 equilibration method and
the chromium-reduction method, respectively,
followed by analysis by using a Thermo Electron
Delta S mass spectrometer (USA). Hydrogen and
oxygen isotope ratios were expressed using δD
and δ18
O, respectively, where δ =
((Rsample/Rstandard)− 1)1000 (‰) and R is the ratio
of 2H/
1H or
18O/
16O in either the sample water
(Rsample) or the Standard Mean Ocean Water
(Rstandard). We reported isotopic compositions in
the standard δ-notation (‰) as deviations from
the Vienna Standard Mean Ocean Water standard
(V-SMOW; Craig, 1961). The analytical error
was ±0.1‰ for δ18
O and ±1.0‰ for δD.
Groundwater samples for CFC analysis were
collected in triplicate and stored in glass bottles
sealed with metal lined caps (Busenberg and
Plummer, 1992). We analyzed the CFCs by
closed system purge and trap gas
chromatography by using an electron capture
detector (GC-8A, Shimadzu, Japan). Water
samples for CFCs were analyzed in triplicate,
and the values were reported only if the
concentrations of at least two measurements were
within 10% for concentrations above 100 pg/kg.
Below 100 pg/kg concentrations, the values were
reported only if at least two measurements were
within 20 pg/kg of each other (Johnston et al.,
1998). The analytical uncertainty associated with
CFC analysis was less than 5%.
RESULTS
Groundwater potential
We obtained groundwater potential data from 30
observation wells in the study area for the period
from 1985 (oldest) to the present. The spatial
distribution of groundwater potential was
estimated on the basis of the observation well
data. Figure 2 shows the groundwater potential of
the deep aquifer for the years 1985, 1990, 1997,
2000, 2004, and 2008. In 1985, the depression
area was located in the northeast of the Jakarta
area and the groundwater potential was −15 m.
The depression area then expanded, moving
toward central Jakarta prior to moving to the
northwest of the city in 2008 when it was −25 m.
Note that the movement of the depression area
was associated with a decline in groundwater
potential, implying a disturbance in the
groundwater flow system.

Kagabu Makoto, et.al / Riset Geologi dan Pertambangan Vol. 20 No. 2 (2010), 69 -79.
72
Figure 2 Historical change in the spatial distribution of groundwater potential. Unit of the potential
is meters above sea level.
Major ions
Fig. 3 plots a Piper diagram, referring to the
concentrations of hydrogeochemical components
of groundwater samples which collected in this
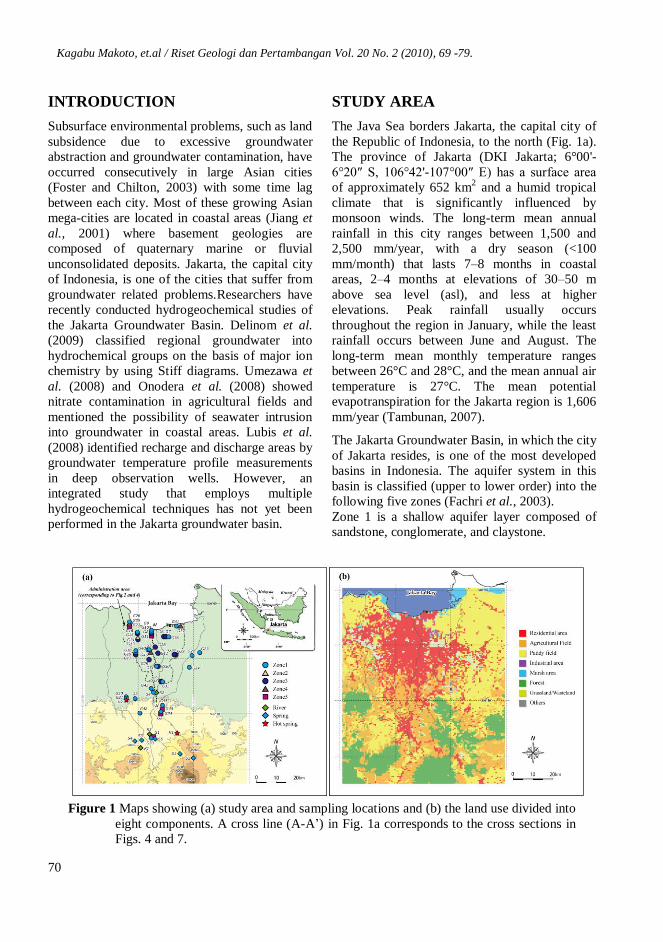
study. Figure 4 shows the distribution of the stiff
diagram along a cross section that passed through
the central Jakarta area (A-A’; Fig. 1a). The
depth of the screen at each sampling point was
projected to this cross section from the coast
along the topographical profile.
In the Piper diagram of Fig. 3, samples collected
from spring and river waters are of the Ca-HCO3-
type. Therefore, waters in upstream areas can be
recognized as those with juvenile features; they
are not much affected by human activities. Many
shallow groundwaters (zones 1 and 2) are also of
the Ca-HCO3-type. However, shallow
groundwater in the middle stream area possessed
high NO3− concentrations, as shown in Fig. 4
(G31, G35, G43, and G45), especially those
within the areas of high agricultural activity,
located between the urbanized and mountain
areas (Fig. 1b). On the other hand, the deep
groundwater (zones 3 to 5) was of the Na-HCO3-
type, as shown in Fig. 3 (Group I) and Fig. 4
(G7, G28, G30, G32, G37, G44, and G46).
However, the samples collected from the coastal
area (G8 and G10) were of the Na-Cl-type, as
shown in Fig. 3 (Group II) and Fig. 4. This type
of groundwater displayed seawater intrusion.
Samples located near the coast and slightly
further inland (G6, G11, G14, G25, and G27)
occupied an intermediate position between the
deep groundwater (Group I) and seawater
intrusion wells (Group II) (Group III, Fig. 3).
These results imply that seawater intrusion is
encroaching on inland aquifers. Though the
samples H2 and G20, located about 40 km inland
from the coast line, were also of the Na-Cl-type
(Fig. 3),

Kagabu Makoto, et.al / Riset Geologi dan Pertambangan Vol. 20 No. 2 (2010), 69 -79.
73
Figure 3 Piper diagram for the major ions.
this result may be due to the geological setting,
including the local fault system (Delinom et al.,
2009).
According to the results of the major ion
analyses, Ca-HCO3-type groundwaters mainly
recharge the aquifer in the upstream area, and
this water changes to the Na-HCO3 type as it
flows in the northern, deeper direction. This
change can be explained by the cation exchange
reaction (Na+ ↔ Ca
2+) (Appelo and Postma,
2005). A similar tendency occurs in the
groundwater flow system of the Osaka basin
(Yamanaka et al., 2005).
Bromide: chloride ratio of groundwater in
Jakarta
Bromide and chloride are particularly good
indicators of seawater intrusion, because both
these ions are chemically conserved in natural
aqueous environments. Both ions also move
freely in the subsurface. Similar Br−:Cl
− ratios in
groundwater and seawater indicate that seawater
is a source of chloride. Dissimilar ratios in
groundwater and seawater indicate that chloride
is derived, at least in part, from another chloride
source (Fetter, 1993).
We determined the nitrogen concentrations in
order to indicate the possible presence of another
chloride source in the groundwater. Nitrate and
chloride commonly occur together in
groundwater contaminated by sewage effluent.
Potential sources of sewage contamination of the
groundwater in the study area include residential
septic systems and public sewer lines.
Contamination of groundwater by nitrate from
fertilizers might also result in elevated chloride
concentrations (Richter and Kreitler, 1993).
Figure 5 plots the Br−:Cl
− ratios and
corresponding chloride concentrations. Two
trend lines are included for comparison. One is
the theoretical Br−:Cl
− ratio of seawater based on
a study by Drever (1988) (equivalent to the
Br−:Cl
− ratio in seawater). The other one is the
assumed trend line of the chloride contamination
from the anthropogenic source based on the
study by Andreasen and Fleck (1997).
Kagabu Makoto, et.al / Riset Geologi dan Pertambangan Vol. 20 No. 2 (2010), 69 -79.
74
Figure 4 Vertical distribution of the stiff diagram along a cross sections shown in Fig. 1a.
This trend line represents the native groundwater
affected by an anthropogenic chloride source.
Also plotted in the figure, the NO3− concentration
(mg/L) shows the potential contamination.
The Br−:Cl
− ratios were similar to the seawater
ratio with a high chloride concentration in
samples collected from the coastal area (G6, G8,
G10, G11, G13, G25, and G27). Since these
samples show the Na-HCO3 to the Na-Cl type
(Figs. 3 and 5), the seawater was the primary
source of chloride.
Shallow groundwater samples were scattered
along the anthropogenic line with high NO3−
concentrations and low Br−:Cl
− ratios. These
results support the nitrate contamination caused
by fertilizers in dry fields, reported by Umezawa
et al. (2008).
Stable isotopes
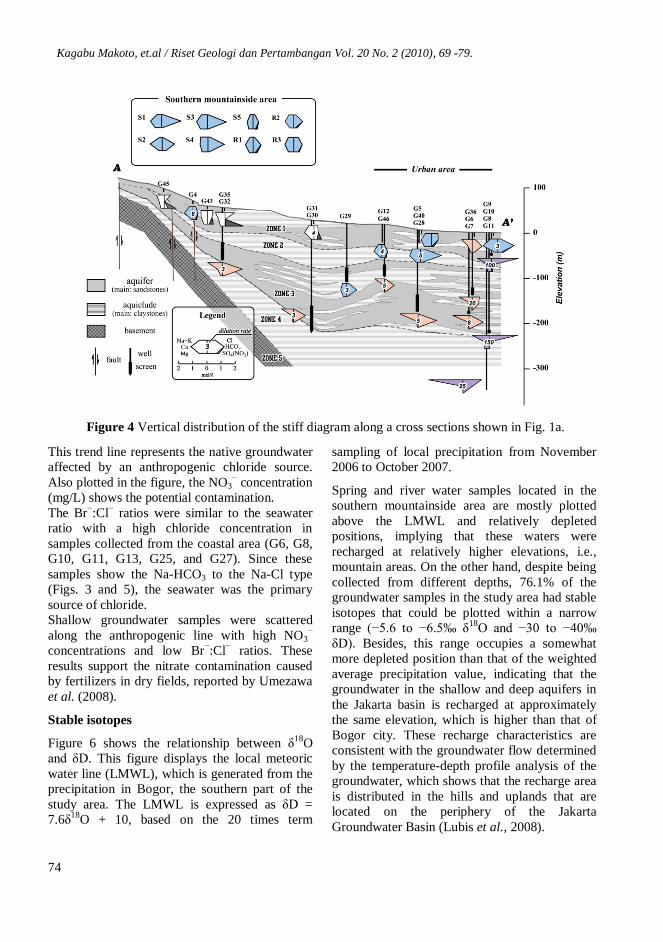
Figure 6 shows the relationship between δ18
O
and δD. This figure displays the local meteoric
water line (LMWL), which is generated from the
precipitation in Bogor, the southern part of the
study area. The LMWL is expressed as δD =
7.6δ18
O + 10, based on the 20 times term
sampling of local precipitation from November
2006 to October 2007.
Spring and river water samples located in the
southern mountainside area are mostly plotted
above the LMWL and relatively depleted
positions, implying that these waters were
recharged at relatively higher elevations, i.e.,
mountain areas. On the other hand, despite being
collected from different depths, 76.1% of the
groundwater samples in the study area had stable
isotopes that could be plotted within a narrow
range (−5.6 to −6.5‰ δ18
O and −30 to −40‰
δD). Besides, this range occupies a somewhat
more depleted position than that of the weighted
average precipitation value, indicating that the
groundwater in the shallow and deep aquifers in
the Jakarta basin is recharged at approximately
the same elevation, which is higher than that of
Bogor city. These recharge characteristics are
consistent with the groundwater flow determined
by the temperature-depth profile analysis of the
groundwater, which shows that the recharge area
is distributed in the hills and uplands that are
located on the periphery of the Jakarta
Groundwater Basin (Lubis et al., 2008).

Kagabu Makoto, et.al / Riset Geologi dan Pertambangan Vol. 20 No. 2 (2010), 69 -79.
75
Figure 5 Relationship between the Br−:Cl
− ratios and the Cl
− and NO3
− concentrations.
CFC-12 concentration
CFCs are useful tools for tracing and dating post-
1945 groundwater (Busenberg and Plummer,
1992; Plummer et al., 2000; Plummer et al.,
2001). We, therefore, employed CFCs as a
marker for young groundwater, because the
release of CFCs into the atmosphere only started
after the 1940s (USGS, 2010). Consequently, if
groundwater possesses some dissolved CFCs, it
was recharged after the 1940s. In this study, we
used CFC-12 because of its stability in the
subsurface environment (Plummer et al., 1998).
Figure 7 shows the distribution of CFC-12
(mg/L) along the cross section. Since the shallow
groundwater (Zone 1) showed a large CFC-12
concentration, it can be considered modern
(young) and was recharged after the 1940s. On
the other hand, the deep groundwater (zones 3
and 5) had low concentrations, and some wells
possessed concentrations below the detection
limit. However, because some deep groundwater
samples collected from under the urban area (G6,
G8, and G28) somehow possessed CFC-12
concentrations, the shallow (young) groundwater
and/or present seawater component might be
introduced into the deeper aquifer. The driving
force of this forced groundwater movement is the
excessive groundwater pumping in the central
urban area, corresponding to the rapid
urbanization.
DISCUSSION
According to the results of the stable isotope
analyses (Fig. 6), almost all groundwater in the
Jakarta plain was recharged at similar surface
elevations. Subsequent to recharging,
groundwater flow is divided into two major
aquifers: shallow and deep, confirmed by the
stratification of the local geology.
Kagabu Makoto, et.al / Riset Geologi dan Pertambangan Vol. 20 No. 2 (2010), 69 -79.
76
Figure 6 Relationship between δ18
O and δD in all water samples.
Although the river water and many shallow
groundwater samples displayed Ca-HCO3-type
water chemistry, the shallow groundwater in the
southern area’s dry field showed clear nitrate
contamination, which is mostly due to artificial
fertilizers, including agrochemicals, from
agricultural activities. Umezawa et al. (2008)
confirmed via stable N and O isotopes in NO3−
that the nitrate contamination in this area is
caused by the application of fertilizers and by
household effluents. According to these results,
we can assume that most parts of the Cl− and
SO42−
proportions in the Piper diagram are due to
the agricultural activities utilizing excessive
fertilizers, agrochemicals, and, to a lesser degree,
household effluents.
The Br−:Cl
− ratios versus the chloride and NO3
−
concentrations (Fig. 5) demonstrated that the
shallow groundwater deviated from the Br/Cl’s
seawater mixing line with a relatively high NO3−
concentration. It affected the nitrate
contamination caused by fertilizers in dry fields,
and both the Br− and Cl
− ions probably come
from fertilizers. However, seawater is the
primary source of chloride in the groundwater
samples collected from the coastal area. These
results are consistent with the groundwater
samples collected from the coastal area (G8 and
G10), which displayed Na-Cl-type water
chemistry with high dissolved ion concentrations.
Because the CFC-12 concentration in some
groundwater samples was greater than that of the
past CFC concentrations in the Northern

Kagabu Makoto, et.al / Riset Geologi dan Pertambangan Vol. 20 No. 2 (2010), 69 -79.
77
Figure 7 Vertical distribution of CFC-12 concentrations along a cross sections shown in Fig. 1a.
Hemisphere’s atmosphere, which is
contaminated, we could not evaluate the exact
residence time of the groundwater. However,
since CFC-12 was detected in the shallow
groundwater, it was recharged after the 1940s.
Deep groundwater had Na-HCO3-type water
chemistry, suggesting that the chemical evolution
during the groundwater flow process changed
from the original Ca-HCO3-type shallow water
chemistry, indicating that it had a relatively long
residence time than the shallower groundwater.
This result is consistent with the CFC-12
contents; CFC-12 concentration in the deep
groundwater was near or lower than the detection
limit, implying that it was at least older than the
1940s. However, we found somewhat high CFC-
12 concentrations in some deep groundwater
samples, mostly collected under the well
developed urban area (G6, G8, and G28) where
the groundwater depression zone is located (Fig.
7), implying that the young groundwater
component intruded from the shallow aquifer or
that seawater was present due to excessive
pumping of groundwater in the urban area.
CONCLUSION
We studied the groundwater characteristics in the
Jakarta area by hydrogeochemical techniques
such as stable isotopes (δD and δ18
O), water
chemistry by major ions, Br−:Cl
− ratio, and CFC
analyses.
In the Jakarta area, although hydrogeochemical
characteristics showed various water chemistries
depending on the aquifer depths, almost all
(shallow and deep) groundwater samples
recharged at similar elevations. In the shallow
groundwater, groundwater samples were
characterized by Ca-HCO3-type water chemistry,
but some groundwater samples collected near dry
agricultural fields displayed nitrate
contamination related to the agricultural
activities. This finding was supported by both
stable N and O isotope content in NO3−
(Umezawa et al., 2008) and the Br−:Cl
− ratios in
the groundwater samples. On the other hand, the
deep groundwater samples had Na-HCO3-type
water chemistry, influenced by cation exchange
during its flowing process in the aquifer.
However, the groundwater collected from the
coastal area had Na-Cl-type water chemistry and

Kagabu Makoto, et.al / Riset Geologi dan Pertambangan Vol. 20 No. 2 (2010), 69 -79.
78
was affected by seawater intrusion, caused by
over pumping in the urban area. This result was
also supported by the Br−:Cl
− ratio, shown along
the mixing line with sea water.
The difference in hydrogeochemistry between
shallow and deep groundwater samples implied a
difference in the relative residence times of their
respective groundwaters, and this result was
supported by the results of the CFC-12 analyses.
Concentrations of CFC-12 were higher (and,
thus, the groundwater was younger) in the
shallow aquifer while lower (and older) in the
deep aquifer.
Even in the deep aquifer, we detected CFC-12
particularly under the urban area where the
groundwater potential depression zone is located,
suggesting that the recent shallow, younger
groundwater intruded into the deeper aquifer
because of excessive groundwater pumping,
corresponding with rapid urbanization.
This study clearly reveals the groundwater
characteristics of the Jakarta area by integrating
several hydrogeochemical components. Since the
excessive groundwater pumping disturbs the
subsurface environment, including the
groundwater mixing of the shallow and deep
aquifers and seawater intrusion in the coastal
area, it is necessary to construct frameworks for
the management of local groundwater resources,
including pumping regulations and effective
artificial recharge for the groundwater aquifer.
ACKNOWLEDGMENT
We thank the staff of the Indonesia Institute of
Sciences (LIPI) for sampling. This research was
funded by the project “Human Impacts on Urban
Subsurface Environment,” Research Institute for
Humanity and Nature (RIHN).
REFERENCES
Andreasen D. C. and Fleck W. B. (1997) Use of
Bromide:Chloride Ratios to Differentiate
Potential Sources of Chloride in a Shallow,
Unconfined Aquifer Affected by Brackish-
Water Intrusion. Hydrogeology Journal, 5,
2, 17–26.
Appelo C. A. J. and Postma D. (2005) Ion
exchange. In: Appelo C.A.J., Postma D.,
editors. Geochemistry, groundwater and
pollution. AA Balkema Publishers, Leiden,
241–309.
Busenberg E. and Plummer L. N. (1992) Use of
chlorofluorocarbons (CCl3F and CCl2F2)
as hydrologic tracers and age-dating tools:
the alluvium and terrace system of central
Oklahoma. Water Resour. Res., 28, 2257–
2283.
Craig H. (1961) Isotope variations in meteoric
waters. Science, 133, 1702-1703.
Delinom R. M. (2008) Groundwater management
issues in the Greater Jakarta area,
Indonesia. Proceedings of International
Workshop on Integrated Watershed
Management for Sustainable Water Use in
h Humid Tropical Region, JSPS-DGHE
Joint Research Project, 8, 40–54.
Delinom R. M., Hasanuddin Z. A., Makoto T.,
Dadan S., Rachmat F. L., Eko Y. (2009)
The contribution of human activities to
subsurface environment degradation in
Greater Jakarta Area, Indonesia. Science of
the Total Environment, 407, 3129–3141.
doi:10.1016/j.scitotenv.2008.10.003.
Drever J. I. (1988) The Geochemistry of Natural
Waters, second ed. Prentice Hall, Inc.
Fachri M., Djuhaeni, L. M. Hutasoit and A. M.
Ramdhan (2003) Stratigraphy and
hydrostratigraphy in Jakarta groundwater
basin (in Indonesian). Bulletin Geologi
Bandung Insitute of Technology, 34, 169–
189.
Fetter C. W. (1993) Contaminant hydrogeology.
New York, Macmillan Publishing Co.,
458p.
Foster S. S. D., Chlton P. J. (2003) Groundwater:
the process and global significance of
aquifer degradation. Philosophical
Transactions of the Royal Society of
London Series B-Biological Sciences, 358,
1957–1972.
Jiang Y., Kirkman H., and Hua A. (2001)
Megacity development: managing impacts
on marine environments. Ocean and
Coastal Management, 44, 293–318.

Kagabu Makoto, et.al / Riset Geologi dan Pertambangan Vol. 20 No. 2 (2010), 69 -79.
79
Johnston, C.T., Cook, P.G., Frape, S.K.,
Plummer, L.N., Bisenberg, E., Blackport,
R.J., 1998, Groundwater age and nitrate
distribution within a glacial aquifer beneath
a thick unsaturated zone ,Ground Water 36,
171 – 180.
Lubis R. F., Sakura Y., and Delinom R. M.
(2008) Groundwater recharge and
discharge processes in the Jakarta
groundwater basin, Indonesia.
Hydrogeology Journal, 16, 927–938.
Onodera S., Saito M., Sawano M., Hosono T.,
Taniguchi M., Shimada J., Umezawa Y.,
Lubis R. F., Buapeng S., and Delinom R.
(2008) Effects of intensive urbanization on
the intrusion of shallow groundwater into
deep groundwater: Examples from
Bangkok and Jakarta. Science of the Total
Environment, 404, 401–410.
Plummer, L.N., Busenberg, E., Drenkard, S.,
Schlosser, P., McConnell, J.B., Michel,
R.L, 1998. Flow of river water into karstic
limestone aquifer-2. Dating the young
fraction in groundwater mixture in the
upper Floridan aquifer near Valdosta,
Georgia, Applied Geochemistry 13, 1017-
1043
Plummer, LN., Rupert , M.G., Busenberg, E.,
Schlosser, P., 200. Age of irrigation water
in ground water from the Eastern Snake
River plain aquifer, South-Central Idaho,
Groundwater 38, 264-283.
Plummer, L.N., Busenberg, E., Böhlke,
J.K.,Nelms, D.L., Michel, R.L.,Schlosser.
P.,2001. Groundwater residence times in
Shenandoah National Park, Blue Ridge
Mountains, Virginia, USA: a multi-tracer
approac. Chemical Geology 179,93-111
Richter B. C., Kreitler C. W. (1993)
Geochemical techniques for identifying
sources of ground-water salinization. Boca
Raton, FL, C. K. Smoley, 258p.
Tambunan M. P. (2007) Flooding area in the
Jakarta province on February 2 to 4 2007.
Proceedings of Asian Association on
Remote Sensing (ACRS) 2007.
Umezawa Y., Hosono T., Onodera S., Siringan
F., Buapeng S., Delinom R., Yoshimizu C.,
Tayasu I., Nagata T., and Taniguchi M.
(2008) The source and mechanisms
controlling nitrate and ammonium
contaminations in groundwater at
developing Asian-Mega cities, Metro
Manila, Bangkok and Jakarta. Science of
the Total Environment, 407, 3219–3231.
USGS,2010. The Reston Chlorofluorocarbon
laboratory. (http://water.usgs.gov/lab
/software /air_curve/)
Yamanaka M., Nakano T., and Tase N. (2005)
Hydrogeochemical evolution of confined
groundwater in northeastern Osaka Basin,
Japan: estimation of confined groundwater
flux based on a cation exchange mass
balance method. Applied Geochemistry,
20, 295–316.