groundwater investigations with electrical …rabia dars e-mail: [email protected] oct-25 siem...
TRANSCRIPT
SWAT-2019 GROUNDWATER INVESTIGATIONS WITH ELECTRICAL RESISTIVITY
IN DISTRICT MATIARI, PAKISTAN
Presenter:
RABIA DARSE-mail: [email protected]
Oct-25 Siem Reap, CambodiaAuthors: Rabia Dars,Abdul Latif Qureshi, Jianhua Ping, Shafi Muhammad Kori, Hafiz Abdul Salam,
SWAT-Conference ( Research Scholar Department of Hydrology and Water Resources Engineering )
OUTLINES:
• Introduction
• Problem Statement
• Literature
• Objectives
• Material and Method
• Results & Discussion
• Conclusion & Recommendation
• References

INTRODUCTION • Water is a gift of nature and in a bounteous proportion, noticeable by its presence (surface, rain, glacier
and underground).
• Pakistan is facing severe crises of water deficiency due to increasing population and rapid urbanization,
consequently more food and fiber is needed, and required water management for agriculture.
• Groundwater an important alternate resource which is used as supplement for drinking purpose for both
urban and rural communities
• The geophysical survey such as Electrical Resistivity Survey (ERS) may be employed for groundwater
exploration. The use of ERS to assess aquifer thickness and groundwater quality has been increased all
over the world
• Present water shortage is one of the primary world issues, and according to climate change projections, it
will be more critical in the future.

PROBLEM STATEMENT:
• The process of urbanization often causes changes in groundwater levels
• As a result, issues relative to ground water are often seemingly less dire than
issues related to surface water alone.

REVIEW LITERATURE
AUTHORS NAMES YEARS DESCRIPTION
Sikandar.p 2010 performed VES to locate low salinity
groundwater aquifer layers for tube
well installation, tube well auditing
and categorize different low salinity
groundwater zones
Khan et al. 2013 has conducted resistivity survey in
Peshawar for investigating
groundwater using Terrameter SAS
4000.
Majumdar and Das 2011 used ERS to estimate the aquifer
properties of Sager Island Region in
India, where they observed that the
results correlated significantly with
borehole data from the area
Bhoi et al 2012 concluded that Vertical Electrical
Sounding (VES) is the most widely
used geophysical technique for
subsurface exploration.

OBJECTIVES:
1. Demarcation and mapping of groundwater quality in the study area using Resistivity Survey and
Arc GIS. .
2. To conduct a survey for groundwater utilization and socio-economy parameters of farming
community and to suggest recommendations for sustainable management in the study area.

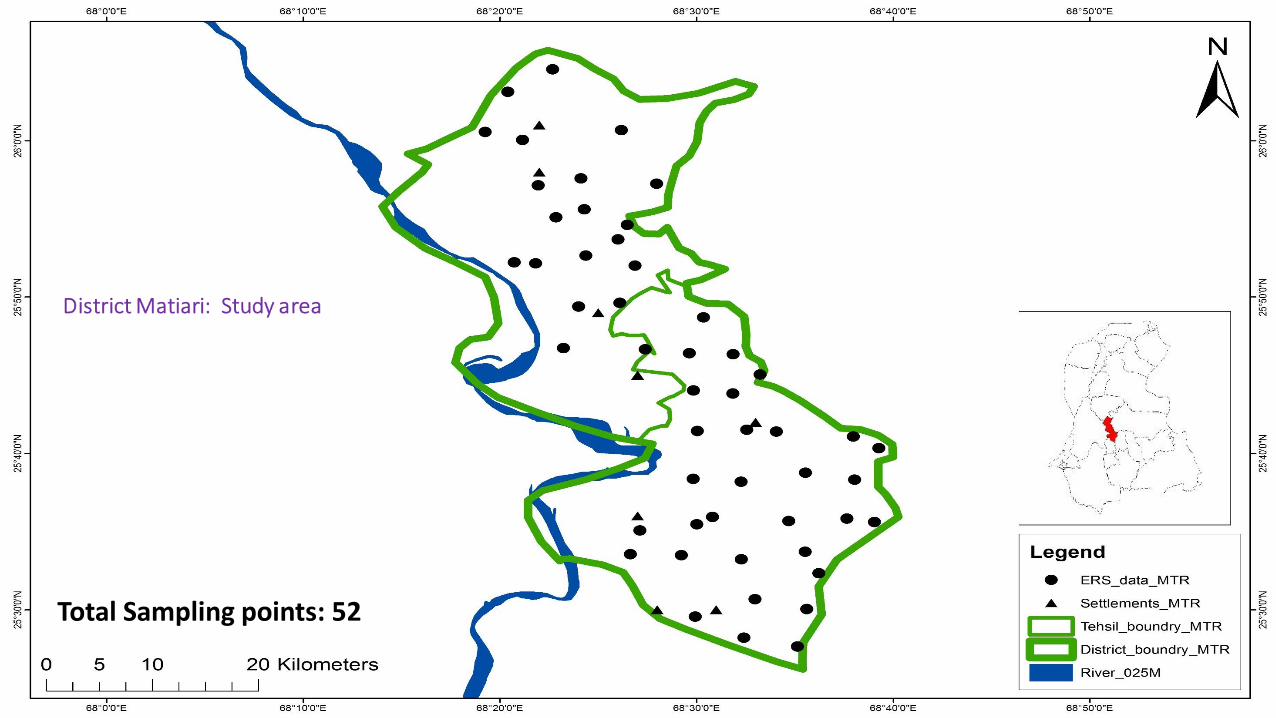
District Matiari: Study area
Total Sampling points: 52

• Instrument Used: Geo-electrical Vertical Electrical Sounding (VES) using ABEM Terrameter 1000
was used to investigate aquifer details and its groundwater quality through various lithological layers.
• ABEM 1000 Terrameter usually comes with self-rechargeable battery, four electrodes, cables,
hammer, crocodile clips and measuring tapes.
• Terrameter gives direct reading and then multiplied with corresponding geometrical factor to get
apparent resistivity.
• Resistivity survey was conducted at 5x5 km2 grids for shallow survey up to the depth of 300 meters
•


• Electrical resistivity Survey (ERS) involves passing an electrical current into the ground through
two current electrodes and the resulting potentials created in the field, measured through two
potential electrodes.
• The two outer electrodes A and B are used for the current, and the resulting potential difference is
measured across the two inner electrodes M and N. The distance of the current and potential
electrodes from the center, which are referred to AB/2 and MN/2 respectively.
• Source: O. Anomohanran (2015)
Geometric Arrangement of the Schlumberger Array Configuration

Electrical Resistivty Survey (ERS) Survey Points
Total 52 ERS Grids was selected from the marked locations in August 2016. The Taluka wise detailof surveyed ERS is given as under.
Groundwater Sample collection (Hand pumps, tube well ):
Groundwater samples from hand pump or tube well were collected from the remote areas which are quite far away from the ERS surveyed area. These samples were analysis for analyzed for only TDS .
Taluka-wise detail of Electrical Resistivity Survey ERS.
Sr. No Name of Taluka No of ERS
1 Saeedabad 12
2 Hala 17
3 Matiari 23
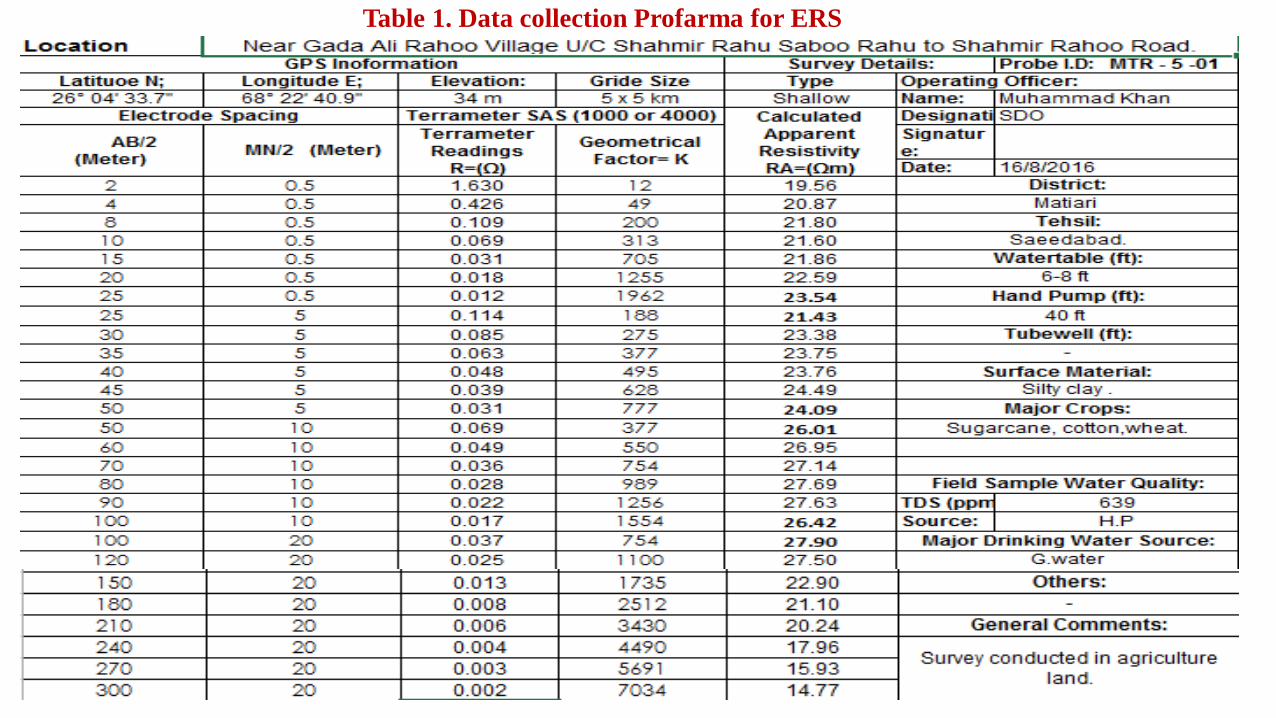
Table 1. Data collection Profarma for ERS

IX1D view
Source : Interpex is a software company dedicated to the production of high quality software for the processing, interpretation and display of geophysical data.

The correlation between Resistivity with Geological Formation and Water Content Quality
Name of Resistivity
Zone Resistivity
(Ohm-m)
Correlation with Geological Formation and Water Content
Quality
Low <10
This zone indicates the presence of fine materials like clay/shale, with rare
sand and therefore has saline to less saline water bearing potential.
Medium 10-30
This zone indicates the presence of intermediate sand with some clay. It
may also indicate the presence of alternate bedding of sand and
clay/shale. The formation can yield groundwater if below water table.
High 30-100This zone is interpreted as dominance of coarser material i.e., sand with
good quality of groundwater
Very High>100
The very high resistivity may represent the presence of unsaturated zone
above water table and bed rock if below water table.
This survey includes following parameters
• Educational status
• Land status of farmers
• Ground water Quality
• Usage of ground water for satisfaction within study area
• Groundwater extraction technique
• Usage of ground water for irrigation purpose


ERS -02: (Near Haji Ahmad waris ) created in IX1D resistivity software
1 layer- HR and 2 layers –MR ( Fresh, and marginal fresh water)
• The first layer shows the dominance of coarse material comprising the fresh water.
• The second layer represent the alternative bedding of sand and clay , having marginal fresh water
• The third layer shows low resistivity i.e. 12 ohm.m, which indicate marginal saline water
RESULTS AND DISCUSSION
LR = Low Resistivity Zone; MR = Medium Resistivity Zone; and HR = High Resistivity Zone

ERS -12: Near Kamla village created in IX1D resistivity software
• In this probe very low resistivity values found through out the investigation depth (300 m) presenting the
presence of fine materials like clay/shale with rare sand comprising highly saline water.
3 layers- LR (means saline water at all layers )
LR = Low Resistivity Zone; MR = Medium Resistivity Zone; and HR = High Resistivity Zone
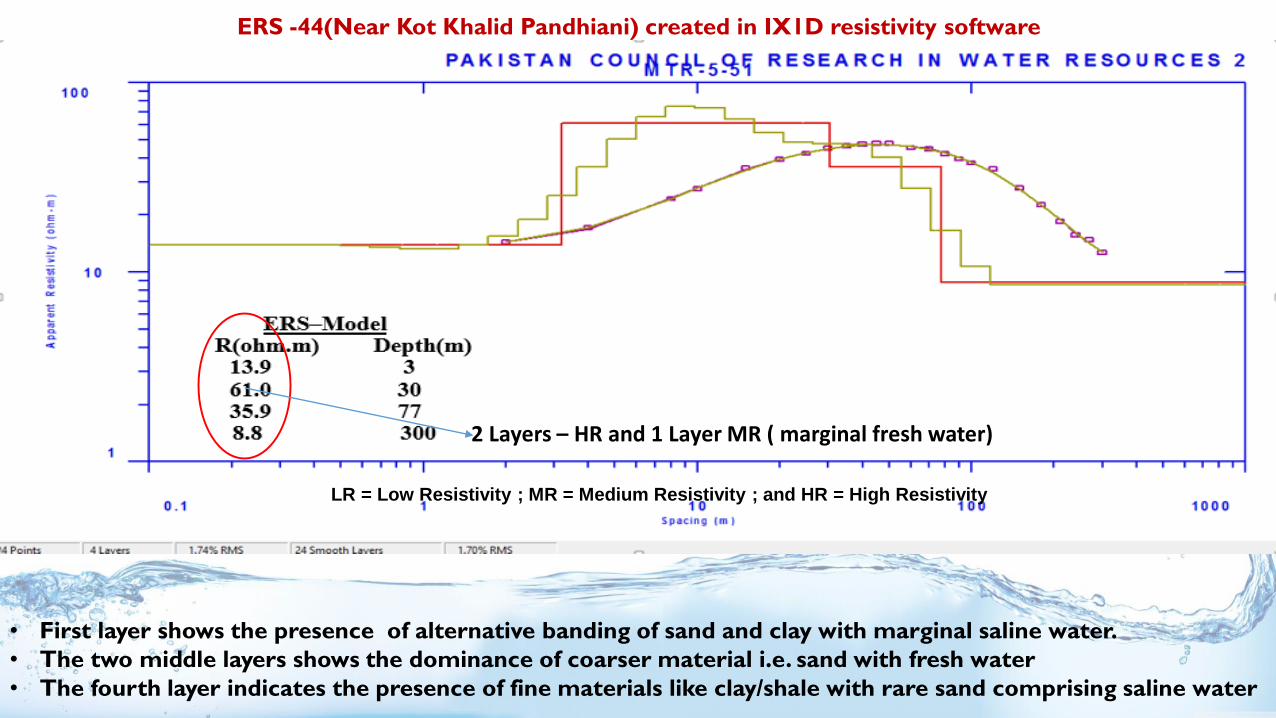
ERS -44(Near Kot Khalid Pandhiani) created in IX1D resistivity software
2 Layers – HR and 1 Layer MR ( marginal fresh water)
• First layer shows the presence of alternative banding of sand and clay with marginal saline water.
• The two middle layers shows the dominance of coarser material i.e. sand with fresh water
• The fourth layer indicates the presence of fine materials like clay/shale with rare sand comprising saline water
LR = Low Resistivity ; MR = Medium Resistivity ; and HR = High Resistivity

VES -17: Near Sultan Farash created in IX1D resistivity software
2 Layers – HR and 1 Layer MR (fresh water)
• The top two layer shows the presence of courser material with possibility of fresh water. The Third
layer indicates that upto the investigation depth (300m) quality of groundwater is marginal saline
LR = Low Resistivity ; MR = Medium Resistivity ; and HR = High Resistivity
ERS -17: Near Sultan Farash

This figure Shows the ground water
EC of District Matiari. The quality of
ground water of tehsil Matiari is fresh
up to depth of 25m. Whereas, the
ground water quality of tehsil
Saeedabad and Hala found marginal
fresh.
EC of Ground water at the depth of 25m.

• The quality of ground
water of tehsil Matiari
is marginal Fresh up
to depth of 75m
similarly the ground
water quality of tehsil
Saeedabad and Hala
priming the marginal
saline water pockets.
EC of Ground water at the depth of 75m

EC of Ground water at the depth of 300m.
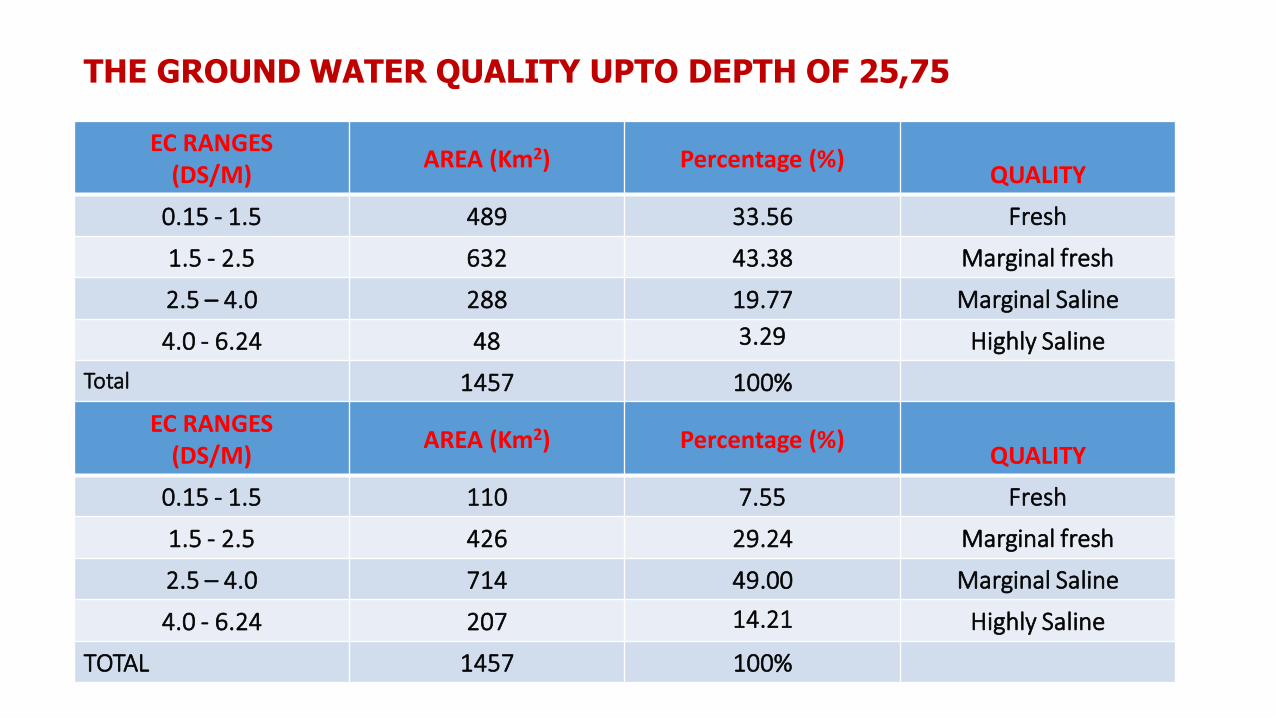
THE GROUND WATER QUALITY UPTO DEPTH OF 25,75
EC RANGES(DS/M)
AREA (Km2) Percentage (%)QUALITY
0.15 - 1.5 489 33.56 Fresh
1.5 - 2.5 632 43.38 Marginal fresh
2.5 – 4.0 288 19.77 Marginal Saline
4.0 - 6.24 48 3.29 Highly Saline
Total 1457 100%
EC RANGES(DS/M)
AREA (Km2) Percentage (%)QUALITY
0.15 - 1.5 110 7.55 Fresh
1.5 - 2.5 426 29.24 Marginal fresh
2.5 – 4.0 714 49.00 Marginal Saline
4.0 - 6.24 207 14.21 Highly Saline
TOTAL 1457 100%

THE GROUND WATER QUALITY UPTO DEPTH OF 300m
EC RANGES(DS/M)
AREA (Km2) Percentage (%)QUALITY
0.15 - 1.5 0.0 0.0 Fresh
1.5 - 2.5 2 0.14 Marginal fresh
2.5 – 4.0 218 14.96 Marginal Saline
4.0 - 6.24 1237 84.90 Highly Saline
TOTAL 1457 100%

SOCIAL SURVEY

47.8 45.5
19.0
36.36
43.5
27.3
66.7
49.09
8.7
27.3
14.3 14.55
0.0
10.0
20.0
30.0
40.0
50.0
60.0
70.0
Taluka Matiari Taluka Hala Taluka Saeedabad Overall
Pe
rce
nta
ge (
%)
Illiterate Primary Graduate
• A questionnaire survey of the 55 respondents has been conducted form February to March 2017.
• Shows that 49% farmers got primary education, 36.3% are illiterate and 14.5% are graduates, .

LAND STATUS
• The questionnaire survey regarding the land holding statistics of the District Matiari indicates that about
58% farmers are shareholders, the tenant are 1.8% and the real owner are 40%, respectively.
Taluka wise Status of farmers in terms of land holding
43.5 45.5
33.340.0
56.5 54.561.9
58.2
0 04.8 1.8
0.0
10.0
20.0
30.0
40.0
50.0
60.0
70.0
Taluka Matiari Taluka Hala TalukaSaeedabad
Overall
Perc
enta
ge (
%)
Owner Shareholder Tenant

GROUND WATER QUALITY
Based on the respondents interviews, it was observed that 61.8% is good quality ground water, and used for
drinking purpose, whereas 36.4% is marginal and 1.8% is hazardous.
56.5 54.5
71.4
61.8
39.145.5
28.636.4
4.30 0 1.8
0.0
10.0
20.0
30.0
40.0
50.0
60.0
70.0
80.0
Taluka Matiari Taluka Hala Taluka Saeedabad Overall
Pe
rce
nta
ge (
%)
Good Marginal
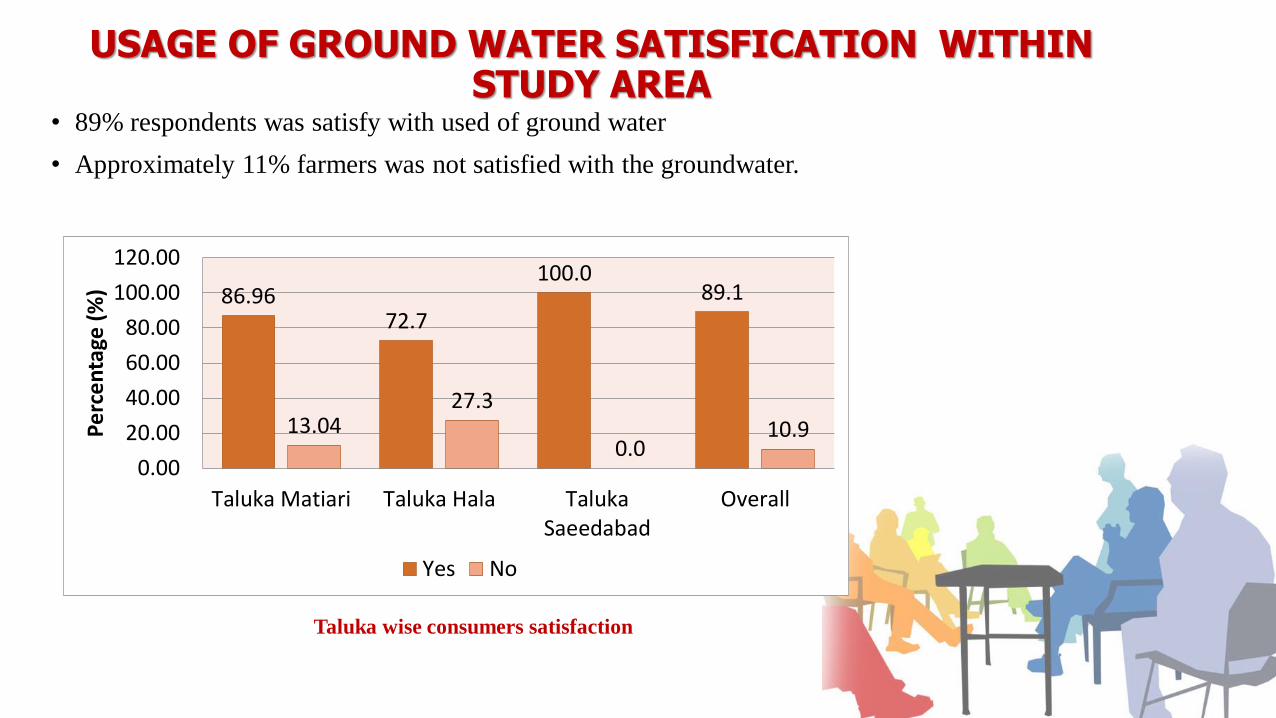
USAGE OF GROUND WATER SATISFICATION WITHIN STUDY AREA
• 89% respondents was satisfy with used of ground water
• Approximately 11% farmers was not satisfied with the groundwater.
Taluka wise consumers satisfaction
86.9672.7
100.089.1
13.0427.3
0.010.9
0.00
20.00
40.00
60.00
80.00
100.00
120.00
Taluka Matiari Taluka Hala TalukaSaeedabad
Overall
Pe
rce
nta
ge (
%)
Yes No

GROUND WATER EXTRACTION TECHNIQUES
• The questionnaire based survey revealed that 52.7% farmers use hand pumps
• Whereas 7.3% used tube well,
• While 40% respondents use both hand pump & tube well.
Overall and Taluka wise percentage of ground water extraction techniques
43.5
27.3
76.2
52.7
17.4
0 07.3
39.1
72.7
23.81
40.0
0.0
20.0
40.0
60.0
80.0
Taluka Matiari Taluka Hala TalukaSaeedabad
Overall
Pe
rce
nta
ge (
%)
Hand pump Dug well Tube well H.P or T.W

Usage of water for irrigation purpose
• The results illustrated that 61.8% o farmers used surface water,
• only 20% of the respondents voted for moderately supplied surface water plus ground water
• 18.2% used ground water for the agriculture purpose,
Figure 4.71 Taluka wise Usage of water for irrigation purpose
39.1 36.4
100.0
61.8
21.7
45.5
0.0
18.2
39.1
18.2
0
20.0
0.0
20.0
40.0
60.0
80.0
100.0
120.0
Taluka Matiari Taluka Hala Taluka Saeedabad Overall
Pe
rce
nta
ge (
%)
S.W G.W S.w+G.W

• The quality of ground water of Tehsil Matiari is fresh up to depth of 25m. Whereas, the ground water quality
of tehsil Saeedabad and Hala found marginal fresh. It was observed that the areas which are far away from
river showing the marginal fresh to marginal saline quality of ground water.
• The over all dominant quality of ground water of tehsil Matiari, Hala and Saeedabad up to depth of 50 m
found marginal fresh, whereas trend of groundwater quality from 51 to 100 m depth found marginal saline
• Socio questionnaire survey of the 52 respondents shows that 49% farmers got primary education, 36.3% are
illiterate and 14.5% are graduates, .
• Through survey it was observed that 61.8% is good quality ground water and used for drinking purpose,
whereas 36.4% is marginal and 1.8% is hazardous.
• The land holding statistics of the District Matiari indicates that about 58% farmers are shareholders, the
tenant are 1.8% and the real owner are 40%
• Survey shows that the 92.7% respondents use the ground water for drinking purpose 38.27% used for
agriculture purpose.

• Hydrological models are useful tools to analyze for present and future conditions of water quantity and
quality. SWAT model is a semi-distributed, eco-hydrological model which is quite flexible and can be
integrated with ArcGIS it is capable running on a daily time step and enable effectively stimulating
hydrological process.
• It is recommended that water quality analysis by ERS-IX1D should be analysed by ArcSWAT and results
of both tools ArcSWAT and ERS-IX1D should be compared.
• SWAT is an advantageous way meeting the requirements of the more Researchers, deterministic in
structure, In Additions, SWAT model with a modified groundwater module could be better represent the
groundwater flow behaviors.
• In Addition, SWAT–MODFLOW also capable of simulating a spatial-temporal distribution of
groundwater recharge rates, aquifer evapotranspiration and groundwater levels.

• Such study must be carried on trial bores to validate VES findings.
• In addition, other parameters which are necessary to find water quality for drinking purpose must
be analyzed.
• Strength District and Tehsil administration for drinking-water quality monitoring.
• As it was observed that at shallow depth groundwater quality of District Matiari found marginal
fresh due to recharge or seepage from ponds/channels, therefore fresh water bodies/small
reservoirs may be developed for recharge of aquifer.
• The groundwater Monitoring be made practically that upcoming of saline ground water be
controlled.
• Ground water quality testing laboratories should be made at each district and also Upgrade in
terms of staff and equipment.
• Agricultural productivity can be enhanced through conjunctive use of surface and Groundwater
REFERENCES
1. Majumdar R.K, And Das D (2011), “Hydroulogical Characterization and Estimation of Aquifer Properties fromElectrical Rounding Data in Sagar Island Region”, South Asian journal of Earth Science 4(2): 60-70,2011
2. Dars,R,.2018 Demarcation Of Groundwater Quantum And Quality For Its Sustainable Management In District Matiarithesis submitted to U.S Pakistan Center for Advanced Studies in Water Faculty of Architecture and Civil EngineeringMehran University of Engineering & Technology, Jamshoro Sindh Pakistan.
3. Mahran university and engineering and technology Jamshoro Ven kateswarana, V. and Ayyanduraib, R., (2015),“Groundwater Potential Zoning in Upper Gadilam River Basin Tamil Nadu”, presented in International Conference onWater Resources, Coastal and Ocean Engineering (ICWRCOE 2015), J. Aquatic Procedia, Vol. 4, pp 1275-1282.
4. Lawrence, A. O., and Ojo, T. A., (2012), “The Use of Combined Geophysical Survey Methods for GroundwaterProspecting in a Typical Basement Complex terrain; Case Study of ado – ekiti, southwest Nigeria”, Research Journal inEngineering and Applied Sciences, vol. 1, No. 6, pp. 362-376.
5. Sirhan, A. Mohammad O., (2012), “Characterization by electrical and electromagnetic geophysical methods of theshallow hydrogeological system at Hebron (West Bank, Palestine) in a semi-arid zone”, Geoscience, vol. 344, pp 449–460.
6. Doneva, B. Delipetrov,M.(2012), “ Geo electrical measurements with terrameter SAS 1000” InternationalMultidisciplinary Scientific Geo Conference : SGEM : Surveying Geo logy & mining Ecology Management vol 2: 563-568.
7. Khan, G. D., Waheedullah, Bhatti, A. S., (2013), “Groundwater Investigation by Using Resistivity Survey in Peshawar,Pakistan”, Journal of Resources Development and Management, vol. 2, pp. 9-20.
8. Sikandar .P, 2010. Groundwater management using vertical electrical sounding survey and tube well auditing atfarmers’ fields (Doctoral dissertation, University of Agriculture, Faisalabad)
9. Ugwu, S. A. and Nwosu, J. I. 2009. Effect of Waste Dumps on Groundwater in Choba using Geophysical Method, J.

Conti….
9 .Ven kateswarana, S., and Ayyanduraiba, R. 2015. “Groundwater Potential Zoning in Upper Gadilam River Basin, TamilNadu”, International Conference on Water Resources, Coastal and Ocean Engineering. (ICWRCOE 2015) Aquatic Procedia 4:1275 – 1282.
10. Khan, G. D., Waheedullah and Bhatti, A. S., (2013), Groundwater Investigation by Using Resistivity Survey in Peshawar,Pakistan”, Journal of Resources Development and Management, 2: 9-17.
11. Lashkaripour, G.R., 2003.An investigation of ground water condition by geo-electrical resistivity method: A case study inKori aquifer, Southeast Iran.J.Spatial Hydrology, 3:1-5.
12. Lashkaripour,G .R. and M.Nakhaei, (2005) Geo electrical investigation for the assessment of ground water conditions:acasestudy. Annalsof Geophysics.48:937-944.
13. McNeill, J.D., 1980. Electrical conductivity of soils and rocks, Technical NoteTN-5, Geonics Limited, Missisauga.
14. Oseji, J.O., M.B.Asokhia and E.C.Okolie.2006. “Determination of groundwater potential in Obiaruku and environs usingsurface geoelectric sounding”, Environmentalist.26: 301-308.
15. Ugwu, S. A. and Nwosu, J. I. 2009. Effect of Waste Dumps on Groundwater in Choba using Geophysical Method, J. Appl.Sci. Environ. Manage. 13(1) 85 – 89.
16. Ako, A. O. and M. O. Olorunfemi. 1989. Geoelectric survey for groundwater in the Newer Basalts of Vom Plateau State,Nigeria.J. Mining and Geology.25 (1&2):247-450.

QUESTIONS AND SUGGESTIONS