groundwater resources in the state of são paulo (brazil ... · groundwater resources in the state...
TRANSCRIPT
Anais da Academia Brasileira de Ciências (2007) 79(1): 141-152(Annals of the Brazilian Academy of Sciences)ISSN 0001-3765www.scielo.br/aabc
Groundwater resources in the State of São Paulo (Brazil):the application of indicators
RICARDO HIRATA1, ALEXANDRA SUHOGUSOFF1 and AMÉLIA FERNANDES2
1Instituto de Geociências, Universidade de São Paulo, Rua do Lago, 562, Butantã, 05508-080 São Paulo, SP, Brasil2Instituto Geológico, Secretaria do Meio Ambiente do Estado de São Paulo
Avenida Miguel Stéfano, 3900, Á gua Funda, 04301-903 São Paulo, SP, Brasil
Manuscript received on March 3, 2005; accepted for publication on April 17, 2006;presented by ALCIDES N. SIAL
ABSTRACT
Indicators, for groundwater resources, have mostly been employed to define the present status and the degradation
tendency, regarding both quantity (under- or overexploitation) and quality (natural and anthropic contamination). This
work presents the application of indicators in order to draw a picture of the groundwater resources situation in the 22
Water Resource Management Units (WRMU) of the State of São Paulo. The seven Indicators (I1 to I7) applied provide
a general overview of groundwater dependence (I1, I2), availability (I3, I4), and quality (I5, I6, I7). Considering public
supply (Indicator 1), one observes that 9 WRMUs show high (>50% of the population supplied by groundwater), 6,
intermediate (49-25%), and 7, low (<24%) dependence on groundwater. Indicators 3 and 4 show that the resource still
presents a great potential for further abstractions in most of the WRMUs, although there is evidence of overexploitation in
the Upper Tietê, Turvo/Grande, and Pardo basins, and low availability in the Upper Tietê, Piracicaba/Capivari/Jundiai,
and Turvo/Grande. Indicator 5 (aquifer natural vulnerability) denotes that the WRMUs 2, 4, 8, 13, 14 and 18-22
(part of the recharge area of Guarani Aquifer System) need more attention mainly where large contaminant loads are
present. Indicator 6 shows the general excellent natural quality of groundwater, although it also denotes that 3 WRMUs
need special consideration due to chromium and fluoride contamination. Indicator 7 demonstrates a close relationship
between groundwater contamination occurrence and density/type of land occupation.
Key words: groundwater, São Paulo, public water supply, management, indicators.
INTRODUCTION
With a population of 37 million inhabitants (93% in
urban areas), a territory of 248209 km2, and the concen-
tration of 36% of the country GDP, São Paulo is the most
populous and economically important State of Brazil. Its
dependence on groundwater is demonstrated by the fact
that of its 645 municipalities, 70% are totally or partially
supplied by this resource.
Although groundwater resources perform such an
important role, little has been done in order to protect
them. Limited knowledge about recharge of the aquifers,
Correspondence to: Ricardo HirataE-mail: [email protected]
stored volumes, and actual exploitation precludes the
elaboration of consistent policies for the sustainable
management of this resource. Likewise, the number of
known cases of anthropic contamination is still small
when compared to the territorial occupation history. The
good natural quality of the groundwater and its abun-
dance have warranted that the overexploitation has been
restricted to some localities, although evidence of its
rapid evolution exists.
This work presents the application of indicators that
are numeric or non-numeric qualifiers. They result from
mathematic operations, involving quantitative informa-
tion originated from specific areas and time periods, and
An Acad Bras Cienc (2007) 79 (1)

142 RICARDO HIRATA, ALEXANDRA SUHOGUSOFF and AMÉLIA FERNANDES
aim at (1) describing the situation, and (2) identifying the
potentiality and constraints related to quality (natural and
anthropic contamination) and quantity of the aquifers in
those areas. They can be used as important tools of com-
munication with the policy-makers and the public in gen-
eral and, when associated with time-series and reliable
aquifer conceptual models, may be used to forecast likely
future scenarios. The application of these indicators was
useful for drawing a picture of the groundwater resources
situation in its 22 Water Resources Management Units
(WRMUs). WRMUs are operational units with a tri-
partite (State government, municipal governments and
civil society) administration (water authorities), and cor-
respond geographically to the main hydrographic basins
of the State of São Paulo.
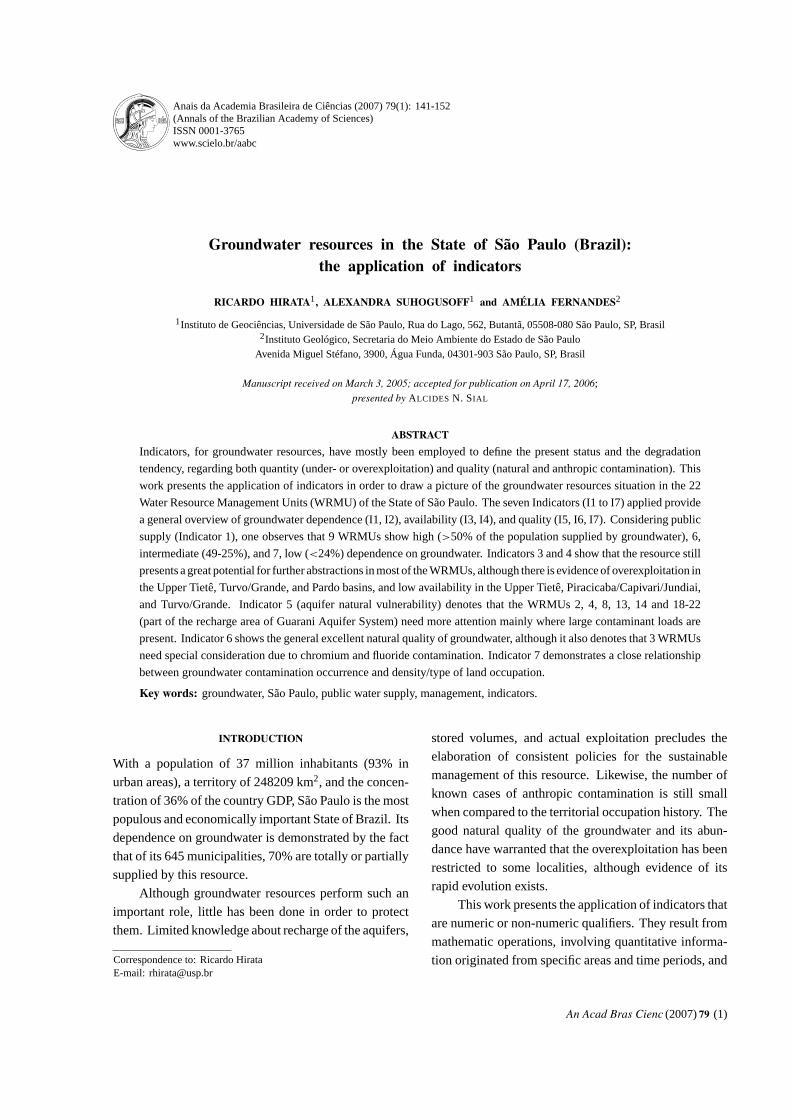
CHARACTERIZATION OF THE AQUIFER SYSTEMSOF THE STATE OF SÃO PAULO
The State of São Paulo is constituted of two hydro-
geologic provinces where the aquifer systems are in-
serted, namely: (1) the Paraná Volcano-Sedimentary
Basin, which encompasses Bauru, Serra Geral, Guarani
and Tubarão aquifer systems; and (2) the Eastern Massif
of the Southeast, which encompasses the Precambrian,
Taubaté, São Paulo and Shoreline aquifers. A short de-
scription of these aquifers can be found on Table I, and
their occurrence in the State in Figure 1.
RECHARGE AND AQUIFER POTENTIALITY
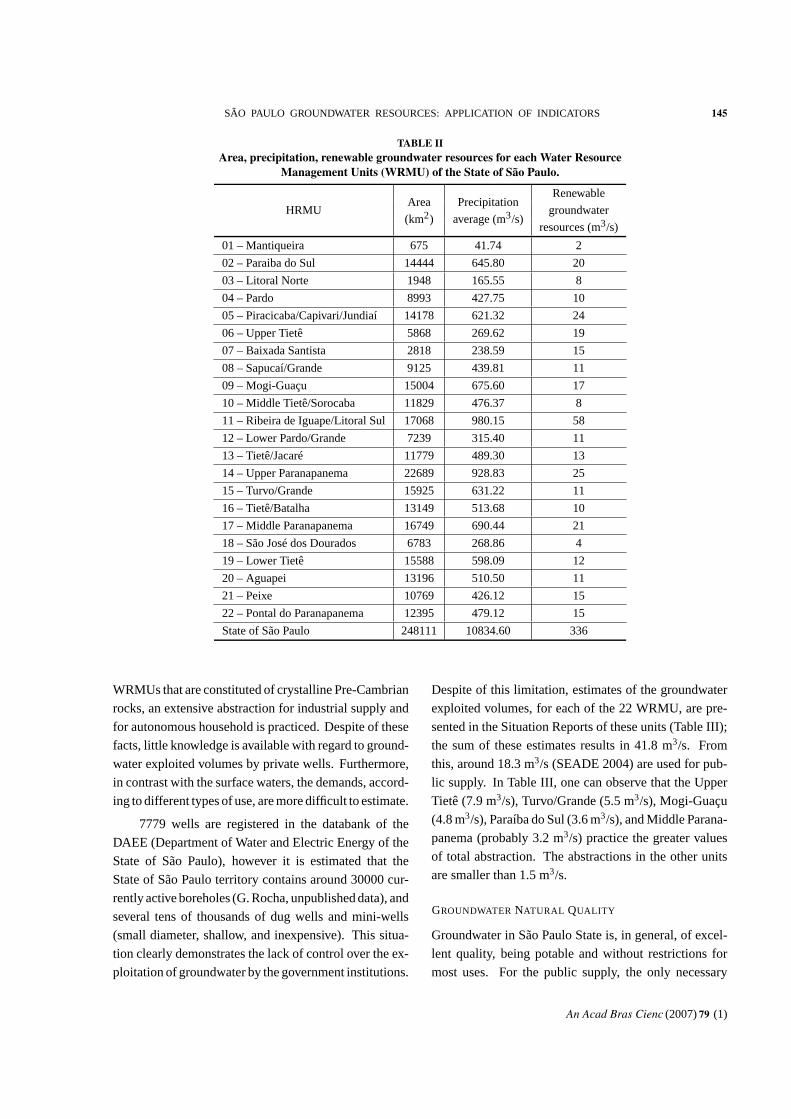
Renewable groundwater resource corresponds to the
“ exploitable groundwater reserve”, as used elsewhere,
and is herein defined as the difference between the re-
charge and the discharge that maintains the minimum
baseflow in the rivers. In other words, it consists of the
maximum discharge that can be withdrawn in a water-
shed so as to not cause negative impacts on the subsur-
face and surface water bodies. The estimates of the re-
serves, for each WRMU, can be found in the Situation
Reports of the water resources of State of São Paulo (dig-
ital technical report, unpublished data) and are depicted
in Table II. When considering these values, it is important
to consider some limitations such as: the methodology
of calculation was not the same for all 22 WRMUs, pre-
cluding a direct comparison among them; the recharge
calculation did not take into account the urbanization ef-
fects, such as the impermeabilization and the losses of
the supply and sanitation systems (excepting the case of
the WRMU 6, namely, Upper Tietê Basin). The latter is
significant in some units, for instance, in the Upper Tietê
Basin it is estimated that the no natural recharge reaches
up to 13 m3/s, being this 31% larger than the exploitation
that has been practiced in the basin.
When one considers the current knowledge of
the aquifer systems, some inconsistencies, regarding the
calculated exploitable resources (Table II), become ev-
ident. For instance, the excellent yielding achieved in
Guarani Aquifer is not compatible with the calculated
resources that are a consequence of the underestimate
of its recharge. The calculations should consider that
the recharge has probably been raised by the system-
atic and extensive pumping, at least in some municipal-
ities (Sracek and Hirata 2002). On the other hand, the
largest estimated resources of WRMU 11 (Ribeira de
Iguape/South Shoreline) seem to be disagreeable with
an aquifer system that consists mainly of crystalline Pre-
Cambrian rocks (gneisses, granites and metasedimentary
rocks), which do not allow a large rate of infiltration.
GROUNDWATER EXPLOITATION
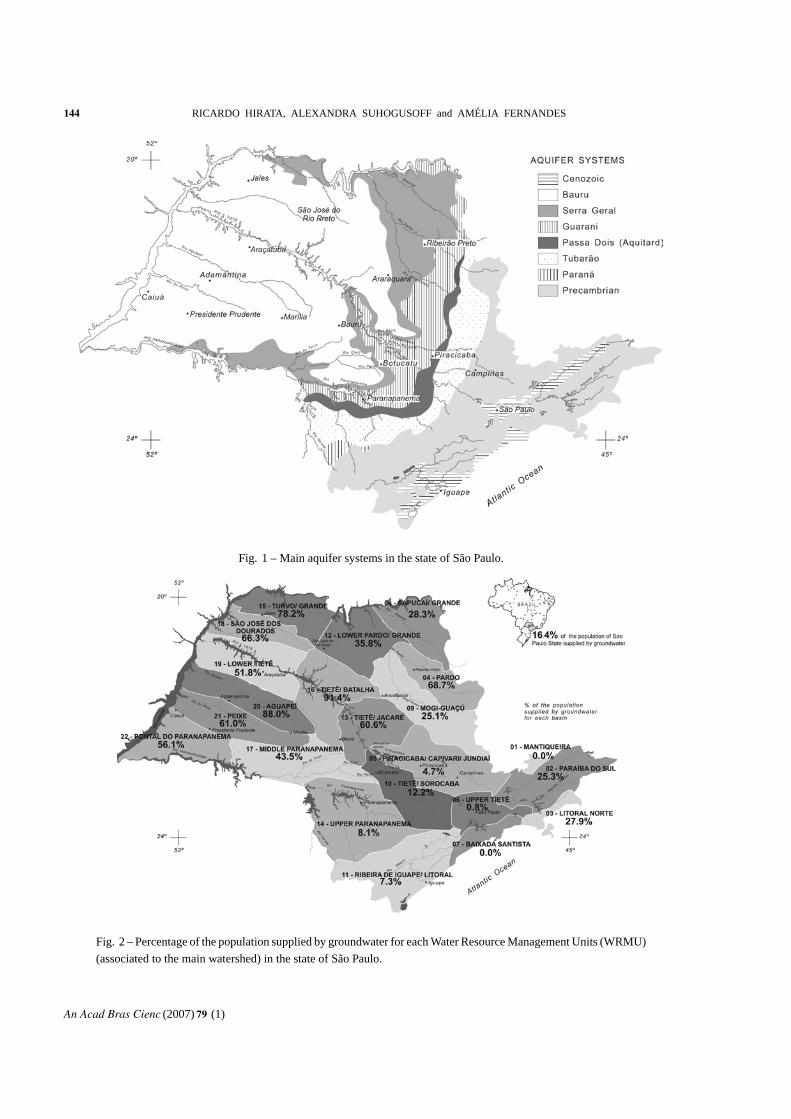
The groundwater resources play a major role for the
public water supply in the State of São Paulo. In about
50% of the municipalities, the majority concentrated in
the Northwestern portion of the State, the groundwa-
ter constitutes 75 to 100% of their water supply (Figure
2). The evaluation of the total exploited discharges for
each municipality, which were compiled from SEADE
Foundation database (http://www.seade.gov.br/, access
on 15/10/04), demonstrates that the public supply sys-
tem has exploited up to 18.3 m3/s. In the North, Cen-
tral and Western portions of the State, the abstraction
comes mainly from the Bauru Aquifer System (mainly
Adamantina and Caiuá aquifers) and, for the largest
cities, from the Guarani Aquifer System, where the well
depths may be greater than 500 m (Table III).
Some known facts, with regard to private exploita-
tion, are: the totality of the industries installed in the
Metropolitan Region of Campinas (in the WRMU 5)
own wells; the total abstraction in the Upper Tietê Basin
(WRMU 6), withdrawn by the estimated 7000 private
wells, reaches 8 m3/s (for the year of 2000); even in the
An Acad Bras Cienc (2007) 79 (1)

SÃ O PAULO GROUNDWATER RESOURCES: APPLICATION OF INDICATORS 143
TA
BL
E I
Aq
uif
er s
yst
ems
of
the
Sta
te o
f S
ão P
au
lo (
Hir
ata
et
al.
1997, m
od
ifie
d).
Aq
uif
er G
eo
metr
y
Ind
ivid
ual
Well
Yie
ld
Hyd
rau
lic P
ro
perti
es
Ch
em
ical
Pro
perti
es
Area
Av
erag
e
Th
ick
ness
D
isch
arg
e
Sp
ecif
ic
dis
ch
arg
e
Tran
smis
siv
ity
Sto
rati
vii
ty
Sali
nit
y
AQ
UIF
ER
SY
ST
EM
A
QU
IFE
R U
NIT
H
YD
RO
GE
OL
OG
IC P
RO
PE
RT
IES
(km
2)
(m)
(m3/h
) (m
3/h
/m)
(m2/d
) (a
dm
) (m
g/L
)
Qu
ater
nar
y
Gra
nu
lar,
no
t co
nti
nu
ou
s, u
nco
nfi
ned
,
het
ero
gen
eou
s, a
nis
otr
opic
--
- --
- --
- --
- --
- --
- --
-
Sh
ore
lin
e U
nco
nfi
ned
, no
t co
nti
nu
ou
s, h
eter
og
eneo
us,
anis
otr
opic
4
.60
0
10
0
3 t
o 2
0
0,1
to 3
,0
1 t
o 2
00
--
- --
-
São
Pau
lo
Lim
ited
ex
ten
sio
n,
gra
nu
lar,
un
con
fin
ed,
not
conti
nu
ou
s, h
eter
og
eneo
us,
anis
otr
opic
3
.60
0
30
0
9 t
o 1
5
0,5
to 1
,0
15
to 7
0
0.0
6
---
Cen
ozo
ic
Tau
bat
é L
imit
ed e
xte
nsi
on,
gra
nu
lar,
un
con
fin
ed t
o
sem
i-co
nfi
ned
, n
ot
con
tinu
ou
s,
het
ero
gen
eou
s, a
nis
otr
opic
2.2
00
5
00
1
5 t
o 2
00
0
,01
to 2
,0
0,5
to 1
00
0
,00
01
to 1
,0
0,0
1 t
o 1
,0
Mar
ília
Reg
ional
exte
nsi
on
, gra
nu
lar,
un
con
fin
ed t
o
sem
i-co
nfi
ned
, n
ot
con
tinu
ou
s,
het
ero
gen
eou
s, a
nis
otr
opic
---
18
0
---
---
---
---
---
Adam
anti
na
Reg
ional
exte
nsi
on
, gra
nu
lar,
un
con
fin
ed t
o
sem
i-co
nfi
ned
, n
ot
con
tinu
ou
s,
het
ero
gen
eou
s, a
nis
otr
opic
10
4.0
00
1
90
8
to 3
0
0,5
to 1
,0
30
,0 t
o 5
0,0
0
,00
01
to 0
,01
0
,1 t
o 0
,3
San
to A
nast
áci
o
Reg
ional
exte
nsi
on
, gra
nu
lar,
un
con
fin
ed t
o
sem
i-co
nfi
ned
, n
ot
con
tinu
ou
s,
het
ero
gen
eou
s, a
nis
otr
opic
---
80
--
- 1
,0 t
o 2
,0
50
,0 t
o 1
00
,0
---
0,3
to 1
,0
Bau
ru
Cai
uá
Lim
ited
ex
ten
sio
n,
gra
nu
lar,
un
con
fin
ed t
o
sem
i-co
nfi
ned
, co
nti
nu
ou
s, h
om
og
eneo
us,
isotr
opic
13
.00
0
20
0
50
to 1
50
2
,0 t
o 5
,0
10
0,0
to 2
00
,0
0,0
00
1 t
o 0
,15
<
3,0
Bas
alt
Serra G
eral
Dia
base
Lim
ited
ex
ten
sio
n,
fract
ure
d, u
nco
nfi
ned
to
sem
i-co
nfi
ned
, n
ot
co
nti
nu
ou
s,
het
ero
gen
eou
s, a
nis
otr
opic
32
.00
0
15
0
5 t
o 7
0
0,0
1 t
o 1
0,0
1
to 7
00
--
- --
-
Botu
catu
(unco
nfi
ned
port
ion)
16
.00
0
25
0
10
to 1
00
0
,03
to 1
7,0
--
- 0
,00
1 t
o 0
,2
0,2
to 4
,0
Gu
aran
i
Botu
catu
(co
nfi
ned
port
ion)
Reg
ional
exte
nsi
on
, gra
nu
lar,
un
con
fin
ed t
o
hig
hly
co
nfi
ned
, co
nti
nu
ou
s, h
om
og
eneo
us,
isotr
opic
1
36
.800
5
00
5
0 t
o 6
00
0
,01
to 2
6
70
to 1
30
0
0,0
00
00
1 t
o
0,0
00
1
0,5
to 4
,6
Aq
uit
ard
Pass
a
Do
is
Pas
sa D
ois
Reg
ional
exte
nsi
on
, gra
nu
lar,
un
con
fin
ed t
o
con
fin
ed,
het
erog
eneou
s, a
nis
otr
op
ic
(reg
ional
ly c
on
sider
ed a
s an a
qu
itar
d)
6.9
00
1
20
3
to 1
0
0,0
05
to 1
,0
---
---
---
Tu
barão
It
arar
é/A
qu
idau
ana
Reg
ional
exte
nsi
on
, gra
nu
lar
(lo
call
y
fract
ure
d),
un
con
fin
ed t
o s
emi-
con
fin
ed,
not
conti
nu
ou
s, h
eter
og
eneo
us,
anis
otr
opic
(lo
call
y n
ot
conti
nu
ou
s an
d i
sotr
opic
)
20
.70
0
1.0
00
3
to 3
0
0,0
05
to 8
,5
0,3
to 2
00
,0
0,0
00
1 t
o 0
,05
0
,00
2 t
o 0
,7
Para
ná
Fu
rnas
Lim
ited
ex
ten
sio
n,
gra
nu
lar,
un
con
fin
ed t
o
con
fin
ed,
con
tinu
ou
s, h
om
og
eneo
us
50
0
20
0
10
to 5
0
0,2
to 1
,0
---
---
---
Precam
bria
n
Pre
cam
bri
an
Reg
ional
exte
nsi
on
, fr
act
ure
d, u
nco
nfi
ned
to
sem
i-co
nfi
ned
, n
ot
con
tinu
ou
s,
het
ero
gen
eou
s, a
nis
otr
opic
53
.40
0
20
0
5 t
o 3
0
0,0
01
to 7
,0
0,1
to 2
00
,0
---
---
An Acad Bras Cienc (2007) 79 (1)
144 RICARDO HIRATA, ALEXANDRA SUHOGUSOFF and AMÉLIA FERNANDES
Fig. 1 – Main aquifer systems in the state of São Paulo.
Fig. 2 – Percentage of the population supplied by groundwater for each Water Resource Management Units (WRMU)
(associated to the main watershed) in the state of São Paulo.
An Acad Bras Cienc (2007) 79 (1)
SÃ O PAULO GROUNDWATER RESOURCES: APPLICATION OF INDICATORS 145
TABLE IIArea, precipitation, renewable groundwater resources for each Water Resource
Management Units (WRMU) of the State of São Paulo.
Renewable
HRMUArea Precipitation
groundwater(km2) average (m3/s)
resources (m3/s)
01 – Mantiqueira 675 41.74 2
02 – Paraiba do Sul 14444 645.80 20
03 – Litoral Norte 1948 165.55 8
04 – Pardo 8993 427.75 10
05 – Piracicaba/Capivari/Jundiaí 14178 621.32 24
06 – Upper Tietê 5868 269.62 19
07 – Baixada Santista 2818 238.59 15
08 – Sapucaí/Grande 9125 439.81 11
09 – Mogi-Guaçu 15004 675.60 17
10 – Middle Tietê/Sorocaba 11829 476.37 8
11 – Ribeira de Iguape/Litoral Sul 17068 980.15 58
12 – Lower Pardo/Grande 7239 315.40 11
13 – Tietê/Jacaré 11779 489.30 13
14 – Upper Paranapanema 22689 928.83 25
15 – Turvo/Grande 15925 631.22 11
16 – Tietê/Batalha 13149 513.68 10
17 – Middle Paranapanema 16749 690.44 21
18 – São José dos Dourados 6783 268.86 4
19 – Lower Tietê 15588 598.09 12
20 – Aguapei 13196 510.50 11
21 – Peixe 10769 426.12 15
22 – Pontal do Paranapanema 12395 479.12 15
State of São Paulo 248111 10834.60 336
WRMUs that are constituted of crystalline Pre-Cambrian
rocks, an extensive abstraction for industrial supply and
for autonomous household is practiced. Despite of these
facts, little knowledge is available with regard to ground-
water exploited volumes by private wells. Furthermore,
in contrast with the surface waters, the demands, accord-
ing to different types of use, are more difficult to estimate.
7779 wells are registered in the databank of the
DAEE (Department of Water and Electric Energy of the
State of São Paulo), however it is estimated that the
State of São Paulo territory contains around 30000 cur-
rently active boreholes (G. Rocha, unpublished data), and
several tens of thousands of dug wells and mini-wells
(small diameter, shallow, and inexpensive). This situa-
tion clearly demonstrates the lack of control over the ex-
ploitation of groundwater by the government institutions.
Despite of this limitation, estimates of the groundwater
exploited volumes, for each of the 22 WRMU, are pre-
sented in the Situation Reports of these units (Table III);
the sum of these estimates results in 41.8 m3/s. From
this, around 18.3 m3/s (SEADE 2004) are used for pub-
lic supply. In Table III, one can observe that the Upper
Tietê (7.9 m3/s), Turvo/Grande (5.5 m3/s), Mogi-Guaçu
(4.8 m3/s), Paraíba do Sul (3.6 m3/s), and Middle Parana-
panema (probably 3.2 m3/s) practice the greater values
of total abstraction. The abstractions in the other units
are smaller than 1.5 m3/s.
GROUNDWATER NATURAL QUALITY
Groundwater in São Paulo State is, in general, of excel-
lent quality, being potable and without restrictions for
most uses. For the public supply, the only necessary
An Acad Bras Cienc (2007) 79 (1)

146 RICARDO HIRATA, ALEXANDRA SUHOGUSOFF and AMÉLIA FERNANDES
TABLE IIIGroundwater use for the State of São Paulo (SEADE 2004, modified).
Use (m3/s)
HRMUDomestic and
Total
Public Industrial Rural Otherabstraction
Supply(m3/s)
01 – Mantiqueira – – – – 0.0
02 – Paraiba do Sul 1.7 1.8 0.8 – 3.6
03 – Litoral Norte 0.1 – – – 0.1
04 – Pardo 3.5 – – – 4.4
05 – Piracicaba/Capivari/Jundiaí 0.4 0.5 – – 1.0
06 – Upper Tietê 2.8 3.4 – 1.7 7.9
07 – Baixada Santista 0.1 0.0 – – 0.1
08 – Sapucaí/Grande – – – – 0.9
09 – Mogi-Guaçu 1.0 3.7 0.1 0.0 4.8
10 – Tietê/Sorocaba 0.4 – – – 0.4
11 – Ribeira de Iguape/Litoral Sul 0.5 – – – 0.5
12 – Lower Pardo/Grande 0.2 0.2 – – 0.4
13 – Tietê/Jacaré 3.0 0.3 – 0.3 3.7
14 – Upper Paranapanema – – – – 0.3
15 – Turvo/Grande – – – – 5.5
16 – Tietê/Batalha 1.0 – – – 1.0
17 – Middle Paranapanema 0.1 – 3.1 – 3.2
18 – São José dos Dourados 0.5 0.0 – 0.0 0.5
19 – Lower Tietê 0.7 – – – 0.7
20 – Aguapei 1.1 – – – 1.1
21 – Peixe 1.2 – – – 1.2
22 – Pontal do Paranapanema – – – – 0.6
State of São Paulo 18.3 – – – 41.8
measures are the chlorination and, in some cases, the
fluoridation.
Cases of chromium and fluoride natural contami-
nation are known in some basins. Chromium is mostly
observed in water of some deeper and heavily exploited
wells of the Adamantina Aquifer in São José dos Doura-
dos, Turvo/Grande and Lower Pardo/Grande WRMUs.
It is geographically limited to the Northwestern portion
of the State of São Paulo (R. Hirata and G. Rodolfi–
unpublished data, M.L.N. Almodovar, unpublished data,
CETESB 2004). This is explained by the fact that the
source of the sediments, of the Adamantina Formation
in this region, was originated in the Triângulo Mineiro
(MG), where minerals of chromium (e.g., chromite and
some types of garnet) were available. Fluoride affects
mainly the Guarani (Botucatu and Piramboia forma-
tions), Serra Geral, and, locally, Tubarão (Itararé Forma-
tion) aquifer systems. The origin of the fluoride is not yet
clearly understood, although it is generally accepted that
it is associated with major faults (Perroni et al. 1985). It
occurs in one or more areas of Pontal do Paranapanema,
Tietê/Batalha, Middle Paranapanema and Lower Tietê
WRMUs, although it generally affects only less than 5%
of the whole area of each unit.
GROUNDWATER INDICATORS
The indicators allow the definition of the present sta-
tus or trends for a specific quality or parameter of a de-
fined area and also the comparison of different regions
(UNESCO/IAEA/IAH/UNECE 2004).
The most common use of indicators is describing
the state of the resource, although regular measurements
An Acad Bras Cienc (2007) 79 (1)

SÃ O PAULO GROUNDWATER RESOURCES: APPLICATION OF INDICATORS 147
of them provide time series that can be used either for
predicting future trends or responses to the management.
They, therefore, act as an important communication tool
for policy-makers and the public, in general, and also
permit to evaluate the effectiveness of specific policy ac-
tions and subsidize the development of new actions. An
indicator value can also be compared to a reference con-
dition and so it can be used as a tool for assessment.
Indicators, for groundwater resources, have mostly
been employed in order to define the present status, on
a regional scale, and the degradation tendency, with re-
gard to both quantity (under- or overexploitation) and
quality (natural and anthropic contamination). The for-
mulation of the indicators, herein presented, was based
partially on UNESCO/IAEA/IAH/UNECE (2004) and
Vrba et al. (2005). As described in the following sec-
tions, specific combinations of the seven indicators pro-
vide a general picture of the WRMU with regard to three
aspects, namely, (1) dependence, (2) availability, and
(3) quality of groundwater (Table IV. Figure 3) synop-
tically represents these three aspects using simple and
intuitive “ smiling faces”.
As is depicted in Table V, each of the 22 WRMUs
was classified in three categories of increasing attention,
namely, observation, attention, and alert, according to
its situation with regard to each Indicator.
INDICATORS OF GROUNDWATER DEPENDENCE
The formulae related to the indicators of groundwater
dependence are illustrated in Table IV. Indicator 1 (I1) is
concerned with the role of groundwater for public sup-
ply. Categories low, intermediate and high correspond to:
less than 25%, 25 to 50%, and larger than 50%, respec-
tively. 9 WRMUs show strong dependence on ground-
water (supply of more than 50% of the population); 6,
intermediate (49 to 25%); e 7, low (<24%) (Table V,
Figure 2). The municipalities of the Western and Cen-
tral portions of the State of São Paulo, whose population
corresponds to 16.4% of the State, are strongly supported
by groundwater abstraction. The most dependent basin
is the Tietê/Batalha (91%), being followed by Aguapeí
(88%), Turvo Grande (78%), Pardo (69%), São José dos
Dourados (66%), Peixe (61%), Tietê/Jacaré (61%), Pon-
tal do Paranapanema (56%) and Lower Tietê (52%). All
of these are in category high and the other basins, that
present a degree of dependency inferior to 50%, in cate-
gories intermediate and low (Table V).
Indicator 2 (I2) expresses the degree of groundwa-
ter participation in water supply for all uses, that is,
the abstraction of groundwater compared to the total,
ground- and surface water, one. In the State of São Paulo,
the groundwater contributes with 11% of the total used
water. The majority of the WRMU are in category low
(I2 < 25%), three in intermediate (25% ≤ I2 < 50%),
and one in high (I2 ≥ 50%). The major contributions of
groundwater, according to the Situation Reports data, are
found in São José dos Dourados (50%), Turvo/Grande
(32%), Tietê/Jacaré (29%) and Middle Paranapanema
(26%) (Table IV).
INDICATORS OF GROUNDWATER AVAILABILITY
Indicator 3 (I3) (Table IV relates the renewable ground-
water resources, defined in the section “ recharge and
aquifer vulnerability”, to the total population. The cat-
egories low, intermediate and high, for this Indicator,
correspond to larger than 1500 L/inhab/day, 500 to
1500 L/inhab/day, and less than 500 L/inhab/day, re-
spectively (Table V). In the State of São Paulo, an av-
erage discharge of 787 L/inhab/day is estimated. As
one could expect, the Upper Tietê Basin (WRMU 6),
with 93 L/inhab/day, is the most critical, followed by
Piracicaba/Capivari/Jundiai (482 L/inhab/day) and Ti-
etê/Sorocaba (433 L/inhab/ day). Significant drawdowns
of the potentiometric surfaces are reported for the Up-
per Tietê Basin (Hirata et al. 2002, Hirata and Fer-
reira 2001) and also for Turvo/Grande (São José do Rio
Preto municipality) and Pardo (Ribeirão Preto munici-
pality) basins (São Paulo 2004a, b). Nevertheless, in
many of the WRMUs, for instance Ribeira de Iguape
(13973 L/inhab/day), Litoral Sul (3186 L/inhab/day),
Upper Paranapanema (3186 L/inhab/day), Lower Pardo/
Grande (3050 L/inhab/day), and Middle Parnapanema
(2891 L/inhab/day), the availability is high, mainly due
to the relatively low amount of inhabitants in these re-
gions. The present study did not take into account the po-
tentiality of the Guarani Aquifer in its confined portion.
This aquifer, as concluded by previous investigations, is
the great groundwater reservoir of the State of São Paulo.
Indicator 4 (I4) expresses how much water has been
abstracted with regard to the renewable groundwater re-
An Acad Bras Cienc (2007) 79 (1)

148 RICARDO HIRATA, ALEXANDRA SUHOGUSOFF and AMÉLIA FERNANDES
TABLE IVDescription of the groundwater indicators for the State of São Paulo.
GroundwaterIndicator Expressed as Explanation/Interpretation
with regard to
Dependence
1 - Population supplied by groundwater / % Importance of groundwater for suppling theTotal population of the WRMU population of each WRMU.
2 - Total abstraction of groundwater (all uses) / % Amount of exploited groundwater for allTotal subsurface and surface water abstraction uses (household, agriculture, industries)
with regard to the total amount of exploitedsurface- and subsurface resources.
Availability
3 - Exploitable reserves of groundwater / L/inhab/day The exploitable reserves of groundwaterTotal population of the WRMU correspond to the renewable groundwater
resources, that consist of the differencebetween the recharge and the discharge thatmaintains the baseflow in the rivers.
4 - Total abstraction of groundwater / % Denote areas where over-exploitation andExploitable reserves of groundwater its social-economic impacts were already
identified. The exploitable reserves ofgroundwater may vary according to thecurrent social-economic, political andecological conditions of each region.
Quality
5 - Total area of high vulnerability to % Area of the WRMU that is susceptible tocontamination / Total area of the WRMU any kind of contamination. It was based
in the map of vulnerability of the State ofSão Paulo (Hirata et al. 1997) that waselaborated according to the GOD method(Foster and Hirata 1988).
6 - Total area with natural contamination of % The total area of the WRMU with naturalgroundwater / Total area of the WRMU contamination corresponds to the sum of
the municipality areas where contaminationwas verified. It helps visualyzing, in timeand space, problems related to naturalquality.
7 - Total number of proved cases of anthropic Number of Number of cases of soil and groundwatercontamination / Total area of the WRMU cases/km2 contamination caused by human activities
(such as fuel stations, industries, wastedisposal sites, trade, and accidents) bykm2 of the WRMU.
sources, and consequently, clearly demonstrates the
availability with regard to the currently practiced abs-
tractions. An estimate of I4, for the State of São Pau-
lo, when considering the calculated values for each
WRMU, corresponds to 12%. It points out the potential-
ity of supplying water for various purposes, especially
due to the fact that, excepting punctual cases, this re-
source presents good quality (see Indicators 6 and 7).
Excepting WRMUs Turvo Grande (52%), Pardo (44%),
Upper Tietê (41%), Mogi-Guaçu and Tietê/Jacaré (28%)
basins where the use is quite intense, the rest of them
show values less than 20% (category low), being the ma-
jority less than 10% (Table V). For the Piracicaba/Capi-
vari/Jundiai Basin, with acknowledged intense use of
groundwater, the value of I4 is only 4%, however I3,
which takes into account the population of the basin,
denotes that its situation is problematic (Table V). In-
vestigations of potentiality, carried out by private con-
sultants in order to attend the need of licensing expres-
sive discharges, have demonstrated that, for small ar-
eas, the renewable groundwater resources are very lim-
ited in Piracicaba/Capivari/Jundiai Basin. This situa-
tion demonstrates that the major problem of this basin
is the great density of abstractions, due to the concentra-
tion of human occupation, on aquifers (Tubarão and Pre-
cambrian systems) whose discharges are limited by their
hydraulic conductivity and storativity.
In the Upper Tietê Basin, a recent study (Hirata et
al. 2002) has concluded that the piezometric levels of
the aquifers have been lowered and, consequently, there
have been reserve losses, due to uncontrolled exploita-
tion of groundwater. Nevertheless, I4 also reveals that,
An Acad Bras Cienc (2007) 79 (1)

SÃ O PAULO GROUNDWATER RESOURCES: APPLICATION OF INDICATORS 149
Fig. 3 – Example of material for public awareness using groundwater indicators.
outside of the urbanized areas, this resource could be
100% more exploited than it currently is.
INDICATORS OF GROUNDWATER QUALITY
Indicator 5 (I5) (Table IV) considers the relative exten-
sion, in each WRMU, of areas of different vulnerab-
ilities, which is an intrinsic characteristic of an aquifer,
and is defined as the susceptibility of the saturated zone
of the aquifer becoming contaminated, according to cur-
rent potability parameters, by an anthropic activity (Fos-
ter and Hirata 1988). I5 does not consider the interaction
of the vulnerability with the potential contaminant loads
for the reason that there is not an up to date evaluation
of their distribution.
GOD method (Foster and Hirata 1988) was applied
for the mapping of the vulnerability of the aquifer sys-
tems of the State of São Paulo in 1:500.000 (Hirata et al.
1997). I5 points out that the most vulnerable WRMUs
correspond to Pardo, Tietê/Jacaré, Lower Tietê, Aguapeí,
Pontal do Paranapanema, Paraíba do Sul, Peixe, São
José dos Dourados, Sapucai/Grande and Upper Parana-
panema. One important area of high vulnerability, cor-
respond to recharge zones of the Guarani Aquifer Sys-
tem, especially in the WRMUs of Pardo, Mogi-Guaçu,
and Upper Paranapanema (Table IV). Therefore, detailed
studies of existent contamination and careful evaluations,
when considering the installation of future activities,
should be carried out in these regions. The vulnerability
of the WRMUs totally located in crystalline terrains is
not defined.
Indicator 6 (I6) (Table IV) denotes the total area
where the natural quality of groundwater is not in accor-
dance with drinking water standards. In the State of São
Paulo, the most common elements, related to the natural
solubilization of minerals of the host rock by the perco-
lation of groundwater, are fluoride and total chromium,
as toxic components, and iron and manganese, as aes-
thetic parameters. In the present study, only the first two
are considered.
According to I6 the natural quality of the ground-
water of the State is, in general, excellent, however con-
tamination of fluoride are found in Paranapanema, Ti-
etê/Batalha, and Middle Paranapanema basins; of chro-
mium, in São José dos Dourados, Turvo/Grande, and
Lower Pardo/Grande; and of both components in Lower
Tietê. The greater values of I6 were found in São José
An Acad Bras Cienc (2007) 79 (1)

150 RICARDO HIRATA, ALEXANDRA SUHOGUSOFF and AMÉLIA FERNANDEST
AB
LE
VG
roun
dwat
erin
dica
tors
for
spec
ific
Wat
erR
esou
rce
Man
agem
ent
Uni
ts(W
RM
U)
inth
eSt
ate
ofSã
oP
aulo
.
Dep
ende
nce
Nor
suita
ble
expl
oita
tion
Prob
lem
sre
late
dto
wat
erqu
ality
WR
MU
Indi
cato
r1
Indi
cato
r2
Indi
cato
r3
Indi
cato
r4
Indi
cato
r5
Indi
cato
r6
Indi
cato
r7
LI
HU
D
1–
Man
tique
ira
00
2842
010
00
0
2–
Para
íba
doSu
l25
2098
318
510
1273
00
3–
Lito
ral N
orte
289
2935
210
00
0
4–
P ard
o69
2092
144
1030
1050
50
5–
Pira
cica
ba/C
apiv
ari/J
undi
aí5
248
24
4510
540
111.
8
6–
Upp
erT
ietê
18
9341
100
02.
9
7–
Bai
xada
Sant
ista
00
881
110
00
0
8–
Sapu
caí/G
rand
e28
715
338
2612
620
0
9–
Mog
i-G
uaçu
2510
1124
2820
437
302
0
10–
Tie
tê/S
oroc
aba
126
433
556
254
150
6.1
11–
Rib
eira
doIg
uape
/Lito
ralS
ul7
813
973
110
00
0
12–
Low
erP a
rdo/
Gra
nde
363
3050
42
822
240
0
13–
Tie
tê/J
acar
é61
2984
328
560
2510
00
14–
Upp
erP a
rana
pane
ma
85
3187
160
1510
150
0
15–
Tur
v o/G
rand
e78
3281
452
1274
410
1918
.8
16–
Tie
tê/B
atal
ha91
1118
6010
1482
43
3
17–
Mid
dle
Para
napa
nem
a44
2628
9215
2238
403
2.4
18–
São
José
dos
Dou
rado
s66
5017
8410
569
1610
2032
19–
Low
erT
ietê
525
1541
62
7820
179.
5
20–
Agu
apei
8819
2711
104
7224
00
21–
Peix
e61
2124
0210
1570
158
11
22–
Pont
aldo
P ara
napa
nem
a56
729
084
1560
254
4.7
Stat
eof
São
P aul
o16
1178
712
100
55.
3
Obs
erva
tion
I1<
25%
I2<
25%
I3>
1500
I4<
25%
H<
5%I6
<15
%I7
<15
%
Atte
ntio
n25
%<
I1<
50%
25<
I2<
50%
500<
I3>
1500
25<
I4<
40%
5%<
H<
10%
15%
<I6
<30
%15
%<
I7<
30%
Ale
rtI1
<50
%I2
>50
%I3
<50
0I4
>40
%H
>10
%I6
>30
%I7
>30
%
Low
(L),
Inte
rmed
iate
(I)
and
Hig
h(H
)aq
uife
rpo
llutio
n;U
D:U
ndefi
nied
;I1-
I7:
Indi
cato
r1
to7.
An Acad Bras Cienc (2007) 79 (1)

SÃ O PAULO GROUNDWATER RESOURCES: APPLICATION OF INDICATORS 151
dos Dourados (20%), Turvo/Grande (19%), Lower Ti-
etê (17%) and Piracicaba/Capivari/Jundiai (11%), which
were classified as category high (Table V). Once the ac-
tual extension of the areas where the contamination oc-
curs is not known, the calculation of this Indicator took
into account the total area of the municipality where
the contamination was detected.
Indicator 7 (I7) relates the number of contaminated
groundwater sites to the total area of WRMU. The main
problem related to this indicator is the lack of infor-
mation. A government program for detecting ground-
water contamination sites in the State of São Paulo is
new, and up to now, few of them were studied in de-
tail. The inventory of contaminated areas, elaborated by
CETESB, responsible for the State environmental con-
trol, reports, up to November of 2004, the existence of
1366 confirmed cases of contamination (among tens of
thousands of potentially contaminant sources), of which
931 were caused by fuel stations, 237 by industries, 61
by solid waste disposal, 92 by trade associated activi-
ties (including storing and handling of hazardous prod-
ucts), and 15 by accidents of unknown origin (http://
www.cetesb.sp.gov.br, access on 05/05/05). The major-
ity of the contaminated sites is located in urban areas
of the Upper Tietê Watershed (725 cases), followed by
Piracicaba/Capivari/Jundiai Basin (182 cases).
CONCLUSIONS
The indicators herein proposed, together with the avail-
able information for each WRMU, are suitable to evalu-
ate the current situation of the groundwater in the State
of São Paulo. Three different combinations of these indi-
cators provide a general picture of three aspects, namely,
current (1) dependence, (2) availability and (3) quality
of groundwater.
The dependence of groundwater for the State of
São Paulo is remarkable and can be evaluated by indi-
cators 1 and 2. With regard to the public supply (Indi-
cator 1), one observes that 9 WRMUs show high (more
than 50% of the population is supplied by groundwater),
6, intermediate (49 to 25%), and 7, low (less than 24%)
dependence on groundwater. The largest demand is ge-
ographically located in the North, Central and Western
portions of the State. On the other hand, considering
the supply of groundwater for any purpose (Indicator 2),
the dependence on groundwater is expressively smaller,
and only one WRMU (Middle Paranapanema) is in the
category high, and three and 18 WRMUs in categories
intermediate and low, respectively.
The groundwater availability is assessed by indi-
cators 3 and 4. Indicator 4 points out that the resource
still presents a great potential for further abstractions in
most of the WRMUs. However the Upper Tietê, fol-
lowed by Turvo/Grande, and Pardo basins show evidence
of overexploitation and need special attention. In the
specific case of Upper Tietê Basin, followed by Piraci-
caba/Capivari/Jundiai, and Turvo/Grande, the volume of
water divided by the population (Indicator 3) clearly de-
notes the low availability.
The quality of groundwater is demonstrated by
indicators 5, 6 and 7. In WRMUs 2, 4, 8, 13, 14 and
18 to 22 more than 10% of their territory is of high vul-
nerability, which denotes that they need to be more care-
fully considered, when large potential contaminant loads
are present or planned to be installed. Some of these
basins contain part of the recharge area of the Guarani
Aquifer System, the most productive aquifer in Brazil.
Indicator 6 points out its general excellent natural qual-
ity, although it also denotes that some WRMUs (São José
dos Dourados, Turvo/Grande, and Piracicaba/Capivari
Jundiai) need special consideration with regard to chro-
mium and fluoride concentrations. The majority of the
cases of contamination caused by human activities is
concentrated in urban areas.
In spite of the groundwater resources of good qual-
ity in the State of São Paulo being fairly abundant, there
are some specific areas where the WRMUs are currently
facing problems such as overexploitation (strong draw-
down in particular urban areas), low availability (related
to population concentration) and contamination (natu-
ral and anthropic). In this way, the indicators, that can
be easily understandable by policy-makers, represent an
important tool for identifying areas that should be either
prioritized for detailed studies or worked in a preven-
tive way.
ACKNOWLEDGMENTS
The authors are most grateful to Ms Thelma Samara
(Instituto de Geociências, USP) for the preparation of
the figures of this article.
An Acad Bras Cienc (2007) 79 (1)

152 RICARDO HIRATA, ALEXANDRA SUHOGUSOFF and AMÉLIA FERNANDES
RESUMO
Indicadores, para recursos hídricos subterrâneos, têm sido uti-
lizados principalmente para a avaliação da situação atual e
tendência de degradação, com relação tanto à quantidade (sub-
ou super-exploração) como à qualidade (contaminações natu-
ral e antrópica). Neste sentido, este trabalho apresenta a apli-
cação de indicadores com o objetivo de obter um quadro geral
da situação dos recursos hídricos nas 22 Unidades de Geren-
ciamento de Recursos Hídricos (UGRHI) do Estado de São
Paulo. Foram aplicados 7 indicadores (I1 a I7) com o objetivo
de fornecer uma visão geral com relação à dependência (I1 e
I2), disponibilidade (I3 e I4), e qualidade (I5, I6 e I7) da água
subterrânea. No que se refere ao abastecimento público (indi-
cador 1), 9 UGRHIs apresentam alta (>50% da população é
suprida por água subterrânea), 6, intermediária (49 a 25%) e 7,
baixa (<24%) dependência do recurso hídrico subterrâneo. Os
indicadores 3 e 4 mostram que o recurso ainda apresenta grande
potencial para explotações adicionais na maioria das UGRHIs,
no entanto há evidências de superexploração nas bacias do Alto
Tietê, Turvo/Grande e Pardo e baixa disponibilidade nas bacias
do Alto Tietê, Piracicaba/Capivari/Jundiaí, e Turvo/Grande. O
indicador 5 (vulnerabilidade natural dos aqüíferos) aponta que
as UGRHIs 2, 4, 8, 13, 14 e 18 a 22 (parte da área aflorante do
Sistema Aqüífero Guarani) precisam ser mais cuidadosamente
consideradas, principalmente quando grandes cargas contami-
nantes potenciais estiverem presentes. O indicador 6 revela
que a qualidade natural das águas subterrâneas é de modo geral
excelente, ainda que 3 UGRHIs necessitem de cuidados espe-
ciais especiais devido à sua contaminação por cromo e flúor.
O indicador 7 mostra uma forte relação entre a ocorrência da
contaminação das águas subterrâneas e densidade/tipo de ocu-
pação territorial.
Palavras-chave: água subterrânea, São Paulo, abastecimento
público, gestão, indicadores.
REFERENCES
CETESB. 2004. Relatório de Qualidade das Á guas Subter-
râneas 2001-2003. São Paulo, SP, Brasil, 211 p.
FOSTER S AND HIRATA R. 1988. Groundwater pollution
risk evaluation: a survey manual using available data. Pan
American Center for Sanitary Engineering and Environ-
mental Sciences PAHO/WHO. Lima, Peru, 98 p.
HIRATA R AND FERREIRA L. 2001. Os aqüíferos da bacia
hidrográfica do Alto Tietê: disponibilidade hídrica e vul-
nerabilidade à poluíção. Rev Brasil Geoc 31: 43– 50
HIRATA R, BASTOS C AND ROCHA G. 1997. Mapeamento
da vulnerabilidade e risco de poluição das águas subter-
râneas no Estado de São Paulo. IG/CETESB/DAEE, Se-
cretaria do Meio Ambiente do Estado de São Paulo (Série
Documentos). 2 vol.
HIRATA R, FERREIRA L, FERREIRA L AND PEDE M. 2002.
La explotación de las aguas subterráneas en la cuenca
hidrográfica del Alto Tietê: crónica de una crisis anun-
ciada. Madrid. In: BOLETÍN GEOLÓ GICO MINERO 113:
273– 282.
PERRONI J, SILVA R, HIRATA R AND DOZZY L. 1985. Ocor-
rência de fluoreto nos aqüíferos da Bacia do Paraná no
Estado de São Paulo. 5◦ Simpósio Regional de Geologia.
São Paulo, SP, Brasil, SBG 503: 514.
SÃ O PAULO. 2004a. Plano de Bacia da Unidade de Geren-
ciamento de Recursos Hídricos Turvo/Grande. Instituto
de Pesquisas Tecnológicas. Relatório Técnico. São Paulo,
SP, Brasil, 92 p.
SÃ O PAULO. 2004b. Plano Estadual de Recursos Hídricos:
Síntese dos Planos de Bacia. Relatório 1. JMS-Engecorps.
Departamento de Á guas e Energia Elétrica. São Paulo, SP,
Brasil, 378 p.
SEADE. 2004. Anuário estatístico do Estado de São Paulo.
Fundação SEADE. São Paulo (http://www.seade.gov.br/,
access on 15/10/04).
SRACEK O AND HIRATA R. 2002. Geochemical and stable
isotopic evolution of the Guarani Aquifer System in the
State of São Paulo, Brazil. Hydrogeol J 10: 643– 655.
UNESCO, IAEA, IAH, UNECE. 2004. Development of
groundwater indicators for second edition of the World
Water Development Report. Groundwater indicators
Working Group (Jaroslav Vrba, Jan Girman, Naim Haie,
Ricardo Hirata, Annukka Lipponen, Tushaar Shah and
Bill Wallin). Third Version (UNESCO Technical Report),
Paris, France, 18 p.
VRBA J, HIRATA R, GIRMAN J, HAIE N, LIPPONEN A,
SHAH T AND WALLIN B. 2005. Groundwater resources
sustainability indicators. In: VII IAHS SCIENTIFIC AS-
SEMBLY, Foz do Iguaçu, PR, Brazil.
An Acad Bras Cienc (2007) 79 (1)