grupo lala reports fourth quarter and …...results q4 2019 1 mexico city, february 24, 2020 –...
TRANSCRIPT
Results Q4 2019
1
Mexico City, February 24, 2020 – Grupo LALA, S.A.B. de C.V., a Mexican Company focused on healthy and nutritious foods,
(“LALA”) (BMV: LALAB), today reported results for the fourth quarter and full year 2019. The following information has been
presented based on International Financial Reporting Standards (IFRS) and in nominal terms.
Quarter Highlights:
▪ Management change: Arquímedes Celis serving as Grupo LALA’s CEO
▪ +2.0% Q4’19 and +3.9% FY’19 constant currency Branded Sales
▪ 8.3% Q4’19 EBITDA margin; a -27.5% comparable YOY decrease due to margin contraction in Mexico resulting from
overinvestment and disruptions to operations
▪ 10.9% FY’19 EBITDA margin, a +3.0% comparable YOY increase
▪ -86.5% Q4’19 and -3.0% FY’19 YOY Controlling Net Income due to lower operating profit in Mexico
▪ 180 bps WC improvement to 0.6% of sales, driven by negative WC in Mexico
▪ Leverage ratio: 3.0x at year-end
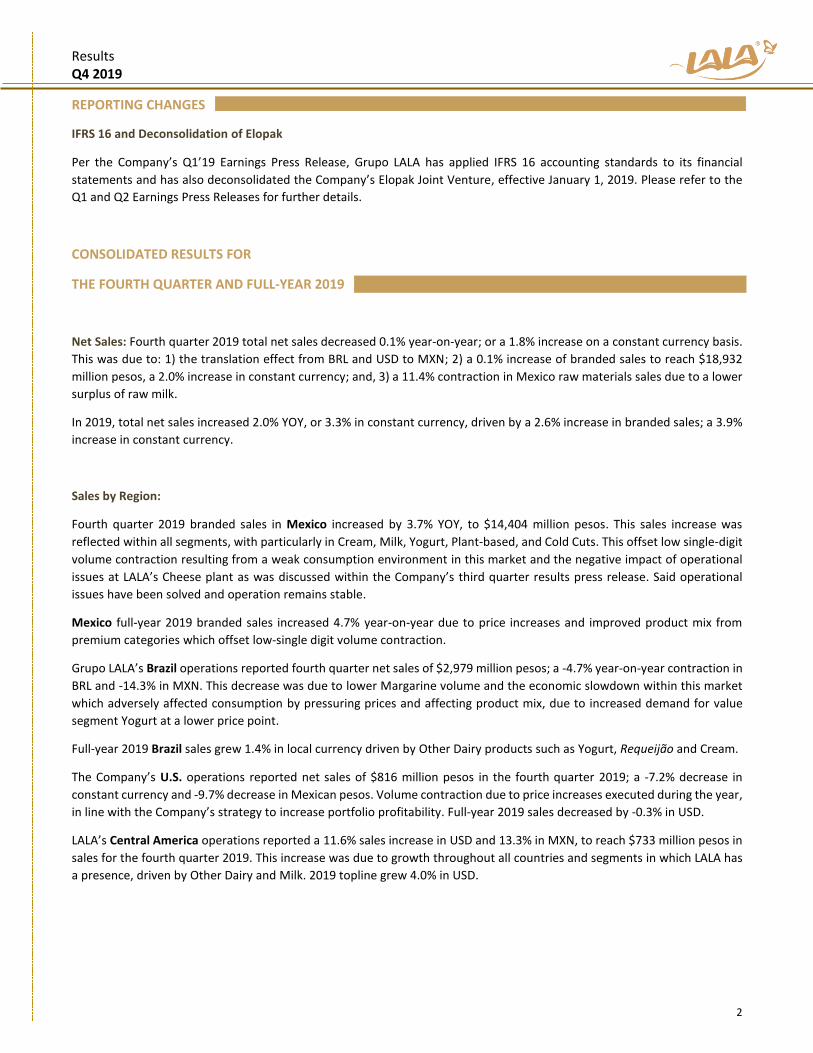
The following chart provides an abridged Income Statement, in millions of pesos. The margin for each figure represents its
ratio to net sales for the quarter and the year ended on December 31, 2019 as compared to the same period in 2018. Net
Sales and EBITDA information related to Q4’18 and FY’18 has been presented on “comparable” basis. Comparable Q4’18 and
FY’18 figures include the effect of IFRS 16 and the deconsolidation of Elopak.
MXN$ in millions Q4’18 % Sales Q4’19 % Sales Var. % FY’18 % Sales FY’19 % Sales Var. %
Branded Sales (1) 18,920 18,932 0.1% 72,588 74,443 2.6%
Raw Materials and Others 322 (2) 285 (11.4%) 1,735 (2) 1,341 (22.7%)
Net Sales 19,242 (2) 100% 19,217 100% (0.1%) 74,323 (2) 100% 75,784 100% 2.0%
Gross Profit 6,872 35.2% 6,464 33.6% (5.9%) 26,510 35.2% 26,609 35.1% 0.4%
Operating Income 1,510 7.7% 780 4.1% (48.3%) 5,411 7.2% 5,194 6.9% (4.0%)
EBITDA (3) 2,198 (2) 11.4% 1,594 8.3% (27.5%) 8,026 (2) 10.8% 8,265 10.9% 3.0%
Controlling Net Income 854 4.4% 115 0.6% (86.5%) 1,908 2.5% 1,851 2.4% (3.0%)
(1) Branded Sales exclude raw materials sales
(2) Comparable figures, including IFRS 16 adjustments and the deconsolidation of Elopak JV
(3) EBITDA is defined as operating income before depreciation and amortization
MESSAGE FROM MANAGEMENT
Arquímedes Celis, Grupo LALA’s CEO, commented:
“While our Company and industry currently face challenging consumer environments in many key markets, opportunities to
drive profitable growth clearly exist. Effective execution of our strategy will enable us to leverage the strength of LALA’s diverse
market-leading brand portfolio and our dominant refrigerated distribution network, to strengthen our distinct competitive
advantages, with the aim of increasing market share and growing profits. Most important, to increase shareholder value we
will be working to restore profit levels at LALA’s Mexico business. We are confident in our ability to achieve this objective by
capturing these opportunities and leveraging the culture of innovation for which LALA is best known.”
GRUPO LALA REPORTS FOURTH QUARTER AND FULL-YEAR 2019 RESULTS
Results Q4 2019
2
REPORTING CHANGES
IFRS 16 and Deconsolidation of Elopak
Per the Company’s Q1’19 Earnings Press Release, Grupo LALA has applied IFRS 16 accounting standards to its financial
statements and has also deconsolidated the Company’s Elopak Joint Venture, effective January 1, 2019. Please refer to the
Q1 and Q2 Earnings Press Releases for further details.
CONSOLIDATED RESULTS FOR
THE FOURTH QUARTER AND FULL-YEAR 2019
Net Sales: Fourth quarter 2019 total net sales decreased 0.1% year-on-year; or a 1.8% increase on a constant currency basis.
This was due to: 1) the translation effect from BRL and USD to MXN; 2) a 0.1% increase of branded sales to reach $18,932
million pesos, a 2.0% increase in constant currency; and, 3) a 11.4% contraction in Mexico raw materials sales due to a lower
surplus of raw milk.
In 2019, total net sales increased 2.0% YOY, or 3.3% in constant currency, driven by a 2.6% increase in branded sales; a 3.9%
increase in constant currency.
Sales by Region:
Fourth quarter 2019 branded sales in Mexico increased by 3.7% YOY, to $14,404 million pesos. This sales increase was
reflected within all segments, with particularly in Cream, Milk, Yogurt, Plant-based, and Cold Cuts. This offset low single-digit
volume contraction resulting from a weak consumption environment in this market and the negative impact of operational
issues at LALA’s Cheese plant as was discussed within the Company’s third quarter results press release. Said operational
issues have been solved and operation remains stable.
Mexico full-year 2019 branded sales increased 4.7% year-on-year due to price increases and improved product mix from
premium categories which offset low-single digit volume contraction.
Grupo LALA’s Brazil operations reported fourth quarter net sales of $2,979 million pesos; a -4.7% year-on-year contraction in
BRL and -14.3% in MXN. This decrease was due to lower Margarine volume and the economic slowdown within this market
which adversely affected consumption by pressuring prices and affecting product mix, due to increased demand for value
segment Yogurt at a lower price point.
Full-year 2019 Brazil sales grew 1.4% in local currency driven by Other Dairy products such as Yogurt, Requeijão and Cream.
The Company’s U.S. operations reported net sales of $816 million pesos in the fourth quarter 2019; a -7.2% decrease in
constant currency and -9.7% decrease in Mexican pesos. Volume contraction due to price increases executed during the year,
in line with the Company’s strategy to increase portfolio profitability. Full-year 2019 sales decreased by -0.3% in USD.
LALA’s Central America operations reported a 11.6% sales increase in USD and 13.3% in MXN, to reach $733 million pesos in
sales for the fourth quarter 2019. This increase was due to growth throughout all countries and segments in which LALA has
a presence, driven by Other Dairy and Milk. 2019 topline grew 4.0% in USD.

Results Q4 2019
3
Net Sales by Region
MXN$ in millions Q4’18 (1) Q4´19 Var. % Constant currency
Var. % (2) FY’18 (1) FY’19 Var. %
Constant currency
Var. % (2)
Mexico 13,896 14,404 3.7% 3.7% 53,765 56,283 4.7% 4.7%
Brazil 3,475 2,979 (14.3%) (4.7%) 12,765 11,964 (6.3%) 1.4%
USA 904 816 (9.7%) (7.2%) 3,373 3,368 (0.1%) (0.3%)
CAM 646 733 13.3% 11.6% 2,686 2,829 5.3% 4.0%
Total Branded Sales (3) 18,920 18,932 0.1% 2.0%
72,588 74,443 2.6% 3.9%
Raw Materials and Others
322 285 (11.4%) (11.4%) 1,735 1,341 (22.7%) (22.7%)
Total Sales 19,242 19,217 (0.1%) 1.8% 74,323 75,784 2.0% 3.3%
(1) Comparable figures, include the deconsolidation of Elopak JV
(2) Constant currency uses constant BRL for Brazil and USD for the United States and Central America
(3) Branded Sales exclude raw materials sales
Sales by Segment:
Milk sales grew in all regions excluding the US. Brazil UHT Milk production resumed during the fourth quarter 2019, and
Mexico had a positive mix resulting from growth in premium Milk.
Other Dairy sales increased in Mexico and CAM driven by categories such as Cream and Yogurt, offsetting a price and mix
contraction in Brazil and decreased volumes in the US.
Beverages and Others: Plant-based Beverages and Cold Cuts drove segment growth in Mexico.
76%
16%
4% 4%
Net Sales by Regionas reported FY'19
Mexico
Brazil
USA
CAM
53%43%
2% 2%
Net Sales by Segmentas reported FY'19
Milk
Other Dairy
Beverages and Others
Raw Materials andOthers

Results Q4 2019
4
Net Sales by Segment
MXN$ in millions Q4’18 (1) Q4´19 Var. % Constant currency
Var. % (2) FY’18 (1) FY’19 Var. %
Constant currency
Var. % (2)
Milk 10,052 10,243 1.9.% 2.1% 38,876 40,186 3.4% 3.5%
Other Dairy 8,471 8,216 (3.0%) 1.0% 32,057 32,378 1.0% 3.8%
Beverages and Others 397 473 18.9% 21.8% 1,655 1,879 13.6% 15.6%
Total Branded Sales (3) 18,920 18,932 0.1% 2.0% 72,588 74,443 2.6% 3.9%
Raw Materials and Others 322 285 (11.4%) (11.4%) 1,735 1,341 (22.7%) (22.7%)
Total Sales 19,242 19,217 (0.1%) 1.8% 74,323 75,784 2.0% 3.3%
(1) Comparable figures, include the deconsolidation of Elopak JV
(2) Constant currency uses constant BRL for Brazil and USD for the United States and Central America
(3) Branded Sales exclude raw materials sales
Costs and Gross Profit: fourth quarter 2019 cost of goods sold increased by 0.9%, resulting in $6,463 million pesos in gross
profit with a 160 bps decrease in gross margin, to 33.6%. This was due to: 1) production process inefficiencies at LALA’s
Mexico operations due to inaccuracies in demand planning. This resulted in raw materials losses and increased plant
maintenance and, in turn, a 15.1% increase in production expenses; and 2) pricing pressure in Brazil which impeded LALA’s
ability to pass increased raw materials costs on to consumers, and faster growth of a less profitable product mix.
Full-year 2019 gross profit increased by 0.4%, resulting in a $26,608 million peso, or 10 bps, contraction in gross margin year-
on-year, to reach 35.1%.
Expenses and Operating Income: fourth quarter operating expenses increased 7.1%, to $5,871 million pesos due to an 18.4%
rise in operating expenses in Mexico resulting from a spending hike and operational disruptions caused by overinvestment,
largely in human capital, made prior to realizing productivity benefits, as well as lower than expected sales; resulting in
double-digit increase in sales expenses, transportation, product waste and marketing.
Reported operating income reached $780 million pesos during the fourth quarter 2019; a 48.3% year-on-year decrease
impacted by gross margin contraction in Mexico and Brazil and increased operating expenses in Mexico, resulting in a 4.1%
operating margin. This represents a 360 bps year-on-year decrease in operating margin.
Full-year 2019 operating expenses increased by 5.3%. Operating income closed the year in $5,194 million pesos with a 6.9%
operating margin; a 30 bps year-on-year decrease.
EBITDA: Fourth quarter 2019 EBITDA reached $1,594 million pesos; a -27.5% year-on-year decrease in comparable figures
with a 310 bps margin contraction. This is mainly due to decreased operating performance in Mexico. For the full-year 2019,
Grupo LALA’s comparable EBITDA grew 3.0% driven by positive EBITDA in the US and CAM, as well as one-time benefits in
Brazil.
Results Q4 2019
5
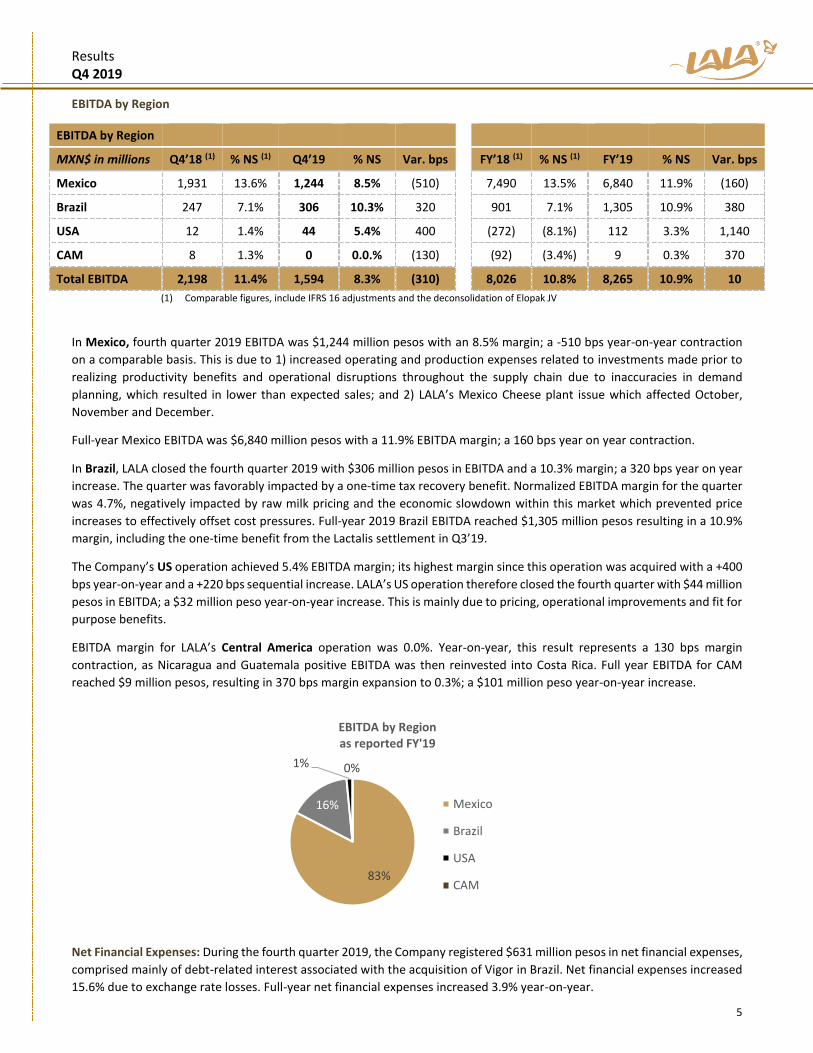
EBITDA by Region
EBITDA by Region
MXN$ in millions Q4’18 (1) % NS (1) Q4’19 % NS Var. bps FY’18 (1) % NS (1) FY’19 % NS Var. bps
Mexico 1,931 13.6% 1,244 8.5% (510) 7,490 13.5% 6,840 11.9% (160)
Brazil 247 7.1% 306 10.3% 320 901 7.1% 1,305 10.9% 380
USA 12 1.4% 44 5.4% 400 (272) (8.1%) 112 3.3% 1,140
CAM 8 1.3% 0 0.0.% (130) (92) (3.4%) 9 0.3% 370
Total EBITDA 2,198 11.4% 1,594 8.3% (310) 8,026 10.8% 8,265 10.9% 10
(1) Comparable figures, include IFRS 16 adjustments and the deconsolidation of Elopak JV
In Mexico, fourth quarter 2019 EBITDA was $1,244 million pesos with an 8.5% margin; a -510 bps year-on-year contraction
on a comparable basis. This is due to 1) increased operating and production expenses related to investments made prior to
realizing productivity benefits and operational disruptions throughout the supply chain due to inaccuracies in demand
planning, which resulted in lower than expected sales; and 2) LALA’s Mexico Cheese plant issue which affected October,
November and December.
Full-year Mexico EBITDA was $6,840 million pesos with a 11.9% EBITDA margin; a 160 bps year on year contraction.
In Brazil, LALA closed the fourth quarter 2019 with $306 million pesos in EBITDA and a 10.3% margin; a 320 bps year on year
increase. The quarter was favorably impacted by a one-time tax recovery benefit. Normalized EBITDA margin for the quarter
was 4.7%, negatively impacted by raw milk pricing and the economic slowdown within this market which prevented price
increases to effectively offset cost pressures. Full-year 2019 Brazil EBITDA reached $1,305 million pesos resulting in a 10.9%
margin, including the one-time benefit from the Lactalis settlement in Q3’19.
The Company’s US operation achieved 5.4% EBITDA margin; its highest margin since this operation was acquired with a +400
bps year-on-year and a +220 bps sequential increase. LALA’s US operation therefore closed the fourth quarter with $44 million
pesos in EBITDA; a $32 million peso year-on-year increase. This is mainly due to pricing, operational improvements and fit for
purpose benefits.
EBITDA margin for LALA’s Central America operation was 0.0%. Year-on-year, this result represents a 130 bps margin
contraction, as Nicaragua and Guatemala positive EBITDA was then reinvested into Costa Rica. Full year EBITDA for CAM
reached $9 million pesos, resulting in 370 bps margin expansion to 0.3%; a $101 million peso year-on-year increase.
Net Financial Expenses: During the fourth quarter 2019, the Company registered $631 million pesos in net financial expenses,
comprised mainly of debt-related interest associated with the acquisition of Vigor in Brazil. Net financial expenses increased
15.6% due to exchange rate losses. Full-year net financial expenses increased 3.9% year-on-year.
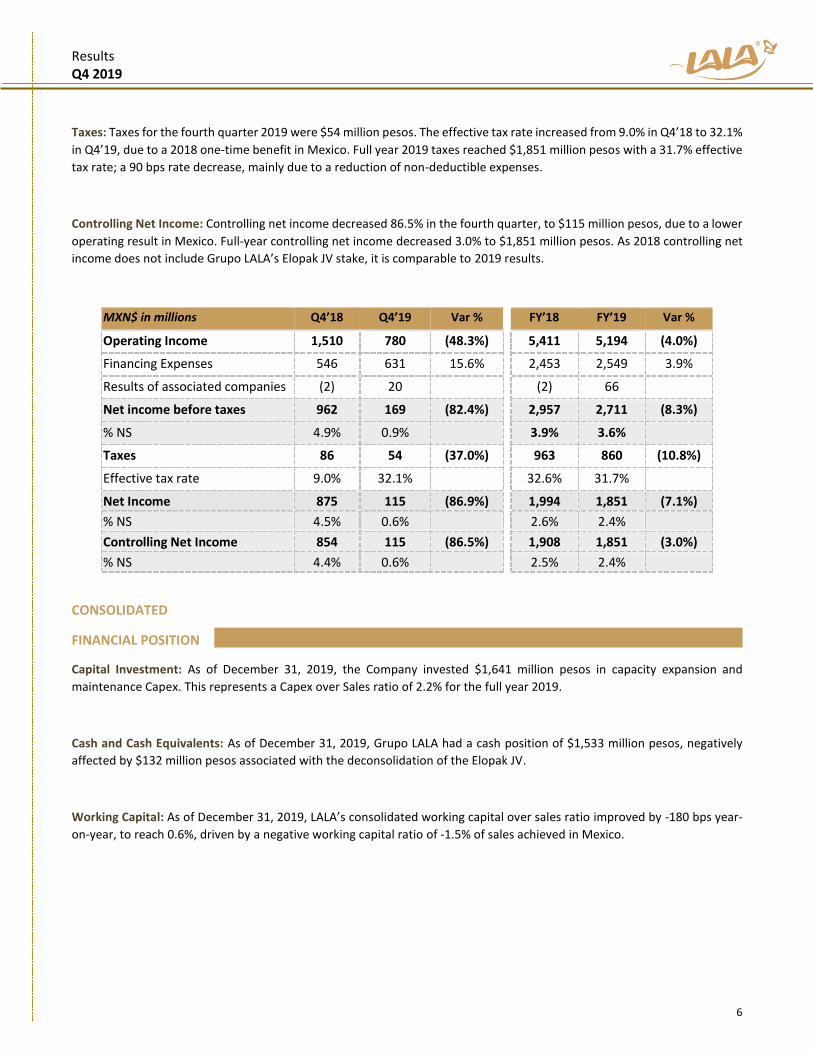
83%
16%
1% 0%
EBITDA by Regionas reported FY'19
Mexico
Brazil
USA
CAM
Results Q4 2019
6
Taxes: Taxes for the fourth quarter 2019 were $54 million pesos. The effective tax rate increased from 9.0% in Q4’18 to 32.1%
in Q4’19, due to a 2018 one-time benefit in Mexico. Full year 2019 taxes reached $1,851 million pesos with a 31.7% effective
tax rate; a 90 bps rate decrease, mainly due to a reduction of non-deductible expenses.
Controlling Net Income: Controlling net income decreased 86.5% in the fourth quarter, to $115 million pesos, due to a lower
operating result in Mexico. Full-year controlling net income decreased 3.0% to $1,851 million pesos. As 2018 controlling net
income does not include Grupo LALA’s Elopak JV stake, it is comparable to 2019 results.
MXN$ in millions Q4’18 Q4’19 Var % FY’18 FY’19 Var %
Operating Income 1,510
780 (48.3%) 5,411 5,194 (4.0%)
Financing Expenses 546 631 15.6% 2,453 2,549 3.9%
Results of associated companies (2) 20 (2) 66
Net income before taxes 962 169 (82.4%) 2,957 2,711 (8.3%)
% NS 4.9% 0.9% 3.9% 3.6%
Taxes 86 54 (37.0%) 963 860 (10.8%)
Effective tax rate 9.0% 32.1% 32.6% 31.7%
Net Income 875 115 (86.9%) 1,994 1,851 (7.1%)
% NS 4.5% 0.6% 2.6% 2.4%
Controlling Net Income 854 115 (86.5%) 1,908 1,851 (3.0%)
% NS 4.4% 0.6% 2.5% 2.4%
CONSOLIDATED
FINANCIAL POSITION
Capital Investment: As of December 31, 2019, the Company invested $1,641 million pesos in capacity expansion and
maintenance Capex. This represents a Capex over Sales ratio of 2.2% for the full year 2019.
Cash and Cash Equivalents: As of December 31, 2019, Grupo LALA had a cash position of $1,533 million pesos, negatively
affected by $132 million pesos associated with the deconsolidation of the Elopak JV.
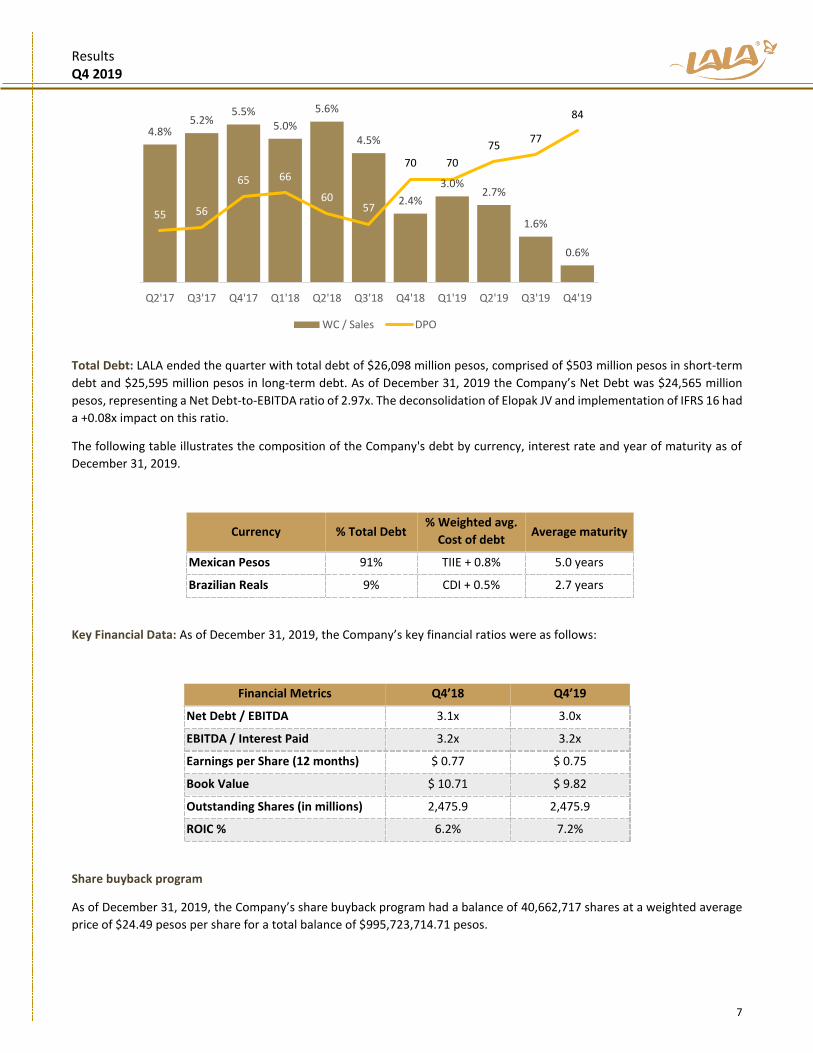
Working Capital: As of December 31, 2019, LALA’s consolidated working capital over sales ratio improved by -180 bps year-
on-year, to reach 0.6%, driven by a negative working capital ratio of -1.5% of sales achieved in Mexico.
Results Q4 2019
7
Total Debt: LALA ended the quarter with total debt of $26,098 million pesos, comprised of $503 million pesos in short-term
debt and $25,595 million pesos in long-term debt. As of December 31, 2019 the Company’s Net Debt was $24,565 million
pesos, representing a Net Debt-to-EBITDA ratio of 2.97x. The deconsolidation of Elopak JV and implementation of IFRS 16 had
a +0.08x impact on this ratio.
The following table illustrates the composition of the Company's debt by currency, interest rate and year of maturity as of
December 31, 2019.
Currency % Total Debt % Weighted avg.
Cost of debt Average maturity
Mexican Pesos 91% TIIE + 0.8% 5.0 years
Brazilian Reals 9% CDI + 0.5% 2.7 years
Key Financial Data: As of December 31, 2019, the Company’s key financial ratios were as follows:
Financial Metrics Q4’18 Q4’19
Net Debt / EBITDA 3.1x 3.0x
EBITDA / Interest Paid 3.2x 3.2x
Earnings per Share (12 months) $ 0.77 $ 0.75
Book Value $ 10.71 $ 9.82
Outstanding Shares (in millions) 2,475.9 2,475.9
ROIC % 6.2% 7.2%
Share buyback program
As of December 31, 2019, the Company’s share buyback program had a balance of 40,662,717 shares at a weighted average
price of $24.49 pesos per share for a total balance of $995,723,714.71 pesos.
4.8%5.2%
5.5%5.0%
5.6%
4.5%
2.4%
3.0%2.7%
1.6%
0.6%
55 56
65 66
6057
70 70
7577
84
40
45
50
55
60
65
70
75
80
85
90
0.0%
1.0%
2.0%
3.0%
4.0%
5.0%
6.0%
Q2'17 Q3'17 Q4'17 Q1'18 Q2'18 Q3'18 Q4'18 Q1'19 Q2'19 Q3'19 Q4'19
WC / Sales DPO
Results Q4 2019
8
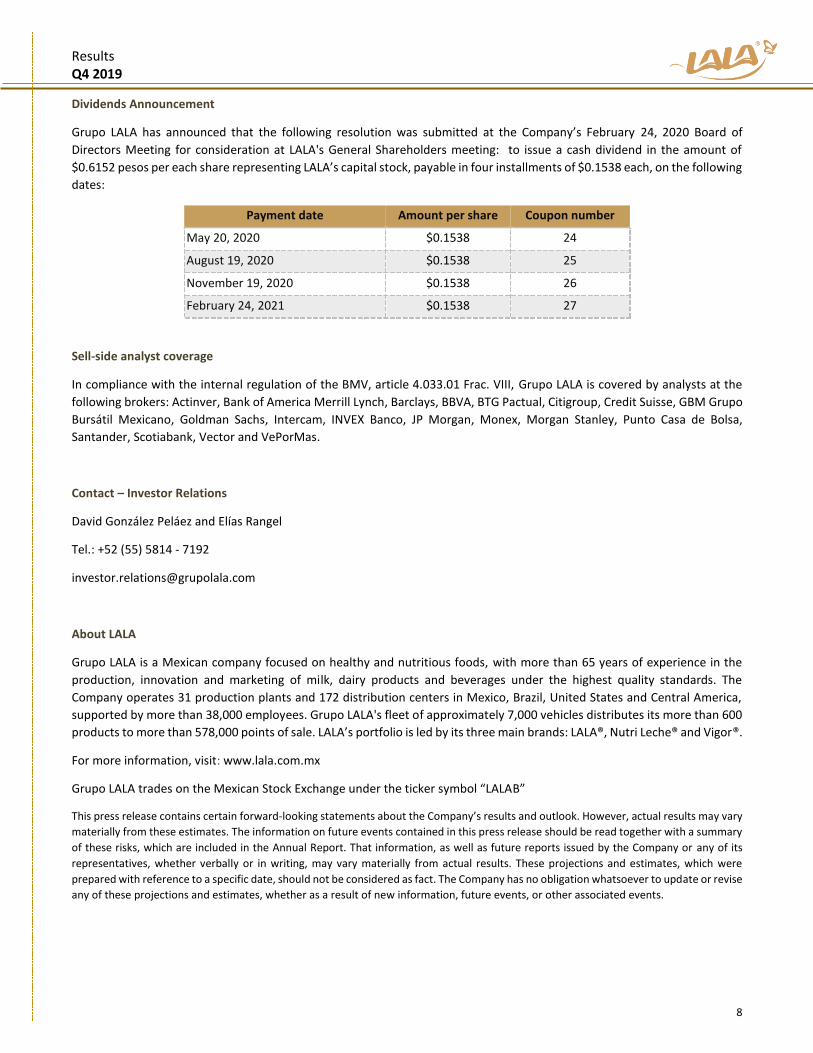
Dividends Announcement
Grupo LALA has announced that the following resolution was submitted at the Company’s February 24, 2020 Board of
Directors Meeting for consideration at LALA's General Shareholders meeting: to issue a cash dividend in the amount of
$0.6152 pesos per each share representing LALA’s capital stock, payable in four installments of $0.1538 each, on the following
dates:
Payment date Amount per share Coupon number
May 20, 2020 $0.1538 24
August 19, 2020 $0.1538 25
November 19, 2020 $0.1538 26
February 24, 2021 $0.1538 27
Sell-side analyst coverage
In compliance with the internal regulation of the BMV, article 4.033.01 Frac. VIII, Grupo LALA is covered by analysts at the
following brokers: Actinver, Bank of America Merrill Lynch, Barclays, BBVA, BTG Pactual, Citigroup, Credit Suisse, GBM Grupo
Bursátil Mexicano, Goldman Sachs, Intercam, INVEX Banco, JP Morgan, Monex, Morgan Stanley, Punto Casa de Bolsa,
Santander, Scotiabank, Vector and VePorMas.
Contact – Investor Relations
David González Peláez and Elías Rangel
Tel.: +52 (55) 5814 - 7192
About LALA
Grupo LALA is a Mexican company focused on healthy and nutritious foods, with more than 65 years of experience in the
production, innovation and marketing of milk, dairy products and beverages under the highest quality standards. The
Company operates 31 production plants and 172 distribution centers in Mexico, Brazil, United States and Central America,
supported by more than 38,000 employees. Grupo LALA's fleet of approximately 7,000 vehicles distributes its more than 600
products to more than 578,000 points of sale. LALA’s portfolio is led by its three main brands: LALA®, Nutri Leche® and Vigor®.
For more information, visit: www.lala.com.mx
Grupo LALA trades on the Mexican Stock Exchange under the ticker symbol “LALAB”
This press release contains certain forward-looking statements about the Company’s results and outlook. However, actual results may vary
materially from these estimates. The information on future events contained in this press release should be read together with a summary
of these risks, which are included in the Annual Report. That information, as well as future reports issued by the Company or any of its
representatives, whether verbally or in writing, may vary materially from actual results. These projections and estimates, which were
prepared with reference to a specific date, should not be considered as fact. The Company has no obligation whatsoever to update or revise
any of these projections and estimates, whether as a result of new information, future events, or other associated events.

Results Q4 2019
9
CONFERENCE CALL INFORMATION
Tuesday February 25, 2019, at 11:00am EST / 10:00am CST
Arquímedes Celis, Chief Executive Officer Alberto Arellano, Chief Financial Officer
David González, Investor Relations Officer
Webcast: http://public.viavid.com/index.
php?id=137875
United States: +1 877 705 6003
(Toll-free)
To participate, please dial-in ten minutes ahead of the scheduled time.
International: +1 201 493 6725 Mexico:
01 800 522 0034
To Access the replay service (1 week), please dial:
United States: +1 844 512 2921
(Toll-free)
International: +1 412 317 6671
PIN #: 13698568
WWW
Results Q4 2019
10
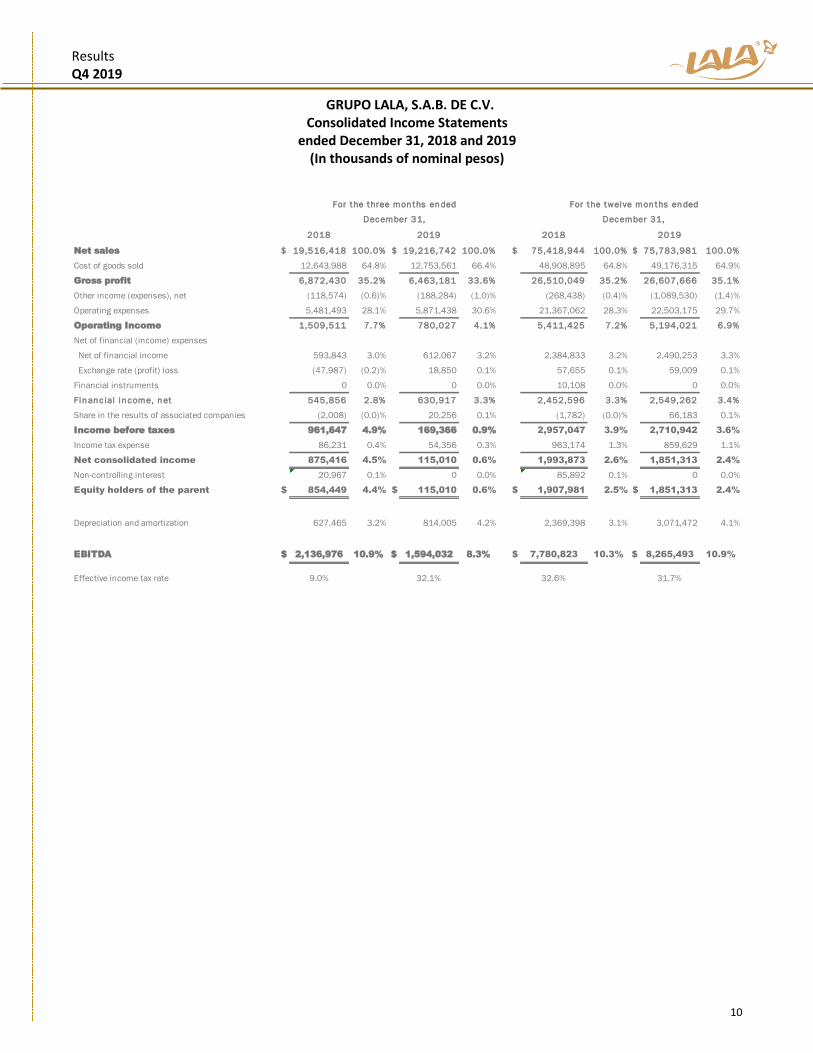
GRUPO LALA, S.A.B. DE C.V. Consolidated Income Statements
ended December 31, 2018 and 2019 (In thousands of nominal pesos)
For the three months ended For the twelve months ended
December 31, December 31,
2018 2019 2018 2019
Net sales $ 19,516,418 100.0% $ 19,216,742 100.0% $ 75,418,944 100.0% $ 75,783,981 100.0%
Cost of goods sold 12,643,988 64.8% 12,753,561 66.4% 48,908,895 64.8% 49,176,315 64.9%
Gross profit 6,872,430 35.2% 6,463,181 33.6% 26,510,049 35.2% 26,607,666 35.1%
Other income (expenses), net (118,574) (0.6)% (188,284) (1.0)% (268,438) (0.4)% (1,089,530) (1.4)%
Operating expenses 5,481,493 28.1% 5,871,438 30.6% 21,367,062 28.3% 22,503,175 29.7%
Operating Income 1,509,511 7.7% 780,027 4.1% 5,411,425 7.2% 5,194,021 6.9%
Net of financial (income) expenses
Net of financial income 593,843 3.0% 612,067 3.2% 2,384,833 3.2% 2,490,253 3.3%
Exchange rate (profit) loss (47,987) (0.2)% 18,850 0.1% 57,655 0.1% 59,009 0.1%
Financial instruments 0 0.0% 0 0.0% 10,108 0.0% 0 0.0%
Financ ial income, net 545,856 2.8% 630,917 3.3% 2,452,596 3.3% 2,549,262 3.4%
Share in the results of associated companies (2,008) (0.0)% 20,256 0.1% (1,782) (0.0)% 66,183 0.1%
Income before taxes 961,647 4.9% 169,366 0.9% 2,957,047 3.9% 2,710,942 3.6%
Income tax expense 86,231 0.4% 54,356 0.3% 963,174 1.3% 859,629 1.1%
Net consolidated income 875,416 4.5% 115,010 0.6% 1,993,873 2.6% 1,851,313 2.4%
Non-controlling interest 20,967 0.1% 0 0.0% 85,892 0.1% 0 0.0%
Equity holders of the parent $ 854,449 4.4% $ 115,010 0.6% $ 1,907,981 2.5% $ 1,851,313 2.4%
Depreciation and amortization 627,465 3.2% 814,005 4.2% 2,369,398 3.1% 3,071,472 4.1%
EBITDA $ 2,136,976 10.9% $ 1,594,032 8.3% $ 7,780,823 10.3% $ 8,265,493 10.9%
Effective income tax rate 9.0% 32.1% 32.6% 31.7%

Results Q4 2019
11
GRUPO LALA, S.A.B. DE C.V. Consolidated Statement of Financial Position
at December 31, 2018 and 2019 (In thousands of nominal pesos)
As o f December
31, 2018
As o f December
31, 2019
ASSETS
Cash and cash equivalents $ 2,550,118 $ 1,532,950
Investments in financial instruments 281,443 16,686
Accounts receivable 6,445,296 6,282,373
Taxes and other accounts receivable 4,043,929 4,326,395
Related parties 27,404 29,938
Inventories 5,218,883 6,047,261
Prepaid expenses 470,173 251,383
Curren t asses ts 19,037,247 18,486,986
Investments in associates 129,839 538,086
Property, plant and equipment, net 22,277,358 21,386,028
Right of use assets 0 2,710,523
Intangible and other assets 11,989,859 9,989,505
Goodwill 19,139,103 17,871,869
Long term recoverable taxes 1,615,950 1,374,149
Financial instruments investments 151,452 0
Deferred income tax 1,428,156 1,691,461
Non -cu rren t assets 56,731,717 55,561,621
Total assets $ 75,768,964 $ 74,048,607
LIABILITIES
short-term loans $ 1,654,051 $ 476,339
current portion of long-term debt 939,015 26,621
Current lease liabilities 0 605,689
Suppliers 8,780,879 10,824,349
Financial instruments liability 5,710 87,324
Related parties 475,902 477,138
Stockholders 1,081,349 1,073,787
Taxes and other accounts payable 3,537,215 4,073,849
Current liabilities 16,474,121 17,645,096
Non Current Long Liabilities 0 2,181,392
Long-term debt 23,906,156 25,595,073
Deferred income tax and other taxes payable 2,224,168 998,169
Taxes payable in the long term 726,743 510,030
Derivative finantial instruments 0 200,446
Other accounts payable 6,867,699 4,335,522
Long-term l iabi l i t ies 33,724,766 33,820,632
Total l iabi l i t ies 50,198,887 51,465,728
SHAREHOLDERS EQUITY
Capital Stock 1,487,567 1,487,073
Net premium in share placement 12,734,483 12,564,470
Retained earnings 12,155,610 12,094,073
Other comprehensive income -3,070,732 -5,414,050
Income of the year 1,907,981 1,851,313
Equ ity at t r ibu table to equ i ty holders of the paren t 25,214,909 22,582,879
Non-controlling interest 355,168 0
Total shareholders equ i ty 25,570,077 22,582,879
Total l iabi l i t ies and shareholders equ i ty $ 75,768,964 $ 74,048,607

Results Q4 2019
12
GRUPO LALA, S.A.B. DE C.V. Consolidated Cash Flow Statement
for the 12 months ended December 31, 2018 and 2019 (In thousands of nominal pesos)
Operating activities:
Income before taxes $ 2,957,049 $ 2,710,942
Depreciation, amortization, and trademarks impairment 2,369,398 3,071,472
Changes in net financial expenses (income) 2,287,486 2,454,499
Results from the sale of property, plant and equipment 6,769 (57,726)
Result on disposal of Associates 0 0
Participation in associates 1,782 (66,183)
Total 7,622,484 8,113,004
Changes in operation assets and liabilities
Accounts receivable (281,220) (80,423)
Inventories 103,332 (1,225,634)
Related parties 1,105,558 (4,615)
Suppliers 1,748,603 2,176,931
Other accounts receivable and prepaid expenses (625,140) (443,460)
Other assets and liabilities (203,290) (547,995)
Total 1,847,844 (125,198)
Net cash flow provided by operating activities 6,753,384 5,871,028
Investing activities
Acquisition of property, plant, equipment, and intangibles (2,434,936) (1,640,906)
Acquisition of intangibles and other assets (151,390) (380,312)
Proceeds from sale of property, plant, and equipment 171,566 92,637
Dividends collected from associates 76,500
Investments in Financial instruments (3,763) (3,478)
Interest collected 220,732 127,839
Cash received by sale of associates and adjustment to the sale price (59,837) 0
Cash received on the sale of investments 0 (131,973)
Net cash flow used in investing activities (2,001,386) (1,859,692)
Financing activities
Loans obtained 45,007,049 31,705,585
Repayments of borrowings to third parties (49,075,597) (31,958,690)
Interest paid (2,435,694) (2,549,123)
Payment of lease liabilities (4,731) (719,978)
Reissuance (repurchase) of capital stock (356,857) (170,507)
Dividends paid to equity holders of the parent (1,505,963) (1,497,738)
Net cash flows provided (used) in financing activities $ (8,477,631) $ (5,190,452)
Net increase of cash and equivalents (3,725,633) (1,179,116)
Adjustments to cash due to exchange rate fluctuations (457,630) 161,948
Cash and equivalents at beginning of the year 6,733,382 2,550,118
Cash and equivalents at the end of the period $ 2,550,120 $ 1,532,950
As of December
31, 2018
As of December
31, 2019