haemodynamic monitoring ( iabp, cvp, co )
DESCRIPTION
HAEMODYNAMIC MONITORING ( IABP, CVP, CO ). Al jadidi S ulaiman Moderator: Dr Nik Azman. Haemodynamic monitoring. It is the measurement of haemodynamic status Haemodynamic status is an index of pressure & flow within cardiovascular system – pulmonary & systemic circulations. - PowerPoint PPT PresentationTRANSCRIPT
HAEMODYNAMIC MONITORING( IABP, CVP, CO )
Al jadidi Sulaiman Moderator: Dr Nik Azman
It is the measurement of haemodynamic
status
Haemodynamic status is an index of pressure
& flow within cardiovascular system –
pulmonary & systemic circulations
Haemodynamic monitoring..
Haemodynamic measurement are important
to establish – precise diagnosis - determine appropriate therapy - monitor response to therapy Extent of monitoring depends on how much
data is required to optimise pt’s condition, & how precisely data is to be recorded
Introduction
Early detection, identification, and treatment
of life-threatening conditions such as heart failure and cardiac tamponade
Evaluate the patient’s immediate response to treatment such as drugs and mechanical support
Evaluate the effectiveness of cardiovascular function such as cardiac output and index
Purpose of monitoring..
Previous experience using similar monitoring
technique was shown to be beneficial Next level – understanding the
pathophysiology of process being treated, such as heart failure or hypovolemic shock
Rationale for haemodynamic monitoring
(1)Diagnostic
causes of patient’s pathophysiological condition
(2)Therapeutic base on the index & clinical situation, specific
therapy & treatments are prescribed
(3)Research assess efficacy of new therapy
Indication
Any deficit or loss of cardiac function: such
as AMI,CHF,Cardiomyopathy
All types of shock;cardiogenic,neurogenic,or anaphylactic
Decreased urine output from dehydration, hemorrhage,G.I. bleed,burns,or surgery
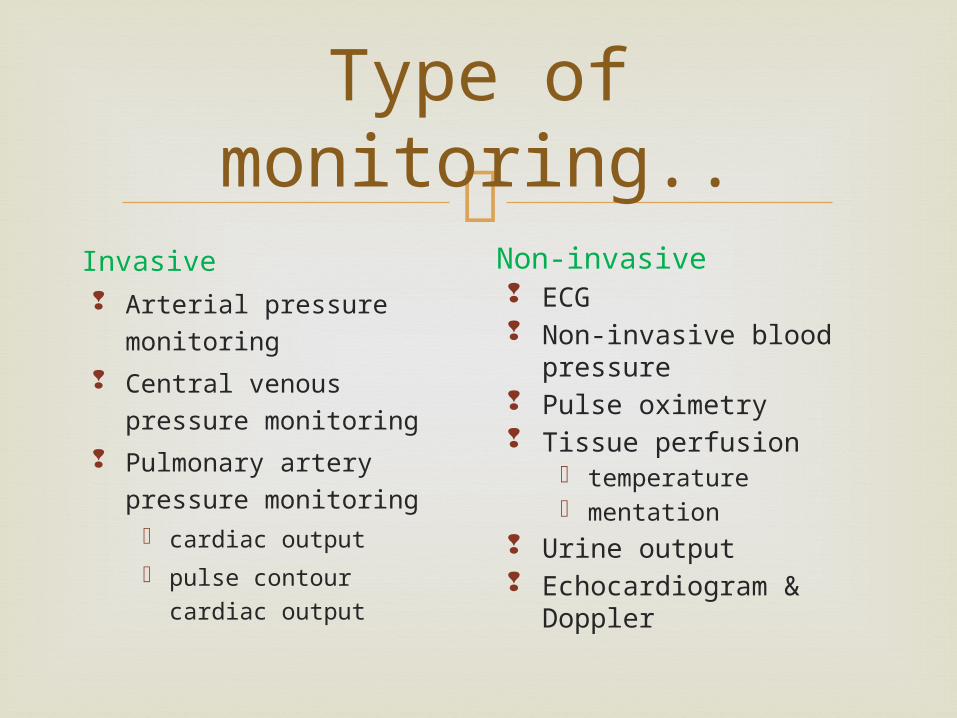
Type of monitoring..
Invasive Arterial pressure
monitoring
Central venous pressure monitoring
Pulmonary artery pressure monitoring
cardiac output
pulse contour cardiac output
Non-invasive ECG Non-invasive blood
pressure Pulse oximetry Tissue perfusion
temperature mentation
Urine output Echocardiogram &
Doppler
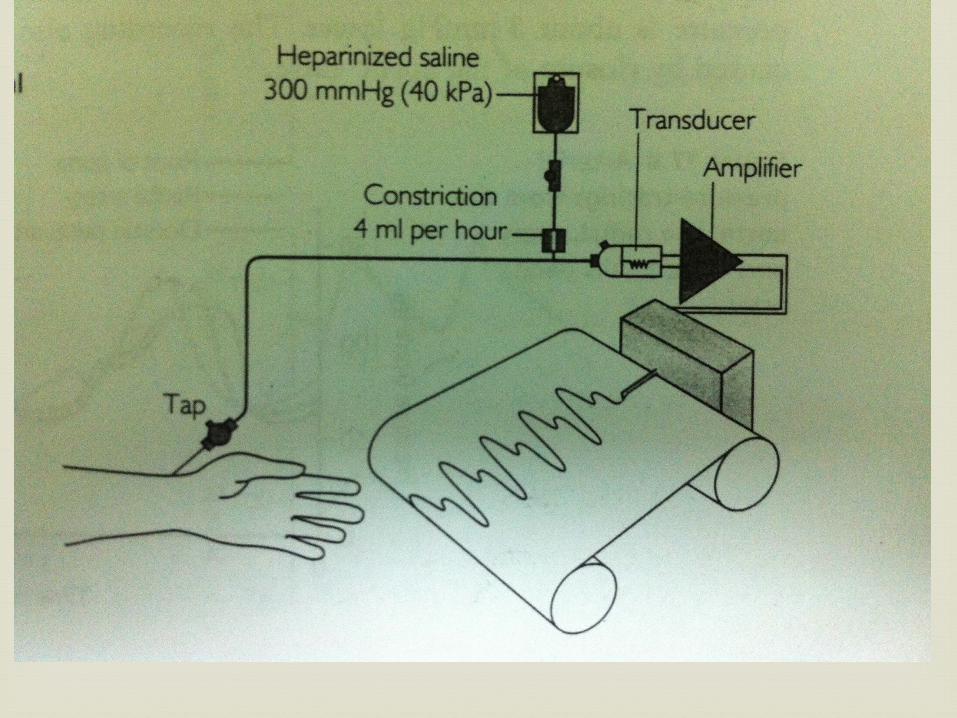
Access to an artery or vein
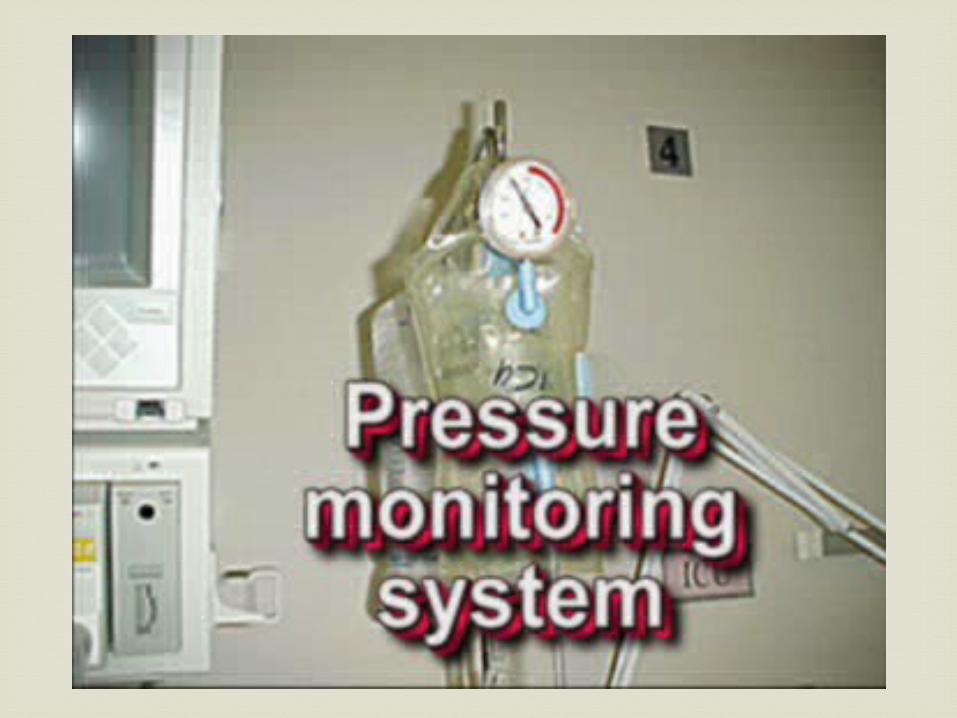
catheter connected to fluid filled pressure tubing & pressure transducer
connected to bedside monitor
continuous & accurate
fluctuation: positional
calibration drift
leveling
different sites
Invasive pressure monitor
For accurate Haemodynamic pressure
readings, two baseline measurements are
necessary:
1. Calibration of the system to atmospheric pressure
2. Determination of the phlebostatic axis for
transducer height placement
Calibration of equipment

To zero the equipment, turn 3-way stopcock
open to air (atmospheric pressure), close to patient and flush system. The monitor is adjusted so that “0” is displayed, which equals atmospheric pressure.
Return the stopcock to original position to visualize the waveform and haemodynamic pressures.
zero once every 8 hours.
Zeroing the equipment

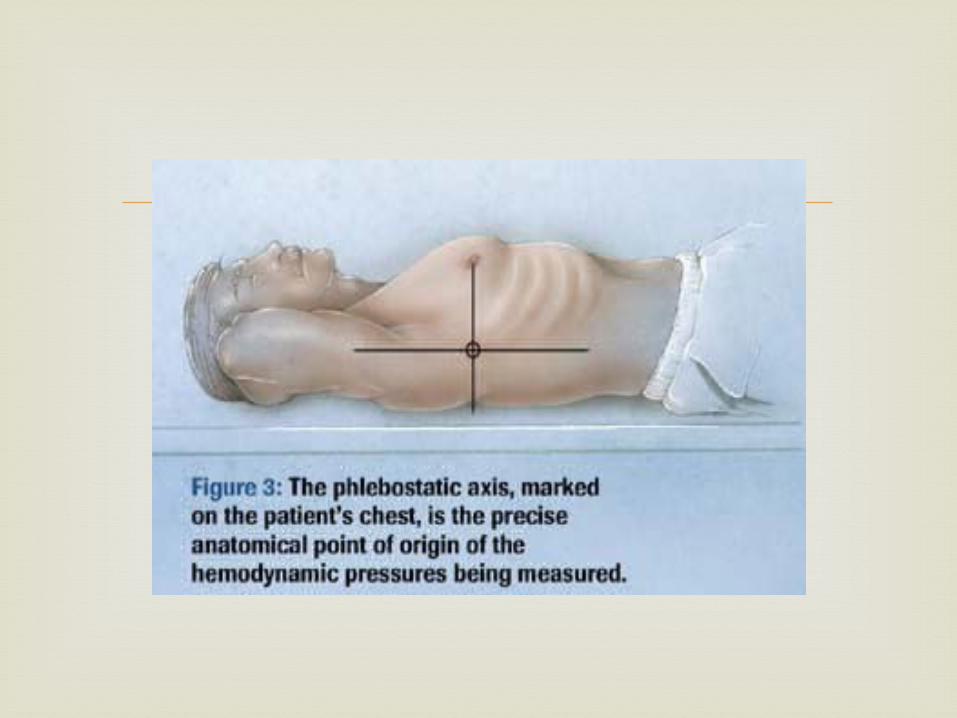
Left atrium - reference point on the chest Used as a baseline for consistent transducer
height placement. Obtaining the axis involves drawing a line
from the fourth intercostal space, where it joins the sternum, to a mid-axillary line.
The intersection of these lines approximates the level of the atria.
Phlebostatic Axis
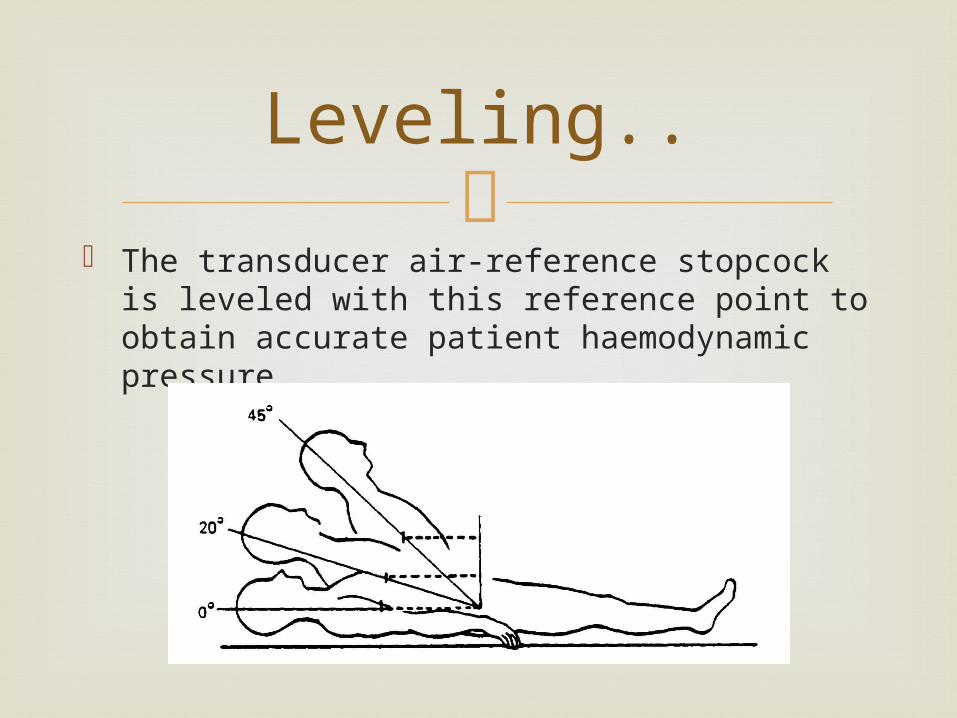
The transducer air-reference stopcock is
leveled with this reference point to obtain accurate patient haemodynamic pressure.
Leveling..
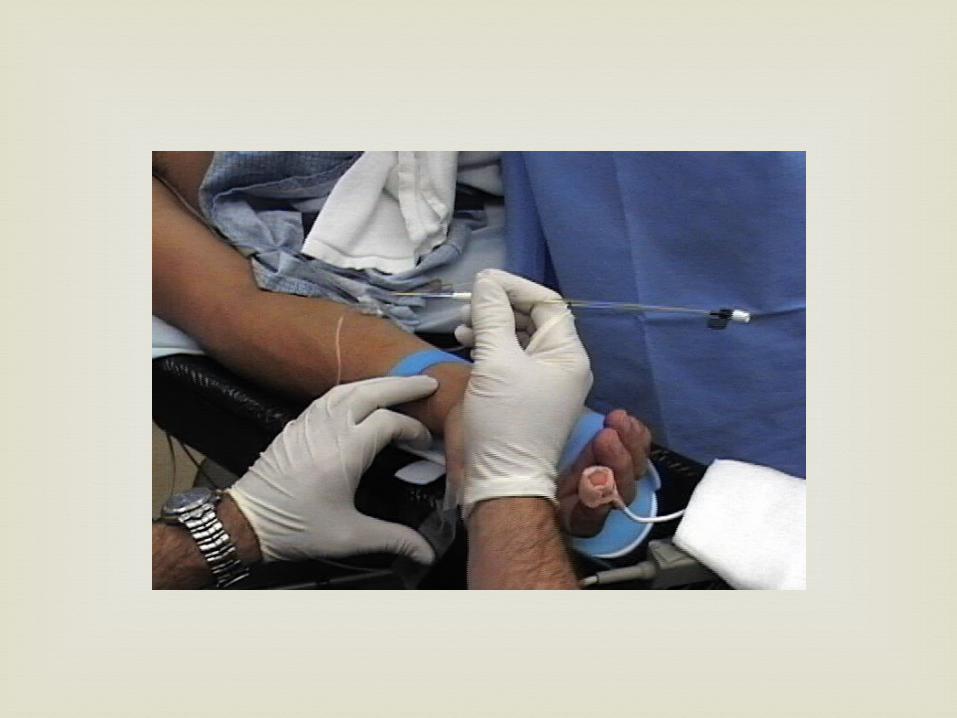
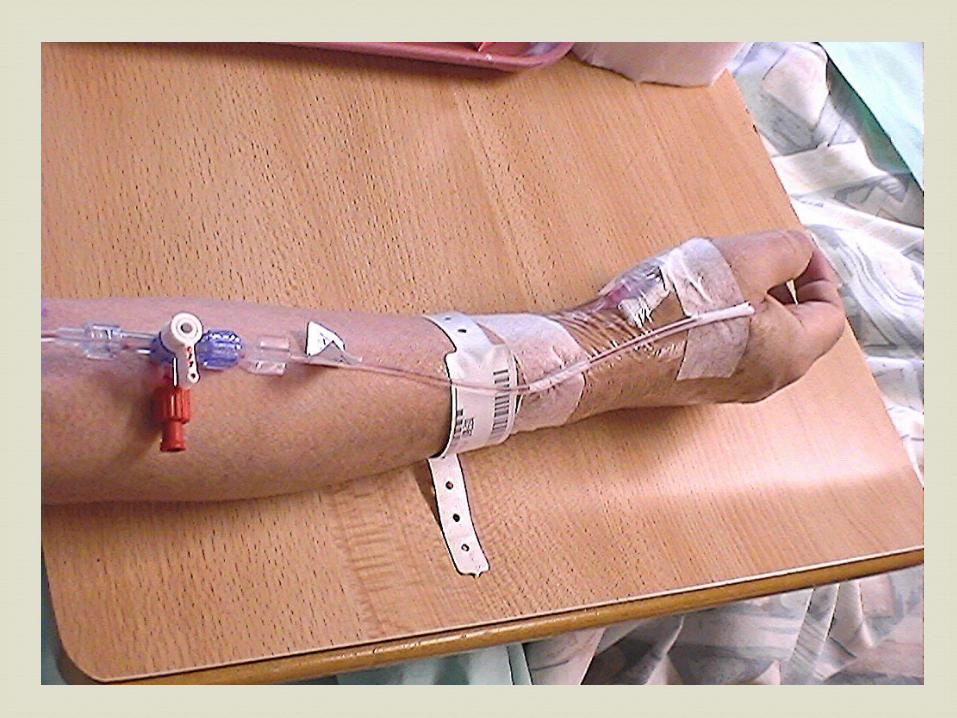
Cannulation of an artery & attaching the
catheter to a fluid-filled transducer system
Continuous assessment of arterial perfusion to
the major organ systems of the body.
Arterial Pressure Monitoring

Direct arterial blood pressure monitoring
enables accurate continuous pressure
measurement.
Allow easy blood sampling for acid-base and
other measurements.
Indication

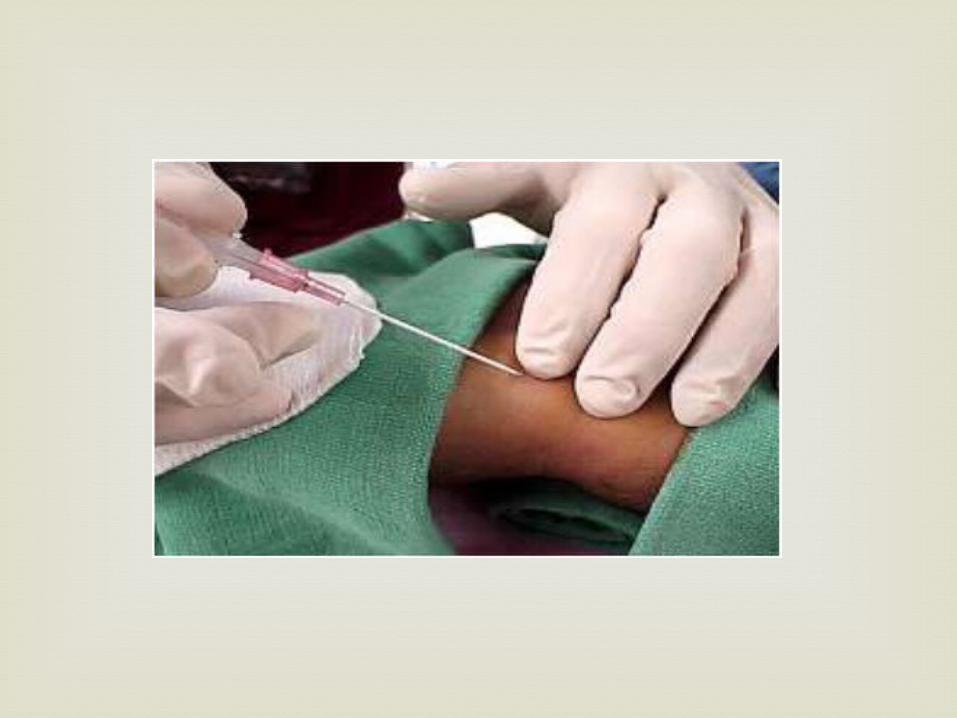
Usually the radial artery cannulation is used.
Other most common sites are dorsalis pedis,
brachial, femoral arteries.
Allen’s test should be performed before a
catheter is inserted into the radial artery to
ensure the presence of adequate collateral
circulation to the hand by the ulnar artery.
Arterial Line Insertion And Sites
Both the ulnar and radial arteries are
occluded.
Ask the patient to clench and unclench
the fist until the hand is blanched.
Release pressure on the ulnar artery only
and observe for color return to the hand.
Allen’s Test

If colour returns within 5-7 seconds, the
ulnar circulation is adequate.
Ulnar circulation is considered inadequate if
the hand remains blanched for longer than
15 seconds. The radial artery should not be
cannulated.
Allen’s Test
Insertion should be performed under sterile
technique.
The connecting tubing should be assembled and
flushed and the transducer zeroed and calibrated
before the catheter is inserted.
Secured the catheter once it is in place.
Arterial Line Insertion And Sites
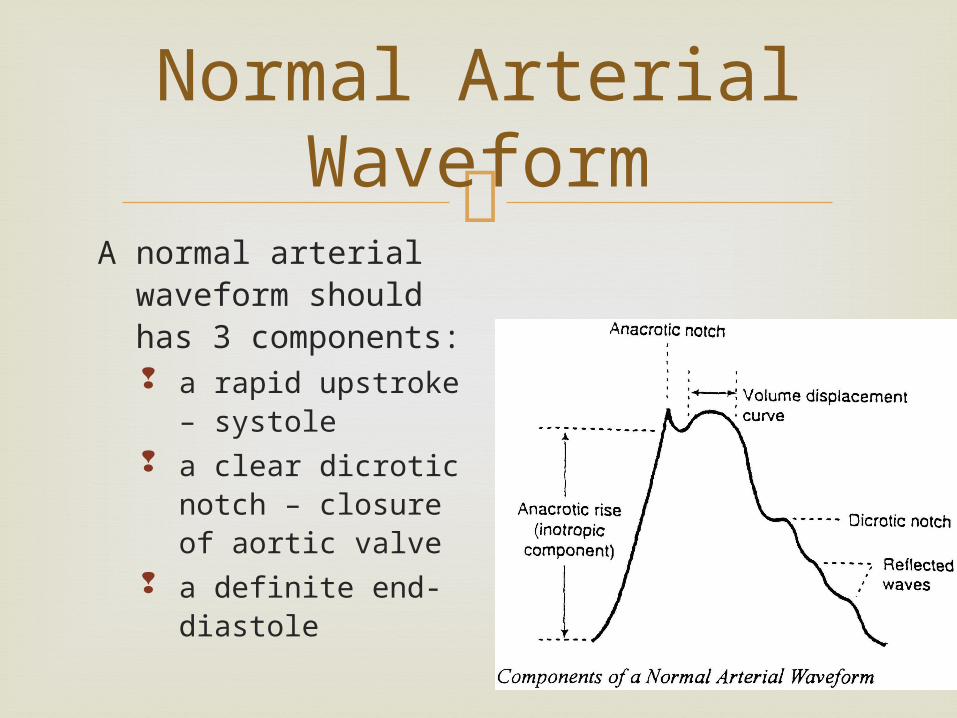
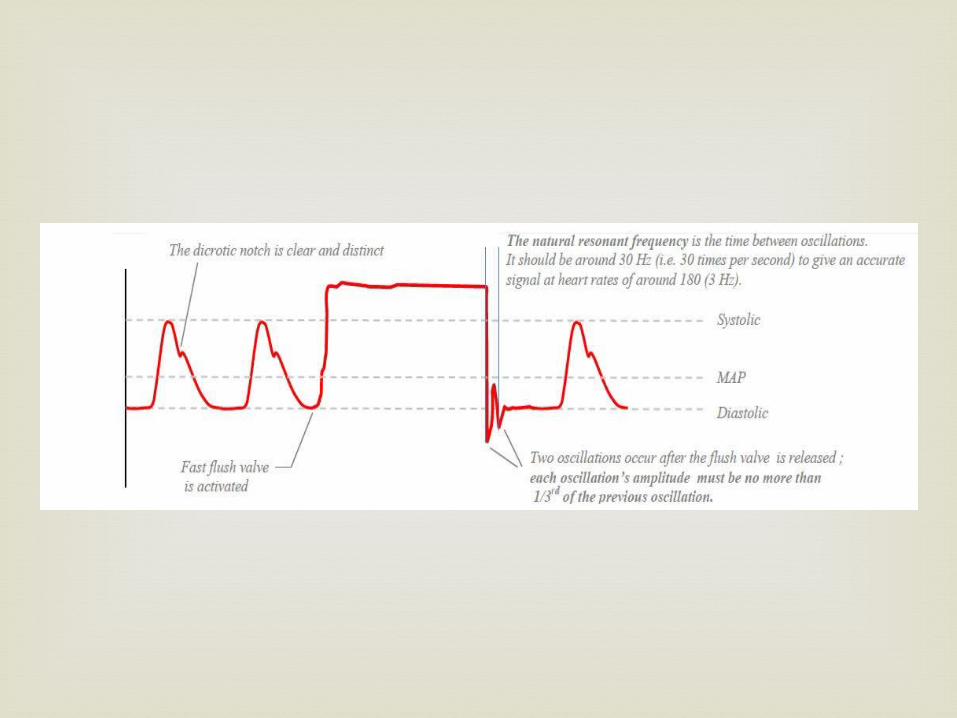
A normal arterial
waveform should has 3 components: a rapid upstroke –
systole a clear dicrotic
notch – closure of aortic valve
a definite end-diastole
Normal Arterial Waveform
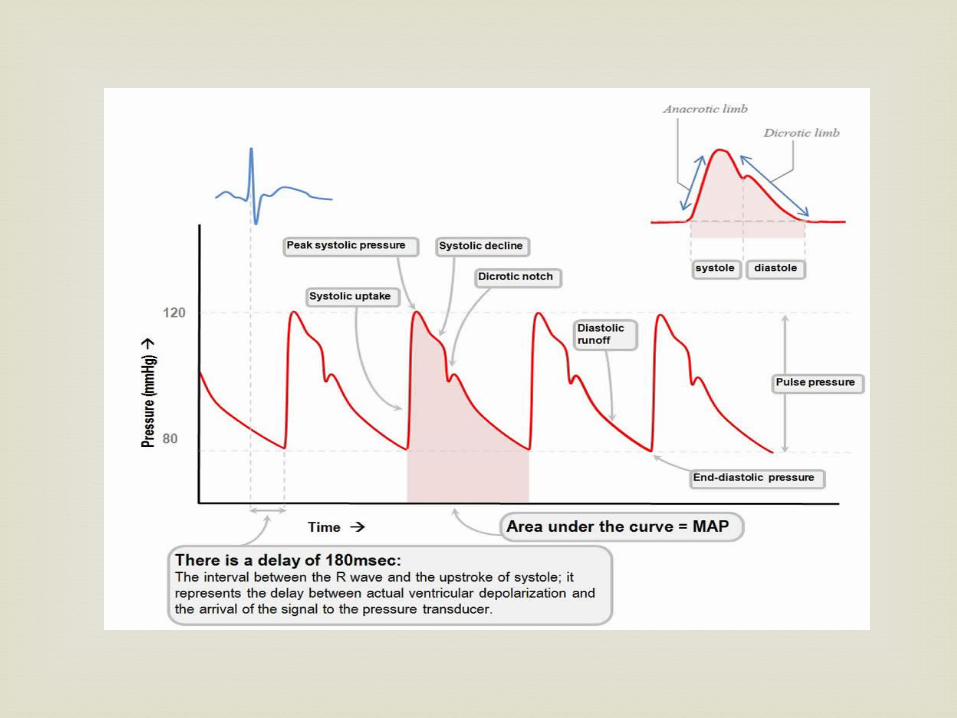
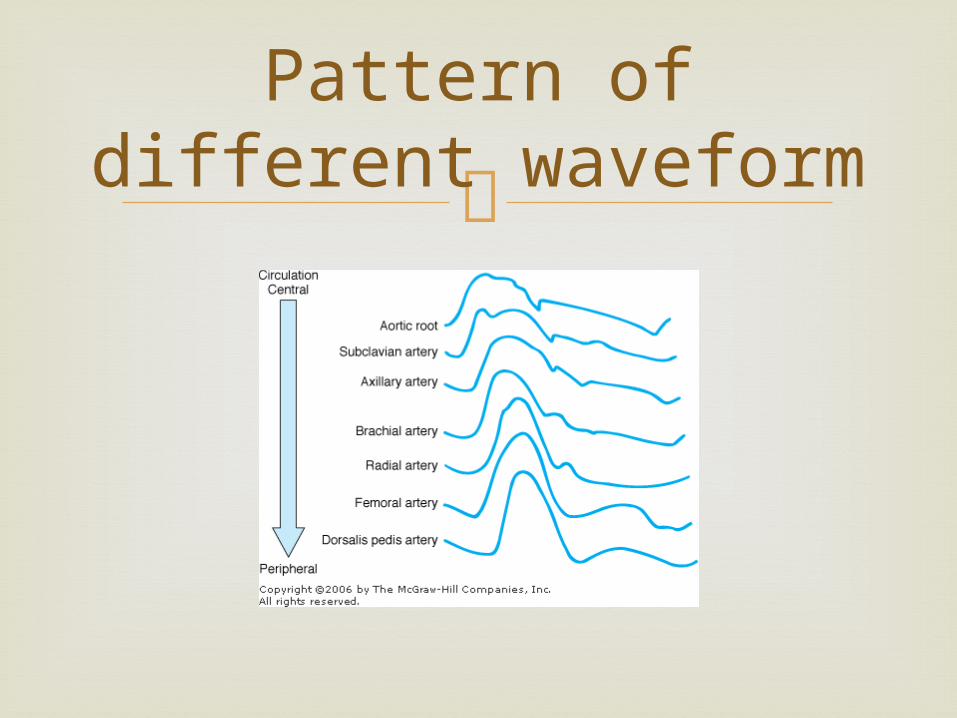
Pattern of different waveform
Direct intra-arterial measurement may
overestimate systolic pressure dt systolic overshoot
This is result of fluid-pressure transducer monitoring system
Can be overcome by ↑ damping of system ( ie by using smaller gauge cannula-transducer tubing)
Arterial pressure..

However, ↑ damping reduces the resonant
frequency, thus the sensitivity of the sytem. >30Hz for HR up to 180bpm >20Hz for HR up to 120bpm The tubing should be non-compliant & < 1 m
in length
Rough approx of SV, therefore CO can be
obtained from area under systolic pressure curve
However, correlation with CO assessed by thermodilution is poor, & the method is not sufficiently reliable for clinical decision-making
Derived variables..
Systolic time intervals are an indirect index of ventricular contractility
Pre ejection period (PEP) = interval from ventricular electrical activity (Q wave) ejection of blood from ventricle.
It consists of electromechanical delay btw the AP & initiation of ventricular contraction, and the isovolumetric contraction
PEP is inversely proportional to ventricular activity
Adequacy of preload.. The variation in arterial pressure is exaggerated
in the presence of reduced preload Significant correlation has been demonstrated
between the systolic arterial pressure variation & end-diastolic area estimated with TOE.
1. Ischaemia distal to cannula
-major sequalae a/w low CO, shock, sepsis,
prolonged cannulation, vasculitis &
hyperlipidaemia
2. Exsanguination
-flow thru 18G cannula can cause blood loss
of 500ml/min
3. spurious result
4. Infection
5. Intra-arterial injection of drug
Complication

The morbidity associated with arterial
cannulation is less than that associated with 5 or more arterial punctures!!

Prevention of blood loss
Prevention of local obstruction
prevention of air embolism
Prevention of sepsis
Accuracies
Nursing responsibilities
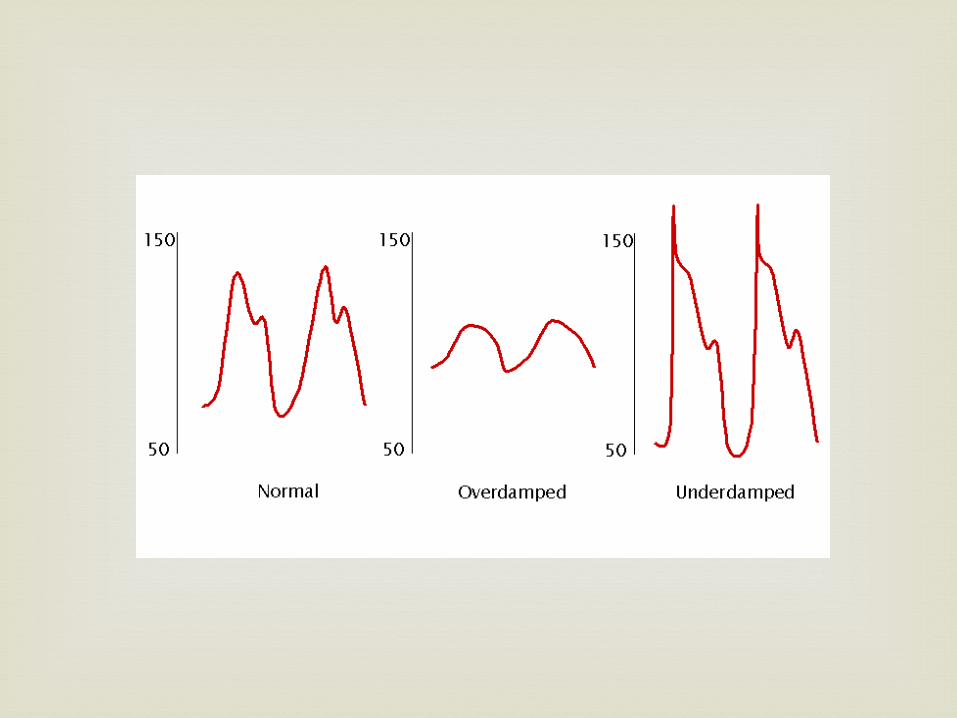
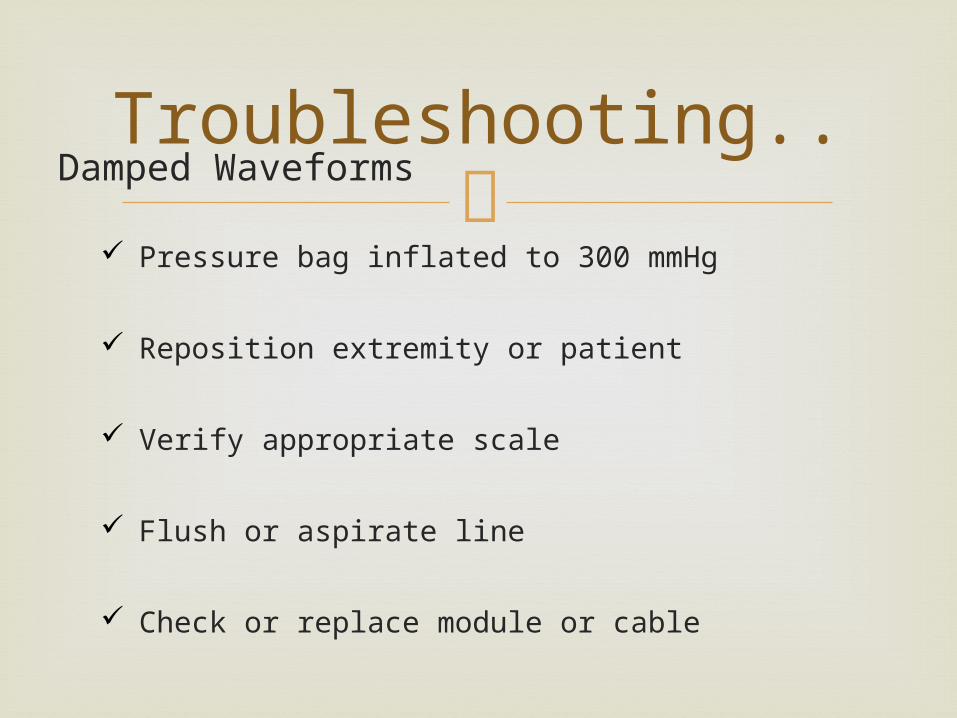
Damped Waveforms
Pressure bag inflated to 300 mmHg
Reposition extremity or patient
Verify appropriate scale
Flush or aspirate line
Check or replace module or cable
Troubleshooting..
Directly reflects RA pressure
Indirectly reflects the preload of the right
ventricle(RV) or RV end-diastolic pressure.
Determined by the interaction of venous
tone, central venous volume (blood
returning to the heart), and the pumping
ability of the heart
Central Venous Pressure Monitoring
CVP is measured in the superior vena cava or
the RA.
Normal ranges 4 – 12 cmH2O
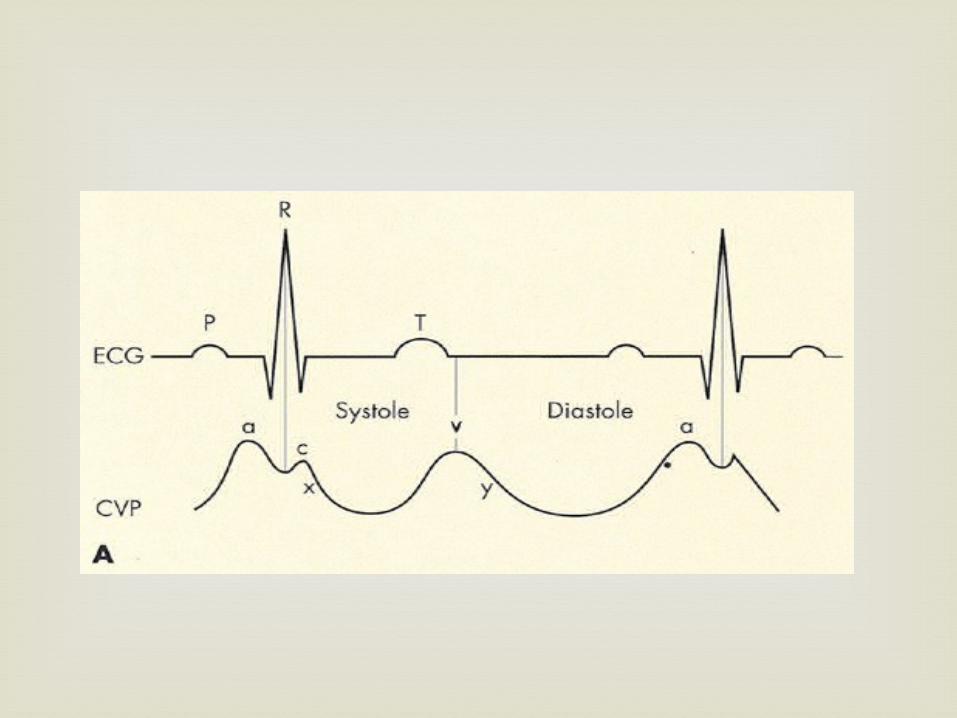
Central Venous Pressure
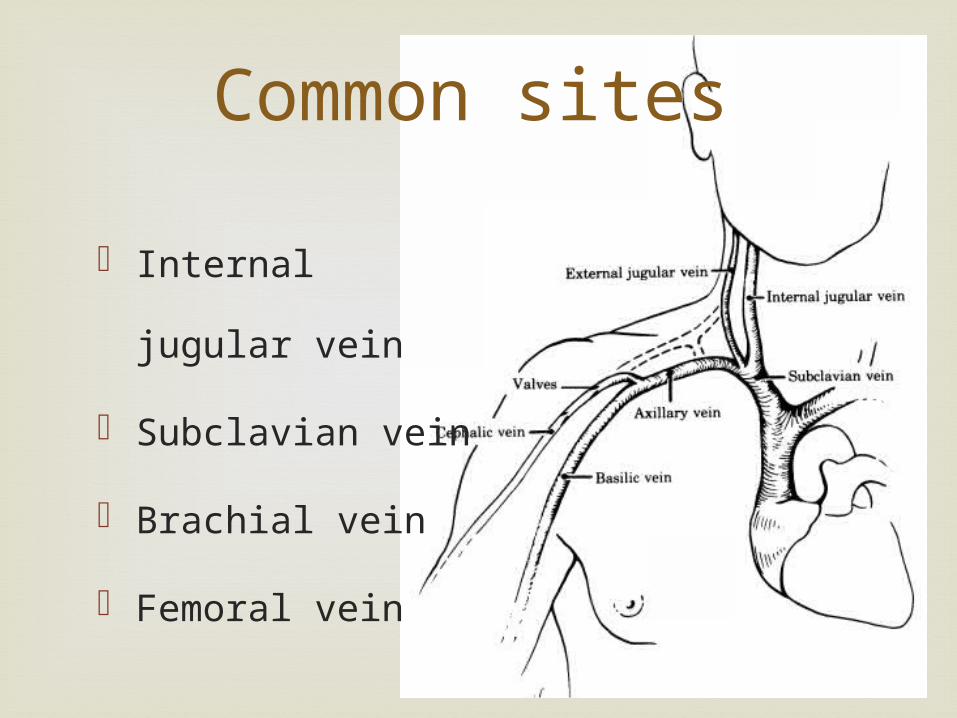
Common sites
Internal jugular
vein
Subclavian vein
Brachial vein
Femoral vein

The head is placed in a
dependent position (Trendelenburg),
which causes the internal jugular vein to
become more prominent, facilitating line
placement.
Position
A long intravenous catheter is inserted into the
large veins of the upper thorax (subclavian or
internal jugular) are most frequently used for
percutaneous CVP line insertion.
Catheter Placement
Threaded into position in the vena cava close
to the right atrium.
Correct placement confirmed by observing
pressure change with respiration, aspirating
blood freely thru catheter & CXR.
Catheter Placement
Measurement of central venous
pressure
Measurement of central venous
oxygenation
Parenteral nutrition
Administration of vasoactive and
inotropic agents
As a venous access when all IV sites
have been exhausted
Indication
CVP is used as guide to right ventricular filling However, right ventricular preload is determined
by EDV (not pressure) hence Isolated CVP reading is of limited value without
knowledge of ventricular compliance Compliance varies from patient to patient, & with
time in the same patient Thus dynamic changes in CVP are more useful
than absolute values.

If CVP ↑ <3mmHg in response to fluid challenge (eg 50-200ml of colloid over10min) more volume may be required
If CVP ↑ >7mmHg, fluid loading is then maximal If the CVP return to within 3mmHg of its original
value w/in 10min, risk of pulmonary oedema is moderate, no further filling is required
In most patients, adequate RV filling = LV filling,
except in lung disease with PHT, or in impaired RV fx (eg
severe sepsis & some patient with inferior MI)
CVP and PAOP are poor indicators for cardiac preload; they are the result of at least four components: Vascular filling Cardiac contractility Vascular compliance Intrathoracic pressure
They have wide normal ranges, large inter-individual scatter and low sensitivity for hypovolemia
Measuring errors may result from: Incorrect zero calibration, damping of pressure curve Positioning of the patient Ventilation (PEEP, ventilation phase, lung zone) Positioning of the catheter
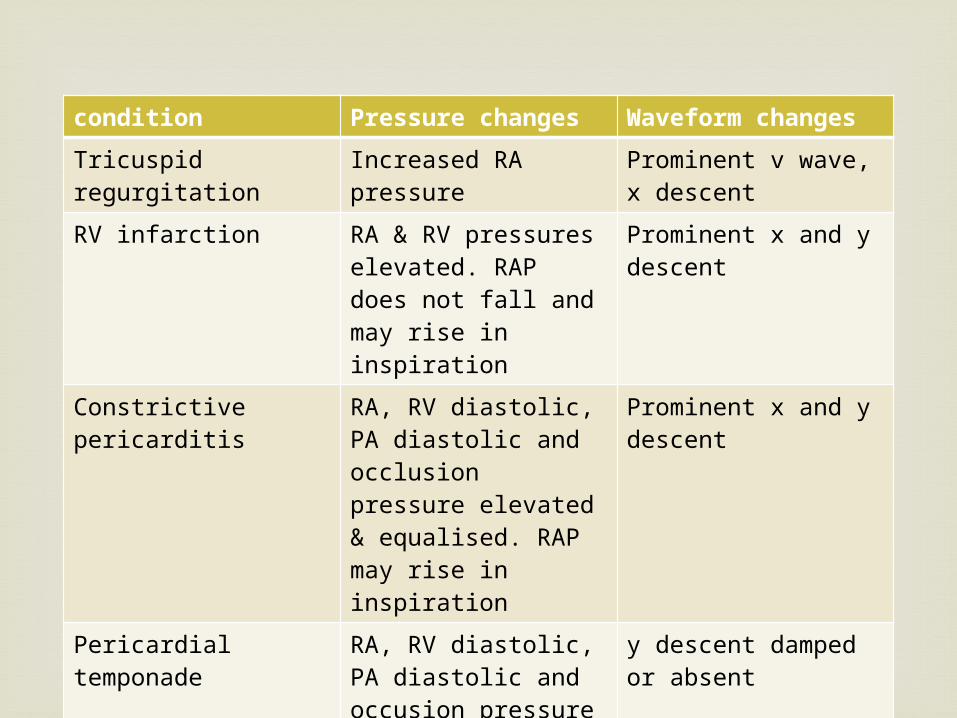
condition Pressure changes Waveform changes
Tricuspid regurgitation
Increased RA pressure
Prominent v wave, x descent
RV infarction RA & RV pressures elevated. RAP does not fall and may rise in inspiration
Prominent x and y descent
Constrictive pericarditis
RA, RV diastolic, PA diastolic and occlusion pressure elevated & equalised. RAP may rise in inspiration
Prominent x and y descent
Pericardial temponade
RA, RV diastolic, PA diastolic and occusion pressure elevated & equalised. RAP usually falls in inspiration
y descent damped or absent
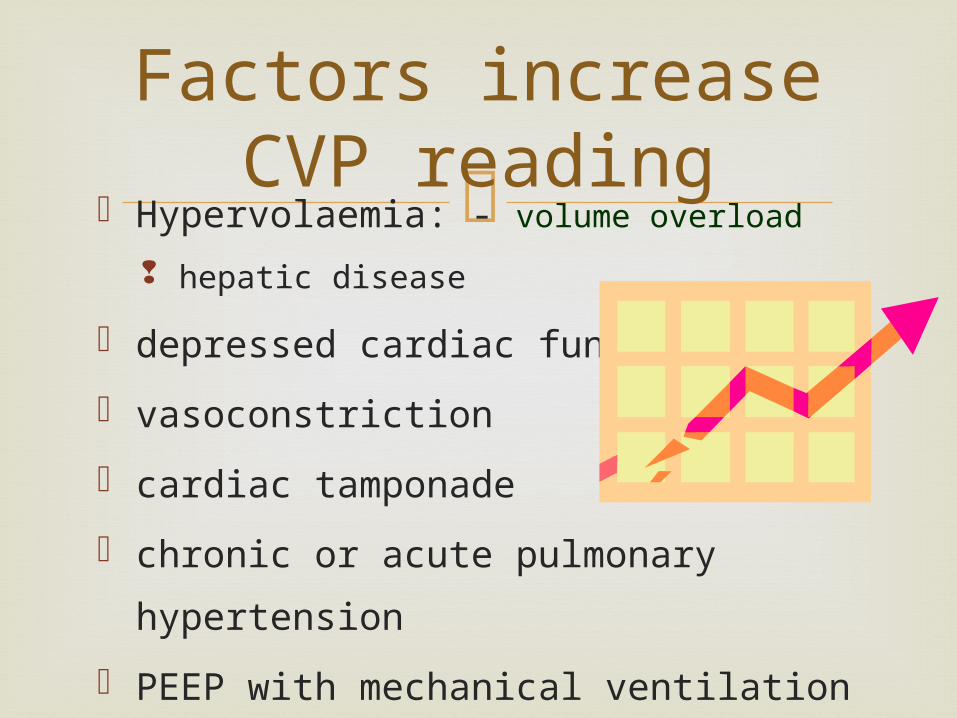
Hypervolaemia: - volume overload
hepatic disease
depressed cardiac function
vasoconstriction
cardiac tamponade
chronic or acute pulmonary hypertension
PEEP with mechanical ventilation
Factors increase CVP reading
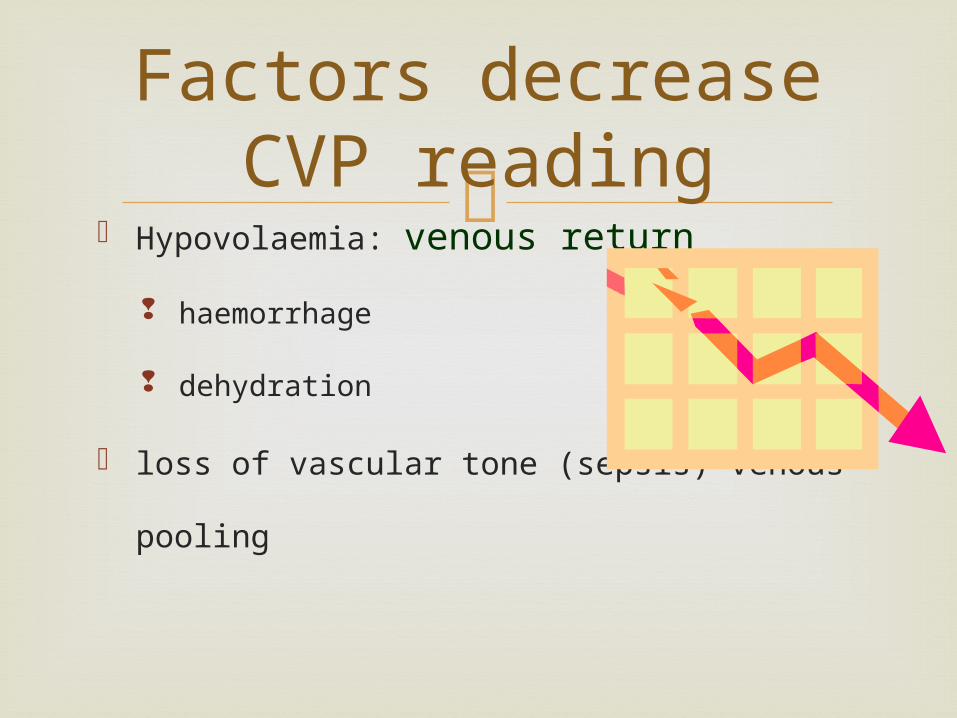
Hypovolaemia: venous return
haemorrhage
dehydration
loss of vascular tone (sepsis) venous pooling
Factors decrease CVP reading
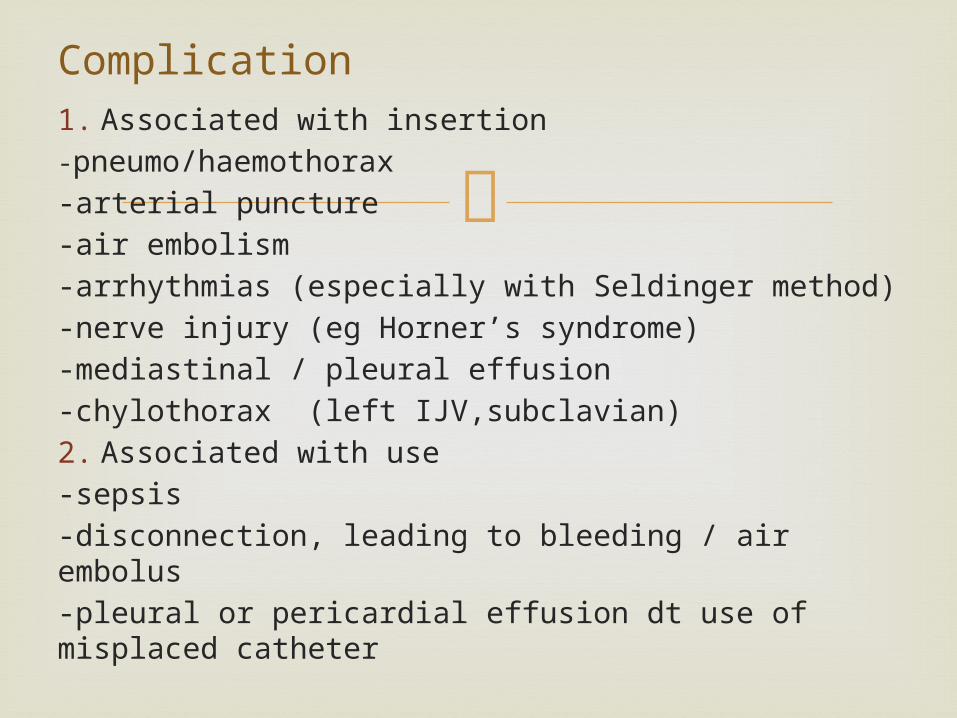
1. Associated with insertion-pneumo/haemothorax-arterial puncture-air embolism-arrhythmias (especially with Seldinger method)-nerve injury (eg Horner’s syndrome)-mediastinal / pleural effusion-chylothorax (left IJV,subclavian)2. Associated with use-sepsis-disconnection, leading to bleeding / air embolus-pleural or pericardial effusion dt use of misplaced catheter
Complication
Cardiac Output
Monitoring..
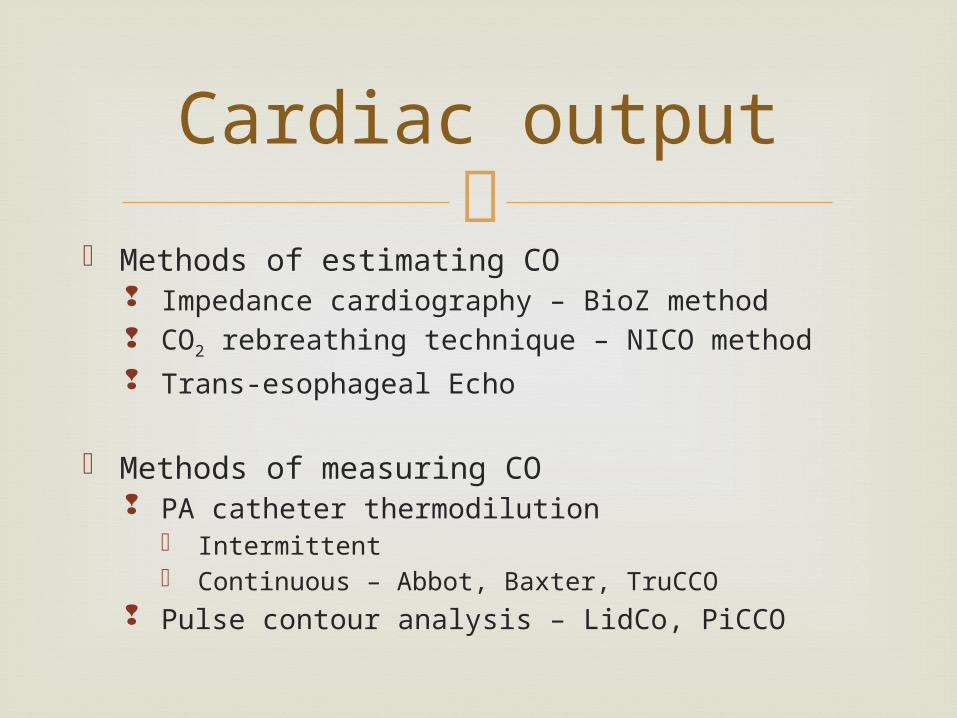
Methods of estimating CO
Impedance cardiography – BioZ method CO2 rebreathing technique – NICO method Trans-esophageal Echo
Methods of measuring CO PA catheter thermodilution
Intermittent Continuous – Abbot, Baxter, TruCCO
Pulse contour analysis – LidCo, PiCCO
Cardiac output
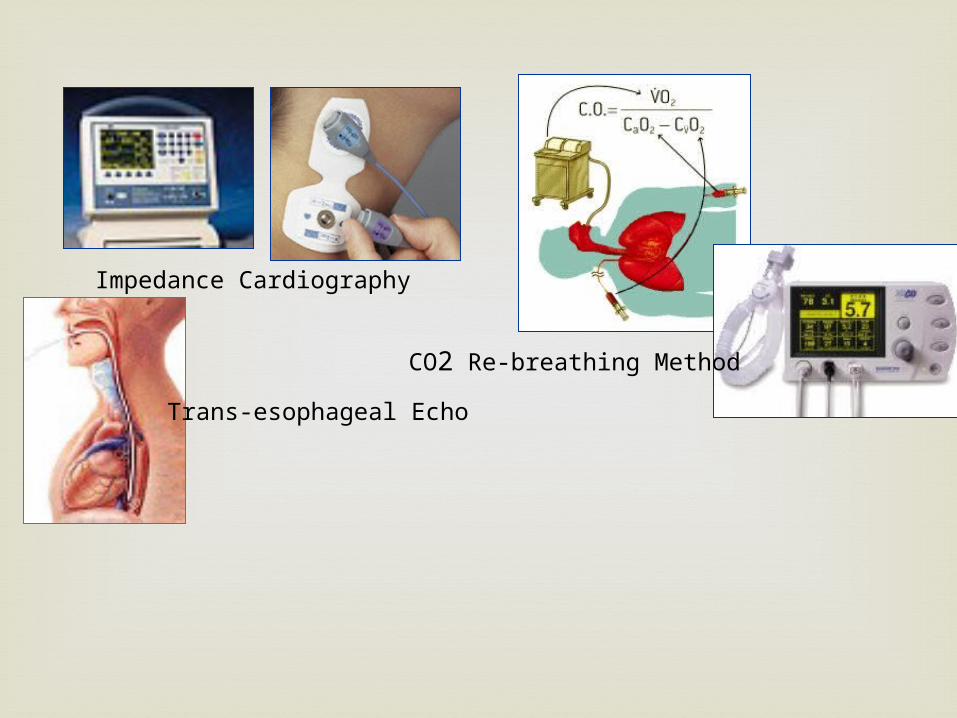
Impedance Cardiography
CO2 Re-breathing Method
Trans-esophageal Echo
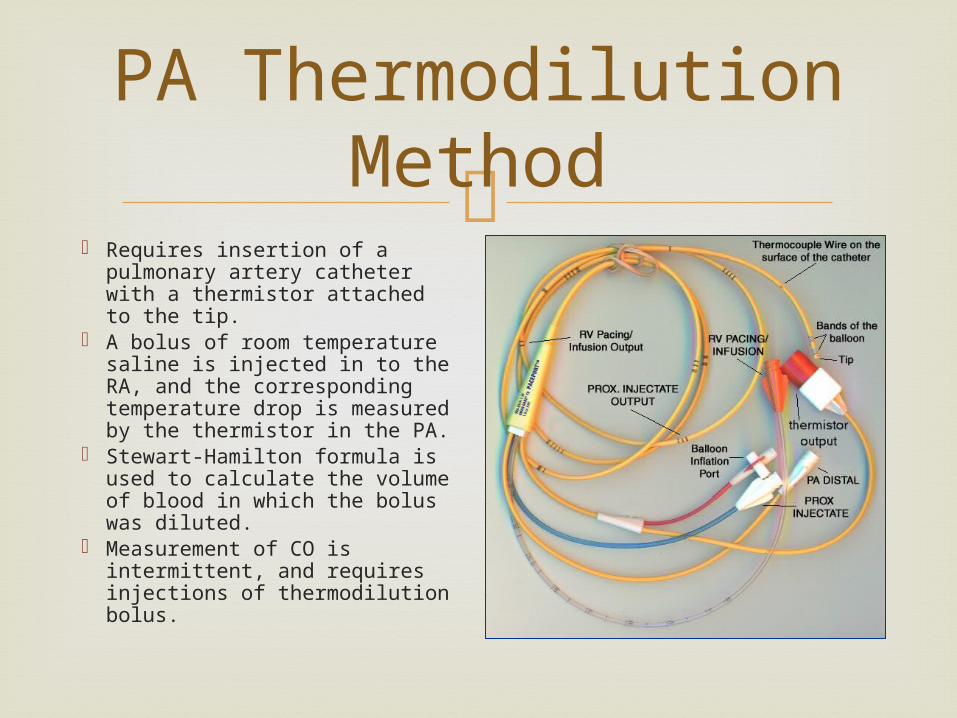
PA Thermodilution Method
Requires insertion of a pulmonary artery catheter with a thermistor attached to the tip.
A bolus of room temperature saline is injected in to the RA, and the corresponding temperature drop is measured by the thermistor in the PA.
Stewart-Hamilton formula is used to calculate the volume of blood in which the bolus was diluted.
Measurement of CO is intermittent, and requires injections of thermodilution bolus.

The heart is a series of 4 chambers.
The same volume of blood is transferred from chamber to chamber during the heart cycle.
If we measure the volume of blood ejected by any one of the chambers, it is equal to the amount ejected by LV in to the aorta (ie SV).
How CO is measured..
RA RV LA LV SV
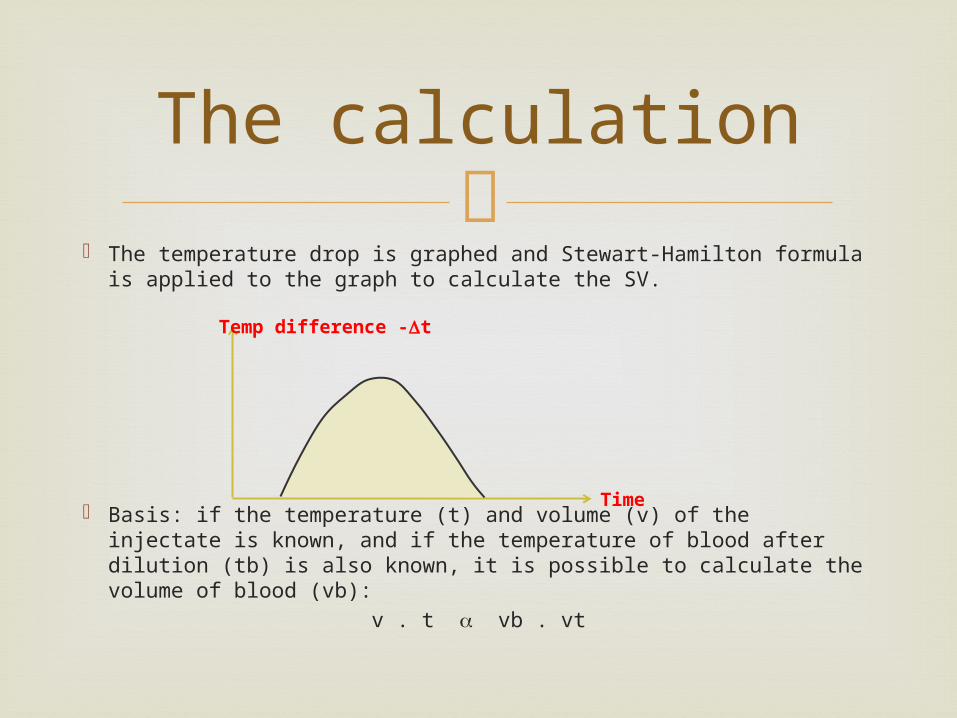
The temperature drop is graphed and Stewart-Hamilton formula
is applied to the graph to calculate the SV.
Basis: if the temperature (t) and volume (v) of the injectate is known, and if the temperature of blood after dilution (tb) is also known, it is possible to calculate the volume of blood (vb):
v . t vb . vt
The calculation
Temp difference -t
Time
Tb x dt
(Tb - Ti) x Vi x
K
Tb
Injection
t
∫D=COTD a
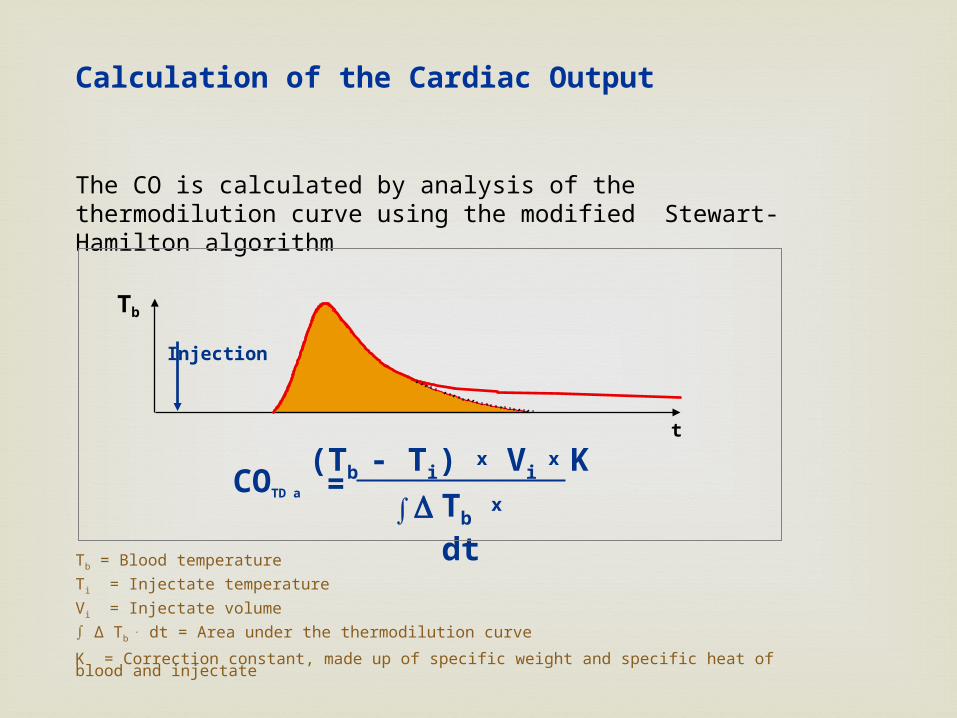
Tb = Blood temperatureTi = Injectate temperatureVi = Injectate volume∫ ∆ Tb
. dt = Area under the thermodilution curve
K = Correction constant, made up of specific weight and specific heat of blood and injectate
The CO is calculated by analysis of the thermodilution curve using the modified Stewart-Hamilton algorithm
Calculation of the Cardiac Output
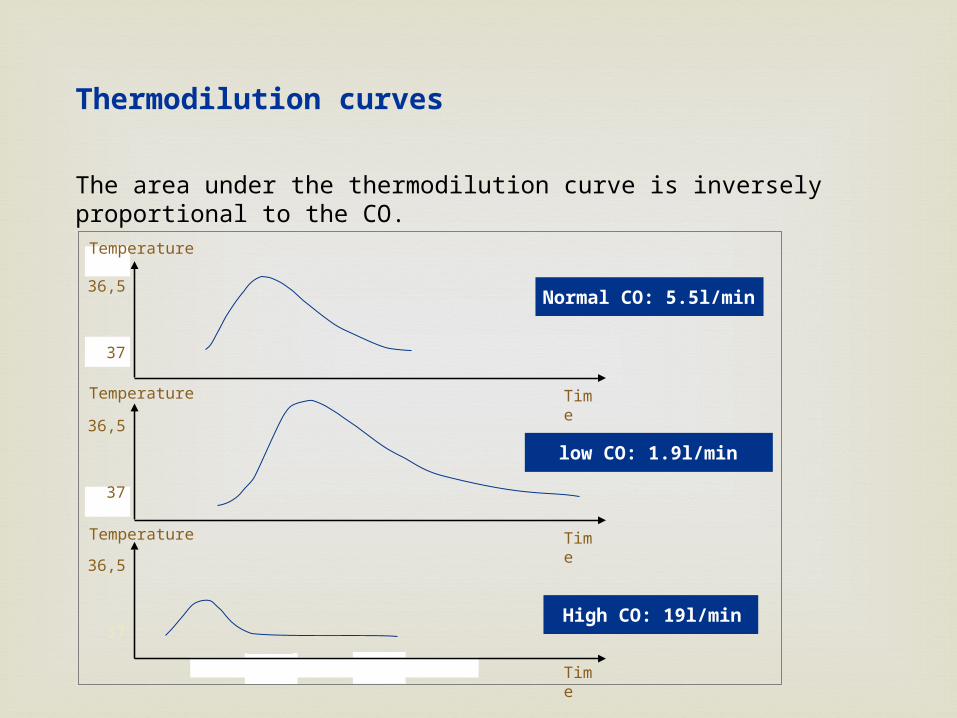
The area under the thermodilution curve is inversely proportional to the CO.
36,5
37
5 10
Thermodilution curves
Normal CO: 5.5l/min
36,5
37
36,5
37
Time
low CO: 1.9l/min
High CO: 19l/min
Time
Time
Temperature
Temperature
Temperature
Later adaptations of the PA thermodilution
method allowed automatic continuous cardiac output measurement without the need for injections: Abbot / Baxter CCO method – a heating element
proximal to the thermistor creates boluses of warmed blood.
TruCCO method – system measured the amount of energy necessary to keep a heating element at a constant temperature of 1 degree above the blood temperature. Very short response time.
Continuous Cardiac Output
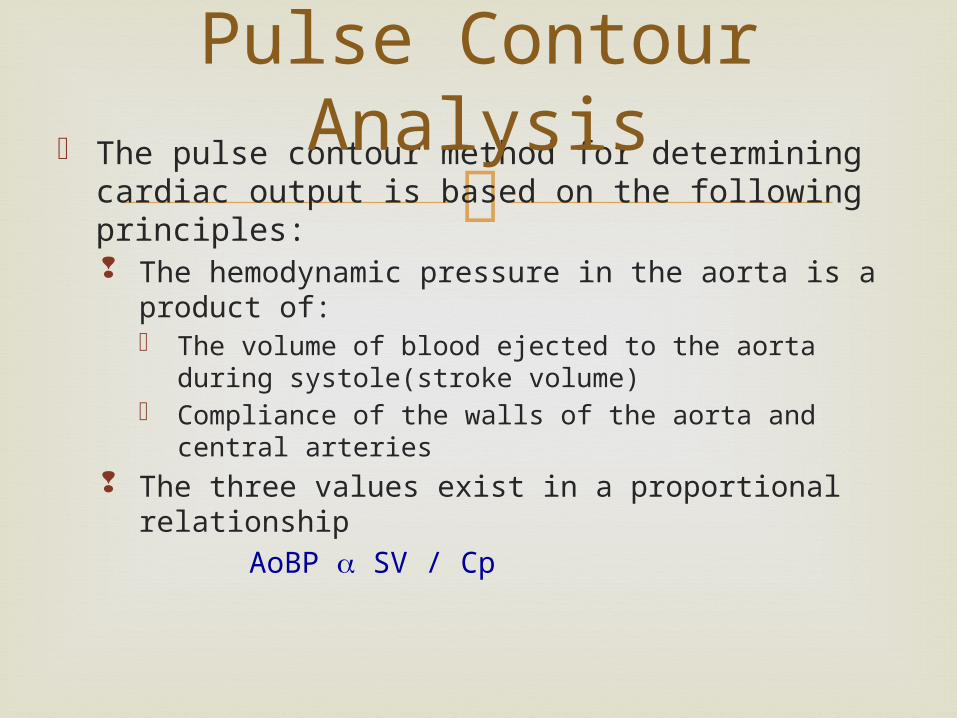
The pulse contour method for determining
cardiac output is based on the following principles: The hemodynamic pressure in the aorta is a
product of: The volume of blood ejected to the aorta during
systole(stroke volume) Compliance of the walls of the aorta and central
arteries The three values exist in a proportional relationship
AoBP SV / Cp
Pulse Contour Analysis
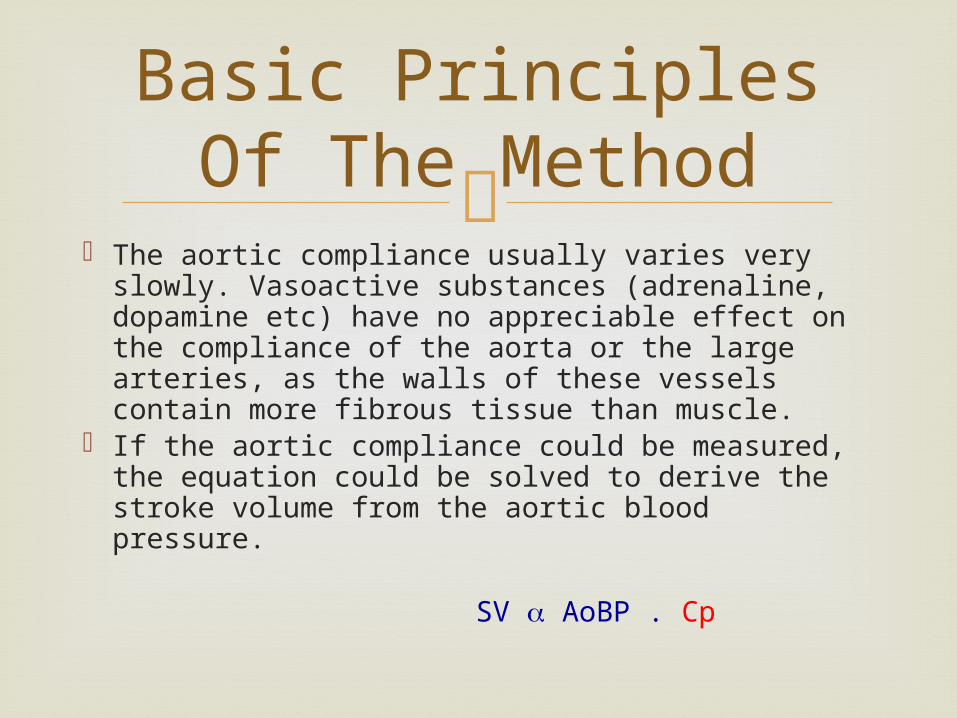
The aortic compliance usually varies very
slowly. Vasoactive substances (adrenaline, dopamine etc) have no appreciable effect on the compliance of the aorta or the large arteries, as the walls of these vessels contain more fibrous tissue than muscle.
If the aortic compliance could be measured, the equation could be solved to derive the stroke volume from the aortic blood pressure.
SV AoBP . Cp
Basic Principles Of The Method
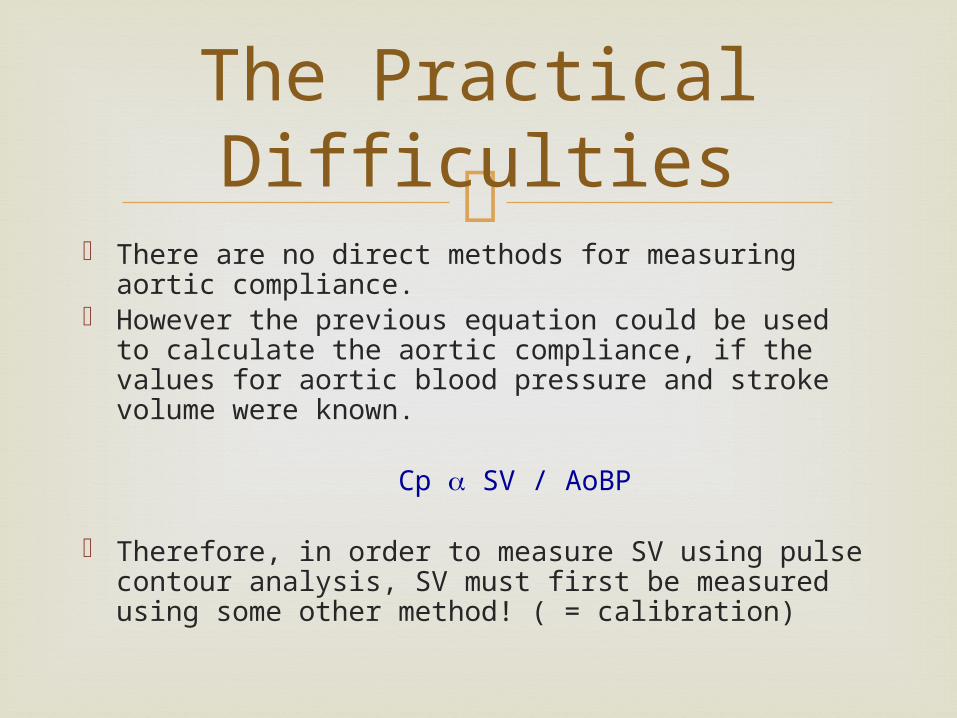
There are no direct methods for measuring aortic
compliance. However the previous equation could be used to
calculate the aortic compliance, if the values for aortic blood pressure and stroke volume were known.
Cp SV / AoBP
Therefore, in order to measure SV using pulse contour analysis, SV must first be measured using some other method! ( = calibration)
The Practical Difficulties
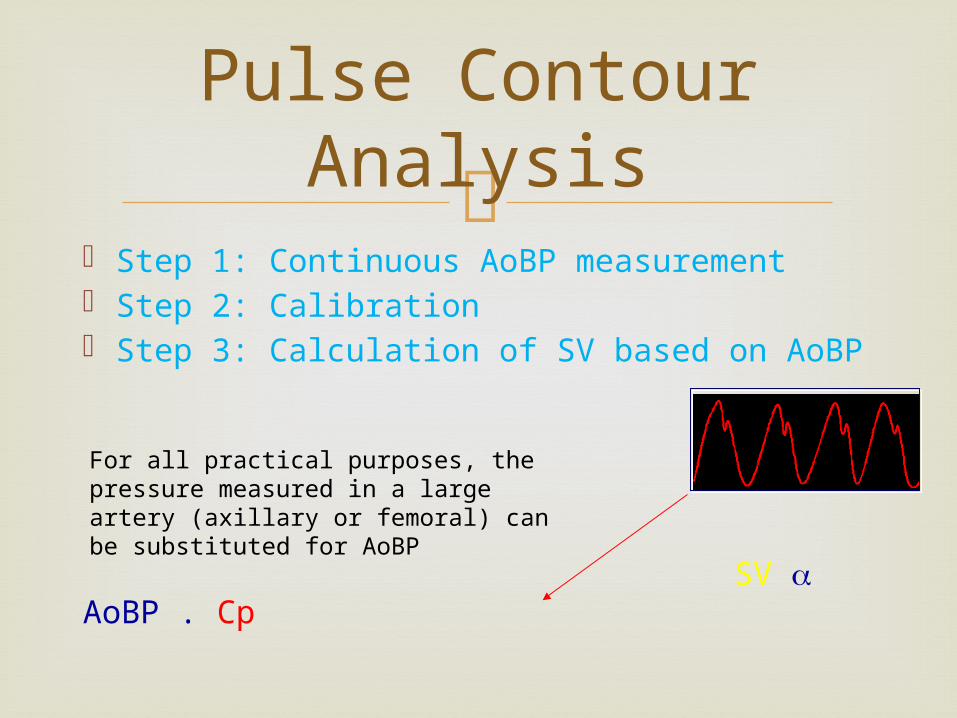
Step 1: Continuous AoBP measurement Step 2: Calibration Step 3: Calculation of SV based on AoBP
SV AoBP . Cp
Pulse Contour Analysis
For all practical purposes, the pressure measured in a large artery (axillary or femoral) can be substituted for AoBP
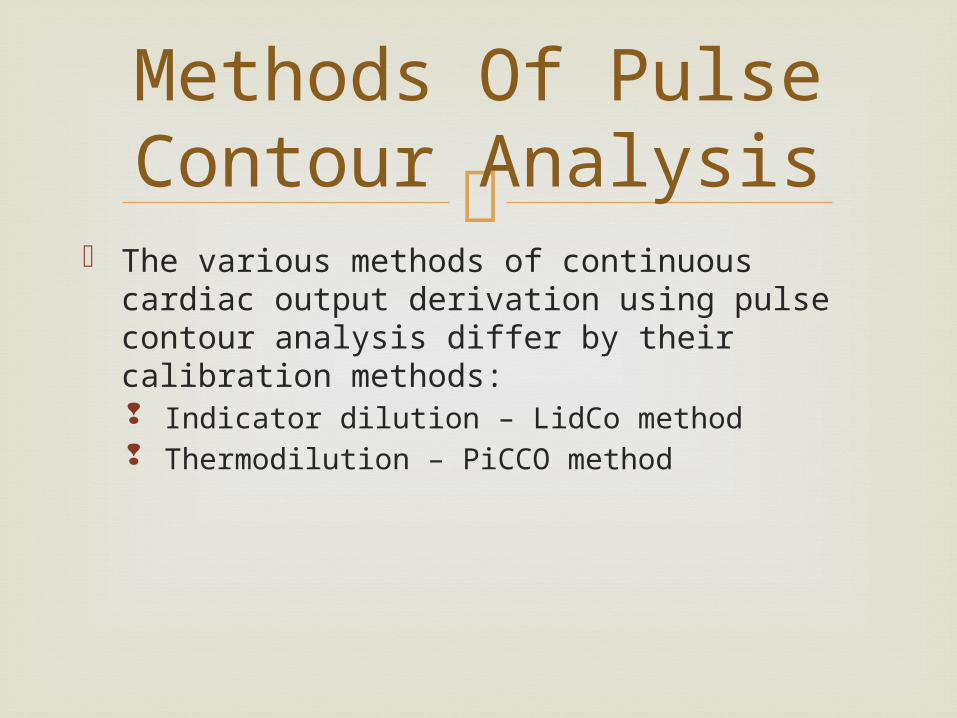
The various methods of continuous cardiac
output derivation using pulse contour analysis differ by their calibration methods: Indicator dilution – LidCo method Thermodilution – PiCCO method
Methods Of Pulse Contour Analysis
Uses trans-pulmonary thermodilution to
calibrate the pulse contour analysis. A bolus of room-temperature saline is injected
in to the SVC through the triple lumen CVP line. The drop in blood temperature is measured at
the femoral artery using a thermistor attached to the tip of the femoral artery catheter.
After calibration, the cardiac output is calculated continuously using the femoral artery pressure waveform.
PiCCO Method
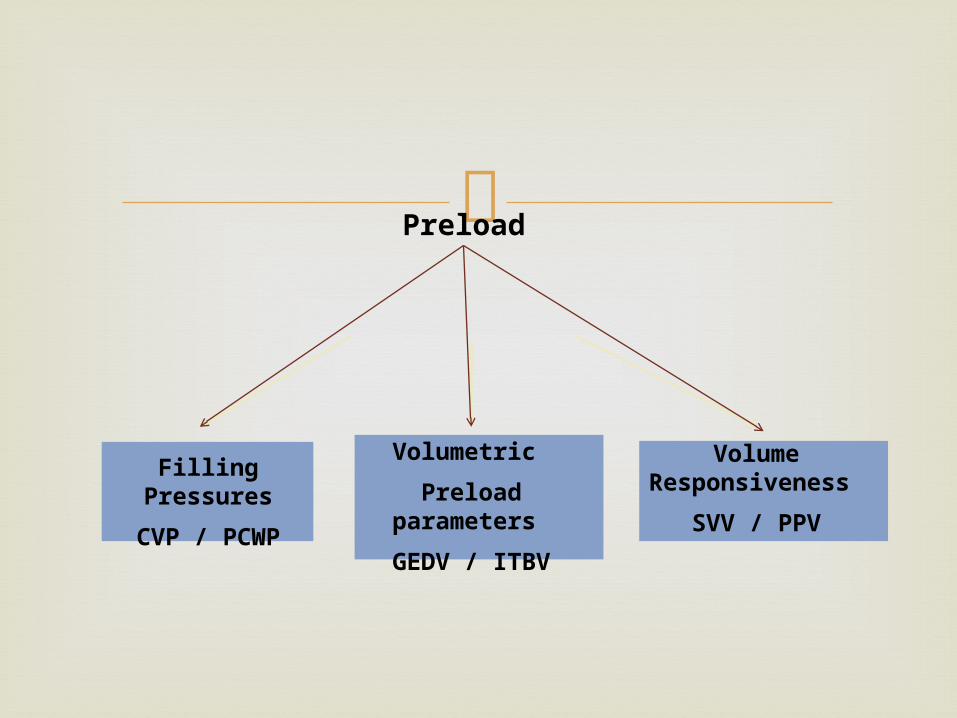
Preload
Filling Pressures
CVP / PCWP
Volume Responsiveness
SVV / PPV
Volumetric
Preload parameters
GEDV / ITBV
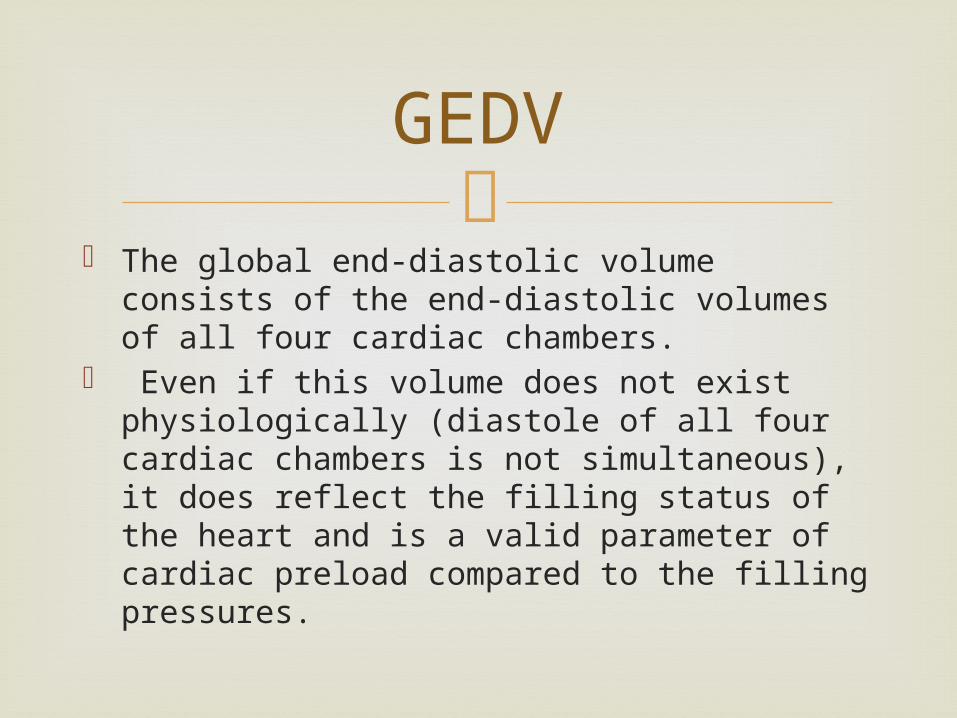
The global end-diastolic volume consists of the
end-diastolic volumes of all four cardiac chambers.
Even if this volume does not exist physiologically (diastole of all four cardiac chambers is not simultaneous), it does reflect the filling status of the heart and is a valid parameter of cardiac preload compared to the filling pressures.
GEDV
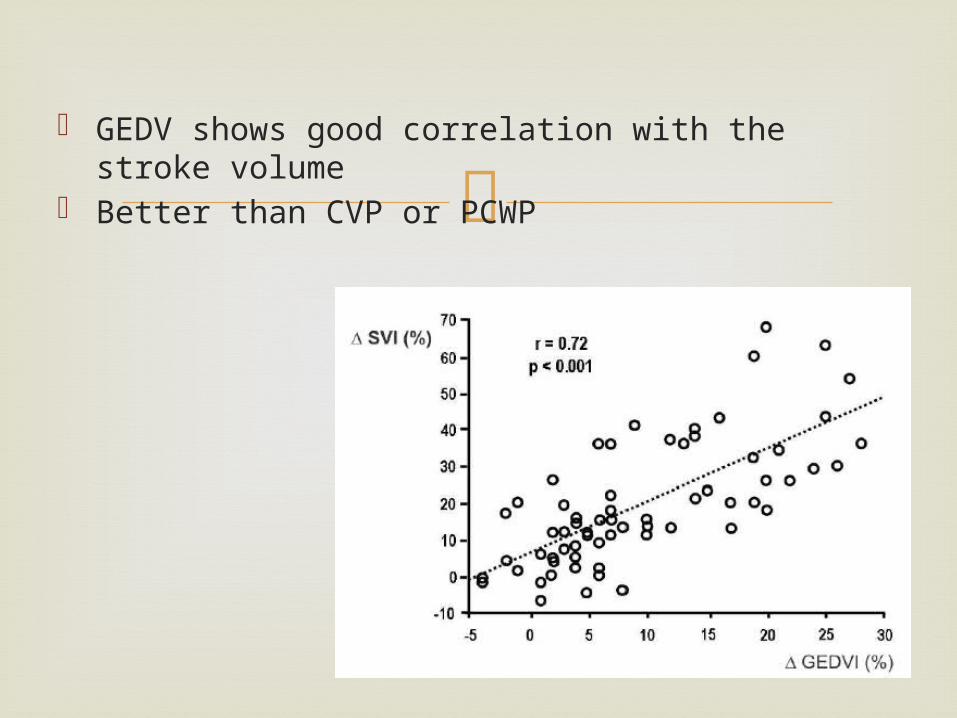
GEDV shows good correlation with the stroke
volume Better than CVP or PCWP
ITBV = GEDV + PULMONARY BLOOD VOLUME The intrathoracic blood volume is usually 25%
higher than the global end-diastolic blood volume. A linear association has been demonstrated for the two parameters.
The ITBV can therefore be calculated from the GEDV.
ITBV
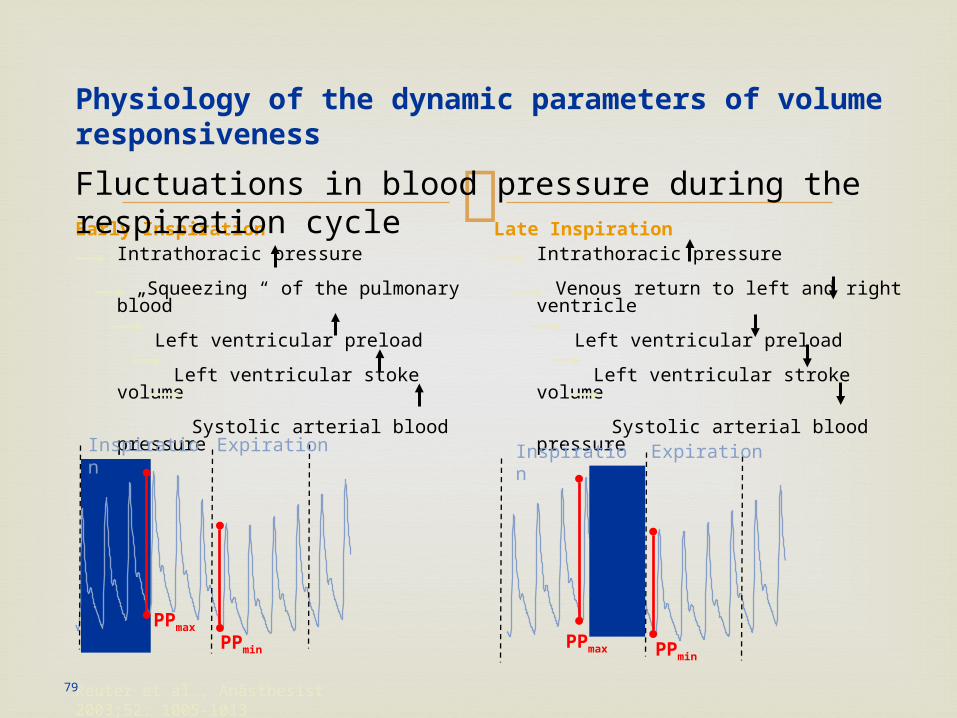
Intrathoracic pressure
Venous return to left and right ventricle
Left ventricular preload
Left ventricular stroke volume
Systolic arterial blood pressure
Intrathoracic pressure
„Squeezing “ of the pulmonary blood
Left ventricular preload
Left ventricular stoke volume
Systolic arterial blood pressure
PPmax PPmin
PPmax
PPmin
Inspiration
Reuter et al., Anästhesist 2003;52: 1005-1013
Physiology of the dynamic parameters of volume responsiveness
Expiration Inspiration Expiration
Early Inspiration Late Inspiration
79
Fluctuations in blood pressure during the respiration cycle
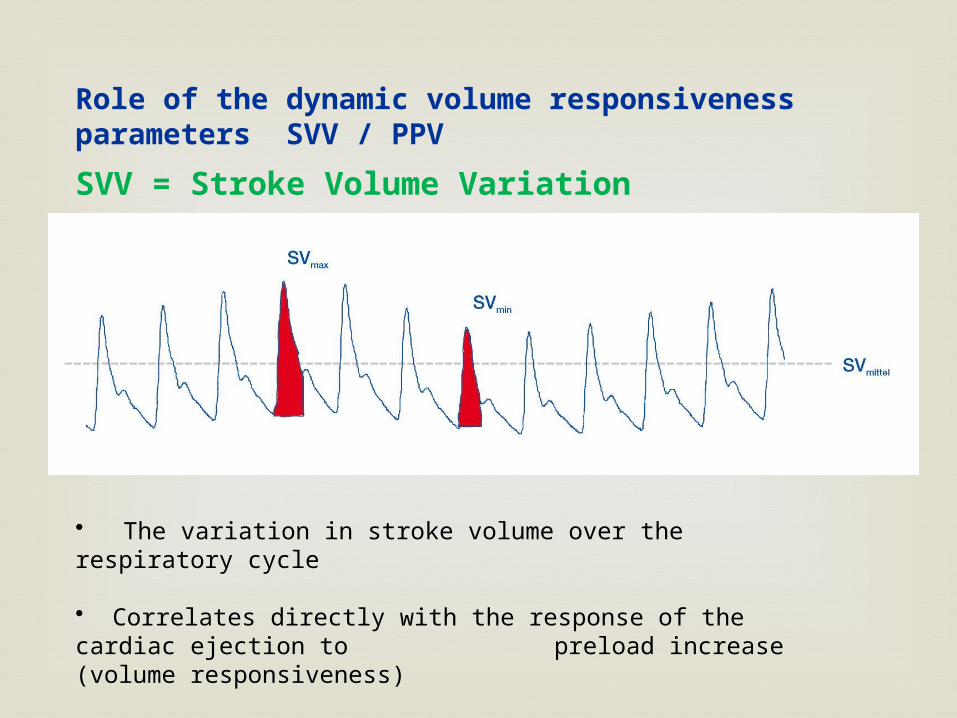
SVmax
SVmin
SVmean
SVV = Stroke Volume Variation
• The variation in stroke volume over the respiratory cycle
• Correlates directly with the response of the cardiac ejection to preload increase (volume responsiveness)
mean
Role of the dynamic volume responsiveness parameters SVV / PPV
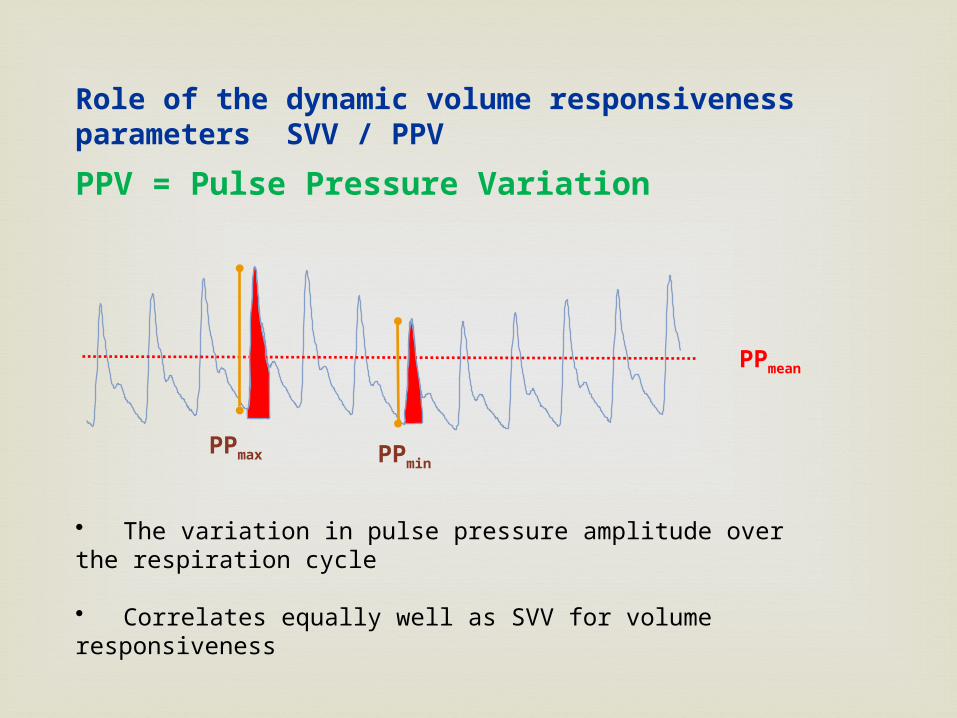
PPV = Pulse Pressure Variation
• The variation in pulse pressure amplitude over the respiration cycle • Correlates equally well as SVV for volume responsiveness
PPmax
PPmean
PPmin
Role of the dynamic volume responsiveness parameters SVV / PPV
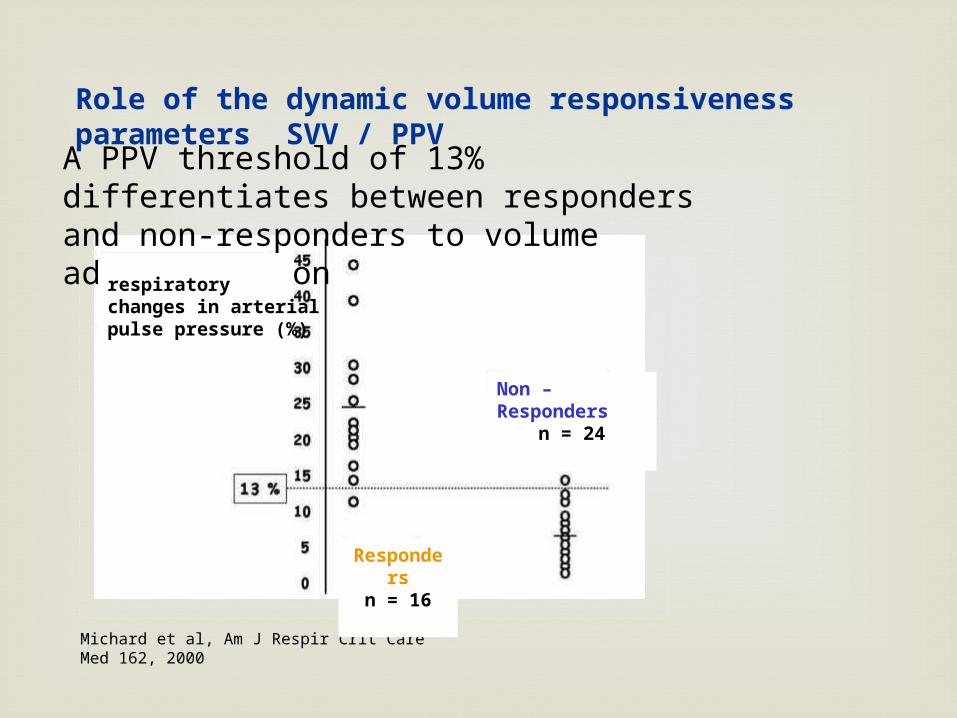
A PPV threshold of 13% differentiates between responders and non-responders to volume administration
Michard et al, Am J Respir Crit Care Med 162, 2000
Respondersn = 16
Non – Respondersn = 24
Role of the dynamic volume responsiveness parameters SVV / PPV
respiratory changes in arterial pulse pressure (%)
- are good predictors of a potential increase in
CO due to volume administration
- are only valid with patients who are fully ventilated and who have no cardiac arrhythmias
SVV and PVV
- is useful for differentiating and quantifying
lung oedema
- is, for this purpose, the only parameter available at the bedside
- functions as a parameter for fluid overload
Extra Vascular Lung Water
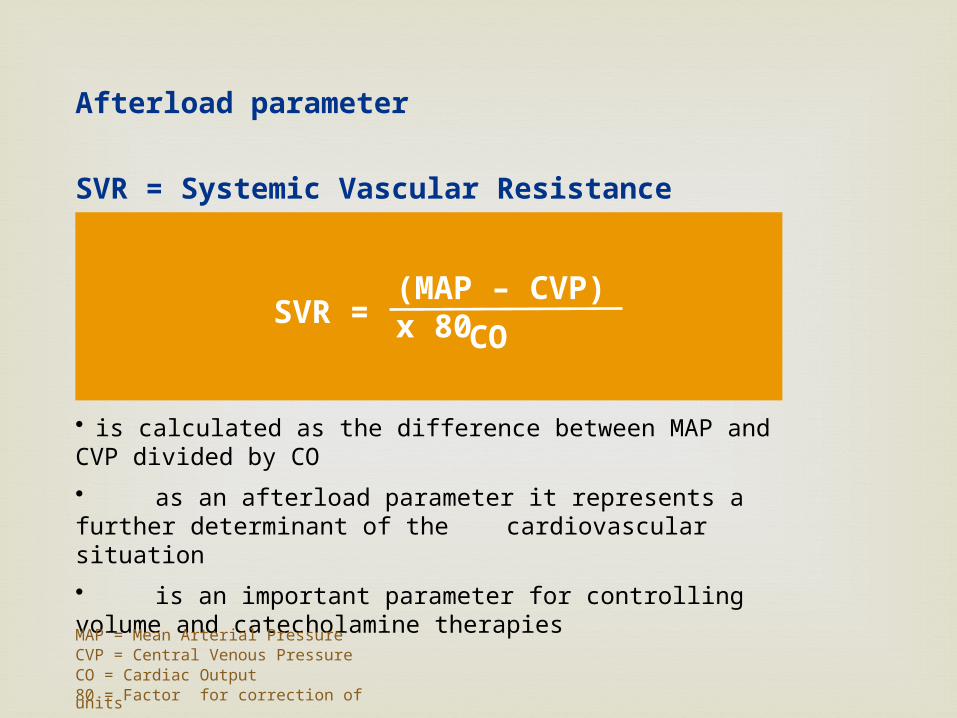
• is calculated as the difference between MAP and CVP divided by CO
• as an afterload parameter it represents a further determinant of the cardiovascular situation
• is an important parameter for controlling volume and catecholamine therapies
(MAP – CVP) x 80SVR =
CO
Afterload parameter
SVR = Systemic Vascular Resistance
MAP = Mean Arterial PressureCVP = Central Venous PressureCO = Cardiac Output80 = Factor for correction of units
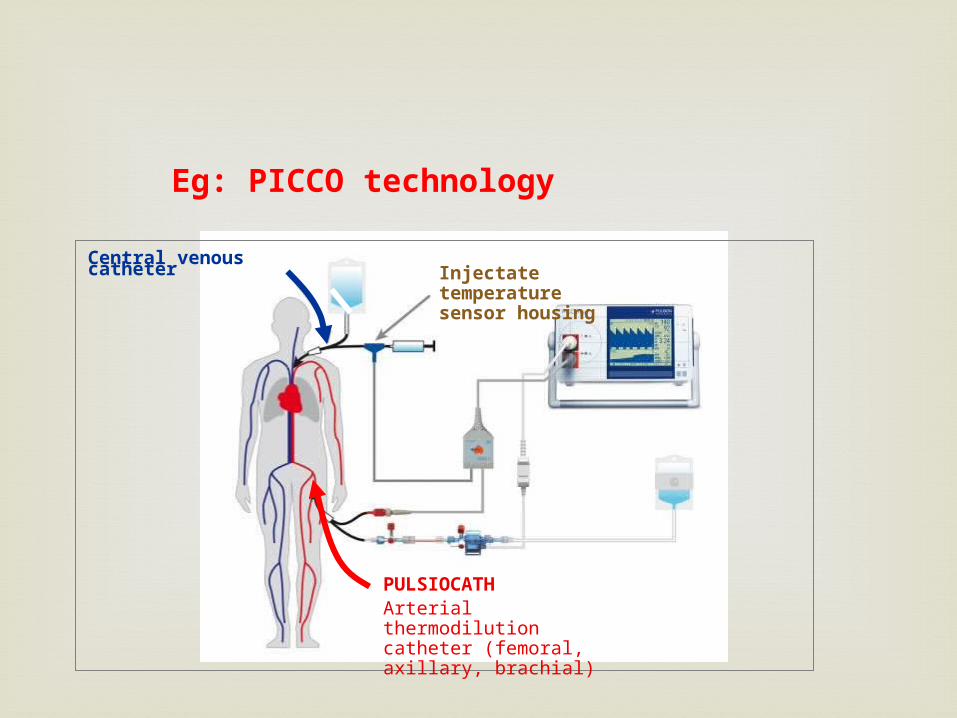
Eg: PICCO technology
Central venous catheter
PULSIOCATHArterial thermodilution catheter (femoral, axillary, brachial)
Injectate temperature sensor housing
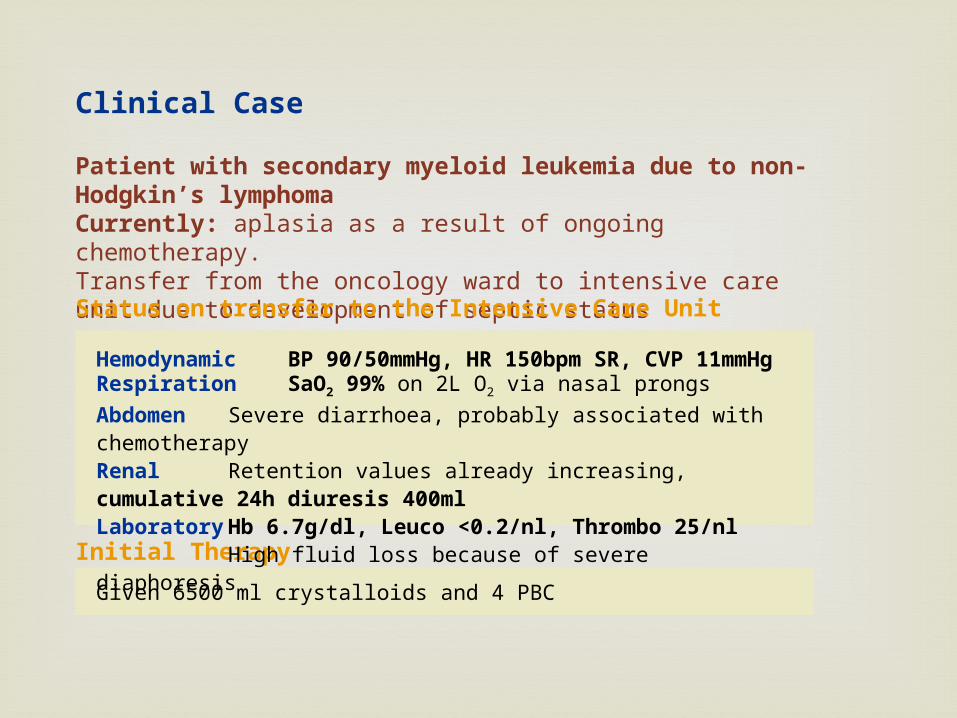
Patient with secondary myeloid leukemia due to non-Hodgkin’s lymphomaCurrently: aplasia as a result of ongoing chemotherapy.Transfer from the oncology ward to intensive care unit due to development of septic status
Clinical Case
Status on transfer to the Intensive Care Unit
Initial Therapy
Given 6500 ml crystalloids and 4 PBC
Hemodynamic BP 90/50mmHg, HR 150bpm SR, CVP 11mmHgRespiration SaO2 99% on 2L O2 via nasal prongsAbdomen Severe diarrhoea, probably associated with chemotherapyRenal Retention values already increasing, cumulative 24h diuresis 400mlLaboratory Hb 6.7g/dl, Leuco <0.2/nl, Thrombo 25/nl
High fluid loss because of severe diaphoresis
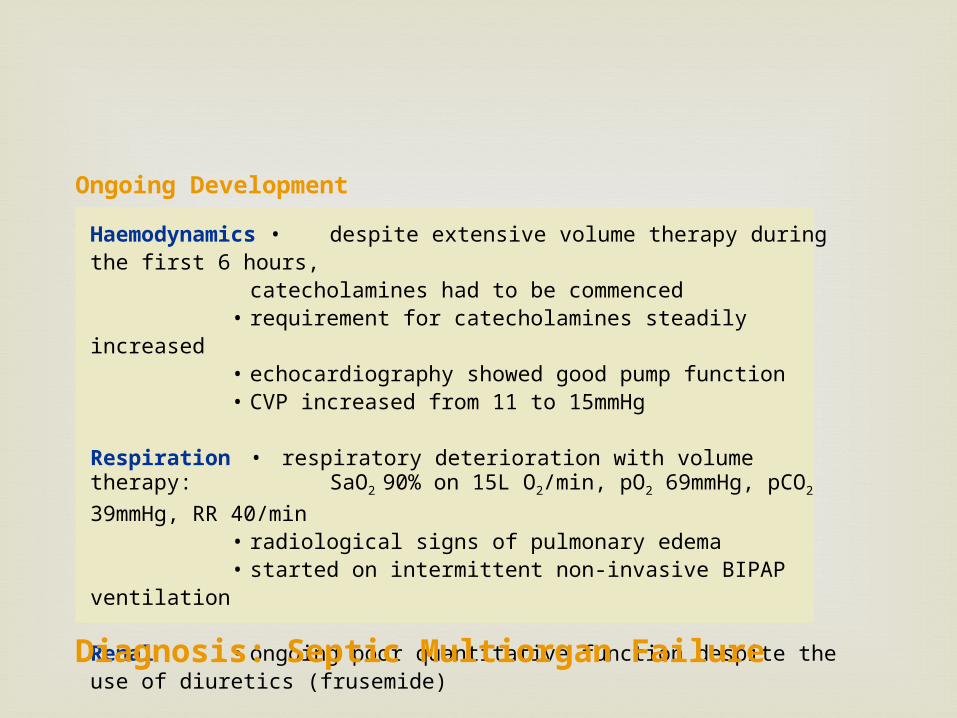
Haemodynamics • despite extensive volume therapy during the first 6 hours, catecholamines had to be commenced
• requirement for catecholamines steadily increased• echocardiography showed good pump function• CVP increased from 11 to 15mmHg
Respiration • respiratory deterioration with volume therapy: SaO2 90% on 15L O2/min, pO2 69mmHg, pCO2 39mmHg, RR 40/min
• radiological signs of pulmonary edema • started on intermittent non-invasive BIPAP ventilation
Renal • ongoing poor quantitative function despite the use of diuretics (frusemide)
Infection Status • evidence of E.Coli in the blood culture
Diagnosis: Septic Multiorgan Failure
Ongoing Development
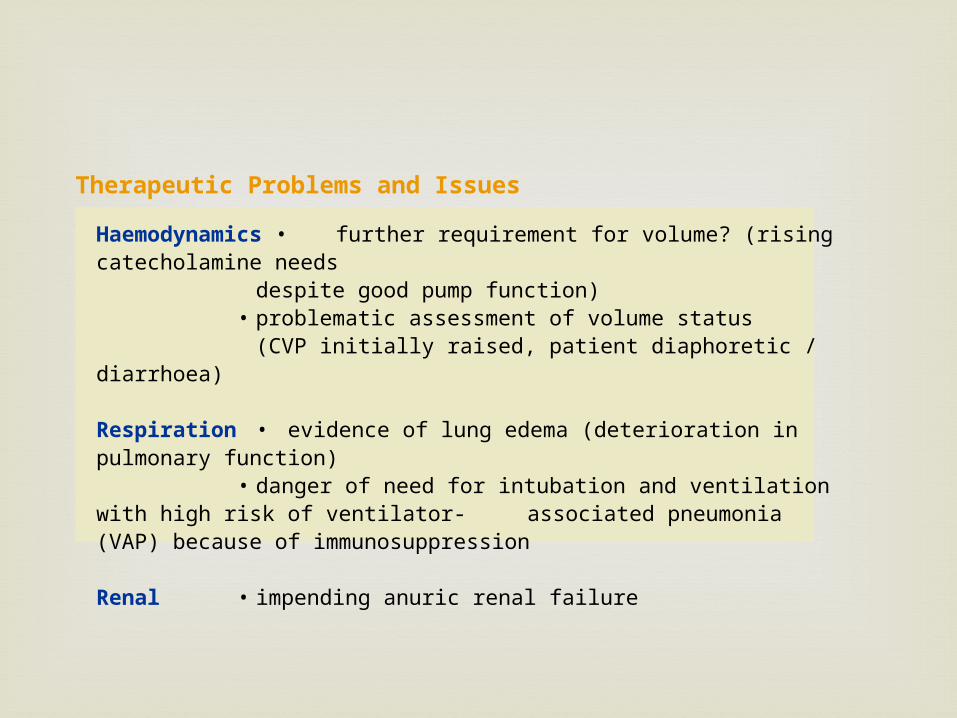
Therapeutic Problems and Issues
Haemodynamics • further requirement for volume? (rising catecholamine needs despite good pump function)
• problematic assessment of volume status (CVP initially raised, patient diaphoretic / diarrhoea)
Respiration • evidence of lung edema (deterioration in pulmonary function) • danger of need for intubation and ventilation with high risk of ventilator-
associated pneumonia (VAP) because of immunosuppression
Renal • impending anuric renal failure
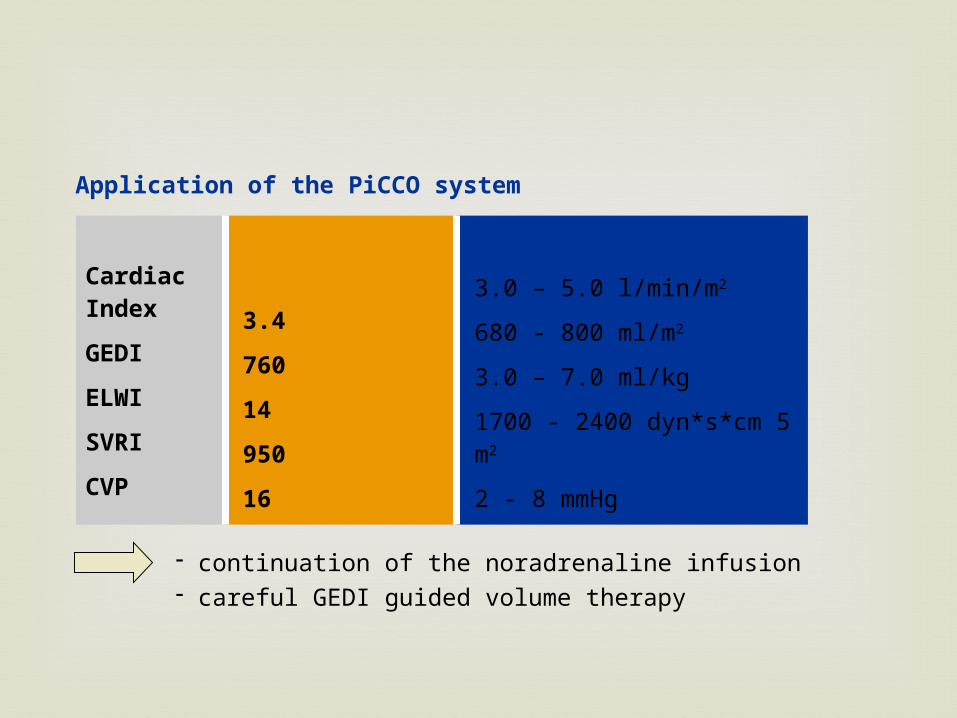
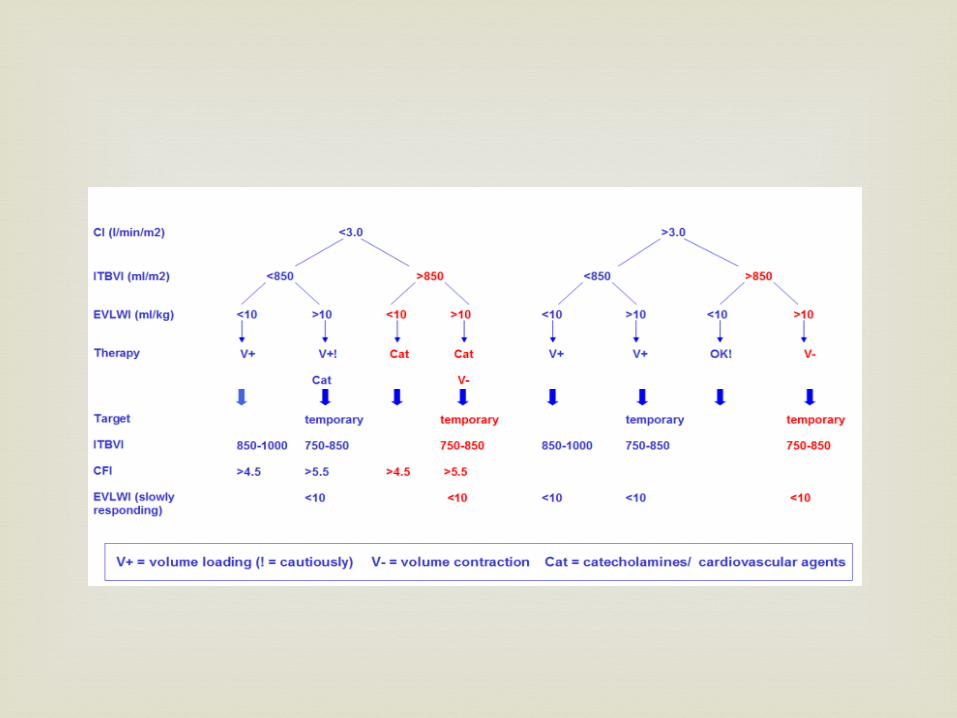
Application of the PiCCO system
- continuation of the noradrenaline infusion- careful GEDI guided volume therapy
Initial measurement
3.4
760
14
950
16
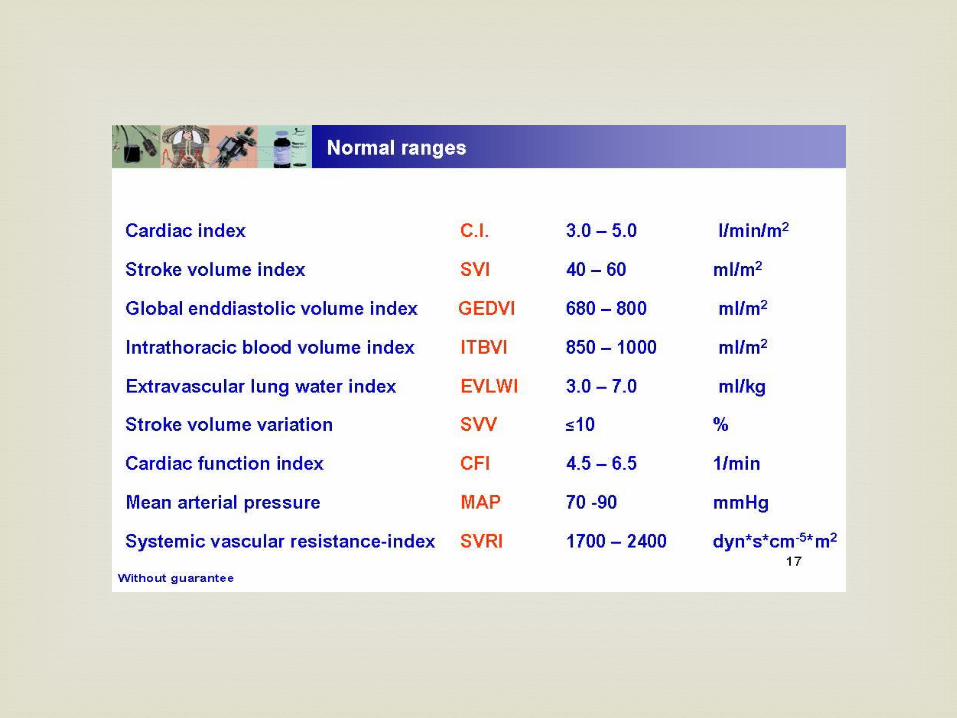
Normal values
3.0 – 5.0 l/min/m2
680 - 800 ml/m2
3.0 – 7.0 ml/kg 1700 - 2400 dyn*s*cm 5 m2
2 - 8 mmHg
Cardiac Index
GEDI
ELWI
SVRI
CVP
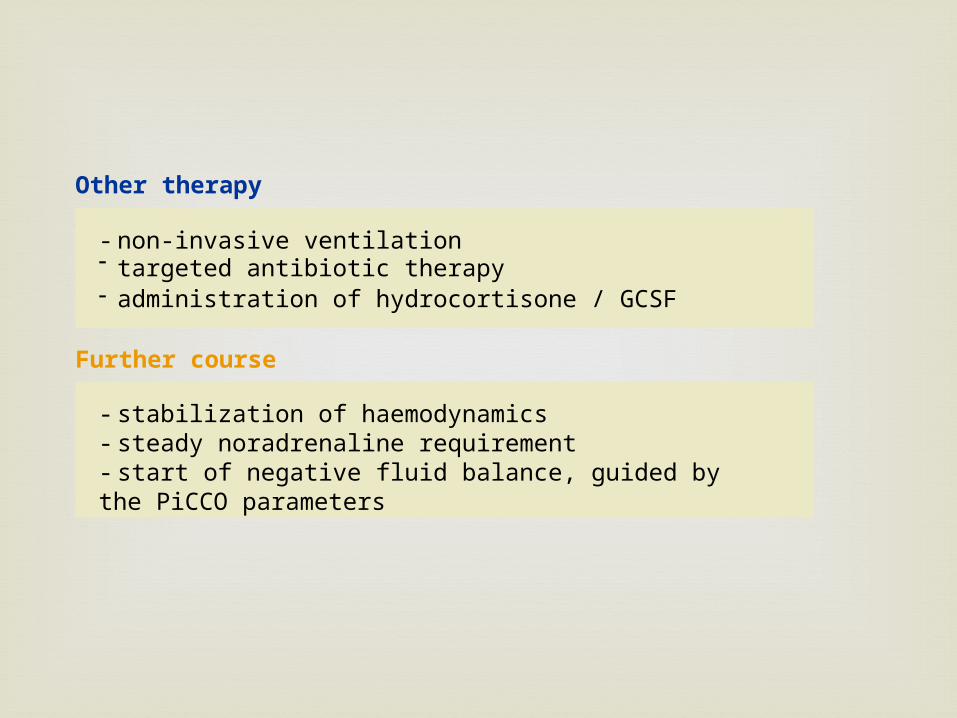
Other therapy
- stabilization of haemodynamics- steady noradrenaline requirement- start of negative fluid balance, guided by the PiCCO parameters
Further course
- non-invasive ventilation- targeted antibiotic therapy - administration of hydrocortisone / GCSF
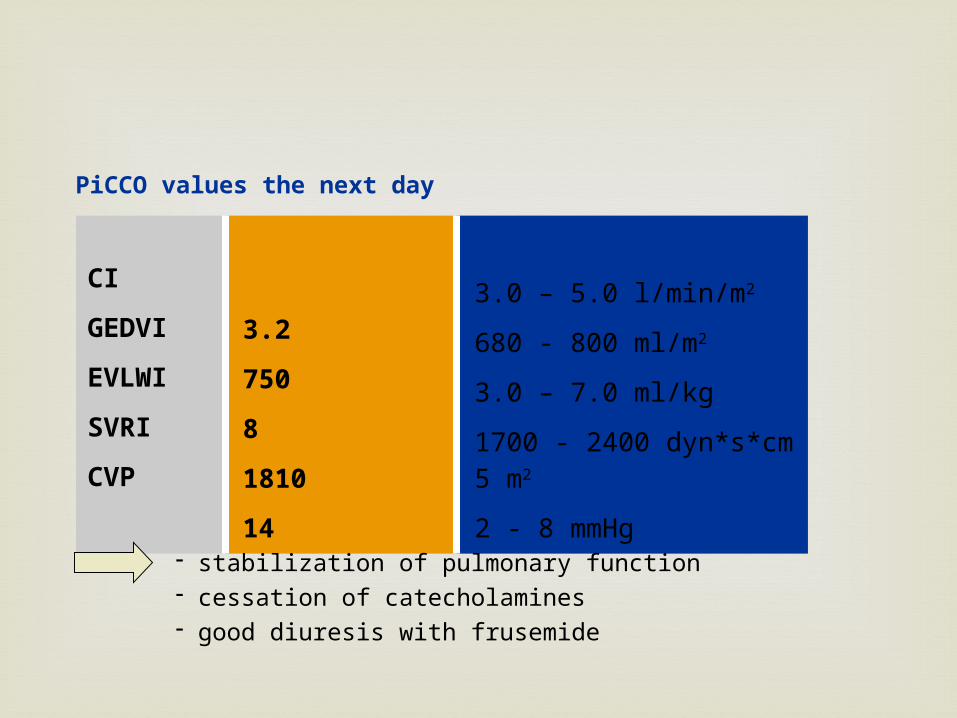
PiCCO values the next day
Actual values
3.2
750
8
1810
14
Normal values
3.0 – 5.0 l/min/m2
680 - 800 ml/m2
3.0 – 7.0 ml/kg 1700 - 2400 dyn*s*cm 5 m2
2 - 8 mmHg
CI
GEDVI
EVLWI
SVRI
CVP
- stabilization of pulmonary function- cessation of catecholamines- good diuresis with frusemide
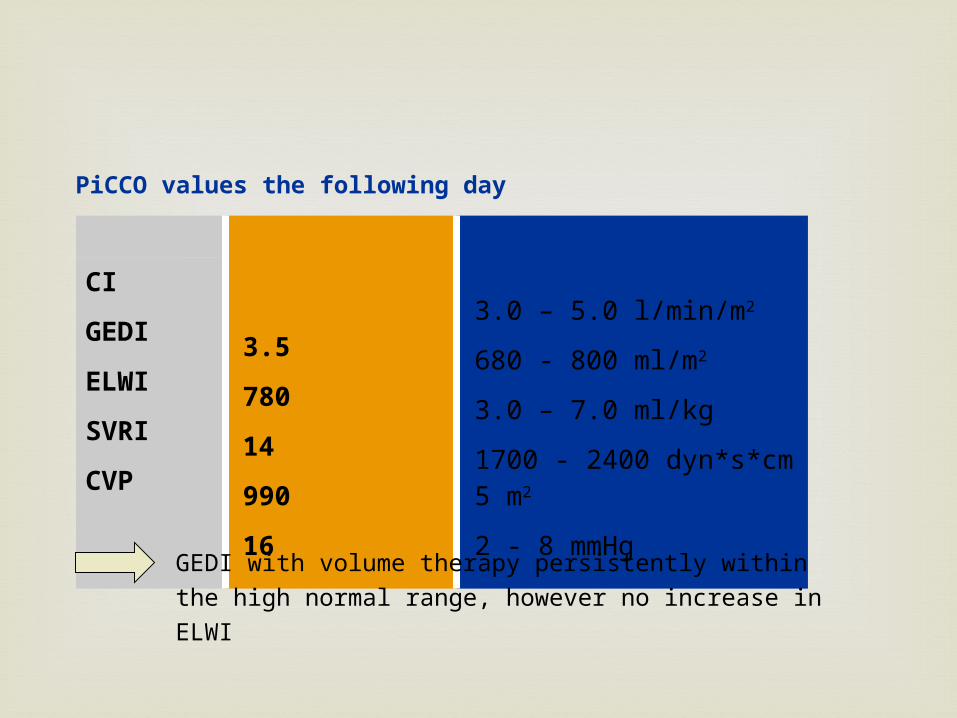
Actual values
3.5
780
14
990
16
Normal range
3.0 – 5.0 l/min/m2
680 - 800 ml/m2
3.0 – 7.0 ml/kg 1700 - 2400 dyn*s*cm 5 m2
2 - 8 mmHg
CI
GEDI
ELWI
SVRI
CVP
PiCCO values the following day
GEDI with volume therapy persistently within the high normal range, however no increase in ELWI

Pulmonary Artery / Swan Ganz Catheter
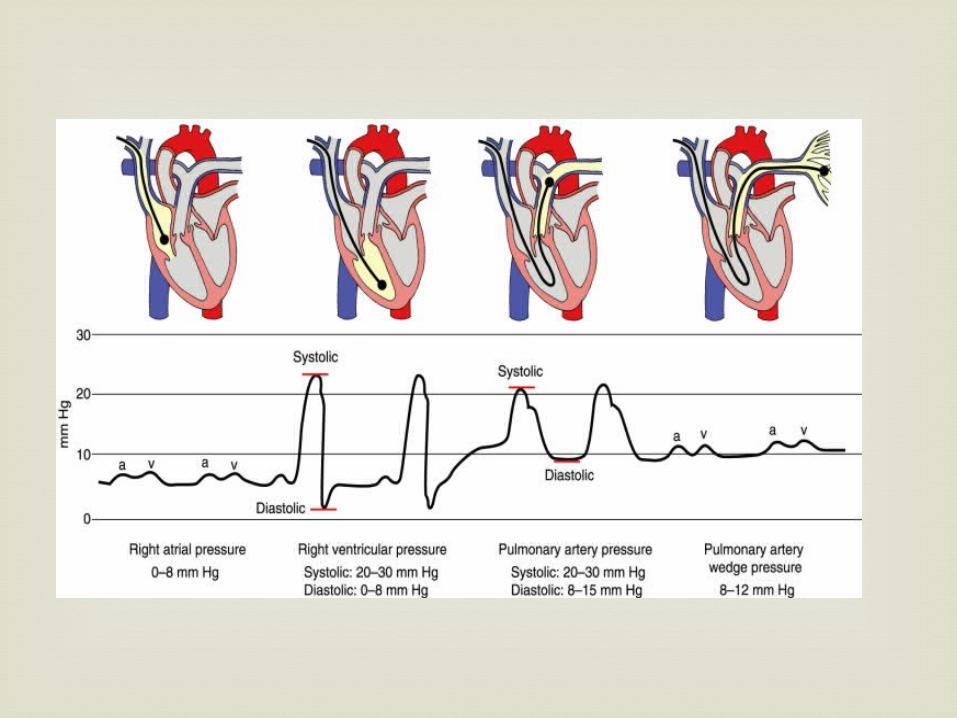
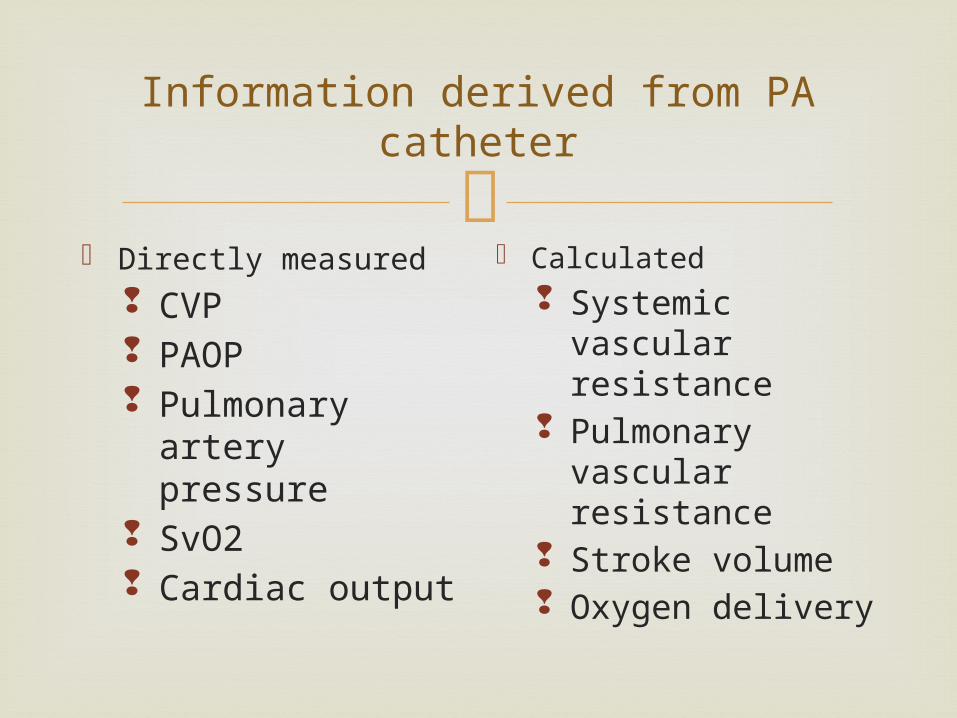
Information derived from PA catheter
Directly measured CVP PAOP Pulmonary
artery pressure SvO2 Cardiac output
Calculated Systemic
vascular resistance
Pulmonary vascular resistance
Stroke volume Oxygen delivery
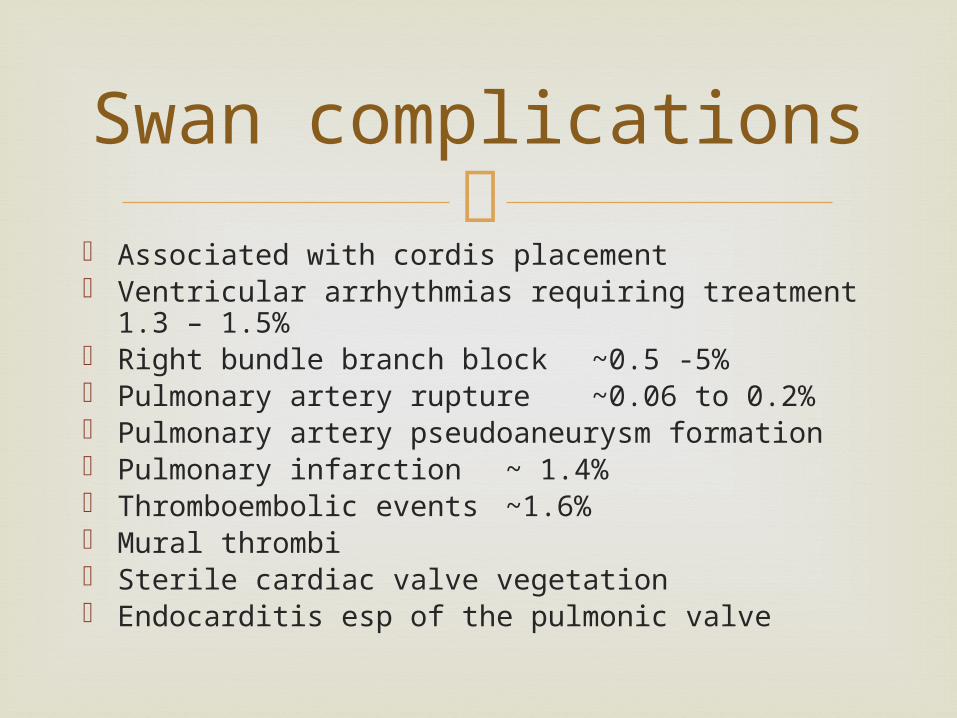
Associated with cordis placement Ventricular arrhythmias requiring treatment 1.3 –
1.5% Right bundle branch block ~0.5 -5% Pulmonary artery rupture ~0.06 to 0.2% Pulmonary artery pseudoaneurysm formation Pulmonary infarction ~ 1.4% Thromboembolic events ~1.6% Mural thrombi Sterile cardiac valve vegetation Endocarditis esp of the pulmonic valve
Swan complications

Thank you for listening…