han-long liu, jian chu, and an deng use of large … · several innovative soil improvement methods...
TRANSCRIPT
SUBMITTED VERSION
Han-Long Liu, Jian Chu, and An Deng Use of large-diameter, cast-in situ concrete pipe piles for embankment over soft clay Canadian Geotechnical Journal, 2009; 46(8):915-927
© NRC Research Press
Originally Published at http://dx.doi.org/10.1139/T09-032
http://hdl.handle.net/2440/75138
PERMISSIONS
http://www.nrcresearchpress.com/page/authors/information/rights
Authors' rights As of 2009, copyright of all articles in NRC Research Press journals remains with the authors. Copyright of all articles published prior to 2009 is held by Canadian Science Publishing (operating as NRC Research Press) or its licensors (also see our Copyright and Reuse of Content information). Under the terms of the license to publish granted to NRC Research Press, authors retain the following rights:
1. To post a copy of their submitted manuscript (pre-print) on their own website, an institutional repository, a preprint server, or their funding body's designated archive (no embargo period).
2. To post a copy of their accepted manuscript (post-print) on their own website, an institutional repository, a preprint server, or their funding body's designated archive (no embargo period). Authors who archive or self-archive accepted articles are asked to provide a hyperlink from the manuscript to the Journal's website.
10 April 2015

1
Paper submitted to Canadian Geotechnical Journal on 2 August 2006
Soil improvement using large diameter, cast-in-situ, thin-wall concrete pipe piles
H-L. Liu, J. Chu and A. Deng
Hanlong Liu 1 Geotechnical Research Institute, Hohai University
1 Xikang Road, Nanjing 210098, China Tel: (86) 25 83786918, Fax: (86) 25 83713073
Email: [email protected]
Jian Chu School of Civil and Environmental Engineering
Nanyang Technological University Blk N1, 50 Nanyang Ave, Singapore 639798
Tel: (65) 67904563, Fax: (65) 67921650 Email: [email protected]
An Deng Geotechnical Research Institute, Hohai University
1 Xikang Road, Nanjing 210098, China Tel: (86) 25 83787918, Fax: (86) 25 83713073
Email:[email protected]

2
Soil improvement using large diameter, cast-in-situ, thin-wall concrete pipe piles Hanlong Liu, Jian Chu and An Deng
Abstract: A new method of using large diameter, cast-in-situ, thin wall concrete pipe
piles for soil improvement is introduced in this paper. This so-called PCC pile method
enables the soil improvement works to be carried out in a relative speedy and cost-
effective way as compared with other existing soil improvement methods. The principles
and construction techniques involved in this method are described. Full-scale model tests
were conducted to evaluate the quality and performance of piles and the responses of the
surrounding soils. Methods that can be used to check the quality of the pipe piles are
elaborated. The advantages and disadvantages of this method as compared with other
similar soil improvement methods are also discussed. Case studies that illustrate the
application of this method will be presented in a companion paper.
Key words: case-in-situ; ground improvement; model tests; piles.
Introduction
To cater for the rapid economic growth, China has undergone a massive
development in the transportation infrastructures in recent years. Many roads, airports
and seaports have been constructed. The total length of highway has increased from 271
km in 1989 to 41,000 km in 2005. In 2005 alone, 6,700 km highway was constructed.
Some of the highways need to be built on weak ground or reclaimed land and yet the
constructions have to be completed within a short time frame. How to improve the
foundation soils in a speedy and yet cost-effective way has become one of the major
3
challenges to geotechnical engineers. In the quest for better solutions to the problems,
several innovative soil improvement methods have been developed and applied to road or
runway constructions in China. The use of large diameter, cast-in-situ thin wall concrete
pipe piles for soil improvement is one of them. This so called PCC pile method enables
the soil improvement works to be carried out in a relative speedy and cost-effective way
as compared with other existing soil improvement methods. The principles and
construction techniques involved in this method are described in this paper. Full-scale
model tests that were conducted to evaluate the performance of this technique are also
presented and analyzed. Methods that can be used to check the quality of the pipe piles
are elaborated. The advantages and disadvantages of this method as compared with other
soil improvement methods are also discussed. Case studies that illustrate the application
of this method will be presented in a companion paper.
Principles
Before the development of the PCC piles, deep cement mixing (DCM) piles are
normally used in China (Lin and Wong 1999) under the circumstances that now the use
of PCC piles would be considered. As the diameter of the DCM pile is small (normally
around 50 mm), the spacing between the DCM piles has to be small too, normally within
1.5 m. Thus the number of piles that have to be installed for a large scale project can be
rather excessive. As a result, the use of DCM piles is not only expensive, but also time
consuming. Furthermore, the quality of the DCM piles is highly dependent on the
construction process and yet it is difficult to check the quality of the piles installed. To
overcome these difficulties, the idea of PCC pile is conceived. PCC pile (Fig. 1) is a
4
cast-in-situ, thin-wall, plain concrete pipe pile. The diameter of the pile is normally in the
range of 1.0 to 1.5 m, which is much larger than other types of piles used for soil
improvement. As the diameter of the pile is large and the shaft friction develops along
both the inner and outer surfaces, the bearing capacity of the pile can be much larger than
other types of piles. When a large diameter pile is used, a large pile spacing can also be
used and the total number of piles can be reduced. As the pile is hollow, the usage of
concrete is also reduced. Therefore, the use of large diameter, cast-in-situ concrete pipe
pile appears to offer an optimum solution. As the pipe pile contacts the soil on both the
inner and outer surfaces, as shown in Fig. 1, the shaft friction will be much higher
comparing to solid pile of the same type. More importantly, the quality control of the
PCC pile can be much better compared with DCM piles as will be discussed later.
Construction method
Cast-in-situ, rather than precast concrete pipe piles are used. This is because it is
difficult to transport and install large diameter precast thin wall pipe piles without
affecting the integrity of the pile, particular when the piles are not reinforced. As the
PCC pipe pile is intended to be used mainly for improving the bearing capacity and
reducing the settlement of soft ground, it would be possible to jack in casings to cast the
concrete pile in-situ. For this purpose, a special pile driving machine, named PCC piling
machine, has been designed to install the PCC pipe (Liu et al. 2003). The elevation and
side views of the piling machine and the main components are shown in Fig. 2. A picture
of the piling machine in action is shown in Fig. 3. An annular steel casing that is made of
two coaxial steel tubes is used as a form to case the hollow pile. The annular casing is
closed ended. A cutting shoe or simply steel plates, as shown in Fig. 4, is used to close
5
the end. To facilitate installation, the inner and outer tubes are staggered to form a cutting
edge of 300 (see Fig. 4). The diameter of the outer casing and so is the nominal diameter
of the pipe pile ranges from 1.0 to 1.5 m. The diameter of the inner casing is chosen to be
200 to 300 mm smaller than the outer casing so the wall thickness of the pipe pile can be
controlled between 100 to 150 mm.
The PCC pile installation sequence is shown in Fig. 5. The annular casing is first
erected on the PCC piling machine and is initially pushed and then virbo-driven into the
ground. After the casing reaches the desired depth, concrete is poured into the annular of
the casing. The slump ratio of the concrete is controlled within 50 to 100 mm. After this,
the steel casing is withdrawn from the ground by virbo means. When the casing is pulled
up, the plates that seal the tip of the casing will be open. The withdrawing rate is
controlled within 0.8 to 1.2 m/min. The vibratory effect applied to the casings during
withdrawing also helps the concrete to be compacted. The maximum depth of the PCC
pile is controlled by the height of the PCC piling machine and is normally within 25 m.
If piles longer than the height of the piling machine are used, wielding of casings is
required. This will reduce the installation speed. When necessary, a circular steel
reinforcement cage can also be used to reinforce the top part or the entire length of the
pile. When the casing is removed, the top 0.5 m soil inside the PCC pile is excavated and
filled with lean concrete to form a pile cap as shown in Fig. 6.
Response of soil during PCC pile installation
The PCC pile technique involves the driving of a close ended large diameter
annular steel casing into soft soil gound. The pile installation process will affect the

6
properties of the surrounding soil and thus the performance of the pile. As studies on the
response of soil to the driving of a large diameter pipe are rare, some field tests were
conducted to monitor the ground responses to the driving of the casing and to study the
effect of pile installation on the surrounding soil.
Instrumentation
The experimental site is located in a northern suburb of Shanghai on the deltaic
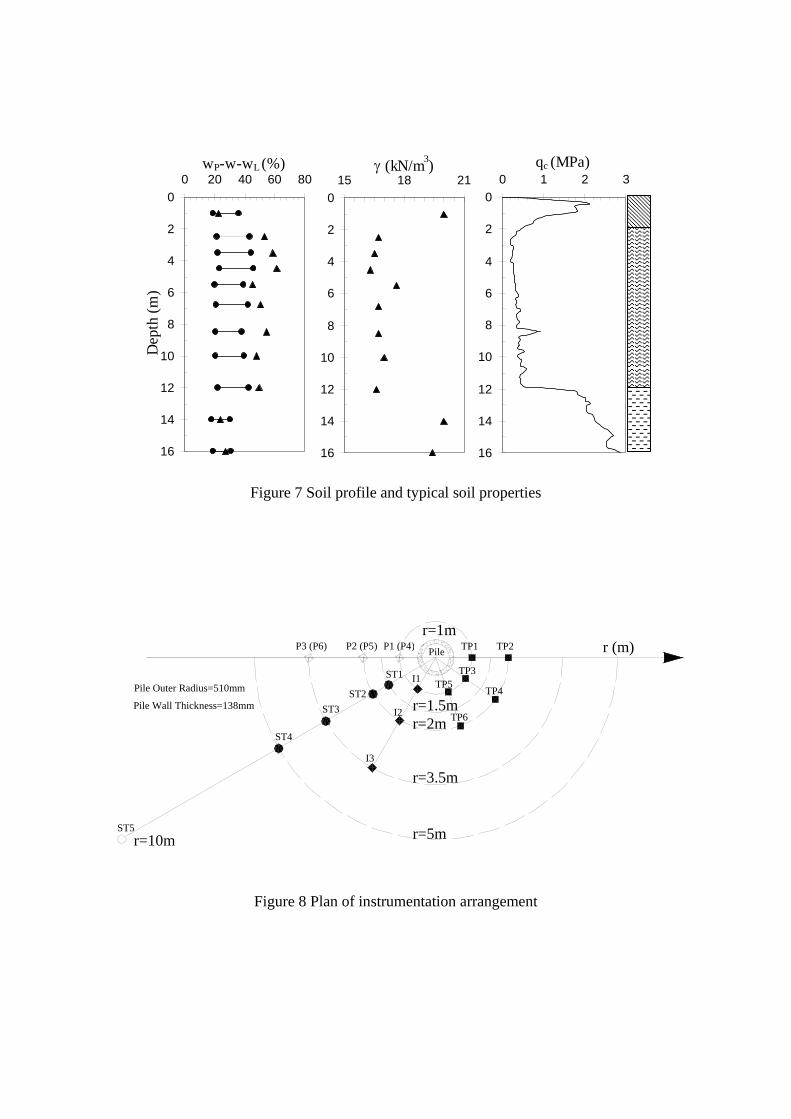
deposit of the Yangtze River. As shown in Fig. 7, the soil profile comprises a 2 m thick
layer of coarse-grained fill with some organic deposits overlying a 10 m thick deposit of
soft very silty clay. This deposit is underlain by Pleistocene stiff clay. The soft clay layer
has a low to medium plasticity. The natural water contents of the soil at most locations
are higher than the liquid limit. The liquidity index is 1.2. The cone penetration test (CPT)
tip resistance (qc) increases with depth from 470 kPa at 2 m to 1450 kPa at 12 m. The
water level was typically at a depth of 1.3 m and exhibited minor seasonal fluctuations.
The 2 m layer of surface fill is believed to have increased the clay’s vertical effectives
stresses (σ’v0) to values very close to the soil’s preconsolidation stresses. Therefore, the
soft clay may be considered to be normally consolidated or very lightly overconsolidated.
A plan of the instrumentation arrangement used in the vicinity of the pile is shown
in Fig. 8. This instrumentation comprised (i) 5 No. survey targets (ST1 to ST5) placed
along a radial direction at different distances from the pile to allow measurement of
ground surface heave and lateral movement, (ii) 3 No. inclinometers (I1 to I3) to measure
lateral ground movements, (iii) 6 No. pneumatic piezometers (P1 to P6) for pore pressure
measurements with 3 each installed at two levels and (iv) 6 No. 105 mm wide spade

7
pressure cell (TP1 to TP6) to record lateral total stresses. The 70 mm diameter
inclinometer casings were installed to a depth of about 14 m and were embedded firmly
in the very stiff silty clay present at this depth (see Fig. 7). A comparison of the
inclinometer data with the surveyed lateral movements at ground level indicated that the
inclinometer attained effective fixity (i.e. zero lateral soil movement) at a depth of 14 m.
The pneumatic piezometers were installed in pre-bored holes to depths of 3 m and 6 m at
the centre of 1 m high sand response zones, which were sealed at the top and bottom
using a thick layer of bentonite pellets. The total pressure were installed to their target
depths of 3, 6 and 9 m by pushing them a distance of 1m below the base of pre-drilled
boreholes.
As the field tests focused on obtaining information of the displacement and stress
changes in the soil mass surrounding the piles, the instrumentation was located at a
minimum radial distance from the pile centre of two pile radius, but not at (or close to)
the pile shaft. It was felt that such measurements, combined with static load tests on
individual PCC piles, would improve the understanding of the performance of PCC pile
groups, and provide an indication of the effects of adjacent PCC pile installation on a
recently cast PCC pile.
Instruments were installed before the pile was installed using a vibratory driver.
The casing had an outer diameter of 1.0 m and a wall thickness of 120 mm. The depth of
the pile was 12 m. Installation was halted temporarily at tip depths of 3 m, 6 m, and 9 m
to allow all instrumentation to be recorded. The soil plug length was monitored during
each pause in driving and was found to be typically 100 mm above ground level, i.e.,
installation occurred in a fully unplugged (or coring) mode. It normally took around 10
8
min to take all the measurements during each pause and, as a consequence, the total pile
installation time was about 45 min and over 30 min longer than that of a standard PCC
pile in these soil conditions.
Monitoring data
When the casing is driven into the ground, the soil around the casing will heave.
The amount of ground surface heave measured during the casing installation at distances
of 1.5, 2.0, 3.5 and 5.0 m from the centre of casing are shown in Fig. 9. It can be seen
that the deeper the penetration, the larger the amount of ground heave. However, the
amount of surface heave does not increase any more when the penetration depth is more
than 5 m. The distribution of the surface heave over the lateral distance from the centre
of the casing is shown in Fig. 10. This figure shows that the closer the distance to the
casing, the larger the amount of heave. The amount of heave reduces quickly with the
distance from the casing and becomes negligible at a distance of 5 m from the centre of
the pile, which is 5 times the outer diameter of the casing. The maximum amount of
ground heave is 2.7 cm, which is 2.7% of the outer diameter of the casing.
The ground horizontal displacements at distances of 1.5, 2.0, 3.5 and 5.0 m from
the centre of casing are shown in Fig. 11. The variations of horizontal displacements
with lateral distance are plotted in Fig. 12. It can be seen that the lateral displacement
increases with the depth of penetration. However, the lateral displacement occurs only
the distance of the soil from the centre of the casing is within 3.5 m, which is about 3.5
times the outer diameter of the casing, as shown in Fig. 12. The maximum amount of
lateral movement is less than half the maximum amount of heave.
9
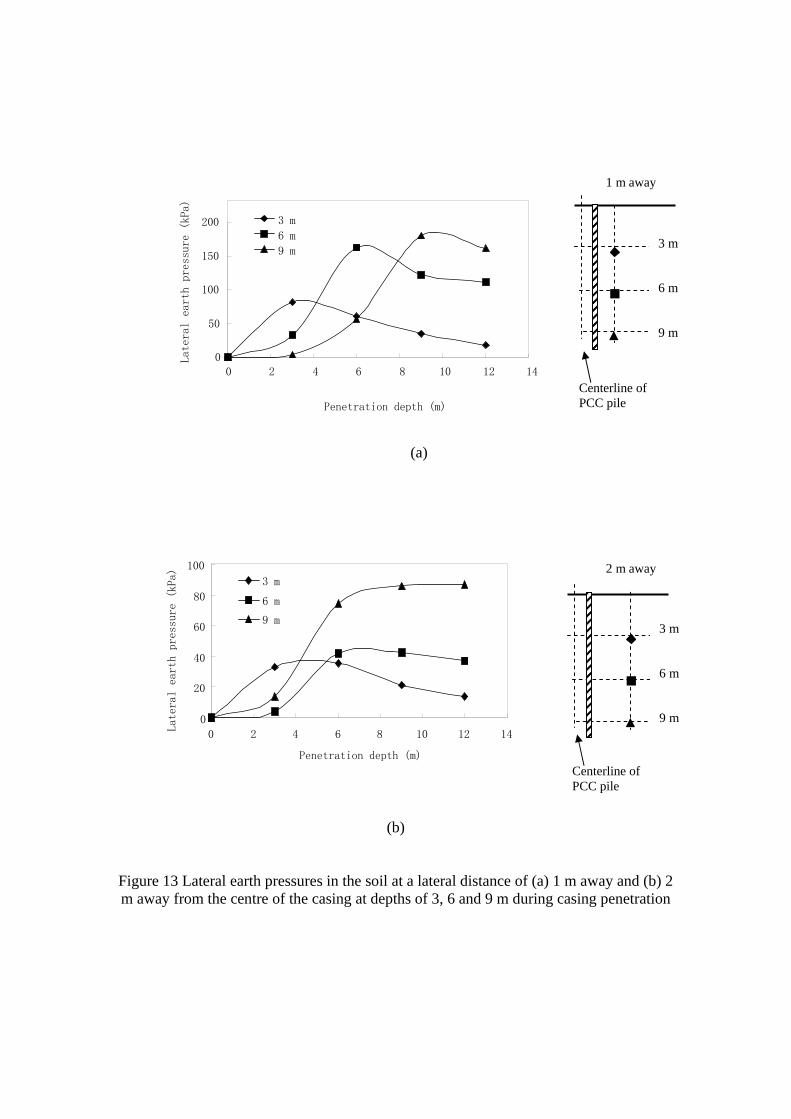
The lateral earth pressures in the soil at a lateral distance of 1 and 2 m away from
the centre of the casing were measured at depths of 3, 6 and 9 m during the penetration of
the double casings. The results are shown in Fig. 13. It can be seen that the earth
pressure in the soil becomes the largest when the casing tip is passing the soil element
and the earth pressure at 2 m away distance is smaller than that at 1 m away.
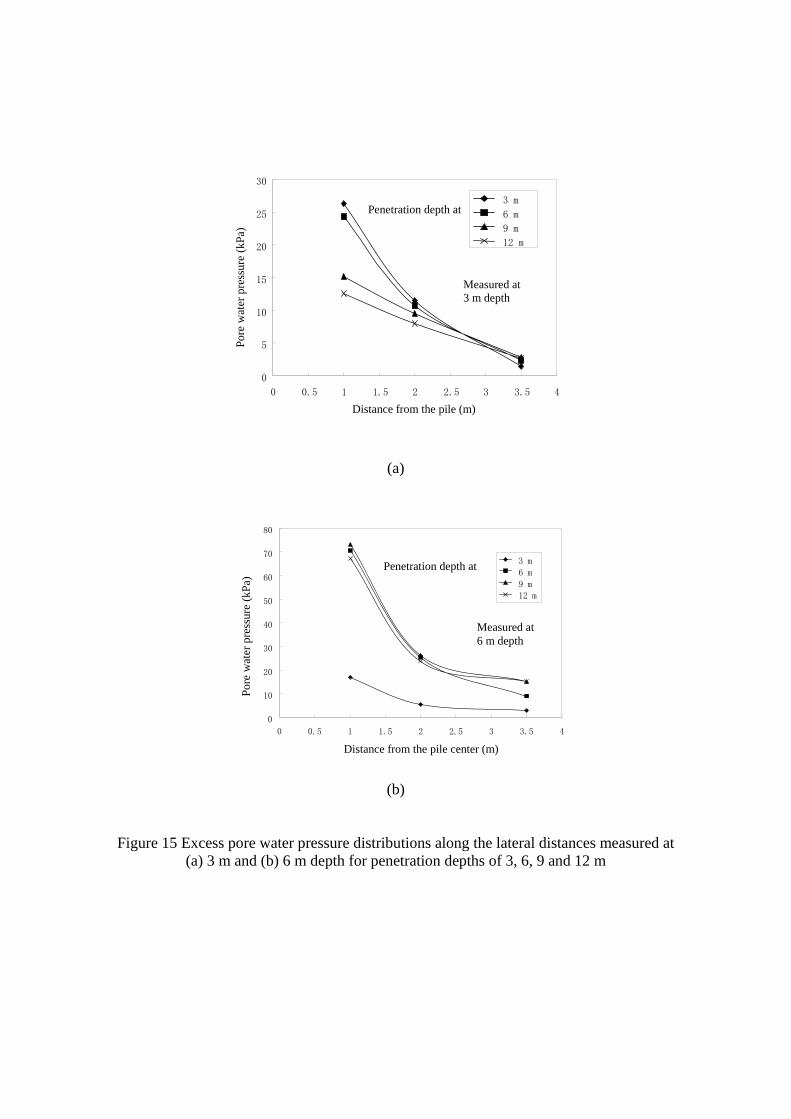
The excess pore water pressures measured at a lateral distance of 1, 2 and 3.5 m
away from the centre of the pile at depths of 3 and 6 m are presented in Fig. 14. The
largest pore water pressures occurred when the casing tip is passing the soil. The pore
water pressure maintains at essentially the same value after the casing tip has passed the
soil, as shown in Fig. 14. The excess pore water pressure distributions along the lateral
distances measured at 3 m and 6 m depths for penetration depths of 3, 6, 9 and 12 m are
shown in Figs. 15(a) and 15(b), respectively. It can be seen that the excess pore water
pressure generated at a distance of 3.5 m away from the centre of the pile is much smaller.
Based on the excess pore water pressures, the effect of casing installation on the
surrounding soil becomes insignificant when the soil is more than 3.5 m away from
centre of the pile, which is 3.5 times the outer diameter of the pile.
Using the lateral stresses and excess pore pressure measured (Figs. 14 and 15
respectively), the coefficient of lateral earth pressure K = σh'/σv' distributions at both 1
and 2 m away from the centre of the pile are shown in Figs. 16(a) and 16(b) respectively.
The effective vertical stress, σv', is calculated as the effective overburden stress. It can be
seen that the values of the coefficient of passive lateral earth pressure measured vary
considerably with the lateral distance to the pile and with the depth of penetration and
these values may not be predicted by the existing earth pressure theories.

10
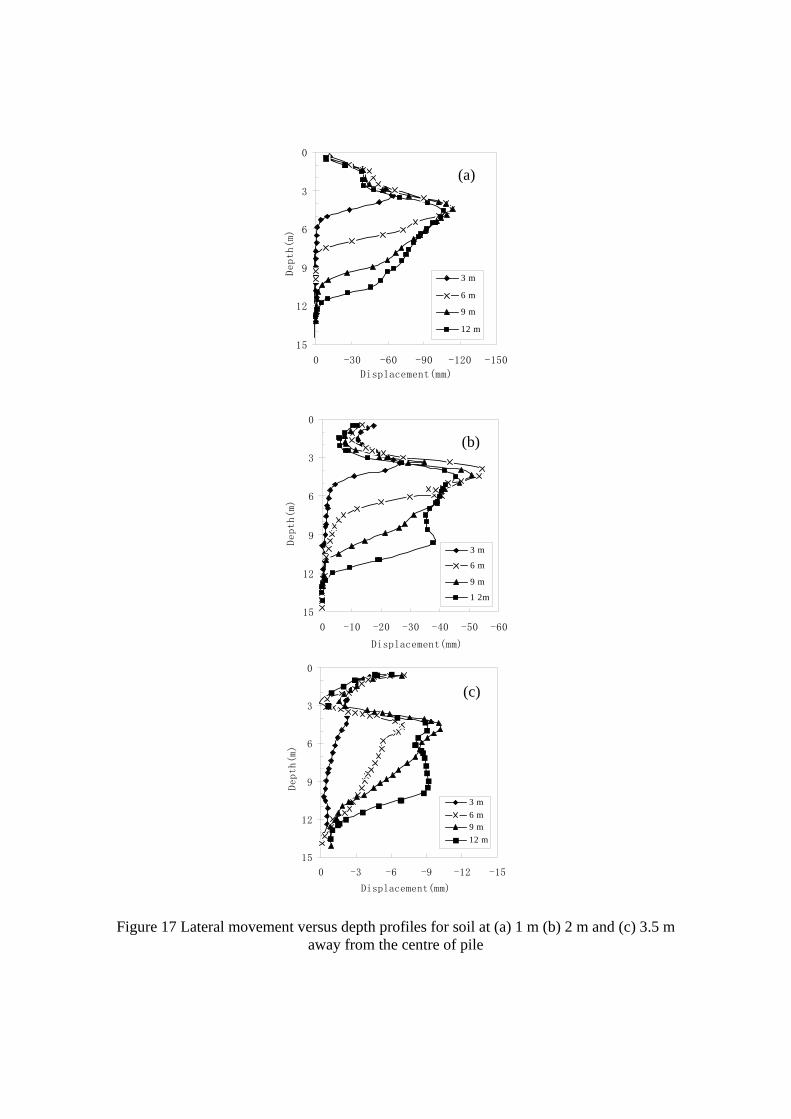
The lateral soil movements versus depth profiles as measured by inclinometers at
1, 2 and 3.5 m away from the center of the casing corresponding to different casing
penetrations are shown in Fig. 17. It can be seen that the largest lateral displacement
occurs at the top one third, i.e., 4 m depth, position. The closer to the casing, the larger
the lateral displacement. The lateral displacement at 3.5 m away from the centre of the
casing is within 10 mm, which is insignificant. It indicates again that the influence zone
of casing installation is only within 3.5 m as concluded based on pore water pressure
measurements.
Soil properties before and after pile installation
The results of two plate load tests are compared in Fig. 18. One test was
conducted on soil at the centre of a square PCC pile grid with a spacing of 3.5 m. Another
was conducted on soil before soil improvement, i.e., before the installation of piles at the
same location. A square plate of 500 by 500 mm was used. The plate load test was
conducted at the ground surface. It can be seen from Fig. 18 that the soil after the
installation of PCC piles has increased the bearing capacity to a certain extent. This was
likely due to the consolidation of pore pressure in the soil, the squeezing effect on soil
when the casing is jacked into the soil and the lateral support of the pile to the soil.
Quality control
As mentioned before, one of the major advantages of the PCC pile over the DCM
pile is that the quality control of the pile can be much improved and the quality of the
PCC pile can also be easily checked. As the piles are cast using steel casings as forms and
11
pure concrete, instead of mixing concrete with soil, necking and bulging of pile can be
prevented. Therefore, the annular cross-section of the pile is much more uniform and the
integrity of the pile is also much better. The use of casings also enables the concrete
volume required to form a pile to be estimated precisely. Thus the quality of the pile can
also be checked by the amount of concrete poured in during concreting.
To check the quality of the pile after formation, the following three methods can
be used: (1) excavating the soil inside the pipe pile for visual inspection and for taking
concrete samples from the PCC pile; (2) static pile load test; and (3) Low strain integrity
test.
As the PCC pile is hollow in the centre, the soil inside the PCC pile can be
excavated to detect directly any faulty on the inner surface of the pile, such as void,
necking or factures. Concrete samples can also be taken by coring small diameter
samples along the radial direction of the pile to measure the wall thickness and to test the
strength. For one test pile with an outer diameter of 1.0 m, wall thickness of 120 mm and
length of 15 m, the measured thickness and concrete strength along the depth are shown
in Fig. 19. It can be seen that the wall thickness varied within a range of 137 to 146 mm
and necking did not occur. The wall thickness exceeded the design thickness of 120 mm
at all the locations. This was caused by the fill-in of the gaps left by the withdrawal of
the casing. Because of this, the volume of concrete used is normally 1.45 to 1.50 times of
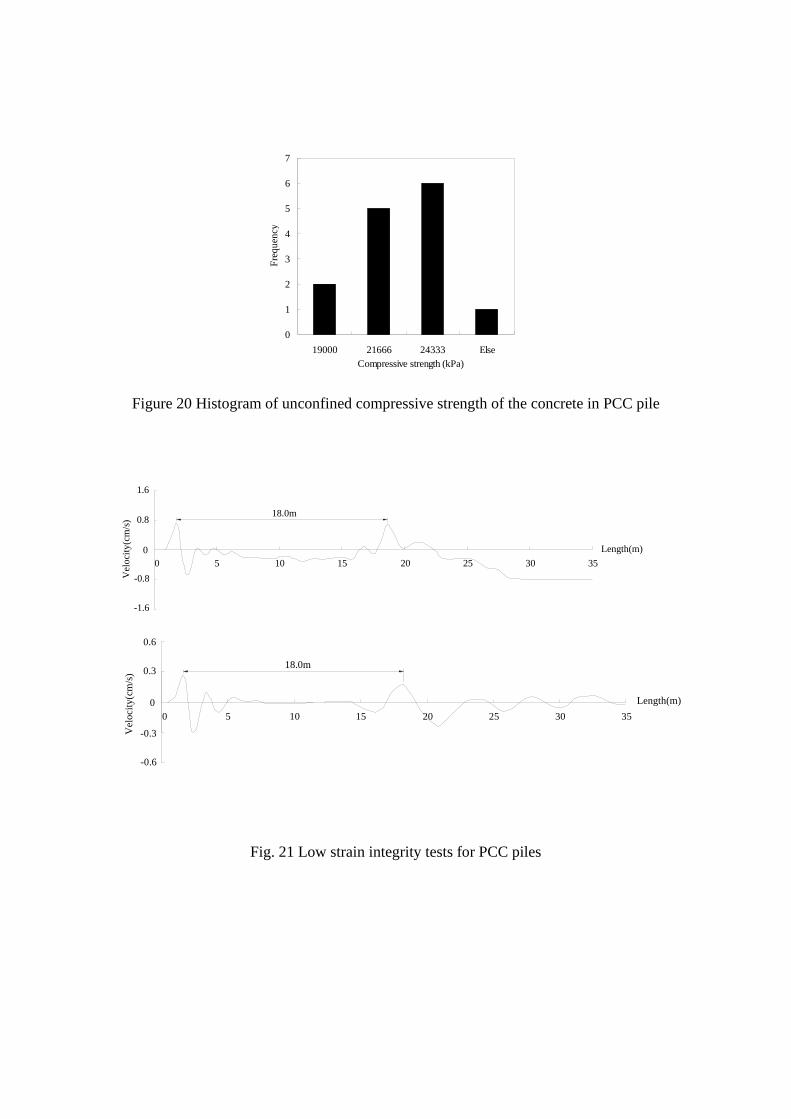
the nominal volume of the pile. The histogram of the unconfined compressive strength
measured for 14 concrete samples are shown in Fig. 20. It can also be seen that the
compressive strength of the concrete measured at different depths was quite consistent
with only 2 samples having strength less than 20 MPa.

12
Low strain integrity test has been used to test the integrity of the bored piles
(Hensen and Likins 2005). The basic theoretical background of the test has been
discussed in various litertures (e.g., Likins and Rausche 2000). The same method can be
used for PCC piles. The low strain integrity test is performed by striking the pile head
with a ligh hand-held hammer. The hammer blow induces a compressive stress-wave into
the pile. In the location where pile impedance changes, part of the whole of downward
wave reflects at the impedance variations and returns to the pile head before the first
reflection from the pile toe. Two examples of low strain integrity tests are shown in Fig.
21. The results show that the quality of the two piles tested were quite uniform.
Reflections only occurred at the pile cap and at the toe.
Pile load tests
Static pile load tests were also conducted on PCC piles. The results of one pile
load test are given in Fig. 22. The pile tested had a diameter of 1.0 m with a wall
thickness of 120 mm and a length of 15.5 m. It was conducted in soil with soil profile
similar to that shown in Fig. 7. The test was conducted by increasing the load in steps and
the settlement under each load was also monitored with time and the results are shown in
Fig. 23. The load-settlement curve indicates that the ultimate bearing capacity of the pile
is about 1000 kN and the settlement corresponding to the ultimate load is only 11.7 mm.
The rebound after unloading is 5.3 mm. Fig. 23 indicates that large creep deformation
starts to develop after the load is higher than 600 kN. Nevertheless, the settlement
developed with time under the ultimate load of 1000 kN is still gradual, as can be seen
from Fig. 23.

13
Conclusions
A new method of using large diameter, cast-in-situ thin wall concrete pipe piles (or
PCC piles) for soil improvement is introduced in this paper. It offers a better alternative
than the similar existing methods such as DCM and stone column piles. It is particularly
useful to be used as embankment pile to support embankment for bridge approach. The
PCC pile method enables the soil improvement works to be carried out in a relative
speedy and cost-effective way as compared with DCM and stone column methods. The
principles and construction techniques involved in this method are described. As the PCC
piles subject to wall frictions along both the inner and outer surfaces, it provides a much
larger bearing capacity than a solid pile of the same diameter. Full-scale model tests were
conducted to evaluate the performance of this technique. The test results show that the
installation of PCC pile causes a small amount of ground heave, horizontal movement
and some generation of pore pressure. However, the effect to the ground is insignificant
and the influence zone is limited within 3.5 m away from the centre of the PCC pile. One
of the major advantages of PCC piles is that the quality of the PCC piles can be much
better ensured than other similar methods. This is supported by the measured data on wall
thickness and strength of concrete of the pile body. The designated quality of PCC piles
can be achieved reliably and the quality of the pile can also be checked easily. Case
studies that illustrate the application of this method will be presented in a companion
paper.
14
References
Likins, G. and Rausche, F. (2000). Recent advances and proper use of PDI low strain pile
integrity testing. Proc. 6th International Conference on the Application of Stress-Wave
Theory to Piles, Sao Paulo, Brazil, 211-218.
Liu, H. L., Fei, K., Ma, X. H., and Gao, Y. F. (2003). Large-diameter driven cast-in-place
concrete thin-wall pipe pile (I) Research and Development. Journal of Rock and Soil
Mechanics, 24, 164-198.
Liu, H. L., Fei, K., Ma, X. H., and Gao, Y. F. (2003a). Large-diameter driven cast-in-
place concrete thin-wall pipe pile (II) Application. Journal of Rock and Soil
Mechanics, 24, 372-375.
Liu, H.L., Ma, X. H., Chu, H. Y., Chen, Y. H., and Gao, Y. F. (2004). Cast-in-place pipe
pile construction equipment for soft ground improvement, China Patent Number: ZL
02219218.X.
Liu, H.L., Ma, X. H., Chu, H. Y., Chen, Y. H., and Gao, Y. F. (2004a). Cast-in-place
pipe pile construction technology for soft ground im-provement, Chian Patent Number:
ZL 021125384.4.
Hensen, M.H. and Likins, G. (2005). Deep foundations quality control and quality
assurance testing methods. Florida Engineering Society, Mar, 11-13.

d
D
R
P
P
P
钢管模板
扰动挤密区
N
GF
Figure 1 Illustrations of friction forces acting on the PCC pile
2
3
4
1
5
2
3
4
1
5
8
7
8
7
立面图 侧面图
6
1: Base; 2: Gantry; 3: Vibrator; 4: Double-tube casing; 5: Casing shoes;
6: Tube for injecting slurry to assist driving; 7: Opening for concreting; 8: Concrete distributor
Figure 2 Illustration of PCC piling machine (a) Front view; (b) Side view
PCC pile Disturbed Soil Zone
(a) Front View (b) Side View

Figure 3 Picture of PCC piling machine
Figure 4 Picture of the cutting shoe used to close the annual steel casing

地面
桩机就位 振动沉管 浇注混凝土 振动拔管 成桩
Figure 5 PCC pile installation sequence: (a) Positioning casing; (b) Driving the casing; (c) Pouring concrete; (d) Extracting casing; (e) Formation of the pile
Figure 6 Pile cap.
(a) (b) (c) (d) (e)
Ground surface
0.5m 0.5 m
1.0 m
0
2
4
6
8
10
12
14
16
0 20 40 60 80wP-w-wL (%)
Dep
th (m
)
0
2
4
6
8
10
12
14
16
15 18 21γ (kN/m3)
0
2
4
6
8
10
12
14
16
0 1 2 3qc (MPa)
Figure 7 Soil profile and typical soil properties
Figure 8 Plan of instrumentation arrangement
r (m) P3 (P6) P2 (P5) P1 (P4) TP1 TP2
TP3
TP4TP5
TP6I2
I1
I3
ST1
ST2ST3
ST4
ST5r=10m r=5m
r=3.5m
r=2mr=1.5m
r=1mPile
Pile Outer Radius=510mm
Pile Wall Thickness=138mm

Figure 9 Ground surface heave measured during the casing installation to different depth at distances of 1.5, 2.0, 3.5 and 5.0 m from the centre of casing
Figure 10 Distributions of the surface heave over the lateral distance from the centre of the casing for penetration depths of 3, 6, 9 and 13.5 m
0.00
0.50
1.00
1.50
2.00
2.50
3.00
1.50 3.00 4.50 6.00 7.50 9.00
Distance to the centre of the pile(m)
Ground heave(
cm)
Penetration depth 3 m
6 m
9 m
13.5m
10.50
0.00
0.50
1.00
1.50
2.00
2.50
3.00
0.00 2.00 4.00 6.00 8.00 10.00 12.00 14.00 16.00 Penetration Depth(m)
Ground heave(
cm)
1.5 m from the centre
2.0 m 3.5 m 5.0 m

Figure 11 The ground horizontal displacements versus penetration depth curves for distances of 1.5, 2.0, 3.5 and 5.0 m from the centre of the casing
Figure 12 Horizontal displacements variation with distances from the centre of the casing
for penetration depths of 3, 6, 9 and 13.5 m
0
2
4
6
8
10
12
0 2 4 6 8 10 12 14 16 Penetration depth(m)
Horizontal ground displacement (mm)
1.5 m from the centre
2.0 m 3.5 m 5.0 m
0
2
4
6
8
10
12
1.5 3.5 5.5 7.5 9.5
Distance from the centre of the pile(m)
Horizontal ground displacement (mm)
Penetration depth 3 m
6 m
9 m
13.5 m
(a)
(b)
Figure 13 Lateral earth pressures in the soil at a lateral distance of (a) 1 m away and (b) 2 m away from the centre of the casing at depths of 3, 6 and 9 m during casing penetration
0
50
100
150
200
0 2 4 6 8 10 12 14
Penetration depth (m)
Lateral earth pressure (kPa)
3 m 6 m 9 m
0
20
40
60
80
100
0 2 4 6 8 10 12 14
Penetration depth (m)
Lateral earth pressure (kPa)
3 m
6 m 9 m
1 m away
2 m away
3 m 6 m 9 m
3 m 6 m 9 m
Centerline of PCC pile
Centerline of PCC pile

(a)
(b)
(c)
Figure 14 Excess pore water pressures measured at a lateral distance of (a) 1 m, (b) 2 m
and (3) 3.5 m away from the centre of the pile at depths of 3 and 6 m
0
5
10
15
20
0 2 4 6 8 10 12 14
3m
6m
Penetration depth (m)
Excess
pore
pre
ssures (kP
a)
3.5 m away
0
5
10
15
20
25
30
0 2 4 6 8 10 12 14
3m 6m
Penetration depth (m)
Excess po
re p
ressures (
kPa)
2 m away
0
20
40
60
80
0 2 4 6 8 10 12 14
3m 6m
Penetration depth (m)
Exc
ess
pore pressures
(kP
a)
1.0 m away from the centre
(a)
(b)
Figure 15 Excess pore water pressure distributions along the lateral distances measured at (a) 3 m and (b) 6 m depth for penetration depths of 3, 6, 9 and 12 m
0
5
10
15
20
25
30
0 0.5 1 1.5 2 2.5 3 3.5 4 Distance from the pile (m)
Pore
wat
er p
ress
ure
(kPa
)
3 m
6 m
9 m
12 m
Penetration depth at
Measured at 3 m depth
0
10
20
30
40
50
60
70
80
0 0.5 1 1.5 2 2.5 3 3.5 4
Distance from the pile center (m)
3 m
6 m
9 m
12 m
Pore
wat
er p
ress
ure
(kPa
)
Penetration depth at
Measured at 6 m depth

0
2
4
6
8
10
12
14
0.0 0.5 1.0 1.5
k value
Pen
etra
tion
dept
h(m
)
3m
6m
(a)
0
2
4
6
8
10
12
14
0.0 0.2 0.4 0.6 0.8
k value
Pen
etra
tion
dept
h (m
)
3m
6m
(b)
Figure 16 Coefficient of lateral earth pressure versus depth distributions measured at a distance of (a) 1 m and (b) 2 m away from the centre of the pile
1 m away
2 m away
0
3
6
9
12
15
-150-120-90-60-300
Displacement(mm)
Depth(m)
3 m
6 m
9 m
12 m
0
3
6
9
12
15
-60-50-40-30-20-100
Displacement(mm)
Depth(m)
3 m
6 m
9 m
1 2m
0
3
6
9
12
15
-15-12-9-6-30
Displacement(mm)
Depth(m)
3 m6 m9 m12 m
Figure 17 Lateral movement versus depth profiles for soil at (a) 1 m (b) 2 m and (c) 3.5 m away from the centre of pile
(a)
(c)
(b)
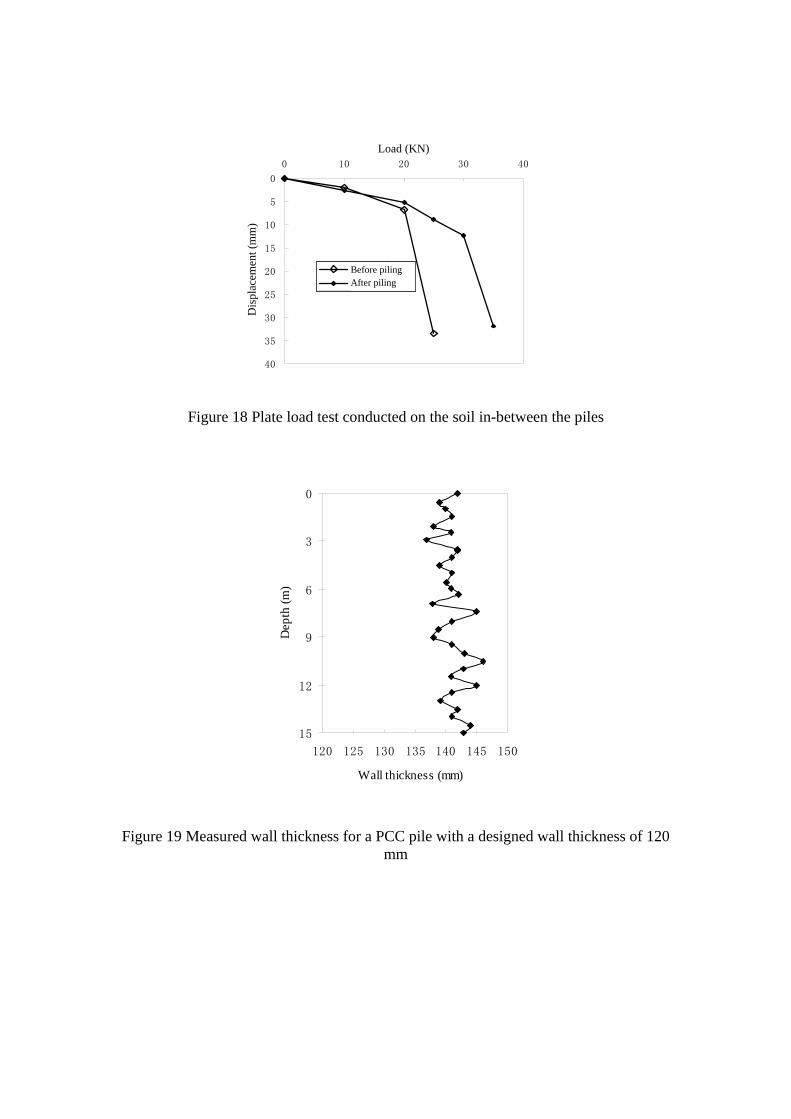
Figure 18 Plate load test conducted on the soil in-between the piles
0
3
6
9
12
15
120 125 130 135 140 145 150
Wall thickness (mm)
Dep
th (m
)
Figure 19 Measured wall thickness for a PCC pile with a designed wall thickness of 120 mm
0
5
10
15
20
25
30
35
40
0 10 20 30 40荷载(KN)
位移(mm)
打桩前
打桩后
Load (KN)
Dis
plac
emen
t (m
m)
Before piling After piling
0
1
2
3
4
5
6
7
19000 21666 24333 ElseCompressive strength (kPa)
Freq
uenc
y
Figure 20 Histogram of unconfined compressive strength of the concrete in PCC pile
18.0m
Length(m)
Vel
ocity
(cm
/s)
35302520151050
1.6
0.8
0
-0.8
-1.6
35302520151050
0.6
0.3
0
-0.3
18.0m
-0.6
Vel
ocity
(cm
/s)
Length(m)
Fig. 21 Low strain integrity tests for PCC piles
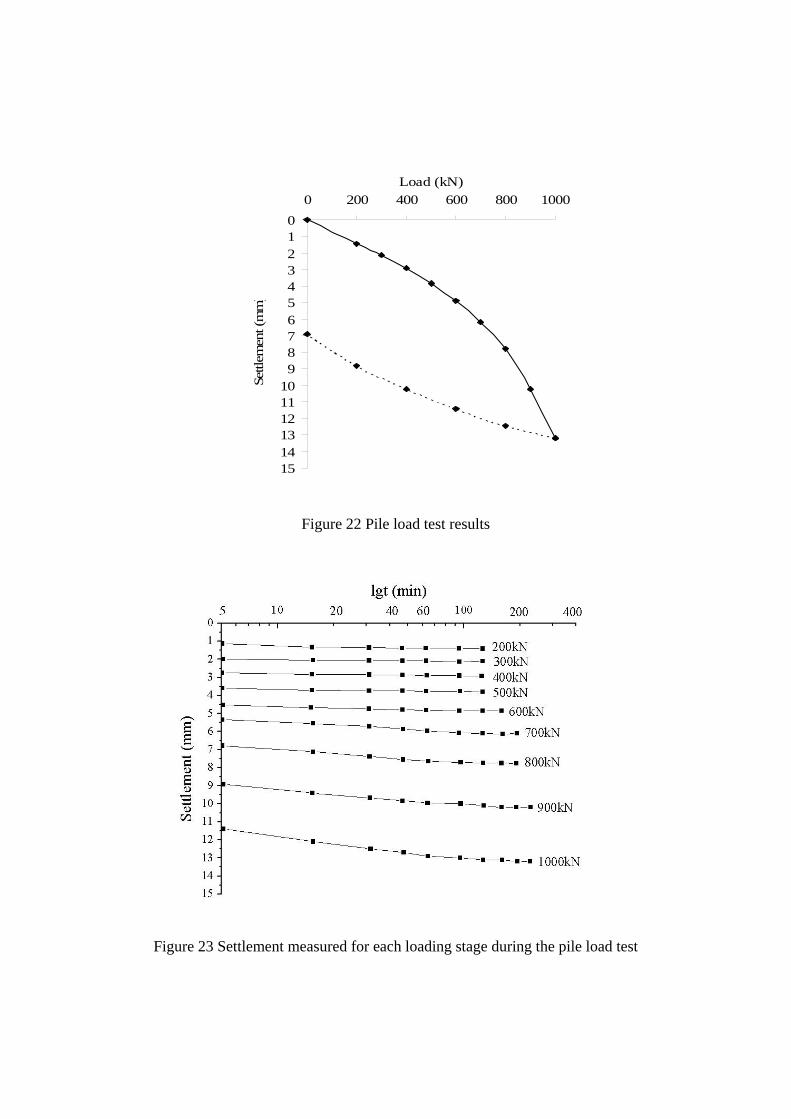
Figure 22 Pile load test results
Figure 23 Settlement measured for each loading stage during the pile load test
0123456789
101112131415
0 200 400 600 800 1000Load (kN)
Settl
emen
t (m
m)