hand interaction in augmented reality - carleton...
TRANSCRIPT

Hand Interaction in Augmented Reality
by Chris McDonald
A thesis submitted to
the Faculty of Graduate Studies and Research in partial fulfillment of
the requirements of the degree of
Master of Computer Science
The Ottawa-Carleton Institute for Computer Science School of Computer Science
Carleton University Ottawa, Ontario, Canada
January 8, 2003
Copyright © 2003, Chris McDonald

ii
The undersigned hereby recommend to the Faculty of Graduate Studies and Research
acceptance of the thesis,
Hand Interaction in Augmented Reality
submitted by
Chris McDonald
in partial fulfillment of the requirements for the degree of
Master of Computer Science
___________________________________________ Dr. Frank Dehne
(Director, School of Computer Science)
___________________________________________ Dr. Gerhard Roth
(Thesis Supervisor)
___________________________________________ Dr. Prosenjit Bose
(Thesis Supervisor)

iii
Abstract
A modern tool being explored by researchers is the technological augmentation of human
perception known as Augmented Reality. This technology combines virtual data with the
real environment observed by the user. A useful synthesis requires the proper registration
of virtual information with the real scene, implying the computer’s knowledge of the
user’s viewpoint. Current computer vision techniques, using planar targets within a
captured video representation of the user’s perspective, can be used to extract the
mathematical definition of that perspective in real-time. These embedded targets can be
subject to physical occlusion, which can corrupt the integrity of the calculations. This
thesis presents an occlusion silhouette extraction scheme which uses image stabilization
to simplify the detection and correction of target occlusion. Using this extraction
scheme, the thesis also presents a novel approach to hand gesture-based interaction with
the virtual augmentation. An interactive implementation is described, which applies this
technology to the manipulation of a virtual control panel using simple hand gestures.

iv
Acknowledgements
To begin, I would like to thank my thesis supervisor, Gerhard Roth, for his dedication
and commitment to my successful completion of this Master’s degree. His guidance,
assistance and encouragement were invaluable to this thesis, and I am especially grateful
to him for providing me with this opportunity. I would also like to thank my co-
supervisor, Jit Bose, for his support and assistance throughout my graduate program.
I would also like to thank Shahzad Malik, for without his previous hard work in this field,
my thesis would not have been possible. I also thank him for his assistance with software
development and his partnership on our research publications. Mark Fiala deserves a
thank you for his helpful comments on this thesis and his insightful perspective on the
graduate experience.
Finally, I would like to thank my mother, whose endless support has enabled me to
pursue my goals with full attention and rewarding success. For this, I dedicate this thesis
to her.

v
Table of Contents Abstract............................................................................................................................. iii Acknowledgements .......................................................................................................... iv Table of Contents .............................................................................................................. v List of Tables ................................................................................................................... vii List of Figures................................................................................................................. viii Chapter 1 Introduction.................................................................................................... 1
1.1 Motivation....................................................................................................... 3 1.2 Contributions................................................................................................... 5 1.3 Thesis Overview ............................................................................................. 6
Chapter 2 Related Work ................................................................................................. 7 2.1 AR Technologies ............................................................................................ 7
2.1.1 Monitor-Based ........................................................................................ 8 2.1.2 Video See-Through HMD..................................................................... 11 2.1.3 Optical See-Through HMD................................................................... 12
2.2 Registration Technologies ............................................................................ 14 2.2.1 Registration Error.................................................................................. 15 2.2.2 Inertial Tracking.................................................................................... 17 2.2.3 Magnetic Tracking ................................................................................ 17 2.2.4 Computer Vision-Based Tracking ........................................................ 18 2.2.5 Hybrid Tracking Solutions.................................................................... 23 2.2.6 Registration using Vision Tracking ...................................................... 24
2.3 Human-Computer Interaction through Gesture ............................................ 27 2.3.1 Gesture Modeling.................................................................................. 29 2.3.2 Gesture Analysis ................................................................................... 31 2.3.3 Gesture Recognition.............................................................................. 33
Chapter 3 Vision-Based Tracking for Registration.................................................... 35 3.1 Pin-hole Camera Model ................................................................................ 36
3.1.1 Intrinsic Parameters .............................................................................. 38 3.1.2 Extrinsic Parameters ............................................................................. 38
3.2 Camera Calibration ....................................................................................... 40 3.3 Planar Patterns .............................................................................................. 42 3.4 Planar Homographies.................................................................................... 43 3.5 Augmentation with Planar Patterns .............................................................. 45
3.5.1 2-Dimensional Augmentation............................................................... 45 3.5.2 3-Dimensional Augmentation............................................................... 46
3.6 Planar Tracking System Overview ............................................................... 49 3.7 Image Binarization........................................................................................ 50 3.8 Connected Region Detection ........................................................................ 51 3.9 Quick Corner Detection ................................................................................ 52 3.10 Region Un-warping....................................................................................... 53 3.11 Pattern Comparison....................................................................................... 54 3.12 Feature Tracking ........................................................................................... 56

vi
3.13 Corner Prediction .......................................................................................... 56 3.14 Corner Detection........................................................................................... 57 3.15 Homography Updating.................................................................................. 58 3.16 Camera Parameter Extraction ....................................................................... 59 3.17 Virtual augmentation .................................................................................... 59
Chapter 4 Stabilization for Handling Occlusions ....................................................... 61 4.1 Image Stabilization ....................................................................................... 62 4.2 Image Subtraction ......................................................................................... 64 4.3 Image Segmentation...................................................................................... 66
4.3.1 Fixed Thresholding ............................................................................... 66 4.3.2 Automatic Thresholding ....................................................................... 67
4.4 Connected Region Search ............................................................................. 69 4.5 Improving the Tracking System.................................................................... 73
4.5.1 Visual Occlusion Correction................................................................. 73 4.5.2 Search Box Invalidation........................................................................ 75
Chapter 5 AR Interaction through Gesture ................................................................ 78 5.1 Hand Gesture Recognition over the Target .................................................. 79
5.1.1 Gesture Model....................................................................................... 80 5.1.2 Gesture System Overview..................................................................... 82 5.1.3 Posture Analysis.................................................................................... 83 5.1.4 Fingertip Location................................................................................. 83 5.1.5 Finger Count ......................................................................................... 86 5.1.6 Gesture Recognition.............................................................................. 87
5.2 Interaction in an AR Environment................................................................ 89 5.2.1 Virtual Interface .................................................................................... 90 5.2.2 Hand-Based Interaction ........................................................................ 91 5.2.3 Interface Limitations............................................................................. 92
Chapter 6 Experimental Results................................................................................... 97 6.1 Computation Time ........................................................................................ 97 6.2 Practical Algorithmic Alternatives ............................................................. 100
6.2.1 Target Detection.................................................................................. 100 6.2.2 Corner Detection................................................................................. 102 6.2.3 Stabilization ........................................................................................ 105 6.2.4 Video Augmentation........................................................................... 106
6.3 Overall System Performance ...................................................................... 107 Chapter 7 Conclusions................................................................................................. 110
7.1 Thesis Summary.......................................................................................... 110 7.2 The Power of Augmented Interaction......................................................... 112 7.3 Mainstream Potential of Augmented Reality.............................................. 113 7.4 Future Work ................................................................................................ 113
7.4.1 Augmented Desk Interfaces................................................................ 113 7.4.2 AR-Based Training ............................................................................. 114
Bibliography .................................................................................................................. 116

vii
List of Tables Table 6.1: Computation Time on Standard Processors.............................................. 98 Table 6.2: Frame Rate on Standard Processors........................................................ 108

viii
List of Figures Figure 2.1: Monitor-based Augmented Reality system................................................. 8 Figure 2.2: Mirror-based augmentation system............................................................. 9 Figure 2.3: Looking-glass augmentation system......................................................... 10 Figure 2.4: Video see-through Augmented Reality system......................................... 11 Figure 2.5: Video see-through HMD........................................................................... 12 Figure 2.6: Optical see-through Augmented Reality system....................................... 13 Figure 2.7: Optical see-through HMD......................................................................... 14 Figure 2.8: Targets in a video scene............................................................................ 20 Figure 2.9: Natural features detected on a bridge........................................................ 22 Figure 2.10: The coordinate systems in AR .................................................................. 25 Figure 2.11: Accurate registration of a virtual cube in a real scene .............................. 26 Figure 2.12: Gesture recognition system overview....................................................... 29 Figure 2.13: Taxonomy of hand gestures for HCI ........................................................ 30 Figure 2.14: Gesture analysis system ............................................................................ 32 Figure 3.1: Pin-hole camera model ............................................................................. 36 Figure 3.2: A camera calibration setup........................................................................ 40 Figure 3.3: Sample patterns......................................................................................... 42 Figure 3.4: Camera, image and target coordinate systems.......................................... 43 Figure 3.5: Tracking system overview ........................................................................ 50 Figure 3.6: Image frame binarization .......................................................................... 51 Figure 3.7: A sample pixel neighbourhood ................................................................. 52 Figure 3.8: Pixel classifications................................................................................... 53 Figure 3.9: Region un-warping.................................................................................... 53 Figure 3.10: Target occlusion........................................................................................ 55 Figure 3.11: Corner localization search boxes .............................................................. 57 Figure 3.12: Two-dimensional virtual augmentation .................................................... 60 Figure 4.1: Image stabilization using the homography ............................................... 63 Figure 4.2: Stabilized image subtraction ..................................................................... 66 Figure 4.3: Target occlusion........................................................................................ 71 Figure 4.4: Stabilized occlusion detection................................................................... 72 Figure 4.5: Occlusion correction using the stencil buffer ........................................... 75 Figure 4.6: Corner invalidation using search box intrusion ........................................ 77 Figure 5.1: Gesture system overview .......................................................................... 82 Figure 5.2: Finger tip location using blob orientation................................................. 86 Figure 5.3: Finger count from the number of detected blobs ...................................... 87 Figure 5.4: Gesture recognition................................................................................... 88 Figure 5.5: Gesture system finite state machine.......................................................... 89 Figure 5.6: Control panel dialog and virtual representation........................................ 91 Figure 5.7: Control panel selection event.................................................................... 92 Figure 5.8: Gesture-based interaction system ............................................................. 95 Figure 6.1: Computation time versus processor speed.............................................. 100 Figure 6.2: Scaled target detection ............................................................................ 102

ix
Figure 6.3: Blob-based target .................................................................................... 103 Figure 6.4: Blob occlusion ........................................................................................ 104 Figure 6.5: Stabilized approximation ........................................................................ 106 Figure 6.6: Video augmentation process ................................................................... 106

1
Chapter 1
Introduction
A new field of research, whose goal is the seamless presentation of computer-driven
information with a user’s natural perspective of the world, is Augmented Reality (AR).
Augmented Reality is a perceptual space where virtual information, such as text or
objects, is merged with the actual view of the user’s surrounding environment. In order
for the computer to generate contextual information, it must first understand the user’s
context. The parameters of this context are limited to environmental information and the
user’s position and orientation within that environment. With such information, the
computer can position the augmented information correctly relative to the surrounding
environment. This alignment of virtual objects with real scene objects is known as
registration. Methods for augmenting a user’s view, along with potential applications of
such augmentation are being studied. This research strongly considers the performance
limitations of modern computer technology.
The performance requirements of an AR system can be contrasted to a Virtual Reality
(VR) system. A virtual reality system is one where the user is immersed in a scene that is
completely synthetic, yet perceived to be real. To create a realistic, virtual scene, the
detail level of the generated objects must be high and the rendering must be performed in
real-time. This level of detail generates a performance hit to the system in order to render

2
such objects. The virtual objects in an AR system however, are not required to be at any
particular detail level. The realistic quality of the virtual objects in an AR system is
constrained only by the application. The other, and most significant rendering difference
between the two types of systems, is the percentage of scene content that is rendered. An
AR system that renders only a few simple virtual objects in a scene will require far less
rendering power than that of a VR system rendering the entire scene.
The real-time requirement of VR is not a strict requirement of AR. The merging of the
real scene with virtual objects can be done in real-time (online), or it can be done at a
later time (offline). Depending on the AR application, each could be acceptable.
Augmenting a recorded football game with virtual yard line markers can be done in real-
time while viewers watch the live game on television. If the same game is not to be
viewed live, then the augmentation could be done after the game and displayed whenever
the broadcast occurs. In general, the application requirements are flexible in an AR
system, whereas the performance requirements of a VR are the same for all VR systems.
A second notable contrast between the two systems is the problem of registration. Since
registration deals with the merging of real and synthetic objects, VR systems are not
concerned with registration. The positions of all objects in a VR scene are described in
terms of a common coordinate system. This means that the VR system has the correct
registration for free. In terms of performance, the lower rendering cost of AR is counter-
balanced by the cost of registration.

3
The other aspect of the system that works in conjunction with the rendering component is
the equipment used to track the user and display the scene. In the VR system, devices are
used to track the user along with a display showing the rendered scene. In the AR
system, there are several different combinations of equipment used to track and inform
the user.
1.1 Motivation
Since the birth of computing technology, humans have used computers as a tool to further
their progress. Numerical computation has always been the backbone of computing
technology, but as this technology advances, a wider range of high-level tools are
realized. Augmented Reality is ultimately the addition of computer-generated
information related to the user’s current perception of reality. The more information we
have about our surroundings, the better equipped we are to function in that environment.
This concept of information as a useful tool has been seen in all aspects of life. Equipped
with a map and compass, someone can more easily navigate through an unfamiliar
environment. The map informs the user of environmental information while the compass
provides a sense of direction relative to that environment. These tools are useful aids, but
they still leave room for human expertise for their effective use. Imagine the same user
equipped with a wearable computer, continuously providing directional information to
keep this user on course. This technology could guide a user with limited knowledge
4
through completely foreign environments. Augmented Reality has many known uses and
will continue to advance the human toolset as its technology advances.
The medical field has been significantly impacted by the introduction of AR. The ability
of a surgeon to visualize the inside of a patient [SCHW02], can greatly improve the
precision of operation. Other fields have also been positively impacted. From the
augmentation of live NFL broadcasts [AZUM01], where the “first down line” is added, to
the assisted maintenance of aircraft through heads-up information [CAUD92],
Augmented Reality is proven to be a useful and powerful tool in our society.
These forms of human-computer interaction involve one-way communication. The
computer system acquires knowledge pertaining to the user, position and orientation for
example, and uses this knowledge to communicate to the user in context. The user’s
view of the environment is then augmented with pertinent information. The power of AR
would be taken a step further with the introduction of user interaction with the augmented
information. This interaction would allow the user to decide if, how, when, and where
information is augmented. The ability of the user to interact with and control the
augmented world is currently missing in AR systems. For Augmented Reality to become
as common as the wristwatch, an acceptable mechanism for such two-way
communication must be established.

5
1.2 Contributions
This thesis describes a solution for capturing and applying hand interaction within a
vision-based Augmented Reality system. The key contributions [MCDO02, MALI02a,
MALI02b] of this thesis are:
• The use of the homography computed by the tracking system for image
stabilization relative to a detected target.
• A description of key improvements made to the previously described vision-based
tracking system [MALI02c].
• A description of a hand gesture recognition and application system that was
designed and implemented based on the above-mentioned tracking system.
• An overview of applying the standard two-dimensional window interface
technology to AR environments.

6
1.3 Thesis Overview
We begin in Chapter 2 with an overview of Augmented Reality and Gesture Recognition.
Chapter 3 discusses the details of the vision-based pattern tracking system used for
solving the registration problem. This system is the foundation for registering a virtual
coordinate system that is used for virtual augmentation and hand-based interaction within
the augmented environment.
Chapter 4 discusses the use of image stabilization as a foundation for accurate hand
detection and analysis.
Chapter 5 discusses the details of the hand gesture recognition and application system
that takes advantage of stabilized image analysis.
Chapter 6 provides an analysis of the performance results of the system and algorithmic
approximations used to achieve these results.
Chapter 7 concludes the thesis by summarizing the contributions made and discusses the
mainstream potential and future directions of stabilized interaction.

7
Chapter 2
Related Work
Augmented Reality is becoming a broad field with research exploring many types of
hardware and software systems. Any system delivering an augmented view of reality
requires technology to gather, process and display information.
2.1 AR Technologies
Since there are a wide range of applications, there are many types of AR systems
available. The common thread between them is in the use of information gathering and
display technology. The degree to which the user feels immersed in the displayed
environment is directly dependent on the display technology and indirectly dependent on
the information gathering technology. If the gathering overhead is slow or inaccurate
then the overall system immersion is affected. Display systems must place minimal
disruption between the user and the real environment in order to retain the presence that
the user has in any real environment. The following types of systems are ordered based
on their hindrance of presence felt by the user.

8
2.1.1 Monitor-Based
In a monitor-based system, a monitor is used to the display the augmented scene. A
camera gathers the video sequence of the real scene while its three dimensional position
and orientation is being monitored. The graphics system uses the camera position to
render the virtual objects in their proper position. The video is then merged with the
graphics output and displayed on the monitor. Figure 2.1 outlines this process.
Figure 2.1 - Monitor-based Augmented Reality system [VALL98]
A variation of monitor-based technology is a mirror-like setup in which the camera and
monitor display are oriented towards the user, as shown in figure 2.2 [FJEL02]. As a
result, the user sees a mirror reflection of the real environment which includes the
augmentation of virtual information.

9
Figure 2.2 - Mirror-based augmentation system [FJEL02]
This type of system gives the user little sense of presence in the real scene. Instead, the
user is an outside observer of the scene. To enhance the viewing perspective, the video
can be rendered in stereo giving depth perspective. This feature requires the use of
stereovision glasses when viewing the monitor.
In order to enhance the user’s experience even further, the augmented scene viewpoint
needs to correspond with the user’s actual viewpoint. A monitor-based system that aligns
a semi-transparent monitor with the camera, facing opposite directions, produces a
looking glass system. An example of such a system, used in [SCHW02] is shown in
figure 2.3. This type of system improves immersion in the augmented space by allowing
the alignment of the user’s view of the real world and that of the augmented environment.
Although an improvement in immersion is observed, any discrepancy between the user’s

10
view of the environment and that of the camera results in immersion loss. This
discrepancy is a result of the head’s freedom of motion with respect to the camera and
display.
Figure 2.3 - Looking-glass augmentation system [SCHW02]
In order to alleviate this discrepancy, the user’s head must be tracked and the augmented
display must be on the viewer’s head. This would provide the augmentation system with
the information required to register the virtual objects with the user’s view of the
environment. These requirements are satisfied by using a head-mounted display (HMD),
which uses one of two types of augmentation technologies: video see-through or optical
see-through. The phrase ‘see-through’ refers to the notion that the user is seeing the real-
world scene that is in front of him even when wearing the HMD.

11
2.1.2 Video See-Through HMD
In a video see-through system, a head-mounted camera is used in conjunction with a head
mounted tracker to gather the necessary scene input. The viewpoint position is given to
the graphics system to render the virtual objects in their proper position. The real world
scene is captured by the video camera, combined with the graphics output, and displayed
to the user through the head-mounted monitor system. Figure 2.4 outlines this HMD
technology system.
Figure 2.4 - Video see-through Augmented Reality system [VALL98]
As shown in Figure 2.5, a user of this type of HMD is presented with all aspects of the
scene through the head-mounted monitor. This means the real scene must be merged
with the graphics output in order to display the augmented scene to the user. This
merging process adds delays to the system. The amount of system delay directly
translates into lag time seen by the user, which reduces the user’s feeling of presence.

12
Figure 2.5 - Video see-through HMD [VALL98]
This is a disadvantage to the video see-through technology that cannot be avoided, but
can be minimized. The advantage of this type of system is that while gathering the real
scene through video, information about the scene can be extracted. This capability can
assist in the process of tracking the head position and thus leading to a more accurate
registration. Another advantage to this type of system is that the video display is
typically high-resolution. This means that there is the potential to render highly detailed
virtual objects in combination with the input video. An alternative to having the video
input is the optical see-through technology.
2.1.3 Optical See-Through HMD
The optical alternative for HMD systems is a technology that combines real objects with
virtual ones in a different way than the video see-through systems. As shown in Figure
2.6, the optical see-through system does not use video input at all. The real-world
component of the augmentation is simply the user’s actual view of the environment. The

13
user sees an augmented scene through the use of optical combiners, which add the
graphics output to the real view.
Figure 2.6 - Optical see-through Augmented Reality system [VALL98]
The advantage of an optical see-through system is that the user is viewing the actual
environment, as opposed to a video representation of it. Since the user views the actual
scene the virtual component is the only possible source of lag. And for the same reason
the scene quality of direct view of the world is superior to a video representation.
Therefore using a see-through system eliminates the problem of system lag and improves
the quality of view of the augmented scene.
14
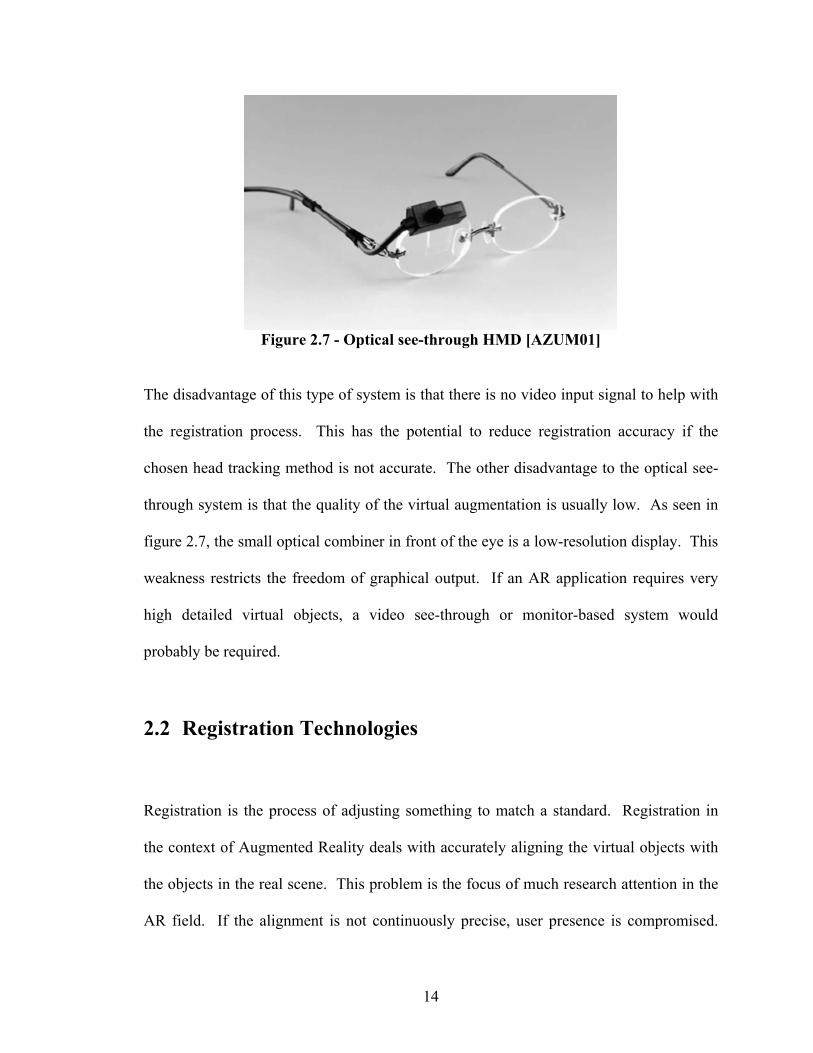
Figure 2.7 - Optical see-through HMD [AZUM01]
The disadvantage of this type of system is that there is no video input signal to help with
the registration process. This has the potential to reduce registration accuracy if the
chosen head tracking method is not accurate. The other disadvantage to the optical see-
through system is that the quality of the virtual augmentation is usually low. As seen in
figure 2.7, the small optical combiner in front of the eye is a low-resolution display. This
weakness restricts the freedom of graphical output. If an AR application requires very
high detailed virtual objects, a video see-through or monitor-based system would
probably be required.
2.2 Registration Technologies
Registration is the process of adjusting something to match a standard. Registration in
the context of Augmented Reality deals with accurately aligning the virtual objects with
the objects in the real scene. This problem is the focus of much research attention in the
AR field. If the alignment is not continuously precise, user presence is compromised.

15
Poor registration results in unstable alignment of virtual objects, leading to a sluggish and
unnatural behaviour as seen by the user. Many factors affect accurate registration and
even small errors can result in noticeable performance degradation [AZUM97b].
2.2.1 Registration Error
Static Errors
Static errors in an augmented reality system are usually attributed to static tracker errors,
mechanical misalignments in the HMD, incorrect viewing parameters for rendering the
images, and distortions in the display [AZUM94, AZUM97b]. These errors involve
misalignments that occur in the system even before user motion is added. Mechanical
errors require mechanical solutions. This may simply mean using more accurate
technology. The accuracy of the viewing parameters depends on the method for their
calculation. These parameters include the center of projection and viewport dimensions,
offset between the head tracker and the user’s eyes, and the field of view. The estimation
of these parameters can be adjusted by manually correcting the virtual projection in some
initialization session. An alternate approach is to directly measure these parameters using
additional tools and sensors. Another technique that can be used with video-based
systems is to compute the viewing parameters by gathering a set of 2D images of a scene
from several viewpoints. Matching common features in a large enough set of images can
also be used to infer the viewing parameters [VALL98].

16
Dynamic Errors
Dynamic errors are the dominant source of error in augmented reality systems and are the
result of motion in the scene [AZUM97a]. User head movement or virtual object motion
can cause these errors. As time goes on, the error generated by motion, for some non-
vision systems such as accelerometers and gyroscopes, accumulates resulting in
noticeable misalignment. The sensors used to track head motion often exhibit
inaccuracies that lead to improper positioning of the virtual objects. The same outcome
can be observed when there are noticeable delays in the system. System delay can result
from delays in graphics rendering, viewpoint calculation, and the combination of the real
scene and the virtual objects [JACO97]. Increasing the efficiency of the rendering
techniques or decreasing the detail can improve the performance. The combination phase
usually plays a minimal role in system delay and is inevitable. The focus of much
research to reduce delay is on the accurate calculation of the user’s viewpoint. An
estimated viewpoint can be easily sensed without correction, but this results in poor
registration. As the complexity of the error reduction algorithms increases, so does the
time to produce an augmented image. Different registration techniques have been
developed which attempt to accurately track viewpoint motion, while minimizing system
delay. The goal in terms of registration in Augmented Reality is to produce an
augmented scene in which the user cannot detect misalignment or system delay.

17
2.2.2 Inertial Tracking
Inertial tracking is a technique for tracking the user’s head motion by using inertial
sensors [YOU99]. These sensors contain two devices: gyroscopes and accelerometers.
The accelerometers are used to measure the linear acceleration vectors with respect to the
inertial reference frame. This information leaves one problem unsolved – the
acceleration component due to gravity. In order to subtract this component, leaving the
actual head acceleration, the orientation of the head must be tracked. Gyroscopes are
used to give a rotation rate that can be used to determine the change in orientation with
respect to the reference frame. This type of tracking system can quickly determine
changes in head position, but suffers from errors that accumulate over time.
2.2.3 Magnetic Tracking
Magnetic sensing technology uses the earth’s magnetic field to determine the location
and orientation of the sensor relative to a reference position. This technology gives direct
motion feedback, but suffers from error that accumulates over time. An advantage of this
type of system is its portability, which adds minimal constraints on the user motion. The
main disadvantage of this technology is its limited range and susceptibility to error in the
presence of metallic objects and strong magnetic fields generated by such computer
equipment as monitors. The strengths of magnetic tracking make it a good candidate for
hybrid tracking systems that attempt to eliminate the magnetic weaknesses by adding
other complementary tracking technology.

18
2.2.4 Computer Vision-Based Tracking
In Augmented Reality systems that use video as input, the input source itself provides
information about the structure of the scene. This information along with the intrinsic
parameters of the camera can be used to compute the camera position. This is
accomplished by tracking features in the video sequence. Some systems use manually
placed targets to aid in this tracking. This type of tracking is known as landmark
tracking. The Euclidean position of each target in the environment is known, and this
information can be used to infer the camera position. This technique requires two or
more target features to be visible at all times, but it does provide an accurate registration.
The number of target features required depends on the number of degrees of freedom of
the viewpoint. The focus of target systems is to determine the position of objects in the
scene relative to the camera. The negative aspect of the target-based systems is the
obvious need for targets in the environment, which constrains the range of user motion.
On the other hand, this tracking method can be performed online when using modern
computers. The vision-based approach is not restricted to pre-determined landmarks, but
can also extract scene information using the natural features that occur in the captured
video frames. Using natural features of the environment instead of targets removes the
restriction on the camera motion. However, natural feature detection normally adds
enough computational complexity to restrict it to an offline operation. In both target and
natural feature tracking systems, the features must be found before they can be tracked.
A search process first detects the presence of features in the scene. Then these features
are tracked through the video sequence based on their assumed limited motion between

19
successive frames. The ultimate goal with a vision-based system is to have an accurate,
online system with the flexibility of natural feature detection. The user of this system
would enjoy an immersed augmentation through any range of motion. However, online
tracking using natural features is not yet feasible in a general environment.
Targets
To provide the ability to track online in real-time, targets are commonly used for feature
tracking in computer vision [SIMO02]. They provide the ability to simplify the detection
process while retaining accuracy. When the characteristics of a target can be chosen
before the tracking procedure is designed, the tracking process is simplified. One such
aspect is that of colour. If the environment contains no traces of red, for example, then
choosing a red target would simplify the target detection process. When the image
tracker finds red pixels, a target has been found. Another aspect that can simplify the
tracking process is that of shape. Since the detection of corner points is common-place in
computer vision, opting for square targets simplifies the target detection algorithms.
Figure 2.8(a) shows the use of coloured circular landmarks for feature tracking, whereas
the system in figure 2.8(b) uses corners. The 3D coordinates of the targets are known a
priori. The targets used in this and similar approaches can also be directly used for the
initial camera calibration.

20
(a) (b)
Figure 2.8 – Targets in a video scene (a) Circular multi-coloured rings [STAT96] (b) Square shapes with corner features
The method for detecting the targets in a frame is similar in principle to that of a
calibration process. During calibration, the emphasis is on the accuracy of measurements
and not on the real-time performance. During the tracking phase, performance is critical
when working with a real-time AR system. To improve the detection performance,
Kalman filter techniques are used to smooth out the effect of sensor error during the
estimate of camera pose and motion.
The target-based approach has advantages and disadvantages. One disadvantage is that
the viewed environment must contain a minimum number of unobstructed targets. Also,
the stability of the pose estimate diminishes with fewer visible features [NEUM99]. It
may also be undesirable to engineer large environments with targets to satisfy these
constraints.

21
Natural Features
To solve the problem of feature tracking in large-scale environments where the target
approach is unfeasible, the use of natural feature tracking is being explored [CORN01].
The reason for using natural features is to eliminate the requirement to place targets in the
environment. Although the features are no longer engineered, the 3D coordinates of all
tracked features must be known or computed in order to determine the camera
parameters.
One example of a system utilizing natural feature tracking is an AR system in the Paris
urban environment [BERG99]. In this system, a modified Pont Neuf bridge is created
and merged with the real video sequence. The goal of the system is to preview a lighting
project by graphically lighting a 3D model of the bridge and merging it with the scene. It
makes use of the fact that there exists a model with known 3D coordinates. A
disadvantage of the system is that the selection of image features must be done manually
by the user each time a new feature point enters the view. This selected 2D point is
manually mapped to the corresponding 3D coordinate in the model. As this feature point
moves through the video sequence, an automatic feature detection process tracks the
motion. Figure 2.9 shows the manually selected features (denoted with crosses) and the
automatically detected arcs and pillar base corners.

22
Figure 2.9 - Natural features detected on a bridge [BERG99]
It is much faster and simpler for a user to select feature points than have a
computationally intensive algorithm perform the task. The obvious disadvantage of this
system is that it is restricted to offline augmentation. Each time a new feature point
becomes visible to the user, the video sequence must be stopped while the user performs
the selection.
An alternative approach to the manual offline method of natural feature tracking is the
real-time system proposed by Neumann and You [NEUM99]. While the system is
completely automated this introduces more computational complexity in the system. The
tracking procedure works as follows:
1. The feature points are automatically selected based on certain criteria. This
criterion is dynamically updated as the session progresses.
2. The selected feature points are tracked through the video sequence using
computer vision techniques.

23
3. The camera pose and 3D coordinates of the feature points are determined by
vision-based techniques such as photogrammetry [ROTH02].
2.2.5 Hybrid Tracking Solutions
To date, no single tracking solution perfectly solves the registration problem. In an effort
to improve the overall registration within a particular AR application, a hybrid of two or
more tracking techniques can be used. The goal of combining techniques is to combine
the strengths in order to reduce the weaknesses.
Inertial and Vision
Inertial tracking technology is robust, large-range and is passive and self-contained. The
problem with this approach is that it lacks accuracy over time due to inertial drift. Vision
based techniques are accurate over long periods of time, but suffer from occlusion and
computation expense. By combining the two techniques [YOU99], the hybrid system can
provide an accurate registration over time. Although the combined system improves the
performance, the computational expense and vision range limits inhibit the complete
success of the approach.
Magnetic and Vision
A vision-based tracking approach is appealing due to its high accuracy in optimal
environments. To expand the flexibility of this approach while retaining accurate

24
registration the system needs backup head motion information. If the vision system fails
to locate the required landmarks, a second tracking system could be used until the vision
system returns accurate information. This is the motivation behind combining the
landmark approach with the magnetic approach [STAT96]. The magnetic system is
simply a backup that is used to verify the vision-based landmark system. The hybrid
approach works by continuously comparing the vision results with those of the magnetic
sensors. If the difference is within a certain threshold, the registration is likely to be
correct. The other benefit to this hybrid approach is that the magnetic sensor data can be
used to accelerate the search time of the vision system. The magnetic system narrows the
search area that the vision system must check in order to locate the landmark. The
advantages of this hybrid technique improve the overall system performance, but the
comparison process adds inevitable delay.
2.2.6 Registration using Vision Tracking
In order for the graphics system to render virtual objects at the desired position and with
the correct pose, an accurate perspective transformation is required. This transformation
is represented by a virtual camera using the pin-hole camera model [ROTH99]. The
accurate correlation between the real and virtual camera and the scenes that they capture
is the fundamental aspect of AR registration.
In order for virtual objects to be rendered correctly, the four coordinate systems outlined
in figure 2.10 must be known.

25
Figure 2.10 - The coordinate systems in AR [VALL98]
The world coordinate system is the initial point of reference. From that coordinate
system, the video camera coordinate system must be determined using computer vision-
based approach. The transformation from the world coordinate system to the video
camera coordinate system is denoted by C. The projective transformation defined by the
camera model is denoted by P. The final transformation needed to perform proper
registration is the transformation from the object-centered coordinate system to the world
coordinate system, O. The 3D coordinates of the virtual objects are assigned a priori, so
this transformation can be constructed at that time. When rendering is performed, the
graphics camera coordinate system is taken to be the video camera coordinate system.
With the two cameras aligned, the merged real and synthetic components of the scene
will be properly registered.
This geometric model of the system forms the foundation for a vision-based approach to
tracking camera motion. The only parameter in the system that varies over time,
assuming that the intrinsic camera parameters remain fixed, is the world-to-camera
transformation C. This transformation changes as the camera pose changes. If the
camera is accurately tracked, C can be determined and the synthetic frame can be

26
properly rendered. An example of virtual object registration is demonstrated in figure
2.11. In this figure, a virtual cube is rendered on a real pillar in the video scene. As the
camera moves, both the real and virtual scene objects move accordingly to produce a
synthesized augmented object in image-space.
Figure 2.11 - Accurate registration of a virtual cube in a real scene [CORN01]
Through the use of vision-based techniques, the extrinsic parameters of the real camera
are determined. In order to do this, the intrinsic parameters must be known a priori and
this is computed by performing an initial camera calibration. Since the intrinsic
parameters of the camera are assumed to remain fixed throughout the video sequence, the
calibration need only be done once [KOLL97].
27
2.3 Human-Computer Interaction through Gesture
Human interaction with computer technology has for many years been a machine-centric
form of communication. It has relied on the user’s ability to conform to interface
strategies that better suit the technology than the user. As the use of computer technology
spreads, the physical and expressive limitations of current interaction methods are
increasingly counter-productive.
Current interface technology such as the mouse and keyboard associated with desktop
computers has become ubiquitous in mainstream computing. This role is based on
application interface technology that has been used for decades. As the application
domain expands, this technology will reveal its performance inhibitions.
In an effort to overcome the barrier associated with current interface solutions, much
research is being done in the domain of gesture recognition. Because gesture recognition
is a natural form of human expression, it seems reasonable to apply it to the
communication channel of Human-Computer Interaction (HCI). Several techniques for
capturing gesture have been proposed [OKA02, ULHA01, CROW95]. Gesture
interpretation for HCI requires the measurability of hand, arm and body configurations.
Initial methods were attempted to directly measure hand movements using glove-based
strategies. These methods required that the user be attached to the computer through the
connecting cables. This restricts the user significantly in their environment.

28
Overcoming this contact-based interpretation requires the inference-based methods of
computer vision. As processor power continues to rise, the once complex algorithms of
the field are becoming available as real-time applications. Most computer vision-based
gesture recognition strategies focus on static hand gestures known as postures. However,
it has been argued that the motion within gesture communication conveys as much
meaning as the postures themselves. Examples include global hand motion and isolated
fingertip motion analysis.
The interpretation of gesture can be broken down into three phases: modeling, analysis
and recognition. Gesture modeling involves the schematic description of a gesture
system that accounts for its known or inferred properties. Gesture analysis involves the
computation of the model parameters based on detected image features captured by the
camera. The recognition phase involves the classification of gestures based on the
computed model parameters. These phases are outlined in figure 2.12.

29
Figure 2.12 - Gesture recognition system overview [PAVL97]
Although much research has been done in the field of gesture recognition, HCI
interaction involving accurate, real-time interpretation is a long way off. The key to
simplifying the domain of human gesture possibilities is to construct a gesture model
which clearly describes the sub-domain of gesture that will be classified by the associated
system.
2.3.1 Gesture Modeling
To determine an appropriate model for a given HCI system, the application must be
clearly defined. Simple gesture requirements result in simple gesture models. Likewise,
complex gesture interpretation, involves defining a complex model.

30
Gesture is defined as the use of body and motion as a form of expression and social
interaction. This interaction must be interpreted for communication to be successful.
Gesture interpretation is considered a psychological issue, which plays a role in the
taxonomy of the varying types of human gesture. Figure 2.13 outlines one such
taxonomy.
Figure 2.13 - Taxonomy of hand gestures for HCI [PAVL97]
It is crucial for any gesture recognition system to distinguish between the higher level
classifications such as gesture versus unintentional movements and manipulation versus
communicative.
It has been suggested that the temporal domain of human gesture, for example, can help
classify a gesture from unintentional movement. The temporal aspect of gesture has three
phases: preparation, nucleus, and retraction [PAVL97]. The preparation phase involves
the preparatory movement of the body from its rest position. The nucleus phase involves

31
a definite form of body, while the retraction phase describes the return of the body to its
rest position. The preparation and retraction phase are characterized by rapid motion,
whereas the nucleus phase shows relatively slow motion. Some measurable stray from
these temporal properties could indicate unintentional movement as opposed to gestures
in the classification process.
Two forms of modeling are being explored; appearance and 3D model-based modeling.
Appearance-based modeling deals with the direct interpretation of gesture from images
using templates. Image content features such as contours, edges, moments and even
fingertips can form a basis for parameter extraction with respect to the gesture model
chosen. Three-dimensional model-based modeling is used to describe motion and
posture in order to then infer the gesture information. Volumetric models are visually
descriptive, but are complex to interpret using computer vision. Skeletal models describe
joint angles which can be used to infer posture and track motion.
2.3.2 Gesture Analysis
Gesture analysis involves the estimation of the gesture model parameters by extracting
information from the video images. This estimation begins by detecting features in the
video frame and then uses these features to estimate the parameters. Figure 2.14 shows
the gesture analysis system and its relation to the overall gesture recognition system.

32
Figure 2.14 - Gesture analysis system [PAVL97]
Feature detection can be done by using colour cues such as the colour of skin, clothing,
special gloves and/or markers placed on the user’s hands. This form of feature detection
can be done with minimal restrictions on the user. However, the computer vision
techniques required for such extraction are computationally expensive, often decreasing
the real-time potential of the system. Feature detection can also be done using motion
cues. This form of feature detection places significant constraints on the system. This
process requires that at most, a single person performs a single gesture at any given time.
It also requires that the person and gesture remain stationary with respect to the image
background.
Parameter estimation through 3D model estimation involves the estimation and updating
of kinematic parameters of the model such as joint angles, lengths and dimensions.
Using inverse kinematics for estimation involves the prior knowledge of linear

33
parameters. This linear assumption is prone to estimation errors of the joint angles. 3D
model estimation is computationally expensive and can fail when occlusion of fingertips
occurs. Other approaches make use of the arm, which has less joint complexity and
fewer occlusions. A second class of estimation approaches uses moments or contours in
silhouettes or grayscale images of the hands. These approaches are sensitive to occlusion
and lighting changes in the environment. They do require an accurate bounding box to
aid in the segmentation process. Such a bounding box requires accurate motion
prediction schemes and/or restrictions of the hand postures.
2.3.3 Gesture Recognition
Successful gesture recognition requires clear classification of the model parameters. This
process can be difficult when attempting feature extraction schemes that rely on complex
computer vision techniques. For example, contours can be misinterpreted when used for
the recognition of gesture so their use is usually restricted to tracking. On the other hand,
slight changes in hand rotation while presenting the same posture can be interpreted as
different postures using geometric moments. Temporal variance is an important issue
that needs to be studied in more detail. For example, hand clapping should be recognized
properly regardless if it is done slowly or quickly. Hidden Markov Models (HMMs)
have shown promise in distinguishing gesture in the presence of duration and variation
changes

34
Another recognition approach is to use motion history images (MHIs) or temporal
templates. Motion templates accumulate the motion history of a sequence of visual
images into a single two-dimensional image. Each MHI is parameterized by the time
history window that was used for its computation. Multiple templates with varying
history window times are gathered to allow time duration invariance. This process is
computationally simple, but recognition problems can stem from the presence of artifacts
in the images when auxiliary motions are present.
Although it seems that 3D model-based approaches can capture the richest set of hand
gestures in HCI, the applications that use such methods are rarely real-time. The most
widely used gesture recognition approaches use appearance-based models. Current
applications in the field of hand gesture related to HCI are attempting to replace the
keyboard and mouse hardware with gesture recognition. Exciting possibilities with
helping physically-challenged individuals and the manipulation of virtual objects are
being explored.

35
Chapter 3
Vision-Based Tracking for Registration
The AR interaction system described in this thesis uses computer vision-based tracking to
solve the registration problem. This chapter outlines the details of the tracking system
which is based on the work introduced in [MALI02c] and is used as a platform for
extending the system capabilities to allow interaction in the augmented environment.
The key to extracting the camera parameters in a given image sequence is to understand
the motion characteristics of the captured scene throughout that sequence. The intrinsic
and extrinsic parameters of the camera are directly reflected in the captured scene.
Inferring scene characteristics through the detection and tracking of natural features can
often be fruitless and time-consuming when the computer system has no prior knowledge
with which to start. To simplify this process, pre-constructed planar patterns are used as
reference elements in the scene giving the analysis process a target to detect and track.
This simplification results in camera motion being computed relative to the target in the
captured scene. Before describing the planar tracking system in more detail we will first
describe the basic pin-hole camera model that is used in all AR applications.

36
3.1 Pin-hole Camera Model
The pin-hole camera model is commonly used in computer graphics and computer vision
to model the projective transformation of a three-dimensional scene onto a two-
dimensional viewing plane. Figure 3.1 [ROTH99] shows this camera model where the
camera lens (pin-hole) is at the origin and a point p is projected onto the film at point p’.
The distance between the photographic film and the lens is known as the focal length and
is labeled d.
-d
p
p’
z
yx
Pin hole at origin
Photographic film
(a)
xy
zx
y(x’,y’)
x’
y’r’
r
d
(x, y, z)
View plane
(b)
Figure 3.1 – Pin-hole camera model [ROTH99] (a) The pin-hole camera model (b) The image plane at +d to avoid image inversion

37
Using this model, we can define the relationship between the three-dimensional
coordinates in the virtual scene, x and y, and the resulting two-dimensional image
coordinates, x’ and y’:
zxdx =' and
zydy =' (3.1)
In its general form, this relationship can be represented by the following homogeneous
transformation [ROTH99]:
Mpp =' ,
where p and p’ are homogeneous points and M is the 4x4 projection matrix, rewritten as
follows:
=
10/1000/0000/0000/
'''
zyx
zzd
zdzd
wzyx
In order to obtain this projection matrix for an arbitrary camera position in space, the
intrinsic and extrinsic parameters of the camera must be independently extracted.

38
3.1.1 Intrinsic Parameters
The intrinsic parameters of the camera that must be extracted are the focal length,
location of image center (principle point) in pixel space, aspect ratio and a coefficient of
radial distortion [MALI02c]. The focal length, f, is the value of d in figure 3.1. The
image center and aspect ratio describe the relationship between image-space coordinates,
(x’,y’), and camera coordinates, (x,y) given by:
xx soxx )'( −−= (3.2)
yy soyy )'( −−=
Here (ox,oy) represent the pixel coordinates of the principal point and (sx,sy) represent the
size of the pixels (in millimeters) in the horizontal and vertical directions respectively.
Under most circumstances, the radial distortion can be ignored unless high accuracy is
required in all parts of the image.
3.1.2 Extrinsic Parameters
The extrinsic parameters of the camera are its position and orientation. These parameters
describe a transformation between the camera and world coordinate systems. This
transformation consists of a rotational component, R, and a translational component, T,
both in world coordinates is described as follows:

39
TPP wc += R (3.3),
for a point, Pc, in camera coordinates and a point, Pw, in world coordinates. Thus, the
perspective transformation can be expressed in terms of the camera parameters by
substituting equations 3.2 and 3.3 into equation 3.1. This gives
)()(
)'(TPRTPR
wT
3
wT
1
−
−=−− fsox xx
(3.4)
)()(
)'(TPRTPR
wT
3
wT
2
−
−=−− fsoy yy
where Ri, i=1,2,3, denotes the 3D vector formed by the i-th row of the matrix R.
The intrinsic parameters can be expressed in a matrix, Mi, defining the relationship
between camera space and image space as follows:
=
1000
0
yv
xu
i ofof
M ,
where x
u sff −
= and y
v sff −
= .
The extrinsic camera parameters can be expressed in a separate matrix, Me, defining the
relationship between world coordinates and camera coordinates as follows:
=
3333231
2232221
1131211
trrrtrrrtrrr
Me ,

40
where TR T1−=1t , TR T
2−=2t , and TR T3−=3t .
With this new interpretation, the original projection matrix, M, can be expressed in terms
of Mi and Me as follows:
==
3333231
2232221
1131211
trrrtfrfrfrftfrfrfrf
MMM vvvv
uuuu
ei ,
Normally the intrinsic camera parameters are computed using a calibration process.
3.2 Camera Calibration
Camera Calibration is the process of calculating the intrinsic (focal length, image center,
and aspect ratio) camera parameters. This is accomplished by viewing a predefined 3D
pattern from different viewpoints. Along with the intrinsic camera parameters the
extrinsic parameters (pose) of the camera are also computed [TUCE95]. Figure 3.2
shows an example of a calibration pattern where the 3D world coordinates of the
butterflies are known ahead of time.
Figure 3.2 - A camera calibration setup [TUCE95]

41
The calibration procedure used in [TUCE95] is outlined as follows:
1. The camera is pointed at the calibration grid.
2. A copy of the camera image is read into the computer via a frame grabber.
3. The centers of the butterfly patterns are located within the grabbed image which
gives the 2D image coordinates corresponding to the known 3D locations of the
actual butterflies. This step can be performed with manual point selection or by
an automatic method.
4. This process is repeated for a number of different camera positions.
The known 3D coordinates of the pattern points are used to find both the intrinsic and
extrinsic camera parameters. The accuracy of such a camera calibration procedure can be
affected by the nonlinear lens distortions of the camera. The pin-hole camera model that
is used assumes that there is no nonlinear distortion, whereas the lenses on real cameras
sometimes distort the image in complex ways. Fortunately, in standard video-based AR
systems this distortion is often insignificant, and hence ignored. Another important point
is that for augmented reality the final output is viewed by a person, and people can
tolerate a small amount of visual distortion. So the radial distortion can be ignored in
many AR applications.

42
3.3 Planar Patterns
The appearance of the patterns used is tightly coupled with the requirements of the video
analysis algorithms. Therefore, a rigid set of constraints is placed on patterns used by the
system. The stored visual representation of each pattern is a 64x64 pixel bitmap image.
This image is essentially a black square containing white shapes defining a set of interior
corners. A text file, storing the corner locations, accompanies the image file to form the
internal representation of the pattern. Figure 3.3 shows some samples of patterns used by
the system.
Figure 3.3 – Sample patterns
The scene representation of a pattern, herein referred to as a target, is printed on white
paper in such a way as to leave a white border around the black square. This high-
contrast pattern, and hence target, simplifies delectability and ensures a well-defined set
of interior and exterior corners.
These corners are used as the fundamental scene features in all the camera parameter
calculations. Between any two frames of video containing the planar target, the position
correspondences of the corner points define a 2D to 2D transformation. This
transformation, known as a planar homography, represents a 2D perspective projection

43
representation of the camera motion relative to the target. Over time, this definition of
the camera path would accumulate errors. In order to avoid such dynamic error, the
homography transformation is instead defined from pattern-space to image-space. In
other words, a homography is computed for each frame using the point locations in the
original pattern and their corresponding locations in the image frame. Figure 3.4 shows
the relationship between the camera, image and target (world) coordinate systems.
Figure 3.4 – Camera, image and target coordinate systems
3.4 Planar Homographies
A planar homography, H, is a 3x3 matrix defining a projective transformation in the
plane (up to scale) as follows [HART00, ZISS98]:
=
11''
yx
Hyx
(3.1)

44
This assumes that the target plane is z=0 in world coordinates. Each point
correspondence generates two linear equations for the elements of H. Dividing by the
third component removes the unknown scale factor:
333231
232221
333231
131211 ','hyhxhhyhxhy
hyhxhhyhxhx
++++
=++++
=
Multiplying out gives:
232221333231
131211333231
)(')('
hyhxhhyhxhyhyhxhhyhxhx++=++++=++
These two equations can be rearranged as follows:
0'''1000'''0001
=
−−−−−−
hyyyxyyxxyxxxyx
where,
Τ= ),,,,,,,,( 333231232221131211 hhhhhhhhhh
is the matrix H written as a vector.

45
For 4 point correspondences we get:
0hh ==
−−−−−−−−−−−−−−−−−−−−−−−−
A
yyyxyyxxyxxxyxyyyxyyxxyxxxyxyyyxyyxxyxxxyxyyyxyyxxyxxxyx
'''1000'''0001'''1000'''0001'''1000'''0001'''1000'''0001
4444444
4444444
3333333
3333333
2222222
2222222
1111111
1111111
The solution h is the kernel of A. A minimum of 4 point correspondences, generating 2n
linear equations, are necessary to solve for h. For n>4 correspondences, A is a 2n x 9
matrix. In this situation there will not be a unique solution to Ah=0. It is necessary to
subject h to the extra constraint that 1=h . Then h is the eigenvector corresponding to
the least eigenvalue of ATA, and this can be computed using standard numerical methods
[TRUC98].
3.5 Augmentation with Planar Patterns
3.5.1 2-Dimensional Augmentation
Using the homography directly provides a mechanism for augmenting 2D information on
the plane defined by the target in the image sequence. This is done by projecting the 2D
points defining the virtual object into image-space and rendering the virtual objects with
46
respect to their image-space definition. This augmentation method is performed without
camera calibration, since the camera parameters are not needed in order to compute the
required homography.
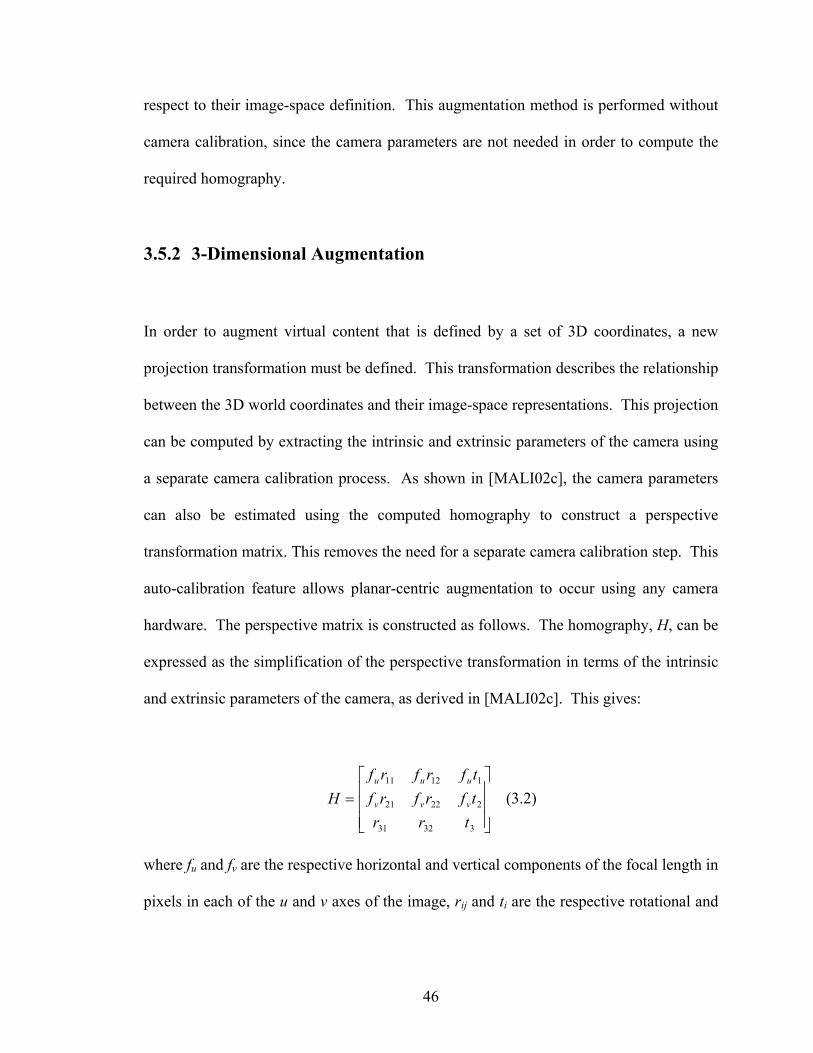
3.5.2 3-Dimensional Augmentation
In order to augment virtual content that is defined by a set of 3D coordinates, a new
projection transformation must be defined. This transformation describes the relationship
between the 3D world coordinates and their image-space representations. This projection
can be computed by extracting the intrinsic and extrinsic parameters of the camera using
a separate camera calibration process. As shown in [MALI02c], the camera parameters
can also be estimated using the computed homography to construct a perspective
transformation matrix. This removes the need for a separate camera calibration step. This
auto-calibration feature allows planar-centric augmentation to occur using any camera
hardware. The perspective matrix is constructed as follows. The homography, H, can be
expressed as the simplification of the perspective transformation in terms of the intrinsic
and extrinsic parameters of the camera, as derived in [MALI02c]. This gives:
=
33231
22221
11211
trrtfrfrftfrfrf
H vvv
uuu
(3.2)
where fu and fv are the respective horizontal and vertical components of the focal length in
pixels in each of the u and v axes of the image, rij and ti are the respective rotational and

47
translational components of the camera motion. The orthogonality properties associated
with the rotational component of the camera motion give the following equations:
1231
221
211 =++ rrr (3.3)
1232
222
212 =++ rrr (3.4)
0323122211211 =++ rrrrrr (3.5)
Combining equation 3.5 with 3.2 gives:
0323122221
21211 =++ hh
fhh
fhh
vu
(3.6)
Similarly, combining equation 3.5 with 3.3 and 3.4 gives:
12312
221
2
2112 =
++ h
fh
fh
vu
λ (3.7)
12322
222
2
2122 =
++ h
fh
fh
vu
λ (3.8)
for some scalar λ. By eliminating λ2 in equations 3.7 and 3.8 we get

48
0)()( 2
322
312
222
221
2
212
211 =−+
−+
−hh
fhh
fhh
vu
(3.9)
We can then solve for fu and fv as follows:
)()()()(2
322
3122212
222
213231
212
2112221
222
2211211
hhhhhhhhhhhhhhhh
fu−+−−−−−
= (3.10)
)()()()(2
322
3112112
122
113231
212
2112221
222
2211211
hhhhhhhhhhhhhhhhfv−+−−−−−
= (3.11)
Once these intrinsic focal lengths have been computed, a value for λ can be found using
equation 3.7 as follows:
231
2221
2211 //
1
hfhfh vu ++=λ (3.12)
The extrinsic parameters can be computed as follows:
ufhr /1111 λ= ufhr /1212 λ= 2231322113 rrrrr −= ufht /131 λ=
vfhr /2121 λ= vfhr /2222 λ= 3211123123 rrrrr −= vfht /232 λ=
3131 hr λ= 3232 hr λ= 1221221133 rrrrr −= 333 ht λ=

49
3.6 Planar Tracking System Overview
In this section we will describe how the planar pattern tracking system is implemented.
The system, outlined in figure 3.5, uses computer vision techniques to detect, identify and
track patterns throughout the real-time captured video sequence. The system begins by
scaling the captured frame of video to 320x240 pixels and enters the detection mode if it
is not already tracking a target. In this mode, an intensity threshold is used to create a
binary representation of the image, converting each pixel intensity to black or white.
This operation exploits the high-contrast of the target to isolate the target from the
background. The binary image is then scanned for black regions of connected pixels, also
known as blobs. A simple boundary test is performed on the blob pixels to choose four
outer corners. These corner locations are used to define an initial homography, computed
as described in the previous section. This homography is used to un-warp the target
region in order to compare it with all patterns known to the system. If a pattern match is
found, the system moves into tracking mode. In this mode, the previous corner locations
and displacement are used to predict the corner locations in the current frame. A search
window is positioned and scanned for each predicted corner to find its location with high
accuracy. These refined corner locations are then used to update the current
homography. The tracking facility continues until the number of detected corners is less
than four. At this point the system returns to search mode.
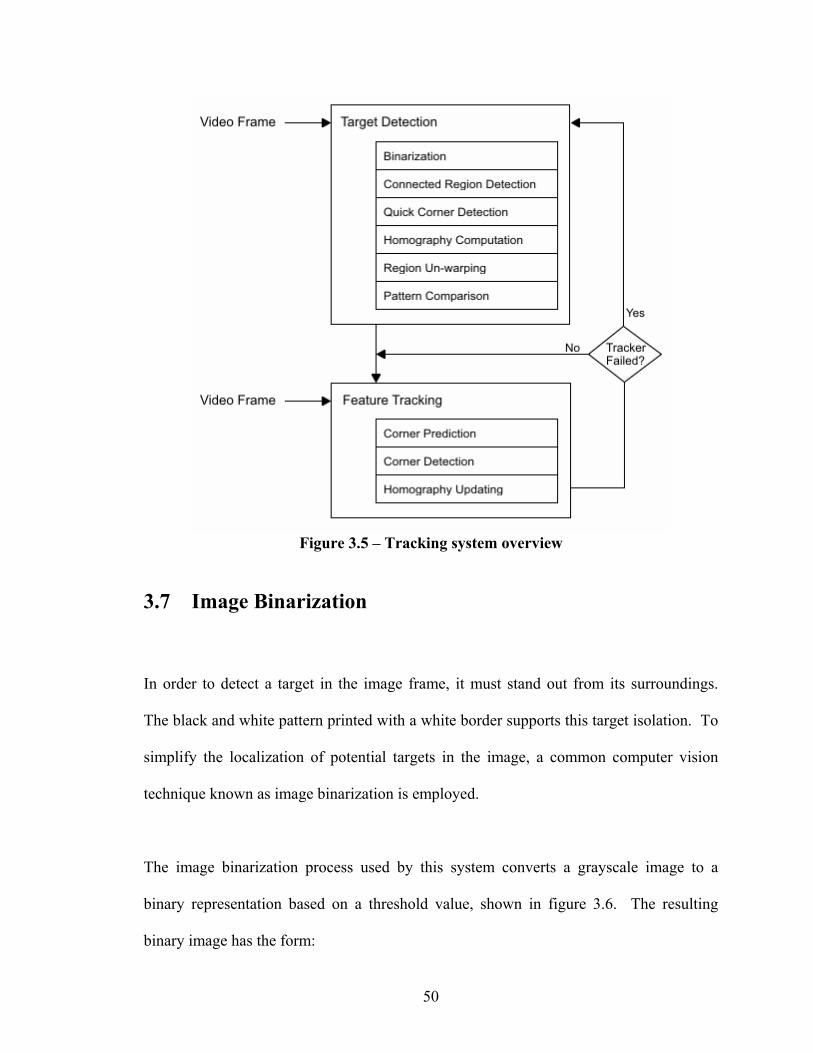
50
Figure 3.5 – Tracking system overview
3.7 Image Binarization
In order to detect a target in the image frame, it must stand out from its surroundings.
The black and white pattern printed with a white border supports this target isolation. To
simplify the localization of potential targets in the image, a common computer vision
technique known as image binarization is employed.
The image binarization process used by this system converts a grayscale image to a
binary representation based on a threshold value, shown in figure 3.6. The resulting
binary image has the form:

51
≥<
=Tyxp
Tyxpyxp
G
GB ),(,255
),(,0),(
where ),( yxpB is the binary image pixel value at position (x,y), ),( yxpG is the grayscale
image pixel value at position (x,y) and T is the threshold value. In this system the
threshold value is constant over the entire image.
(a) (b)
Figure 3.6 – Image frame binarization
3.8 Connected Region Detection
In the binary representation of the captured frame, a planar target is represented by a
connected region of black pixels. For this reason, a full-image scan is performed to
locate all such regions. A connected region of pixels is defined to be a collection of
pixels where every pixel in the set has at least one neighbour of similar intensity. Figure
3.7 shows the 8-pixel neighbourhood of the central black pixel.

52
Figure 3.7 - A sample pixel neighbourhood
To find a connected region, the system adds visited black pixels to a stack in order to
minimize the overhead created by using a recursive algorithm. Each pixel popped off the
stack has its neighbourhood scanned, and each neighbouring black pixel is pushed onto
the stack. This process continues until the stack is empty. This connected region
detection continues for all blobs in the image. The largest blob is chosen as the target
candidate.
3.9 Quick Corner Detection
In order to verify and identify the detected target, a comparison must be made between
the detected region and each pattern in the system. A proper verification is done by
performing a pixel-by-pixel comparison of all 4096 pixels in each original pattern with
those in the pattern-space representation of the target. This is done by computing a
homography between pattern and image space and using it to un-warp the detected planar
target into pattern space.
To quickly find the four corners of the target, a simple foreground (black) to background
(white) ratio is calculated for each pixel in the blob. As shown in Figure 3.8, it is assumed
that the outer corners of the blob are the four pixels that have the lowest ratios.
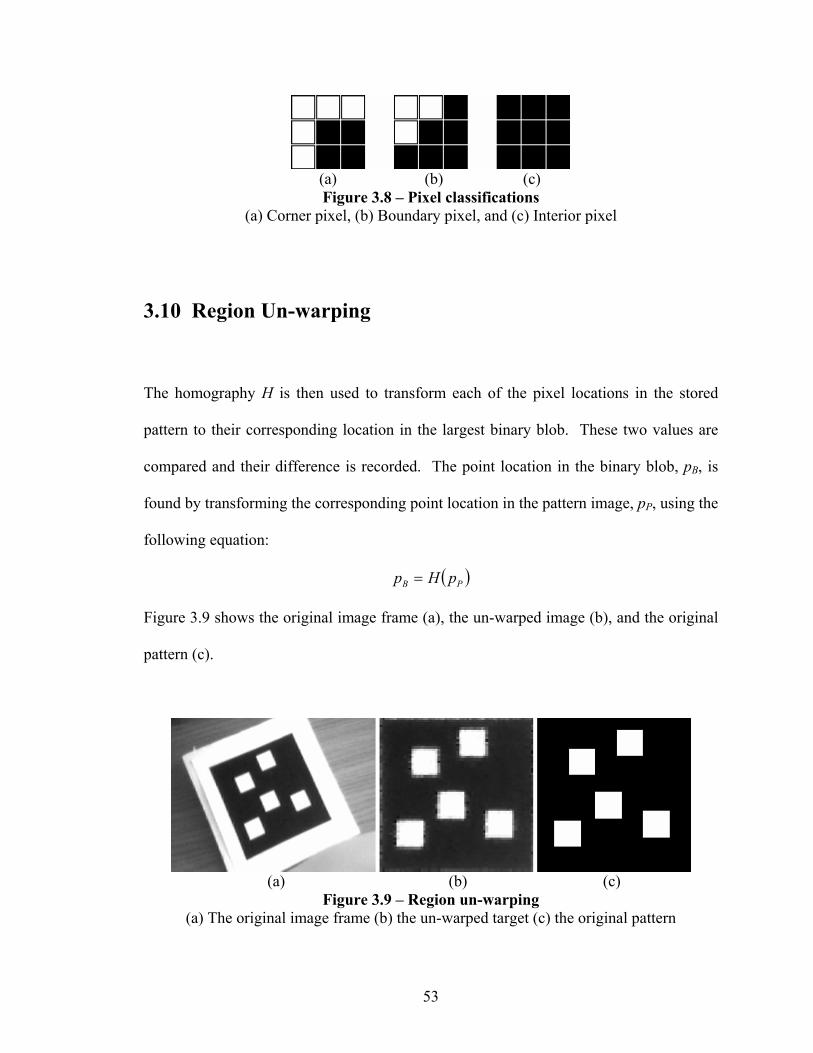
53
(a) (b) (c)
Figure 3.8 – Pixel classifications (a) Corner pixel, (b) Boundary pixel, and (c) Interior pixel
3.10 Region Un-warping
The homography H is then used to transform each of the pixel locations in the stored
pattern to their corresponding location in the largest binary blob. These two values are
compared and their difference is recorded. The point location in the binary blob, pB, is
found by transforming the corresponding point location in the pattern image, pP, using the
following equation:
( )PB pHp =
Figure 3.9 shows the original image frame (a), the un-warped image (b), and the original
pattern (c).
(a) (b) (c)
Figure 3.9 – Region un-warping (a) The original image frame (b) the un-warped target (c) the original pattern

54
3.11 Pattern Comparison
An absolute difference value between each pixel in the stored pattern and warped binary
image, dP,B(x,y), is then computed using the following formula:
( ) ( )BPBP pIpIyxd −=),(, ,
Here I is the intensity value at a given pixel location in the binary blob and the pattern.
This information is used to compute an overall score, SP,B for each pattern comparison
given by:
∑∑= =
=64
1
64
1,, ),(
x yBPBP yxdS
This process is repeated for each stored pattern in the system. To account for the
orientation ambiguity, all four possible pattern orientations are scored. For n system
patterns, 4n scores are computed and the pattern and orientation that produces the best
score is chosen as the candidate pattern match. If this minimum computed score is less
than a given threshold set by the system, the system decides that the chosen pattern
corresponds to the target.
It is important to note that with this identification process, target occlusion can greatly
increase the computed scores due the potentially significant intensity changes introduced
by such occlusion. Figure 3.10 shows both an un-occluded (b) and occluded (c) target.
The top left portion of the image in 3.10(b) and (c) shows the difference image between

55
the pattern and the warped target image. Clearly under occlusion the difference image is
brighter and therefore has a higher score.
(a) (b) (c)
Figure 3.10 – Target occlusion (a) The original pattern (b) the un-occluded target with the difference image at top left (c)
the occluded target with the difference image at top left
When portions of the pattern are outside the video frame, the scoring mechanism will
consider the hidden pixels values to be zero. This will also increase the score when white
regions are outside the frame. For this reason, it is necessary for the intended target to be
un-occluded and completely visible when the tracking system is in search mode.
When a pattern match occurs, the system uses the known corner positions in the pattern
to place initial search boxes in the image frame. These search boxes will be used as local
search regions for the corner detection algorithm. By predicting the corner positions in
each subsequent frame, corner detection can be performed directly within the updated
search regions without the need for target detection. This behaviour occurs when the
system is in the feature tracking mode.

56
3.12 Feature Tracking
Tracking features through a video sequence can be a complex task when the camera and
scene features are in motion. To simplify the process it is assumed that the change in
feature positions will be minimal between subsequent frames. This is a reasonable
assumption, given the 20-30Hz capture rate of the real-time system. Under this
constraint, it is possible to apply a first order prediction scheme which uses the current
frame information to predict the next frame.
3.13 Corner Prediction
For any captured frame, the system has knowledge of the homography computed for the
previous frame along with the previous corner locations. The prediction scheme begins
by applying this homography to the previous corners to compute a set of predicted corner
locations in this frame. The previous corner displacements, in other words how much the
corners moved from the previous frame, are then reapplied to act as the simple first-order
prediction. The search windows are positioned around the newly predicted corner
locations to prepare the system for corner detection. Figure 3.11 shows the set of search
windows that produced by the corner detection system.

57
Figure 3.11 - Corner localization search boxes
An interesting capability of the system is the ability to relocate corners that were once
lost. When a feature is occluded or it moves outside the camera’s field of view, the
corner detection process will fail for that corner. As long as the system continues to track
a minimum number of corners it is able to produce a reasonable homography, and this
homography can be used to indicate the image-space location of all target corners. This
includes a prediction of locations for corners that are occluded. These predicted positions
will have an error that is proportional to the error in the homography. As the invisible
features become visible, this prediction scheme will place a search window with enough
accuracy around the now visible corner to allow the corner detection algorithm to
succeed.
3.14 Corner Detection
With the search windows in place, a Harris corner finder [HARR88] with sub-pixel
accuracy is run on the local search window. The second step in the detection process is

58
to extract the strongest corner within the search window, and to threshold the corner
based on the corner strength. Corners that fail to be detected by this process are marked
and excluded from further calculations for this frame. Successful corner detections are
used to compute a new homography describing the current position of the target relative
the camera.
3.15 Homography Updating
The detected corners in the current frame are used to form a set C of feature
correspondences that contribute to the computation of a new homography. Using the
entire correspondence set can result in significant homography error due to potential
feature perturbation. The Harris operator can detect false corner locations when the
corners are subjected to occlusion, frame boundary fluctuation and lighting changes. The
error observed by the homography is in proportion to the sum of the feature position
errors. The result of slight feature detection drift is slight homography error, which
directly translates into slight augmentation drift. To minimize this homography error, a
random sampling algorithm is performed. It has the goal of removing the features that
generate significant homography error. The random sampling process generates a
random set S, where CS ⊆ . A homography is then computed using the correspondences
in S. This homography is then tested by transforming all features in C to compute an
overall variance with respect to the actual detected corner locations. This process
continues by choosing a new random set S, until a set producing a variance below a given
maximum is found. If no such set S is found, the system exits tracking mode and

59
attempts to perform target redetection. Using random sampling allows for greater
robustness in the presence of occlusion or detection of the wrong feature.
3.16 Camera Parameter Extraction
Using the described mathematics of planar homographies, the homography computed by
the feature tracking system provides enough information to augment two-dimensional
virtual information onto the plane defined by the target in the world coordinate system.
Using this homography, any 2D point relative to the center of the pattern in pattern-space
can be transformed to a similarly positioned 2D point relative to the center of the target in
image-space. For this reason, it is not necessary to compute the intrinsic and extrinsic
camera parameters for this form of augmentation. Hence, two-dimensional augmentation
can be performed by the system without requiring camera calibration. This avoids any
complication of introducing any variety of camera and lens technology.
3.17 Virtual augmentation
The described system provides mechanism for augmenting information onto the plane
defined by the tracked target. An example of this form of augmentation is seen in figure
3.12 where a two-dimensional picture, shown in (a), is rendered on top of the target in
image-space (c).

60
(a) (b) (c)
Figure 3.12 – Two-dimensional virtual augmentation
The virtual augmentation of the scene is performed by using OpenGL. This graphics API
is used to simplify the process of drawing arbitrarily warped images at high speed. The
fastest technique found for combining the virtual object with the captured video frame
involves rendering texture mapped polygons. A graphics texture representation of the
chessboard image is stored by the system and rendered on a warped polygon defined by
the boundary of the target. The coordinates used by OpenGL to render this polygon are
the four 2D points computed by transforming the outer corners of the original pattern
using the current homography. A second texture is stored for the captured video frame.
This texture is updated every frame to reflect the changes to the image. A rectangular
polygon is rendered to match the 320x240 dimensions of the captured frame using the
stored texture. The system renders the scene polygon first, followed by the augmentation
polygon. This ordering results in the proper occlusion relationship when the
augmentation is meant to overlap the scene. In cases where scene objects would
normally occlude the virtual augmentation, were it a real object in the scene, the visual
occlusion relationship is incorrect.

61
Chapter 4
Stabilization for Handling Occlusions
As described in the last chapter, target occlusion is a significant source of error in the
tracking system. In this chapter we describe how to detect target occlusion in real-time
using image stabilization of the target plane. In augmented reality systems both the
camera and the pattern may be moving independently. Therefore before detecting
occlusions the image sequence must undergo a process of stabilization to remove the
effects of camera motion. Many camcorders use image stabilization to remove the jitter
caused by hand motion during the video capture. In the context of the tracking system
described in Chapter 3, stabilization is performed on the target image relative to the
original stored target pattern. This effectively removes both the rotational and
translational motion of the camera.
Once the camera motion has been removed it is much easier to detect occlusion over the
target on these stabilized image frames. This occlusion is segmented from the
background using image subtraction and image binarization. The output of the
segmentation process is a binary image containing the silhouettes of the occluding
objects. The connected pixels in each silhouette are individually labeled as distinct
regions called blobs. This ability to detect target occlusion in real-time is used to improve
the corner detection process, and to produce the correct visibility relationship between the

62
occluders and the target pattern. It is also the basis for the hand interaction system
defined in Chapter 5.
4.1 Image Stabilization
Image stabilization is a technique used to remove the effects of camera motion on a
captured image sequence [CENS99]. Stabilization is normally performed relative to a
reference frame. The effect of stabilization is to transform all the image frames into the
same frame as the reference frame, effectively removing camera motion. When the
reference frame contains a dominant plane, the stabilization process is simplified. In
order to stabilize, it is first necessary to track planar features from frame to frame in the
video sequence. From these tracked features it is possible to construct a frame-wise
homography describing any frame’s transformation relative to a reference frame. As an
example Figure 4.1 shows an aerial view of a city where features are detected in the first
frame, 4.1(a) top, and tracked through to frame 60, 4.1(b) top. These tracked planar
features (an aerial view is essentially planar) were then used to compute a homography.
This homography is applied to warp the 60th image frame in order to stabilize it with
respect to the first frame. The stabilized frames are depicted in the bottom portions of
figures 4.1(a) and (b). In (b), as expected, the stabilized 60th image frame covers a
different region of view space than the reference frame.

63
(a) (b)
Figure 4.1 – Image stabilization using the homography [CENS99] (a) Features in first frame of captured video (top) and stabilized image (bottom)
(b) Features in 60th frame (top) with stabilized version (bottom)
The stabilization system described in this thesis removes the camera rotation and
translation by exploiting the planar structure of the target used by the AR tracking
system. This produces a stabilized image sequence relative to the original pattern. It has
been shown, in chapter 3, that the target in the captured image frame can be un-warped
back to a front-facing approximation for the purpose of pattern identification. This is

64
made possible through the computation of the pattern-to-image-space homography.
Pattern space is defined by the corner feature positions of the front-facing original
pattern, and this remains fixed. Each captured video frame describes a new position of
the pattern in image-space. Therefore for each such frame a new homography is
computed to describe the relationship between the pattern positions in the two spaces.
The constant nature of pattern-space implies that if the inverse of this homography is
applied to the captured image, then this image will be stabilized. In effect, the camera
motion can be removed from all the frames in the AR video sequence by applying this
inverse homography transformation.
After stabilization, the analysis of occlusions can take place in the same coordinate
system as the target plane. The extracted occlusion information is used to improve
different aspects of the target tracking and augmentation systems.
4.2 Image Subtraction
Image subtraction is the computed pixel-wise intensity difference between two images.
This technique is commonly used to detect foreground changes relative to a stationary
background in a video sequence. This form of image subtraction is referred to as
background subtraction. An image, known to contain a stationary background, is stored
and used as the reference image in the subtraction algorithm. Assuming a fixed camera
position relative to the scene background, any significant pixel differences will indicate
the introduction of one or more foreground objects, which we call occluders. As an
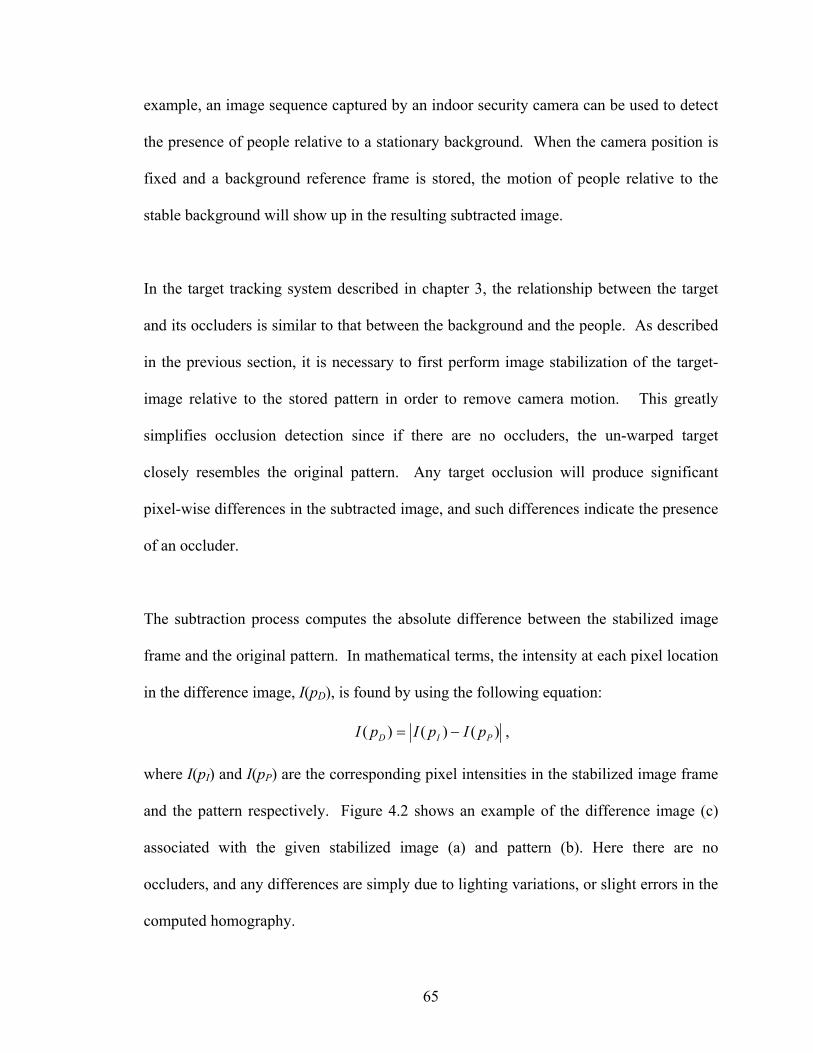
65
example, an image sequence captured by an indoor security camera can be used to detect
the presence of people relative to a stationary background. When the camera position is
fixed and a background reference frame is stored, the motion of people relative to the
stable background will show up in the resulting subtracted image.
In the target tracking system described in chapter 3, the relationship between the target
and its occluders is similar to that between the background and the people. As described
in the previous section, it is necessary to first perform image stabilization of the target-
image relative to the stored pattern in order to remove camera motion. This greatly
simplifies occlusion detection since if there are no occluders, the un-warped target
closely resembles the original pattern. Any target occlusion will produce significant
pixel-wise differences in the subtracted image, and such differences indicate the presence
of an occluder.
The subtraction process computes the absolute difference between the stabilized image
frame and the original pattern. In mathematical terms, the intensity at each pixel location
in the difference image, I(pD), is found by using the following equation:
)()()( PID pIpIpI −= ,
where I(pI) and I(pP) are the corresponding pixel intensities in the stabilized image frame
and the pattern respectively. Figure 4.2 shows an example of the difference image (c)
associated with the given stabilized image (a) and pattern (b). Here there are no
occluders, and any differences are simply due to lighting variations, or slight errors in the
computed homography.

66
(a) (b) (c)
Figure 4.2 – Stabilized image subtraction (a) Stabilized image frame (b) Original pattern (c) Difference image
4.3 Image Segmentation
Image Segmentation is the process of separating regions of varying intensities in order to
isolate certain regions of interest in the image [JAIN95]. In this case, the goal is to
segment or find the occluders in the subtracted image. The particular segmentation
algorithm used is called binarization. It takes the difference image, which is a grey-scale
image, and transforms it into a binary image. There are many binarization algorithms, and
we chose a simple fixed threshold binarization algorithm. However, for the sake of
completeness we describe a number of alternative binarization approaches.
4.3.1 Fixed Thresholding
This occlusion detection system, implemented in the thesis, uses a fixed threshold
binarization method. This means that the difference image from the subtraction phase is
subjected to a binary quantization process which, for every pixel location pD, computes a
binary value I(pB) using the following heuristic:

67
<
=otherwise
TpIpI D
B ,1)(,0
)( ,
for some constant threshold value. The fixed threshold value is chosen to suit the current
lighting conditions of the captured scene and is used throughout the image sequence.
This process segments the image into two distinct regions, one representing the occlusion
and one representing the un-occluded portions of the stabilized target.
There are a number of other alternative binarization algorithms that are more
sophisticated than fixed thresholding. In general, these are called automatic thresholding
algorithms.
4.3.2 Automatic Thresholding
Automatic thresholding is the process of image binarization using a calculated threshold
value based on information extracted from that frame. Several techniques for performing
automatic thresholding are discussed below.
Intensity Histograms
A common way of computing a threshold value is to use the information provided by an
intensity histogram of the image frame. Assuming each region displays a monotone
intensity, the computed histogram would contain peaks in the intensity regions associated
with each region. In the context of the occlusion detection system, a histogram of the

68
subtracted image discussed in 4.2 would contain peaks of pixel counts representing the
black pattern regions and those of the occluder. Selecting an intensity value in the valley
between these two peaks would be an appropriate threshold value for the segmentation
process. In practice the peaks are not always well defined, and complex algorithms are
required for choosing an appropriate value.
Iterative Threshold Selection
An iterative threshold selection approach [OTSU79] begins with an approximate
threshold value and successively refines the estimate. This method partitions the image
into two regions and calculates the mean intensity of each region. The process continues
until the mean intensities are equal. This method requires the additional overhead of
repartitioning as a result of the iterative nature of the method.
Adaptive Thresholding
Adaptive thresholding is a technique used to segment an image containing uneven
illumination [JAIN95]. This irregularity can be caused by shadows or the changing
direction of the light source. In this situation, a single threshold value may not be
appropriate for use over the entire image. In order to segment such an image it is
partitioned into sub-images, each sub-image is segmented using a dynamic thresholding
scheme. The union of the segmented sub-images becomes the segmented image.
Finding a robust solution to image segmentation under varying illumination is, in
practice, a complex computer vision problem and is outside the scope of this thesis. For

69
this reason we have used a simple fixed-threshold binarization method. However, if our
occlusion detection system were to be in widespread industrial use, it would be necessary
to implement a more sophisticated binarization algorithm.
4.4 Connected Region Search
In order to analyze the characteristics of the current occlusion, the occluder has to be
extracted from the image and stored in a tangible form. The extraction process scans the
binary image computed during image binarization in order to build a more useful
representation of the occluders. Although the binary image contains mainly occlusion
pixels, there exist spurious pixels that correspond to camera noise and pixel intensities
that fluctuate near the threshold boundary. In order to gather only the pixels of the
occluders, a connected region search is performed. The result of this process is a group of
connected binary pixels, called a binary blob, that represent the occluder. All blobs
containing more than 60 pixels are considered to be valid occluders. The algorithm used
to perform the connected region search is as follows:
loop through each unvisited pixel in the binary image if pixel value is 1 and is unvisited push pixel onto the stack while the stack is not empty pop a pixel off the stack and record its position push all its unvisited neighbours with value 1 onto stack, mark each visited
In this algorithm, each pixel in the input image is pushed on and popped off the stack at
most once. Each pixel’s position is also recorded when it is popped from the stack. This

70
means that for each pixel, a constant number of steps are performed, resulting in O(1)
computational time used for each pixel. Therefore the algorithm complexity is O(n) for
an input image containing n pixels.
These steps of the image analysis phase extract a set of blobs corresponding to regions of
target occlusion in the stabilized image. Figure 4.3 shows some examples of occlusions
(a) that are detected and represented in a corresponding binary image (b).
As the target and the occluding object move, their positional relationship is preserved in
this binary representation. This is a result of the image stabilization performed relative to
the target. Under this stabilization, as long as the relationship between the occluder and
the target remains unchanged, the binary blob of the occluder will also remain unchanged
even if the camera moves. Figure 4.4 demonstrates this by showing a static occlusion of
the target (a) whose position is changing relative to the camera. The un-warped image is
shown in (b) and the binary representations of the occluders are shown in (c).

71
(a) (b)
Figure 4.3 – Target occlusion (a) Stabilized images showing target occlusion (b) Binary representation of the occlusion
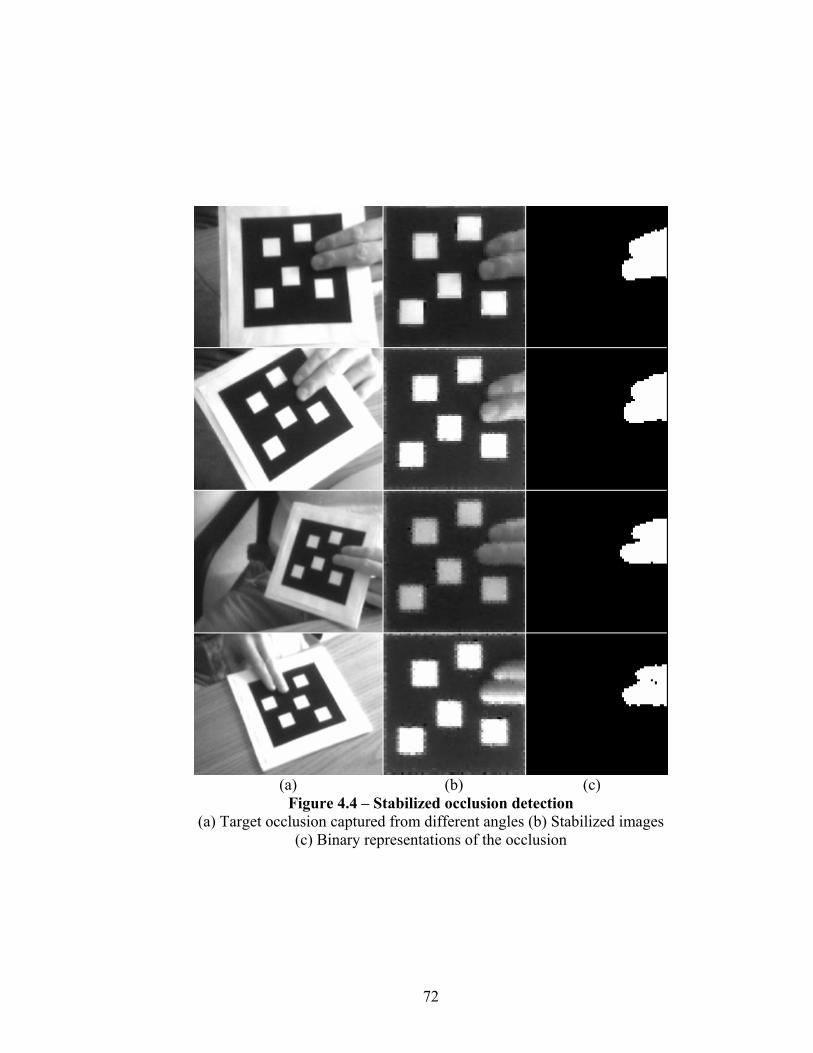
72
(a) (b) (c)
Figure 4.4 – Stabilized occlusion detection (a) Target occlusion captured from different angles (b) Stabilized images
(c) Binary representations of the occlusion

73
4.5 Improving the Tracking System
Once we have the binary blob of the occluder it is possible to use this to improve the AR
tracking system in a number of ways. Here we describe two ways that knowledge of the
occluder improves the AR tracking system. The first is a method for visually re-arranging
the occlusion order over the target so as to correct any visual occlusion inaccuracies. The
second is to use the detailed pixel-wise knowledge of the occlusion to avoid the process
in which the occluder produces false corners.
4.5.1 Visual Occlusion Correction
In the process of building a scene that blends three-dimensional virtual objects with real
objects, the depth relationship between the real and virtual objects is not always known.
The depth information for three-dimensional virtual objects is known, which allows a
visually correct occlusion relationship when they are rendered. The problem arises due to
the lack of depth information for the real objects. This can result in the improper
rendering of visual occlusion, for example when the virtual objects should be occluded by
unknown real objects but are not. In practice, this problem has a significant impact on
the immersion felt by a user of an augmented reality system. Occlusion errors can signal
the synthetic nature of scene objects that would otherwise be interpreted as real. These
errors can also affect the user’s interpretation of virtual indication. If the system attempts
to deliver information pertaining to real objects in the scene by way of indication, this
communication can fail if these indicated objects are incorrectly hidden by other virtual

74
objects. The occlusion problem has been the focus of research whose goal it to provide a
more robust and effective AR system. For example, Simon, Lepetit and Berger
[SIMO99] describe a method for solving the occlusion problem by computing a three-
dimensional stereo reconstruction of the scene. This makes it possible to compare the
depth of the virtual objects with the real objects in the scene. This allows virtual objects
to be rendered properly even in the situation where the virtual object is in front of some
real objects and behind others. This solution, although visually impressive, requires
computation that is not suitable for real-time operation.
This occlusion problem exists in our augmentation system, but is simplified by the planar
nature of the tracking system. In this case, the virtual object, the target pattern, and the
occluding object are all defined in the target plane as a result of the stabilization method.
In this stabilized coordinate system, the occlusion relationship is fixed; the occluder will
always occlude the virtual object, which will always occlude the actual physical target
pattern. The system described in chapter 3 renders the virtual object over the captured
frame of video, positioned over the target. This forces the virtual object to be in front of
all real objects, which is incorrect in the case of target occlusion. The knowledge gained
by detecting the target occlusion can be used to only render that part of the virtual object
that is not occluded.
Using the image-space point-set representation of the target occlusion, the convex hull of
each blob set is computed in order to create a clockwise contour of each occluder. This
representation of the occluder lends itself to the standard polygon drawing facilities of

75
OpenGL. During a render cycle each polygon, defined by the convex hull of an occluder
region, is rendered to the stencil buffer. When the virtual object is rendered, a stencil test
is performed to omit pixels that overlap the polygons in the stencil buffer. This gives the
illusion that the occluder is properly occluding the augmentation. Figure 4.5 shows the
augmentation with (b) and without (a) the stencil test. In this example, it is clear that a
person playing a game of chess on a virtual chessboard requires the proper occlusion
relationship between their hand and chessboard. This occlusion improvement not only
improves the visual aspect of the environment, but also allows a proper functional
interaction with virtual objects in the scene, as will be described in the next chapter.
(a) (b)
Figure 4.5 – Occlusion correction using the stencil buffer (a) Augmentation improperly occluding the hand
(b) Augmentation regions removed to correct the visual overlap
4.5.2 Search Box Invalidation
Another aspect of the augmentation system that can be improved with this occlusion
information is the robustness of the corner tracking algorithm. In the interest of
producing the best approximation for the homography, a random sampling procedure is
normally used to discard corners with significant error. While this procedure does

76
improve the homography, it is only a partial solution to the problem of feature error.
Random sampling operates by selecting several random sets of corners, and using these
to discard corners that have significant error. As the number of bad corners in the initial
set increases, the more random samples needed to find the accurate corners.
Unfortunately, the percentage of bad corners is unknown, so it is customary to use more
random samples than is necessary, resulting in performance loss. In fact, the required
number of random samples is an exponential function of the percentage of bad corner
points [FISC81, SIMO00]. It is also true that even with random sampling erroneous
corners may still be used in the final computation, which damages the homography. Thus
while random sampling does improve robustness by eliminating bad corners, it has a high
computational cost and therefore is not a perfect solution.
The underlying cause of bad corners is the fact that when a corner’s search box is
occluded, a phantom or false corner has a high probability of being produced. However,
using the computed blob set of the occlusion, a quick collision scan can be performed to
test whether an occluder is indeed covering any of the pixels in the search box of a
corner. If this is the case, corners whose search boxes contain occluder pixels are
ignored, shown as dark squares in figure 4.6. This leaves a set of corners with un-
occluded search windows, as shown as light squares in figure 4.6.

77
Figure 4.6 – Corner invalidation using search box intrusion
This means that occluded corners will be ignored during the homography calculation,
thus producing a more accurate homography. While this solution significantly improves
the stability of the homography it is still possible that an occluder can produce a false
corner. There are two common ways that this can occur. In the first case, occlusion blobs
that don’t meet the required pixel count are deemed to be noise. This means that small
occluders can still cause false corners. The second problem is that the binarization
process is not perfect, and portions of the occluders are sometimes missed. This is more
likely to happen when the occluder is dark enough so that the binarization process fails to
isolate it over the black target regions. This would cause the occlusion to go undetected
until it overlaps a white target region. All interior target corners are susceptible to this
form of intrusion. For these reasons, it is still possible for false corners to be produced
even with occluding search box invalidation, but the number of false corners is greatly
reduced. Therefore some degree of random sampling is still used, but the required
number of samples is much reduced. Random sampling coupled with corner invalidation
enables the AR process to continue even with occlusions, and produces a much improved
homography when occlusions occur.

78
Chapter 5
AR Interaction through Gesture
Immersed in an environment containing virtual information, the user is left with few
mechanisms for interacting with the virtual augmentations. The use of hardware devices
[VEIG02] can be physically restrictive given the special freedom goals of Augmented
Reality. Interaction with virtual augmentation through a physical mediator such as a
touch screen [ULHA01] is becoming a common practice. An interesting alternative is the
use of natural human gestures to communicate directly with the environment. Gesture
recognition has been explored mainly for the purpose of communicative interaction.
Gesture systems have explored many aspects of hand gesture including three-dimensional
hand posture [HEAP96] and fingertip motion [OKA02, ULHA01, CROW95]. The
system presented in this chapter attempts to bridge these two fields of study by describing
a hand gesture system that is used for manipulative interaction with the virtual
augmentation. Although natural human gestures are too complex to recognize in real-
time, simple gesture models can be defined to allow a practical interactive medium for
real-time Augmented Reality systems.

79
5.1 Hand Gesture Recognition over the Target
Once the captured video frame has been stabilized and occlusion has been detected and
defined in terms of binary blobs, the interaction problem becomes one of gesture
recognition. As described in chapter 4, target occlusion is detected and defined relative
to the target plane. Since all virtual augmentation is defined relative to the target plane,
interaction between real and virtual objects can occur within this common coordinate
system. One of the most significant contributions of this thesis is the following hand-
based interaction system using gesture recognition. Our goal is to provide a simple
gesture recognition system for two-dimensional manipulative interaction.
Currently, using a mouse to manipulate a window interface is commonplace. Our system
provides a mouse-like gesture based interface to an immersed AR user without the need
for the cumbersome mouse. To simulate a mouse requires the recognition of both point
and select gestures in order to generate the appropriate mouse-down and mouse-up events
at the indicated location. This goal is achieved without the need for a sophisticated
gesture recognition system such as [OKA02] involving complex finger tracking for
gesture inference through motion. Instead, the gesture model is specialized for the task of
mouse replacement. Performing the gesture analysis in pattern-space simplifies the image
processing and creates a very robust gesture recognition system.

80
5.1.1 Gesture Model
In order to define the appropriate gestures, the requirements of the application must be
defined in detail. The requirements of the gesture system discussed in this thesis are:
• real-time performance
• commercial pc and camera hardware
• hand-based interaction without hardware or glove-based facilities
The real-time requirement of the system poses great restriction on the level of gesture
recognition that can be implemented. Commercial hardware may also limit system
performance, as well as limit the quality of image capture on which all computer vision-
based, image analysis techniques rely. The third requirement forces the use of computer
vision to recognize hand gestures, which is performance bound by the processor. Given
these restrictions an interactive application is described and a particular hand gesture
model is defined.
The goal of this interaction system is to provide the user with a virtual interface to control
the augmentation system properties. In other words, the goal is to allow the user to
change system parameters through gestures in real-time. The interface is designed to be a
control panel that is augmented on the planar pattern. The user should be able to interact
directly with this augmented control panel on the 2D planar pattern. This allows the user
to directly manipulate the set of controls provided on the panel. The original 2D planar

81
target pattern can be fixed in the environment or carried by the user and shown to the
camera when the interaction is desired. For these reasons it is assumed that only one
hand will be free to perform the gestures over the target pattern. With the application
requirements described, a gesture model can be defined.
Complex manipulation such as finger tapping can be recognized with the use of multiple
cameras to capture finger depth information. However, under the constraints of a single
camera system, the occlusion blob detection described in the previous chapter provides
only two-dimensional information about the occluding hand. For this reason, the gesture
language is based exclusively on hand posture. The hand is described in pixel-space as
the union of the detected occlusion blobs (the occluder set found in chapter 4). Each blob
representing a finger or a set of grouped fingers. Given that our goal is to replace a
mouse, there are only two classifications to which the recognized hand postures can
belong: a pointing posture and a selecting posture. The notion of pointing and selecting
can vary between applications, so they must be clearly defined for each application. In
this application, pointing is the act of indicating a location on the planar target relative to
its top left corner. Selecting is the act of indicating the desire to perform an action with
respect to the pointer location. In terms of the gesture model, the parameters associated
with each posture are: a pointer location defined by the prominent finger tip and a finger
count defined by the number of fingers detected by the system. With the gesture model
defined, a gesture system can be constructed.

82
5.1.2 Gesture System Overview
The gesture recognition system proposed in this chapter applies the defined gesture
model to a working Augmented Reality application system. The system flow is shown in
figure 5.1. The system begins by analyzing the captured video frame using computer
vision techniques. At this point, posture analysis is performed to extract the posture
parameters in order to classify the gesture. If classification succeeds, the recognized
gesture is translated into the event-driven command understood by the interactive
application.
Figure 5.1 – Gesture system overview

83
5.1.3 Posture Analysis
The two parameters of the gesture model related to the posture description are the
location of the fingertip used for pointing, and the number of distinct fingers found
during extraction for selection.
5.1.4 Fingertip Location
To determine the location of the user’s point and select actions, a pointer location must be
chosen from the hand point set. To simplify this process, the current system constraints
were exploited and a number of assumptions were made. The first useful constraint deals
with the amount of target occlusion permitted. The planar tracking system used for
augmentation assumes that approximately half of the target corners are visible at all times
during the tracking phase. To satisfy this constraint, only a portion of a hand can occlude
the target at any given time. For this reason, the assumption is made that the only portion
of the hand to occlude the target will be the fingers. From this we get:
Assumption 1: Separated fingers will be detected as separate blobs in the image analysis
phase.
Due to the simplicity of the desired interaction, a second assumption was made:
Assumption 2: Fingers will remain extended and relatively parallel to each other.

84
This is also a reasonable assumption due to the fact that pointing with one or more
extended fingers is a natural human gesture. The third constraint used to simplify the
process was the following:
Assumption 3: Any hand pixel set will contain at least one pixel on the border of the
pattern-space representation of the current frame.
Using all three assumptions the posture analysis process begins by selecting the largest
detected finger blob. Characteristics of the blob are extracted using shape descriptors of
the blob pixel set.
Moment Descriptors
A widely used set of shape descriptors is based on the theory of moments. This theory
can be defined in physical terms as pertaining to the moment of inertia of a rotating
object. The moment of inertia of a rotating body is the sum of the mass of each particle
of matter of the body into the square of its distance from the axis of rotation [WEBS96].
In the context of binary images, the principle axis (axis of rotation) is chosen to minimize
the moment of inertia. In fact, the principle axis is also the line for which the sum of the
square distances between the points in the binary object and this line are minimized. The
concept of moments can be used to describe many characteristics of the binary blob
[PITA93] such as its centre of gravity, orientation, and eccentricity.

85
The central moments of a discrete binary image are given by [HU61, HU62]:
∑∑=i j
qppq jim (5.1)
∑∑ −−=i j
qppq yjxi )()(µ (5.2)
where i and j correspond to the x and y image coordinates respectively and x and y are
the x and y image coordinates of the binary object’s center of gravity. These values are
found as follows:
00
10
mm
x = 00
01
mm
y = (5.3)
where m00 represents the area of the binary object. Using the definition of equations 5.1
and 5.2, other characteristics can be computed. The most important characteristic used
by this system is the orientation of the binary object. This is described by the angle of the
major axis, measured counter-clockwise from the x-axis. This angle, θ , is given by:
−
=0220
112arctan21
µµµ
θ (5.4)
The dominant finger is defined as the largest occluder in terms of pixel count. Using this
central moment theory, the center of gravity and orientation of this blob are computed.
This provides enough information to define the principal axis of the dominant finger,
shown in figure 5.2 as the long line cutting the finger blob. The next step of the fingertip

86
location process involves finding a root point on the principal axis. This represents an
approximation of where the finger joins the hand. This simplification holds as a result of
assumption 2. Using assumption 3, a border pixel, rb, is chosen from the blob and its
closest principal axis point, rp, is chosen as the root. The farthest pixel in the blob from
the root point, tb, is chosen as the fingertip location.
Figure 5.2 - Finger tip location using blob orientation
5.1.5 Finger Count
Using assumption 1 of section 5.1.4, the posture of separated fingers will be classified
uniquely from that of single or grouped fingers. In other words, the finger count can be
quickly determined by finding the number of detected blobs, shown in figure 5.3. These
two described posture characteristics are used to classify two simple gestures, point and
selection on the target plane.

87
(a) (b)
Figure 5.3 - Finger count from the number of detected blobs (a) Single blob (b) Two distinct blobs detected
5.1.6 Gesture Recognition
The simple gesture model introduced in this chapter describes two gestures classified by
the interaction system – point and selection. The point gesture is the combination of a
single finger and a pointer location. A single group of fingers along with a pointer
location is also classified as the gesture of pointing. The selection gesture is the
combination of multiple fingers and a pointer location. Figure 5.3 shows an example of
these two gestures, displayed in pattern-space. A sample point and select gesture are
shown in figure 5.4(a) and 5.4(b) respectively. These images are the grayscale
representations of full colour screenshots. In this demonstration application the gesture
system recognizes the colour region occupied by the finger pointer and also recognizes
when selection has occurred. The fact that selection has been recognized from the two
finger blobs is shown clearly in the text annotation at the top of the figure.
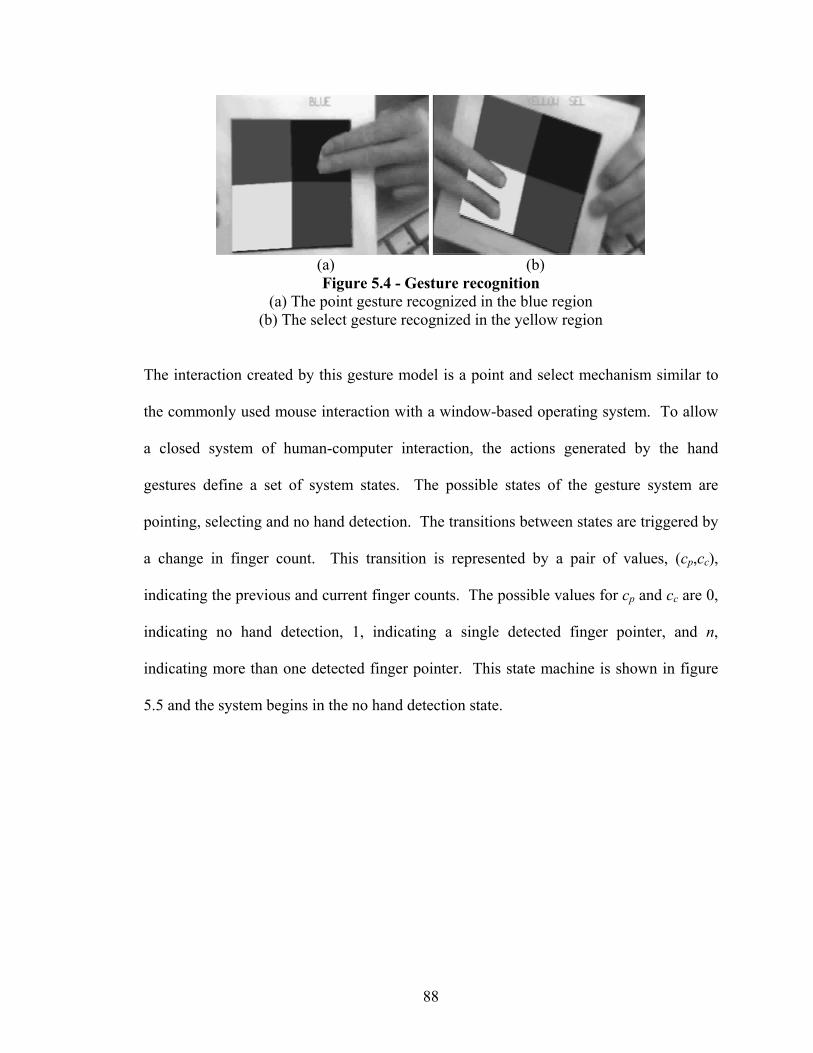
88
(a) (b) Figure 5.4 - Gesture recognition
(a) The point gesture recognized in the blue region (b) The select gesture recognized in the yellow region
The interaction created by this gesture model is a point and select mechanism similar to
the commonly used mouse interaction with a window-based operating system. To allow
a closed system of human-computer interaction, the actions generated by the hand
gestures define a set of system states. The possible states of the gesture system are
pointing, selecting and no hand detection. The transitions between states are triggered by
a change in finger count. This transition is represented by a pair of values, (cp,cc),
indicating the previous and current finger counts. The possible values for cp and cc are 0,
indicating no hand detection, 1, indicating a single detected finger pointer, and n,
indicating more than one detected finger pointer. This state machine is shown in figure
5.5 and the system begins in the no hand detection state.

89
Figure 5.5 - Gesture system finite state machine. The transition notation is
(previous blob count, current blob count)
5.2 Interaction in an AR Environment
The gesture model introduced in this chapter defines a basis for simple human-computer
interaction on a plane. The most common and widely used planar interaction interface is
the mouse which is found in all window-based operating systems. This type of interface
took shape as a result of innovative suggestions for two-dimensional, monitor-based
interaction. Over the years, window-based technology has advanced providing a rich
toolset of interface widgets and their associated behaviour mechanisms. For this reason
our gesture-based interaction system uses the preexisting windows-based software
technology to construct a virtual control panel system. The effect is to couple the power
and visual appearance of the pre-defined windows widgets with the augmented
interaction platform. This is done through an underlying, interpretive, communication
link between the gesture interaction and an instantiated windows control panel dialog
box. It is through this interpreter that gesture actions are converted into the operating

90
system events that are understood by the dialog box. The widgets on the dialog box are
assigned behaviour actions that are executed when the widgets are manipulated through
our hand-based gesture system. In this way the user can directly manipulate a virtual
representation of the dialog box. By performing gesture actions over the dialog box the
appropriate behavioural feedback is presented to the user through the virtual
representation.
5.2.1 Virtual Interface
The control panel paradigm presented here is based on a direct mapping of pattern-space
coordinates to control panel dialog coordinates. This mapping is simplified by using a
control panel dialog that has dimensions proportional to the 64x64 pixel target in pattern-
space. A snapshot of the dialog window is taken during each render cycle and stored as
an OpenGL texture map. This texture is applied to the rendered polygon that is
positioned over the target. By updating the snapshot every frame, the visual behaviour of
the control panel dialog is presented to the user. For example, when a button goes down
on the control panel dialog box, the change in button elevation is reflected in the virtual
representation. Figure 5.6 shows an example of a simple control panel dialog box (a) that
was built using standard window-based programming libraries. The virtual
representation of this dialog box is shown in 5.6(b) where the stop button is being
pressed. In other words, the two fingers are interpreted as a mouse down, which is sent to
to the control pattern to effectively press the stop button by using hand gestures.

91
(a) (b)
Figure 5.6 - Control panel dialog and virtual representation (a) Control panel dialog box (b) Augmented virtual representation of the control panel
5.2.2 Hand-Based Interaction
With this visual feedback mechanism in place, a mechanism for initiating interaction with
the controls on the panel is needed. The behaviour associated with control manipulation
is defined in the normal event driven, object-oriented fashion associated with window–
based application programming.
Applying the gesture model to this augmented interaction requires only a simple
communicative translation between the gestures, including posture parameters, and the
event-based control manipulation. This translation is defined in terms of the gesture state
machine outlined in figure 5.5. For example, when a selection gesture is recognized
immediately following a pointing gesture, a mouse-down event is sent to the actual
control panel dialog, along with the pointer location parameter as if it were sent by the
mouse hardware. This way, when the gesture occurs over a button on the virtual panel,
the event generates the equivalent button press on the dialog box. On the other hand,
when a pointing gesture immediately follows a selection gesture, a mouse-up event is sent

92
to the dialog along with the associated pointer location. Figure 5.7 shows an example of
the point (a) and select (b) gesture over the stop button.
(a) (b)
Figure 5.7 - Control panel selection event (a) Point gesture over the stop button (b) Select gesture over the stop button
By using an actual hidden dialog box in the system, the power of the standard window-
based programming libraries can be exploited. These libraries simplify the process of
adding system behaviour to an interface as well as reducing the complexity of the visual
interface components.
5.2.3 Interface Limitations
Due to the limitations of the occlusion detection system, the interface must adhere to
certain limitations. The occlusion detection is performed in pattern-space, which is a
64x64 image size. This means that regardless of the target dimensions, the detected
pointer location will be one of 4096 pixels. This location is proportionally scaled to the
dimensions of the dialog box. In other words, the pointer precision is directly
proportional to the dimension scaling and the precision of the pointer is limited. For this
reason, the widgets on the control panel need to be large enough to allow for this

93
precision degradation. The other restriction placed on the interface design is the accuracy
of the gesture recognition system. The implemented system provides the functionality to
manipulate any controls that require only a point and single-click interaction, including
the sophistication of the drag-and-drop operation. The success of this interaction relies
directly on the success of the gesture recognition system, which in turn relies on the
integrity of the occlusion detection system.
If the occlusion detection is in error this translates directly into undesired control
manipulation. As an example, if a slider control is presented on the control panel, the
user has the ability to select the slider knob, drag it by continuing to select while the hand
is in motion, and release the knob by returning the hand to a pointing posture. While
attempting to drag the knob, the effects of hand motion or lighting changes can cause the
occlusion detection results to change. This could mean a change in blob count or even an
undesired shift in the detected pointer location. For these reasons, complex widget
manipulation is not yet practical, and is left outside the focus of this thesis. The current
system uses only large-scale buttons to perform basic system functions.
Figure 5.8 shows a series of images demonstrating the hand-based AR interaction system.
The series begins with a captured scene (a) which does not contain any targets. In the
next image (b), a target is presented to the AR system. Once the target is detected,
augmentation begins as the target is tracked through the video sequence. In this
application, the default augmentation is a video sequence of a three-dimensional, rotating
torus rendered over the target (c). When the system detects target occlusion, the
94
occlusion is assumed to be the user’s hand. For this reason, the virtual control panel (d)
is augmented in place of the torus video. The control panel remains augmented for every
frame where target occlusion is detected. A selection operation is demonstrated by
showing multiple, separated fingers (f) after showing a single finger (e). During this
operation, the dominant finger remained over the stop button on the control panel, which
resulted in a button press (f) triggered by the mouse-down event. An associated mouse-
up event was generated by bringing the two fingers back together in order to return the
gesture system to the pointing state. The programmed behaviour associated with this
control widget was to stop the augmented video playback. The system continues to track
the target and it halts the augmented torus video as shown in (g)(h). When the user points
at the play button on the control panel (i) and performs the selection operation (j) and
then performs a point operation, the mouse-down and mouse-up events trigger the
behaviour of continuing the torus video playback in the AR panel. When the user’s hand
is removed from the target, the augmentation switches back to the torus video (k)(l),
which is now playing. Images (m), (n), (o) and (p) demonstrate successful point and
select operations using more fingers over the pattern. In such a case the grouping of three
fingers is detected as one finger blob. Even when using more fingers, as long as the same
number of occlusion blobs are detected by the system (a single for pointing and multiple
for selecting), the correct operation is still performed.

95
Figure 5.8 – Gesture-based interaction system

96
Figure 5.8 (Continued) - Gesture-based interaction system

97
Chapter 6
Experimental Results
As with all technological applications, the value and acceptance of AR applications are
directly proportional to the system performance experienced by the user. It is also true
that the limiting factor in an application’s feature set, aside from developer knowledge, is
the overall computational power of the computer system on which it is run. As an
example, if an interactive AR system spends the majority of its time on gesture
recognition, then there is less time available for augmentation detail. Most current AR
applications focus on one particular aspect of the system, leaving others out. The
interactive AR system presented in this thesis is also subject to these tight technological
constraints. In this chapter we describe some experimental results with regards to the
performance of the system. The results demonstrate the immediate feasibility of
simplified AR with potentially advanced versions only a few years away.
6.1 Computation Time
The first measure of performance is to examine the computational breakdown of the main
application steps. This measure highlights areas of significant computational complexity
relative to the others. Table 6.1 shows the amount of time (in milliseconds) taken by
each of the significant phases of the AR system. The data was gathered by timing each

98
phase individually on three separate computers over a period of five minutes, and listing
the average time for each phase in the table. The processors used by the computers were
an Intel Pentium II (450Mhz), an Intel Celeron 2 (1Ghz) and an Intel Pentium 4 (2.4Ghz).
These were chosen to represent a low-end, mid-range and high-end system respectively,
at the time this thesis was written.
Computation Time on Standard Processors (ms) Intel P2 450Mhz Intel Celeron 1Ghz Intel P4 2.4Ghz Target Detection 19.58 11.46 3.42 Binarization 3.66 3.18 0.57 Corner Detection 23.32 11.86 5.64 Compute Homography 3.89 1.74 1.29 Parameter Extraction 0.02 0.02 0.00 Stabilization 5.86 2.74 0.98 Subtraction 0.25 0.14 0.05 Segmentation 0.03 0.03 0.01 Connected Region 0.81 0.37 0.09 Hand Detection (Total) 9.63 5.03 1.66 Fingertip Location 0.01 0.02 0.00 Augment and Display 61.10 42.97 8.59
Table 6.1 – Computation Time on Standard Processors
The target detection phase is timed as a whole, as it does not occur while interaction takes
place. The feature tracking phase is examined in more detail by timing the image
binarization, corner detection, and homography computation phases. For completeness,
the camera parameter extraction time is also recorded. The augmented interaction system
is examined by recording the stabilization, subtraction segmentation, and connected
region search phases. These steps form the core of the hand detection process, which is

99
also timed in its entirety. The table also shows the time required by the fingertip location
step and augmentation process. The augmentation and display process, listed in the table,
involves the synthesis of the virtual augmentation with the captured video frame and the
display of this combined frame.
The goal of an Augmented Reality system is to deliver the final augmented image
sequence as part of a larger application. This application will use stored knowledge of
the user’s environment to provide high-level information through this augmentation
mechanism in real-time. In order for this complete system to be realized, the steps
outlined in this table must only require a fraction of the processor’s time, leaving the rest
for other tasks. The trend demonstrated in this table, using these different processors, is
illustrated in figure 6.1. This graph shows the computational sum of the steps in table 6.1
for each processor. A rapid decrease in computation time is observed as the processor
speed increases. In terms of computer hardware evolution this decrease has taken place
relatively recently, considering that the release dates of these processors differ by only a
few years (1998 for the Pentium II 450Mhz, 2000 for the Celeron 1Ghz, and 2002 for the
Pentium 4 2.4Ghz). With this information, it is reasonable to predict the feasibility of
more sophisticated, full-scale AR applications in the near future.

100
Figure 6.1 – Computation time versus processor speed
Table 6.1 also highlights the areas of significant computational complexity in the system;
target detection, corner detection, stabilization and video augmentation. In an effort to
minimize the computation time required by these steps certain optimizations were made
which we now describe in more detail.
6.2 Practical Algorithmic Alternatives
6.2.1 Target Detection
The target detection phase of the AR system requires a significant amount of image
processing. Three key areas of this process were simplified in order to reduce the

101
processing load. The first involves the dimensions of the image used for the detection
process. The standard image size used in the AR system described in this thesis is
320x240 pixels. It is obvious that the larger the image, the more pixels it contains. This
has a direct effect on the speed of the algorithms as they need to visit each pixel in order
to collect global information. For this reason the initial image is scaled by a factor of
four before the target detection begins. This approximation does not go without penalty,
as the integrity of the target characteristics is also approximated. Figure 6.2 shows a
captured frame of video (a) and the extracted, sub-sampled target (b). The first
responsibility of this phase is to locate the four exterior corners of the target in order to
compute an initial homography. This homography will then be used to un-warp and
compare the target against a set of pre-defined patterns. Sub-sampling the captured
image frame produces errors in the detected corner locations. Figure 6.2(a) shows the
erroneous corners, as grey crosses, with their locations scaled up to the original image
dimensions. The second key approximation involves the complexity of the corner
detection. This detection is accomplished by computing a ratio of black-to-white pixel
intensities for each pixel neighbourhood. This method is quick, but results in some
erroneous decisions since many of the target boundary pixels have similar ratios.
Although these two approximations cause significant visual error, the computational error
in terms of target detection is minimal. This is because target detection is a decision
operation, so as opposed to target tracking the computed homography can be less
accurate.

102
(a) (b)
Figure 6.2 – Scaled target detection (a) Image frame showing erroneous corner detection (b) Scaled binary representation of the detected target
The third key approximation in the target detection phase of the AR system involves the
number of patterns detected by the system. This application uses only one pattern at any
given instance for target detection which significantly reduces the time required to
differentiate between different patterns. This is a reasonable restriction as the focus of
the system is interaction with respect to one given target coordinate system.
6.2.2 Corner Detection
The homography-based tracking approach described in this thesis relies on detectable
features in each frame of video. Until recently, blob-based trackers were the most
common tracking primitive for vision-based augmented reality systems. It was quickly
observed that the corner detection algorithms were more complex than those required for
blob detection, resulting in a higher computational cost. To evaluate the blob-based
target a feature was detected separately, as was the case for the corners. An example of

103
this target is shown in figure 6.3, where the target in the captured frame (a) is detected
and shown in its binary representation (b).
(a) (b)
Figure 6.3 - Blob-based target (a) Image frame showing blob detection (b) Binary representation of the detected blobs
The most attractive characteristic of the blob feature is its tracking performance.
Detecting corners is a complex operation, while blob finding algorithms are very simple
since they primarily deal with finding connected regions of similar pixel intensities. On
the other hand, the search window size must be larger for blobs to encapsulate the entire
connected region. This can significantly increase the computational time of the detection
algorithm as the connected regions consume larger portions of the video frame. With
today’s powerful processors and efficient approximations to advanced corner detection
algorithms, the performance difference between the two feature types is becoming
minimal in practice.
One important part of the feature comparison between blobs and corners, is the ability of
each type of feature to be able to deal with occlusion, since target occlusion is necessary
for the interaction process. Clearly corners are able to deal with occlusion because they
are a pixel-level feature which either completely disappears, or appears. This is not the

104
case for blobs. When an object partially occludes a blob region the detection scheme will
assign too many or too few pixels to the blob pixel set. If, after image segmentation,
foreground pixels are added to the search area of the occluded blob, then the blob’s pixel
set is the union of occluding object pixels and actual blob pixels. On the other hand, if
the occluding object adds background pixels to the blob when overlapping it, the blob’s
pixel set will fail to contain all pixels that are needed to properly represent the blob. This
form of occlusion is shown in figure 6.4, where a finger is assumed to be a part of the
background after segmentation. In either case, the blob’s computed position, size, and
orientation will have significant error.
(a) (b)
Figure 6.4 - Blob occlusion (a) Captured images of two blobs (top) and the occlusion of the left blob (bottom) including the detected centroids. (b) Binary representation of the detected blobs.
Therefore, the conclusion is that while blobs are more efficient than corners they can not
easily deal with occlusion. For this reason, it was concluded that the blob-based target
could not feasibly replace the corner-based equivalent. The computationally complex
corner feature remains a requirement of this AR system.

105
6.2.3 Stabilization
The theoretical approach to image stabilization involves the transformation of the
captured image frame into pattern-space using the inverse of the computed homography.
To perform this operation directly would involve the transformation of each image-space
pixel, which has dimensions 320x240, into pattern-space which has dimensions 64x64.
This means that regardless of the transformation, only 4096 pixels out of 76800 are
actually recorded in pattern-space. This theoretical un-warping is demonstrated in figure
6.5(a), where pattern-space is bound by the white square and all exterior pixels are
unused as they are undefined in pattern-space. It is also important to note that because of
the sub-sampling, each pixel in pattern-space is mapped to one or more pixels in image-
space under this inverse homography. This means that there is redundancy in the pattern-
space boundary of figure 6.5(a).
In order to reduce the number of pixel transformations, the pattern-space pixel positions
are transformed into image-space in order to compute the intensity value. This forward
sampling is accomplished by using the same homography as was used for un-warping
during target detection, as described in Chapter 3. With this un-warp emulation, the
number of pixel transformations will always be minimal (4096 instead of 76800). This
has a significant impact on the performance of the stabilization process.
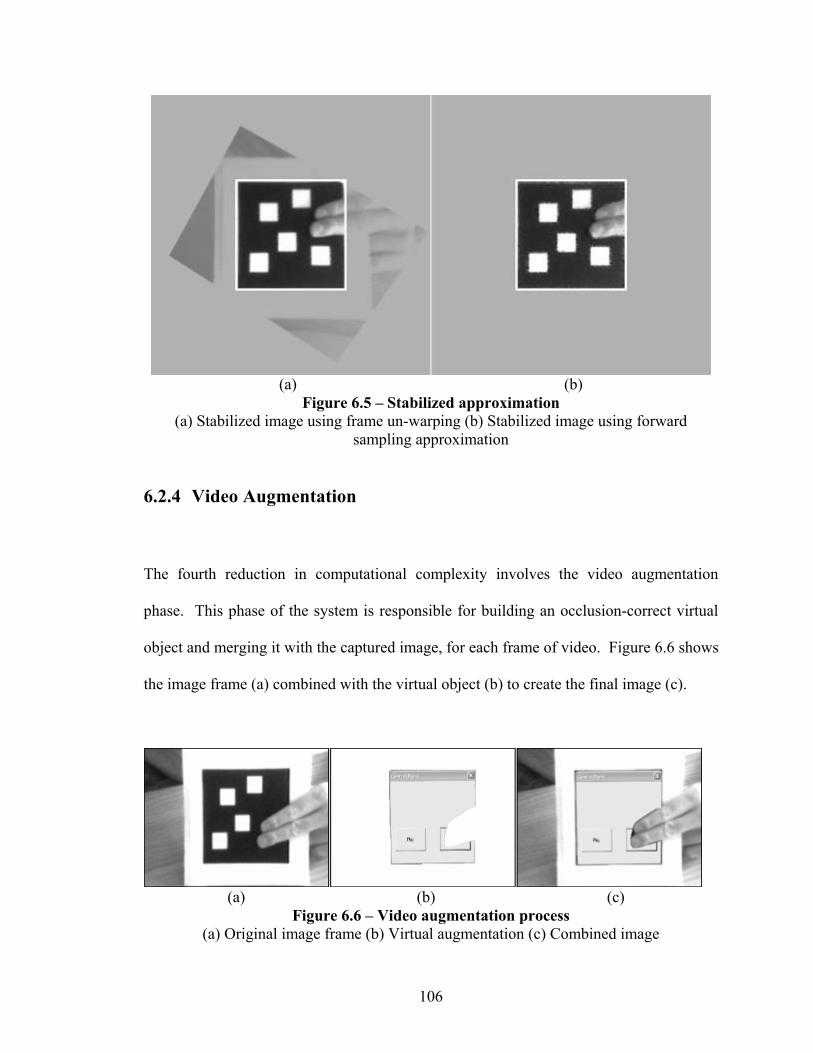
106
(a) (b)
Figure 6.5 – Stabilized approximation (a) Stabilized image using frame un-warping (b) Stabilized image using forward
sampling approximation
6.2.4 Video Augmentation
The fourth reduction in computational complexity involves the video augmentation
phase. This phase of the system is responsible for building an occlusion-correct virtual
object and merging it with the captured image, for each frame of video. Figure 6.6 shows
the image frame (a) combined with the virtual object (b) to create the final image (c).
(a) (b) (c)
Figure 6.6 – Video augmentation process (a) Original image frame (b) Virtual augmentation (c) Combined image

107
Since the system requires the creation and rendering of virtual objects, the OpenGL
interface was used. This interface is a common interface for VR systems and, as such,
has been optimized for the display of virtual environments. In order to create a seamless
combination of real and virtual environments, a representation of the captured image was
therefore created in OpenGL. This allows the two components to be rendered into the
same image buffer using the optimized algorithms of the OpenGL interface. The use of
OpenGL in this fashion significantly improves system performance.
6.3 Overall System Performance
The second measure of performance is to examine the rate at which the system produces
the final augmented images. These images are the only visual cue of the augmented
environment presented to the user, and they dictate the immersion and usability of the
system. This rendering frame rate indicates the feasibility of this AR interaction system
as a tool using today’s computer technology.
The frame-rate of the system (in hertz) was observed in each significant high-level phase,
when run on the standard processors used in section 6.1. The system was left in each
phase for a period of five minutes while the frame-rate was continuously recorded. The
average rate during each phase is shown in Table 6.2. It is important to note that these
results are purposely independent of the camera capture rate in order to isolate the
processing rate. This isolation was performed by allowing the image capture system to
update a shared buffer which is copied and then is used by the processing system. This

108
means that the processing system continuously processes the latest frame captured by the
system, even if it has already been processed. In practice this can result in a waste of
system resources when frames are processed faster than they are captured. However,
with the image acquisition rate isolated, conclusions about the system performance can
be drawn.
Frame Rate on Standard Processors (Hz) Intel P2 450Mhz Intel Celeron 1Ghz Intel P4 2.4Ghz No AR processing 20.20 30.18 122.36 Target Detection 15.23 21.90 90.15 Target Tracking 11.57 18.29 63.59 Tracking & Interaction 9.46 12.71 53.96
Table 6.2 – Frame Rate on Standard Processors
The first observation that can be made based on the data shown in table 6.2 is the real-
time performance observed by the user on the low-end and mid-range processor.
Although ten frames per second is an unacceptable rate of image update for applications
requiring high mobility, those that require little user movement can be run on lower-end
systems in real-time. This suggests the possibility for simple AR applications to be
accepted by the mainstream of computer users.
The second and most significant observation is the high frame-rates delivered by the
high-end processor. Given that the camera hardware captures image frames at a rate of
20-30Hz, this high end processor demonstrates the ability to perform all AR processing in

109
the interval between image captures. In fact, this processor can approximately process
each frame twice before the next frame is captured. At the time this thesis was written,
the fastest processor available from Intel was the Pentium 4 (3.06Ghz). With this much
processing power, the image processing techniques used to deliver AR in this system
become insignificant relative to the processing required to capture the images and
perform routine resource management.
It is clear from these experiments that faster processors considerably improve the AR
system. For example, they make possible more sophisticated gesture technology or the
display of a more advanced virtual environment. The system presented in this thesis is
meant to demonstrate some techniques used to provide the user with an interaction
mechanism in an AR environment. As research in this field advances, the abundant
processing power will be applied to more advanced techniques and applications. The
experimental results confirm the feasibility of Augmented Reality as a real-time tool for
human-computer interaction in the present state of computer technology.

110
Chapter 7
Conclusions
7.1 Thesis Summary
In this thesis, a framework for interaction with the augmented environment was
described. While it is based on the tracking system introduced in [MALI02c] it
significantly changes and advances this system. One of the main advances is the
application of image stabilization to reduce the complex problem of three-dimensional
target occlusion to a single, two-dimensional coordinate system. This coordinate system
is the same for the target, the target occluder, and the virtual augmentation. With this
simplification, the relationship between these three key objects in the augmented
environment is well-defined. Using this stabilized coordinate system, an accurate binary
description of target occlusions can be extracted in real-time.
In general, the effects of target occlusion can be detrimental to the corner detection
process. This form of unpredicted occlusion can directly manipulate the local intensity
contrast of the corner, resulting in erroneous location computation. The extracted
occlusion information is first applied to improve the integrity of the feature tracking
system. Using this detailed outline of the target occlusion, the potentially disrupted
corners can be ignored in the computation of the homography. This improves the

111
integrity of the homography, thus improving the overall registration of the virtual
information. The occlusion information is also used to correct the visual inaccuracies
caused by the standard synthesis of virtual information with the captured video frame.
This occlusion description provides the rendering system with the necessary information
to avoid rendering the regions of the virtual object which overlap the occluder. These
improvements enhance the user’s immersive experience as well as the overall
performance of the system.
Apart from the tracking system improvements, the occlusion detection mechanism is also
used as a basis for the interaction system outlined in this thesis. In this context, the
occluder is assumed to be the user’s hand. Under this assumption, the binary description
can be used to extract the characteristics associated with the hand posture. With this
information, a point-and-click mechanism can be modeled and recognized in order to
provide the user with the ability to interact with an augmented virtual control panel. The
gesture information gathered by the system is translated and sent to an instantiated
control panel dialog box which performs the actual programmed behaviour. This
provides the immersed AR user with a natural gesture interaction scheme using standard
window interface technology. To our knowledge, this system is the first to demonstrate
real-time interaction with the augmented world in a plane-based AR system [MCDO02,
MALI02a].

112
7.2 The Power of Augmented Interaction
Interaction in Augmented Reality can take on many forms. One such form is the direct
manipulation of the virtual objects in the augmented environment. Another useful form
is the manipulation of the system properties that govern the appearance and behaviour of
the virtual information.
The system described in this thesis illustrates a mechanism for providing the immersed
user with the ability to control the properties of the AR system. The fact that the
interface itself is a virtual object in the augmented environment allows it to be used and
manipulated in ways that differ from those of physical interfaces while at the same time
providing complex functionality. For example, the augmented interface can be altered or
positioned arbitrarily by the user or by the system. This means that the interface can
change based on environmental conditions or context. As a user moves through rooms in
a museum, for example, the options presented through the interface can be contextually
altered to reflect the content of each of the rooms. It is important to allow the user the
ability to alter the AR interface as he or she may have superior knowledge of the current
environment than that of the computer system. As compared to Virtual Reality, where
the computer system has knowledge of every aspect of the virtual environment,
Augmented Reality should not only merge real and virtual objects, but should also merge
the user’s intellectual perception of the environment with that of the computer.

113
7.3 Mainstream Potential of Augmented Reality
For Augmented Reality to become a mainstream tool, it must robustly provide useful
information at rate that is synonymous with that of human sensory perception. The
experimental results of this simple augmented interaction system provide evidence that
real-time Augmented Reality is more than a theoretical vision. Using modern computer
technology, it is clear that the first step towards the real-time computer perception of
human behaviour can be taken. This can be as simple as the classification of basic
human actions based on a pre-defined model or as complex as a continuous learning
system able to mimic the communication performed by another human being. Many
avenues are being explored in this field, all of which await the arrival of the required
technology to process the observed information in real-time.
7.4 Future Work
7.4.1 Augmented Desk Interfaces
A technology that is emerging in the field of AR is enhanced augmentation desk
interfaces. These come in many forms [CROW95, OKA02] but all exploit the
confinement of the two-dimensional surface. As shown in this thesis, the two-
dimensional coordinate system shared by the user’s hands and the virtual objects simplify
the interaction relationship between them. At the present time, different gesture schemes
are being explored to produce robust recognition in real-time.

114
The gesture system introduced in this thesis could be extended to the larger-scale desk
interface. This would require the alteration of the key assumptions described at the
beginning of Chapter 5, to take into account the fact that the entire hand (not just the
fingers) would be occluding the desk surface. Using a silhouette of the user’s hand,
finger separation could be used in place of the finger count extracted by this system.
With a simple translation of the gesture model, the point-and-click interaction scheme
could be used to manipulate virtual objects on the augmented desk.
7.4.2 AR-Based Training
An interesting application of Augmented Reality is AR-based training. This application
provides a trainer with the ability to provide virtual feedback to a remote and immersed
trainee with respect to a given coordinate system. In order for the trainer to visualize the
user’s perspective, the captured video frames are sent to the trainer. The feedback
consists of graphical annotation of the captured video frames by the trainer, followed by
the retransmission of these frames to the trainee. In [ZHON02], the transmitted image
sequence is paused when the trainer wants to communicate, in order to eliminate the
difficult problem of following the user’s mobile viewpoint.
This form of remote collaboration can be improved by using the real-time stabilization
technique introduced in this thesis. By giving visual feedback in the stabilized image
sequence, the trainer can more robustly provide augmented information to the trainee in

115
real-time, without the need to pause the input sequence. This feedback information can
then be augmented in the user’s view relative to the initial coordinate system. This
mechanism provides an improvement to the accuracy and real-time nature of the AR-
based training application.

116
Bibliography
[AZUM94] Ronald T. Azuma and Gary Bishop. “Improving Static and Dynamic Registration in an Optical See-Through HMD”. Proceedings of SIGGRAPH '94 (Orlando, FL, 24-29 July 1994), Computer Graphics, Annual Conference Series, 1994, 197-204 + CD-ROM appendix.
[AZUM97a] Ronald T. Azuma. Course notes on "Correcting for Dynamic Error" from Course Notes #30: Making Direct Manipulation Work in Virtual Reality. ACM SIGGRAPH '97, Los Angeles, CA, 3-8 August 1997.
[AZUM97b] Ronald T. Azuma. Course notes on "Registration" from Course Notes
#30: Making Direct Manipulation Work in Virtual Reality. ACM SIGGRAPH '97, Los Angeles, CA, 3-8 August 1997.
[AZUM01] Ronald T. Azuma, Yohan Baillot, Reinhold Behringer, Steven Feiner,
Simon Julier, Blair MacIntyre. “Recent Advances in Augmented Reality”. IEEE Computer Graphics and Applications 21, 6 (Nov/Dec 2001), 34-47.
[BERG99] M.-O. Berger, B. Wrobel-Dautcourt, S. Petitjean, G. Simon. “Mixing
Synthetic and Video Images of an Outdoor Urban Environment”. Machine Vision and Applications, 11(3), Springer-Verlag, 1999.
[CAUD92] Thomas P. Caudell, David W. Mizell, “Augmented Reality: An
Application of Heads-Up Display Technology to Manual Manufacturing Processes” in Proceedings of 1992 IEEE Hawaii International Conference on Systems Sciences, IEEE Press, January 1992.
[CENS99] A. Censi, A. Fusiello and V. Roberto. “Image Stabilization by Features
Tracking”. In "10th International Conference on Image Analysis and Processing", 1999, Venice, Italy.
[CORN01] K. Cornelis, M. Pollefeys, M. Vergauwen and L. Van Gool. “Augmented
Reality from Uncalibrated Video Sequences”. In M. Pollefeys, L. Van Gool, A. Zisserman, A. Fitzgibbon (Eds.), 3D Structure from Images - SMILE 2000, Lecture Notes in Computer Science, Vol. 2018, pp.144-160, Springer-Verlag, 2001.
[CROW95] J. Crowley, F. Berard, and J. Coutaz. “Finger tracking as an input device
for augmented reality”. In Proc. Int'l Workshop Automatic Face Gesture Recognition, pages 195--200, 1995.
[FISC81] M. A. Fischler and R. C. Bolles. “Random sample consensus: A paradigm
for model fitting with applications to image analysis and automated cartography”. Communications of the ACM, 24(6), 1981. pp 381-395.

117
[FJEL02] Morten Fjeld, Benedikt M. Voegtli. “Augmented Chemistry: An Interactive Educational Workbench”. International Symposium on Mixed and Augmented Reality (ISMAR'02). September 30-October 01, 2002. Darmstadt, Germany.
[HARR88] C. Harris, M. Stephens. “A Combined Corner and Edge Detector”. In
Alvey Vision Conf, 1988. pp. 147-151. [HART00] Richard Hartley, Andrew Zisserman. “Multiple View Geometry”.
Cambridge University Press, 2000. [HEAP96] T. Heap and D. Hogg. “Towards 3D Hand Tracking Using a Deformable
Model”. Proc. Int’l Conf. Automatic Face and Gesture Recognition, Killington, Vt., pp. 140-145, Oct. 1996.
[HU61] M.K.Hu. “Pattern recognition by moment invariants”. Proc. IEEE, vol.
49, No. 9, p. 1428, Sept. 1961. [HU62] M.K.Hu. “Visual pattern recognition by moment invariants”. IRE
Transactions on Information Theory. Vol. 17-8, No. 2, pp. 179-187, Feb. 1962.
[JACO97] M.C. Jacobs, M.A. Livingston, A. State. “Managing latency in complex
augmented reality systems”, 1997 Symposium on Interactive 3D Graphics, pp. 49-54, 1997.
[JAIN95] Ramesh Jain, Rangachar Kasturi, Brian G. Schunck. “Machine Vision”.
McGraw-Hill, 1995. [KOLL97] D. Koller, G. Klinker, E. Rose, D. Breen, R. Whitaker, and M. Tuceryan.
“Real-time Vision-Based camera tracking for augmented reality applications”. In D. Thalmann, editor, ACM Symposium on Virtual Reality Software and Technology, New York, NY, 1997.
[MALI02a] Shahzad Malik, Chris McDonald, Gerhard Roth. “Hand Tracking for
Interactive Pattern-based Augmented Reality”. International Symposium on Mixed and Augmented Reality (ISMAR'02). September 30-October 01, 2002. Darmstadt, Germany.
[MALI02b] Shahzad Malik, Gerhard Roth, Chris McDonald. “Robust Corner
Tracking for Real-time Augmented Reality”. In Proceedings of Vision Interface 2002.
[MALI02c] Shahzad Malik. “Robust Registration of Virtual Objects for Real-Time
Augmented Reality”. Master’s Thesis, School of Computer Science, Carleton University, Ottawa, Ontario, Canada, 2002.

118
[MCDO02] Chris McDonald, Shahzad Malik, Gerhard Roth. “Hand-Based Interaction in Augmented Reality”. IEEE International Workshop on Haptic Audio Visual Environments and their Applications (HAVE’2002). Ottawa, Canada. November 17-18, 2002.
[NEUM99] U. Neumann, S. You. “Natural Feature Tracking for Augmented Reality”.
IEEE Transactions on Multimedia, Vol. 1, No. 1, pp. 53-64, March 1999. [OKA02] Kenji Oka, Yoichi Sato, and Hideki Koike. “Real-time fingertip tracking
and gesture recognition”, IEEE Computer Graphics and Applications, Vol. 22, No. 6, pp. 64-71, November/December 2002.
[OTSU79] N. Otsu. “A Threshold Selection Method from Gray-Level Histograms”.
IEEE Transactions on Systems, Man, and Cybernetics, vol. 9, no. 1, pp. 62-66, 1979.
[PAVL97] Vladimir Pavlovic and Rajeev Sharma and Thomas Huang. “Visual
interpretation of hand gestures for human-computer interaction: A review”. IEEE Transactions on PAMI, 7(19):677-695, 1997.
[PITA93] Ioannis Pitas. “Digital Image Processing Algorithms”. Prentice Hall,
Hemel Hempstead, Hertfordshire, 1993. [ROTH99] Gerhard Roth. “Projections”. Course Notes. 95.410 MultiMedia
Systems, January 1999. [ROTH02] G. Roth and A. Whitehead. “Using projective vision to find camera
positions in an image sequence”, Vision Interface (VI'2000) conference proceedings, pp. 87-94, Montreal, Canada, 2000.
[SCHW02] Bernd Schwald, Helmut Seibert, Tanja Weller. “A Flexible Tracking
Concept Applied to Medical Scenarios Using an AR Window”. International Symposium on Mixed and Augmented Reality (ISMAR'02). September 30-October 01, 2002. Darmstadt, Germany.
[SIMO99] G. Simon, V. Lepetit, M.-O. Berger. “Registration Methods for
Harmonious Integration of Real Worlds and Computer Generated Objects”. In Proceedings of the Advanced Research Workshop on Confluence of Computer Vision and Computer Graphics, Ljubljana (Slovenia), 1999.
[SIMO00] Gilles Simon, Andrew Fitzgibbon, Andrew Zisserman. “Markerless
Tracking using Planar Structures in the Scene”. Proceedings of the IEEE International Symposium on Augmented Reality (ISAR), 2000. pp. 120-128.

119
[SIMO02] G. Simon, M.-O. Berger. “Pose Estimation for Planar Structures”. In IEEE Computer Graphics and Applications, special issue on Tracking, pp.46-53, November-December 2002.
[STAT96] A. State, G. Hirota, D. T. Chen, W. F. Garrett, and M. A. Livingston.
“Superior augmented reality registration by integrating landmark tracking and magnetic tracking”. In SIGGRAPH'96 Proceedings, 1996.
[TRUC98] Emanuele Trucco, Alessandro Verri. “Introductory Techniques for 3D
Computer Vision”. Prentice-Hall, 1998. [TUCE95] M. Tuceryan et. al. “Calibration Requirements and Procedures for a
Monitor-Based Augmented Reality System”, in IEEE Trans. on Visualization and Computer Graphics, vol. 1, no. 3, pp. 255-273, Sep. 1995.
[ULHA01] Klaus Dorfmüller-Ulhaas, D. Schmalstieg. “Finger Tracking for
Interaction in Augmented Environments”. Proceedings of the 2nd ACM/IEEE International Symposium on Augmented Reality (ISAR'01), pp. 55-64, New York NY, Oct. 29-30, 2001.
[VALL98] James R. Vallino. “Interactive Augmented Reality”. PhD Thesis,
University of Rochester, Rochester, NY. November 1998. [VEIG02] Veigl S., A. Kaltenbach, F. Ledermann, G. Reitmayr, D. Schmalstieg.
“Two-Handed Direct Interaction with ARToolKit”, IEEE First International Augmented Reality Toolkit Workshop (ART02), Darmstadt Germany, Sept. 29, 2002.
[WEBS96] Webster's Revised Unabridged Dictionary, © 1996, 1998 MICRA, Inc.
[YOU99] You, S., Neumann, U., Azuma, R. “Hybrid Inertial and Vision Tracking for Augmented Reality Registration”. Proceedings of IEEE Virtual Reality, 1999. pp. 260-267.
[ZHON02] Xiaowei Zhong. “Mobile Collaborative Augmented Reality: A Prototype for Industrial Training”. Master’s Thesis, Ottawa-Carleton Institute for Compute Science, University of Ottawa, Ottawa, Ontario, Canada, 2002.
[ZISS98] Andrew Zisserman. “Geometric Framework for Vision I: Single View and
Two-View Geometry”. Lecture Notes, Robotics Research Group, University of Oxford.