hcc research presentation
TRANSCRIPT

Community and Student Research Report
Prepared by:

Table of Contents
• Background and Methodology ............................................................ 3
• Executive Summary ............................................................ 4
• Familiarity with HCC ............................................................ 7
• Perceptions of HCC ............................................................ 14
• Overall Attitudes ........................................................... 20
• Comparison of HCC to other Schools........................................................ 24
• Value Analysis ........................................................... 27
• Net Promoter Score ............................................................ 35
• Student Satisfaction ........................................................... 39
• Decision to Attend HCC ........................................................... 45
• Communication Audit ........................................................... 48
• Online Education ........................................................... 51
• Community Respondent Profile ............................................................ 55
• Student Respondent Profile ............................................................ 59
• Comparison to 2007 Research ............................................................ 66

HCC commissioned yaffe|DEUTSER to conduct research as part of an overall strategic initiative to help HCC assume a desirable position in the local educational marketplace. Two separate surveys were conducted, one for community members and the other for current HCC students. Data were collected using online surveys.
Specific objectives of the community study:
• To measure and compare the attitudes of area residents in the overall community and individual districts
• To determine which components of HCC’s services and roles most impact the attitudes of area residents
• To identify the appropriate strategic positions for HCC to occupy in the marketplace
Specific objectives of the student study:
•To measure overall student satisfaction including satisfaction levels regarding services and facilities.
•To calculate HCC’s Net Promoter Score as an indicator of the overall satisfaction levels of the students.
•To measure communication between HCC and students.
•To measure the awareness of specific programs (Coleman and Online courses).
Online data collection was conducted from March through May, 2013.
Background and Methodology
Market # of Community Surveys
Central College Area 100
Northeast College Area 125
Northwest College Area 200
Southeast College Area 100
Southwest College Area 226
TOTAL 751
College # of Student Surveys
Central College 772
Coleman College 188
Northeast College 408
Northwest College 950
Southeast College 548
Southwest College 1100
Online 309
TOTAL 4275
Executive Summary

Executive Summary• Results from the two surveys were both positive and negative. HCC is doing well in some areas but the results
also indicate some areas of concerns.
• Overall, the data from the community survey show high levels of awareness. HCC has by far the highest level of unaided awareness among area community colleges. While awareness was high the last time the Value Analysis study was conducted, it continued to improve.
• Respondents felt it was most important for HCC to deliver quality, affordability, and convenience. When asked to write in words or phrases that come to mind when thinking of HCC, respondents were most likely to mention affordability, community-oriented, education, and convenience. This indicates that HCC is delivering on these areas that the community finds most important.
• The value analysis data shows that residents place high value on the degree to which HCC contributes to the community. Attributes that relate to the community include: convenient locations, meeting residents’ education needs, and serving diverse groups. Several “big picture” benefits are also seen as extremely valuable, such as the college’s overall impact on the region’s economy, patronizing local businesses, and decreasing overall social costs to the state.
• Two-thirds of respondents were completely or mostly satisfied with HCC meeting the overall needs of their community, and a majority rates HCC much or somewhat better than other local colleges/universities and community colleges/proprietary schools.
• While HCC scored high on many satisfaction measurements, the community Net Promoter Scores (NPS) were not as high. The NPS for the community was -6%, while the NPS for students was 30% (on a scale of + or – 100%). THE NPS shows that overall, students are satisfied with their experience at HCC and are more likely to recommend HCC than they are to speak negatively of the school; however, community members are less likely to recommend HCC.

Executive Summary• Respondents were asked to rate 12 issues both in terms of HCC’s performance and the importance of HCC
delivering effectively on the issues. The largest gaps (where HCC is underperforming against perceived importance) are uses tax revenues wisely, has effective leadership, and offers a high-quality education.
• Awareness of Coleman College for Health Sciences could also be increased. On an aided basis, 58% of community respondents were aware that HCC has a health science program, but 39% were unsure. Sixty-four percent did not know if HCC has a campus in the Medical Center. However, student awareness was much higher. Eighty-six percent (86%) of students were aware that HCC offers programs in Health Sciences on an aided basis. Sixty-one percent (61%) of students said they were aware that HCC has a campus in the medical center on an aided basis; although, only percent (35%) of respondents correctly named Coleman as the campus in the medical center.
• Students were satisfied with the variables having to do with their courses: appropriate class size (4.18), challenging courses (4.02), convenient classes (4.02), and variety of courses (3.94). Of the variables related to courses, the lowest score was for availability of courses (3.73).
• They were also satisfied with campus facilities (campus cleanliness - 4.14 and maintenance of facilities - 4.11) except for food options (3.08) which received the lowest score for satisfaction.
• Students rated registration and admissions lower, particularly with regards to staff assistance during registration (3.51) and staff assistance during admissions (3.54). Another area of concern was the convenience of office hours for administrative and student services (3.70).
• In addition to measuring student satisfaction, a communication audit was conducted. One quarter (26%) of students do not feel they receive enough information overall from HCC. Sixty-eight percent (68%) feel they receive the right amount of information. This indicates a need to improve communications with students. Students receive the most and best information via email. They also prefer to receive information this way. They utilized HCC’s website as another important source of information.

Familiarity with HCC
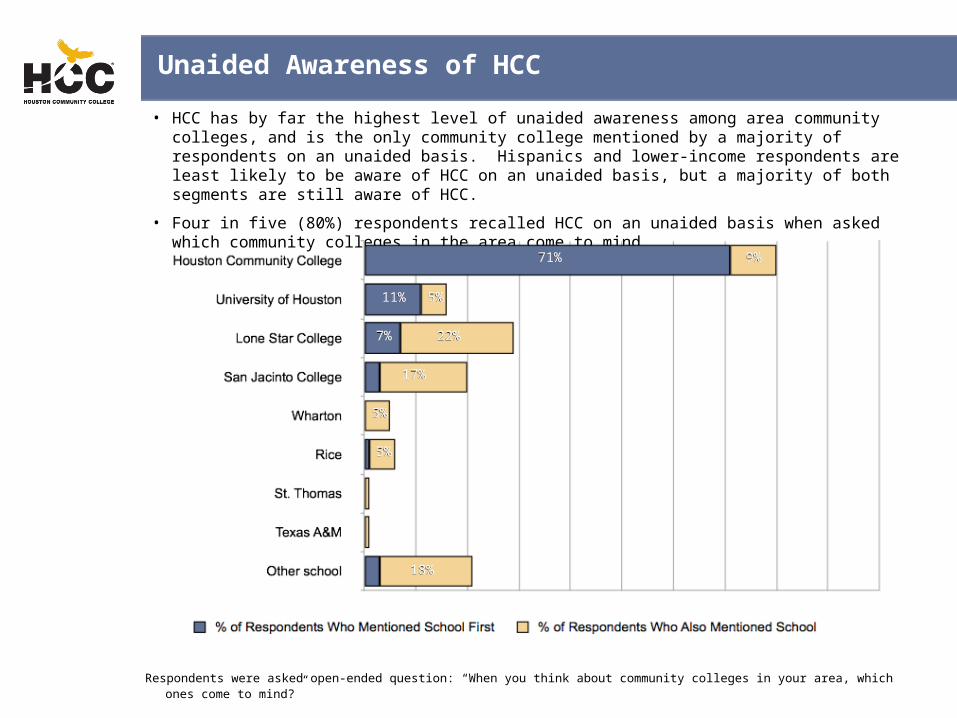
• HCC has by far the highest level of unaided awareness among area community colleges, and is the only community college mentioned by a majority of respondents on an unaided basis. Hispanics and lower-income respondents are least likely to be aware of HCC on an unaided basis, but a majority of both segments are still aware of HCC.
• Four in five (80%) respondents recalled HCC on an unaided basis when asked which community colleges in the area come to mind.
Unaided Awareness of HCC
Respondents were asked open-ended question: “When you think about community colleges in your area, which ones come to mind?”
71%
11%
7%
9%
5%
22%
17%
5%
5%
18%

Almost one-half (48%) of respondents have a fairly close relationship with HCC (either have a degree from the school or have a family member who does OR have taken classes at HCC or have a family member who has).
Respondents were asked: “Which of the following best describes your relationship with each of the colleges?” If respondent had not heard of HCC, they were terminated from the remainder of the study.
Relationships With Area Colleges
18%
12%
16%
5%
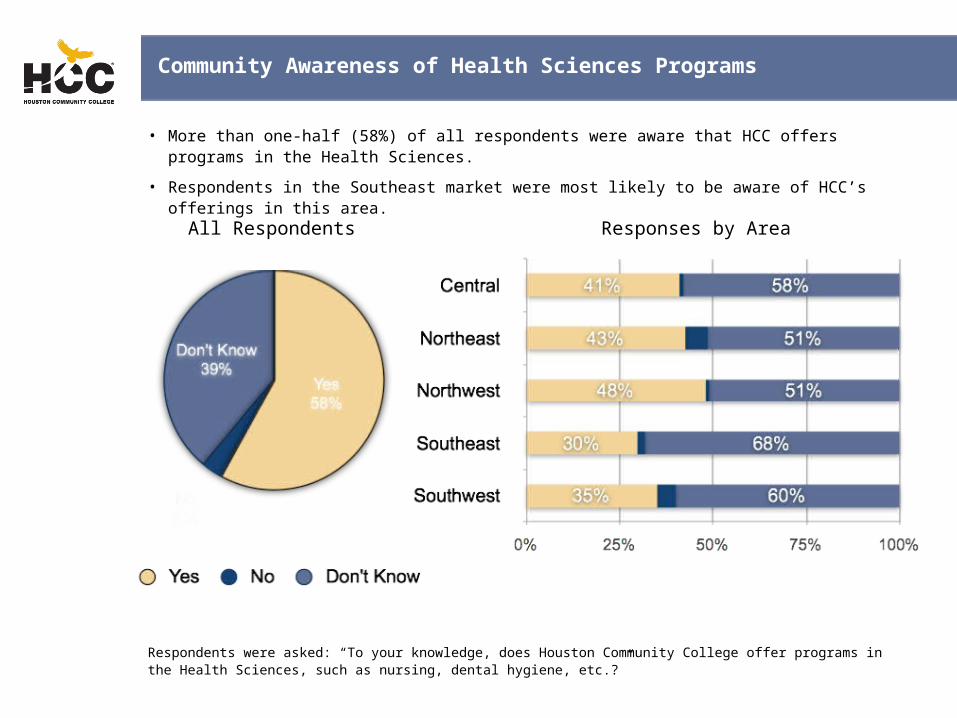
• More than one-half (58%) of all respondents were aware that HCC offers programs in the Health Sciences.
• Respondents in the Southeast market were most likely to be aware of HCC’s offerings in this area.
Respondents were asked: “To your knowledge, does Houston Community College offer programs in the Health Sciences, such as nursing, dental hygiene, etc.?”
Community Awareness of Health Sciences Programs
All Respondents Responses by Area

• One-fifth (19%) of all respondents were aware of the HCC campus in the Medical Center.
• Six percent (6%) of all respondents correctly recalled the name “Coleman” on an unaided basis.
Respondents were asked: “To your knowledge, is there a Houston Community College campus in the Texas Medical Center?” If respondents answered “Yes”, then they were immediately asked to write in the campus name.
Community Awareness of Campus in the Medical Center
All Respondents Responses by Area
Perceptions of HCC

Four in five (80%) respondents felt it is important for HCC to make it easy for residents to take advantage of the college’s services and educational programs, and 81% felt that HCC is performing well on this attribute.
Importance/Performance Gaps

The largest gap between importance and performance was on the attribute “HCC uses tax revenue wisely”; 84% of respondents felt this is “extremely important” or “very important”, but only 57% “completely agreed” or “mostly agreed” that HCC performs well in this area.
Importance/Performance Gaps (continued)

When asked what comes to mind when thinking about HCC, two in five (39%) respondents mentioned some aspect of “affordability”.
Word/Phrase Associations With HCC
All respondents were asked, “When you think of HCC, what three words or phrases come to mind first?”

Almost one-quarter (23%) of respondents believed that HCC’s large size or number of locations makes it unique compared to other colleges in the area.
Unique Aspects of HCC
All respondents were asked, “What makes HCC unique?”
All respondents were asked three general questions:
• “What is your overall level of interest in having a community college in your community?”
• “Overall, how much value does a community college have for your community?”
• “How satisfied are you with the job that HCC does in meeting the overall needs of your community?”
Overall Attitudes
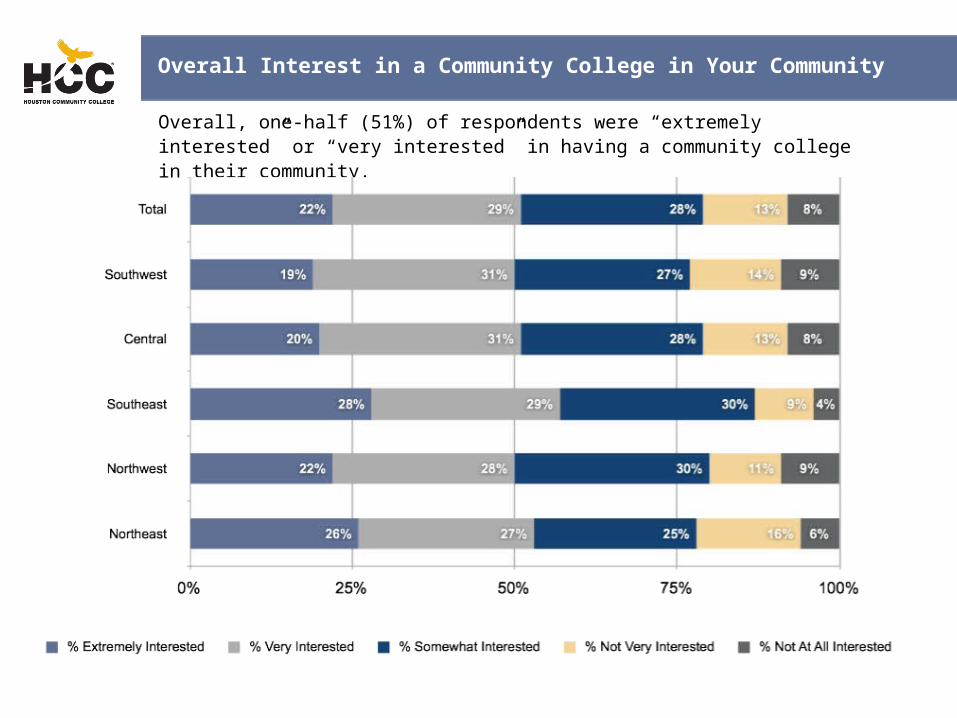
Overall, one-half (51%) of respondents were “extremely interested” or “very interested” in having a community college in their community.
Overall Interest in a Community College in Your Community

African-American and Hispanic respondents saw the most value in having a community college in their community (47% “excellent value” for each group).
Overall Value of a Community College in Your Community

One-third (29%) of lower income respondents (under $35k household income) were “completely satisfied” that HCC is meeting the overall needs of the community.
Satisfaction With HCC Meeting the Needs of Your Community

All respondents were asked:
• “Compared to other post-secondary institutions (after high school), not including other community colleges, how good a job does HCC do overall in serving the educational needs of the community?”
• “Compared to other local community colleges and proprietary schools*, how good a job does HCC do overall in serving the educational needs of the community?”
* Definition of a proprietary school shown to respondents if needed while taking the survey: A school organized as a for-profit primarily to reach vocational skills or training. Many provide on-line classes.
Comparison of HCC to Other Schools

MuchBetter
MuchWorse
One-third (32%) of Hispanics felt that HCC is “much better” than other local colleges and universities.
HCC Compared to Local Colleges and Universities

MuchBetter
MuchWorse
Three in five (59%) respondents felt that HCC is “much better” or “somewhat better” than other local community colleges and proprietary schools.
HCC Compared to Other Local Community Colleges and Proprietary Schools

Value Analysis™
BASICS
UNESSENTIALS
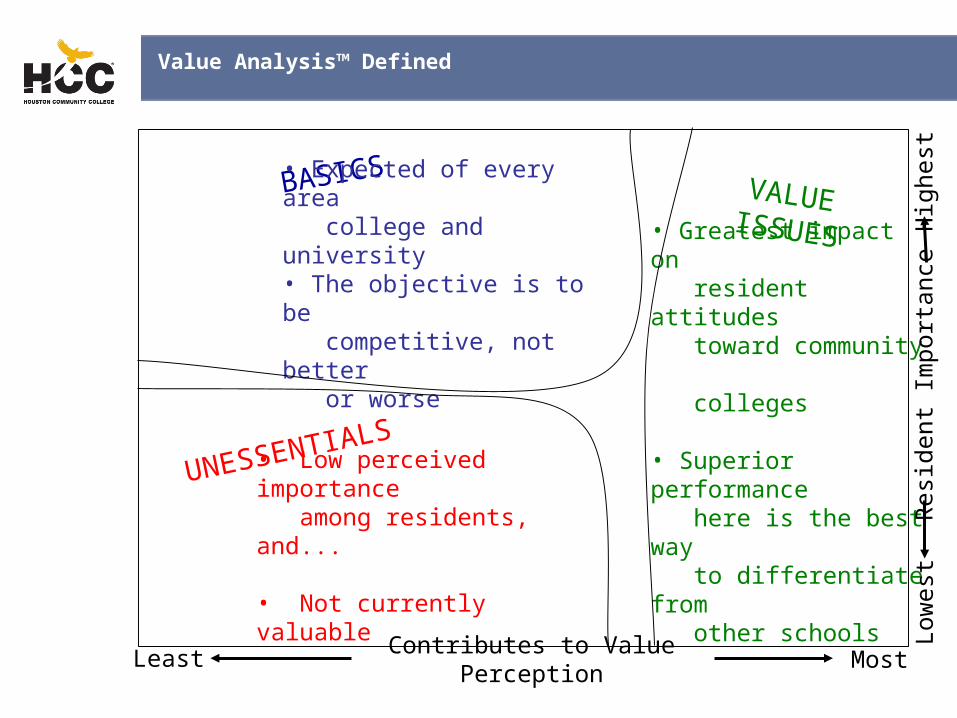
VALUE ISSUES• Expected of every area
college and university• The objective is to be competitive, not better or worse
• Low perceived importance among residents, and...
• Not currently valuable
• Greatest impact on resident attitudes toward community colleges
• Superior performance here is the best way to differentiate from other schools
Res
iden
t Im
porta
nce
Hig
hest
Low
est
Contributes to Value Perception MostLeast
Value Analysis™ Defined

26
Over time, many issues on the Value Map move counterclockwise as the market evolves and responds to residents’ needs. These shifts on the map follow a clear and logical pattern:
1. Issues that truly have the ability to change the course of the market often begin as Unessentials — low importance and not seen as valuable.
2. Innovation on the part of one or more colleges or universities within the area moves an issue from an Unessential to a low Value Issue.
3. Over time, the gradual adoption of these features and benefits by other schools raises awareness of their importance.
4. When most schools offer the new features or benefits, they lose their innovativeness and residents begin to take these issues for granted. These issues then lose their influence as major contributors to value perception and evolve into Basics.
How Issues Move Over Time

Contributes to Value Perception MostLeast
Sta
ted
Impo
rtanc
eH
ighe
stLo
wes
t
BASICS VALUE ISSUES
UNESSENTIALSEasy for residents to take advantage
of the college’s services
Professors knowledgeable in their subject areas
Has continuing ed courses for residents whose jobs require it
Meets the education needs of the local
business community by supplying an educated
workforce
Overall affordable education
Convenient class times
Offers a high-quality education
Makes it more affordable to obtain a four-year degree from
another schoolHas programs that help people become
qualified to enter workforce after
graduationUses tax revenue wisely Convenient
locations
Sufficient variety of classes and
degree or certificate programs
Effectively trains people for local jobs
Has effective leadership
Meets education needs of residents
Up-to-date equipment and facilities
Increases students’ lifetime
incomes
Works with community businesses to identify
workforce needs
Positively impacts region’s
economyInnovative in
meeting community’s educational
needs
Effectively serves diverse
groups in the community
Provides training in essential services such as police, fire,
paramedics and nursing
Students decrease
social costs to TX
Is responsive to the community
Provides opportunities for economic
growth by doing business
with local companies
Provides good jobs for local residents who work
at the college
Has continuing ed courses for residents who want
them for personal reasons
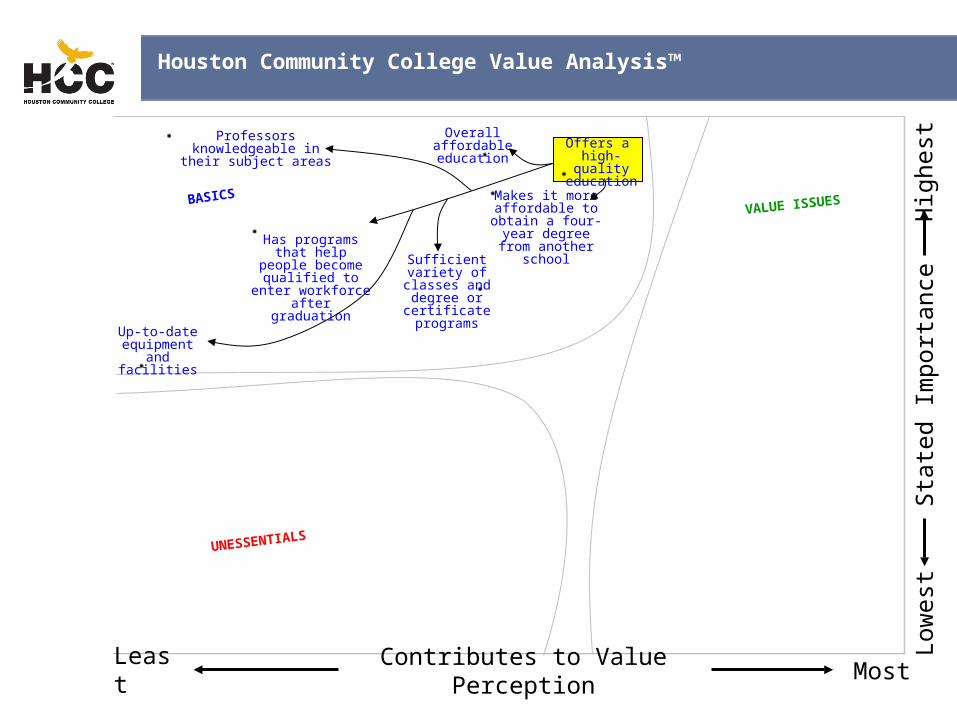
Houston Community College Value Analysis™

28
• Theme Analysis identifies important positioning issues for branding and communications, and describes these issues in terms of strategic implications and supporting attributes.
• Two themes emerged from the Value Analysis™ map:
• High-quality education – Houston residents have come to expect that community colleges offer a high-quality education. This is no longer an effective differentiator for community colleges. For residents, this comes down to affordability, variety of degrees, workforce preparation, knowledgeable professors, and up-to-date facilities.
• Responsive to the community – Houston residents value the degree to which community colleges are responsive to the community. This includes meeting the community’s education needs, impacting the local economy as an employer and a partner to area businesses, and decreasing social costs to the state.
Theme Analysis
Contributes to Value Perception MostLeast
Sta
ted
Impo
rtanc
eH
ighe
stLo
wes
t
BASICSVALUE ISSUES
UNESSENTIALS
Professors knowledgeable in their subject areas
Overall affordable education Offers a
high-quality education
Makes it more affordable to obtain a
four-year degree from another schoolHas programs that
help people become qualified to enter workforce after
graduation
Sufficient variety of classes and
degree or certificate programs
Up-to-date equipment
and facilities
Houston Community College Value Analysis™

Contributes to Value Perception MostLeast
Sta
ted
Impo
rtanc
eH
ighe
stLo
wes
t
BASICS
VALUE ISSUES
UNESSENTIALS
Meets education needs of residents
Works with community
businesses to identify workforce needs
Positively impacts region’s
economy
Students decrease social costs
to TX
Is responsive to the community
Provides opportunities for
economic growth by doing business with
local companiesProvides good jobs for local residents who work
at the college
Houston Community College Value Analysis™

Net Promoter Score

Net Promoter Score
Objective: This section examines responses to the question, “How likely is it that you would recommend HCC to a friend or family member?” as a method of measuring satisfaction.
Methodology: Respondents rated, on a scale from 0-10 (“Not at all Likely” to “Extremely Likely”), how likely they were to recommend HCC. Responses are divided into three categories: Promoter, Passive, or Detractor. The Net Promoter score is determined by subtracting the percentage of respondents who are Detractors from the percentage of respondents who are Promoters.
Scale: The Net Promoter Score scale ranges from -100% to 100%. An average score is between 5-10%. A score of 50% or above is considered excellent.
0 1 2 3 4 5 6 7 8
Not at all Likely Extremely Likely
PassiveDetractor
9 10Promoter
Findings: HCC’s Net Promoter Score (NPS) for students was 30% (on a scale of + or – 100%). This puts HCC in between average and above average with regards to its NPS score. NPS is used as an additional measurement of satisfaction and shows that overall, students are satisfied with their experience at HCC and are more likely to recommend HCC than they are to speak negatively of the school.
Net Promoter Score

33
HCC’s Community Net Promoter Score is -6%. Southeast (31%) had the highest NPS. Northwest (-17%) and Southwest (-10%) had the lowest NPS. These scores put HCC in the “below average” range in terms of Net Promoters for the community.
Community Net Promoter Score
-7%
-17%
31%
-6%
Net Promoter Score
-9%
-10%
Respondents were asked: “How likely are you to recommend HCC to a friend or family member?”

Student Net Promoter ScoreHCC’s total Student Net Promoter Score is 30%. Northeast (40%) and Online (36%) had the highest NPS. Central (25%) and Southwest (27%) had the lowest NPS. These scores put HCC in the “average to good” range in terms of Net Promoters for students.
Respondents were asked: “How likely are you to recommend HCC to a friend or family member?”
40%
34%
27%
25%
30%
Net Promoter Score
32%
30%
36%

Student Satisfaction
Respondents were asked to: “Please rate your overall level of satisfaction with the following college functions and services” on a scale from 1 to 5, with 1 being “Very Dissatisfied” and 5 being “Very Satisfied.”
Respondents were asked to rate the statements below:Administrative and student service offices are open at convenient times.Classes are scheduled at times that are convenient for me.Class sizes are appropriate for maximum learning.Faculty members are helpful and approachable.I am proud to tell others that I am an HCC student.I receive excellent instruction in most of my courses.My courses are challenging.Online course registration is easy to use.Policies and procedures regarding course registration and course selection are clear and easy to find.Students are made to feel welcome on campus.The enrollment process is easy to complete.

Student Satisfaction
Respondents were asked: “Please rate your level of agreement with the statements below.”
Students were satisfied with the variables having to do with their courses: appropriate class size (4.18), challenging courses (4.02), convenient classes (4.02), and variety of courses (3.94). Of the variables related to courses, the lowest score was for availability of courses (3.73).

Student Satisfaction (continued)
Respondents were asked: “Please rate your level of agreement with the statements below.”
The lowest score was for the statement, “Administrative and student service offices are open at convenient times.” Policies and procedures regarding course registration and course selection are clear and easy to find,” also received a lower score.

Satisfaction with ServicesStudents were most satisfied with the variety of courses, campus facilities, and availability of technology. However, none of the variables rated received a score of 4.0 or higher, indicating room for improvement in all areas.
Respondents were asked: “Please rate your overall level of satisfaction with the following college functions and services.”
Satisfaction with Services (continued)
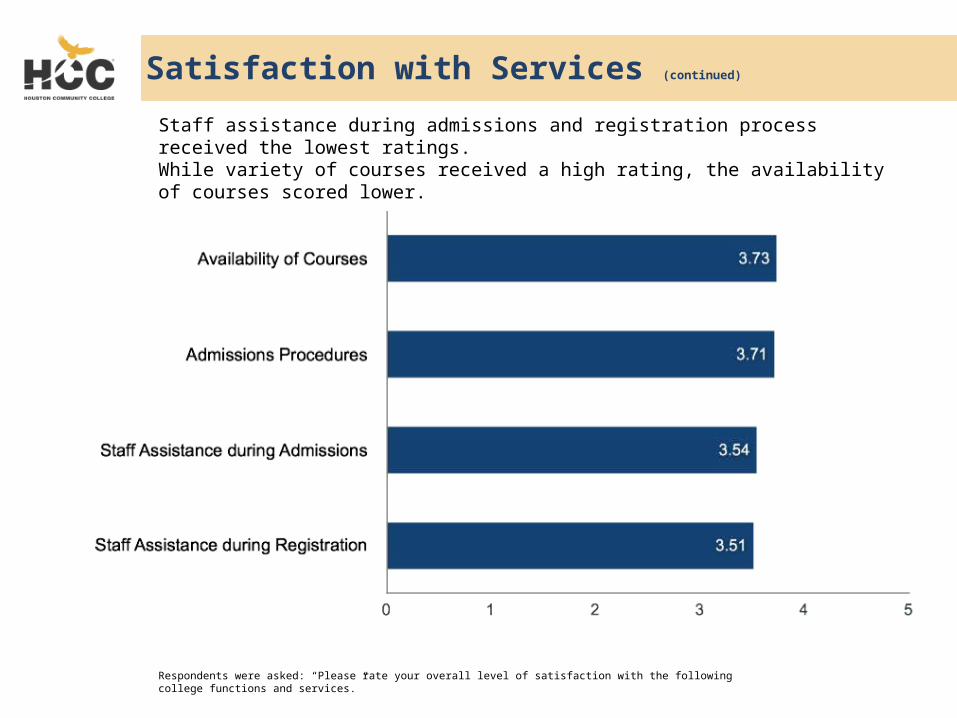
Staff assistance during admissions and registration process received the lowest ratings. While variety of courses received a high rating, the availability of courses scored lower.
Respondents were asked: “Please rate your overall level of satisfaction with the following college functions and services.”

Student Satisfaction with FacilitiesCampus cleanliness and maintenance received high scores. Food options consistently received the lowest scores.
Respondents were asked: “Please rate your level of satisfaction with the areas below.”

Decision to Attend HCC

Decision to Attend HCC
• Low cost, flexibility of course times, convenient locations, and availability of courses were all rated as extremely important in deciding to attend HCC.
• Referrals from others were the least important factors.
Respondents were asked: “Please rate how important the following were in your decision to attend HCC:”

Decision to Register • Most students answered “None” or wrote in a response to “Other.”• Other responses were mainly that friends or family members were the primary
influences when deciding to register for courses at HCC.
Respondents were asked, “Thinking of the last time you registered at HCC, which of the following influenced your decision to sign up for classes at HCC? Please select all that apply.”

Communication Audit
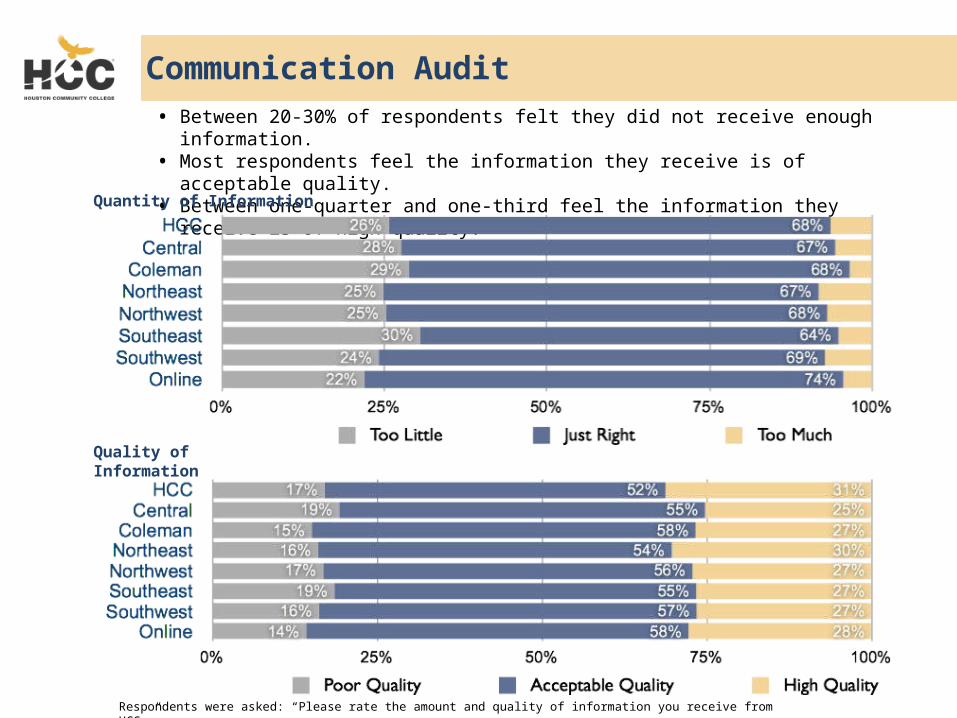
Communication Audit • Between 20-30% of respondents felt they did not receive enough information.• Most respondents feel the information they receive is of acceptable quality. • Between one-quarter and one-third feel the information they receive is of high quality.
Quality of Information
Quantity of Information
Respondents were asked: “Please rate the amount and quality of information you receive from HCC.”

Information Mechanisms Students receive the most and best information via email. They also prefer to receive information this way. Their secondary source of information is HCC’s website.
Respondents were asked to rank the mechanisms through which they receive the most and best information as well as the mechanism through which they prefer to receive information.

Online Education

Aided Awareness of Online EducationNinety-three percent (93%) of all respondents were aware that HCC offers online courses.
Respondents were asked: “Did you know that HCC has Online (Distance Education)?”
All Respondents
Responses by Campus

Participation in Online CourseForty-six percent (46%) of respondents have taken an online course.
Respondents were asked: “Have you ever taken an Online course (Distance Education) at HCC?”
All Respondents
Responses by Campus

Online Education - HCC The overall satisfaction for online courses was moderate with a score of 3.84. Responses were fairly neutral with regards to preference for online courses and the amount of time spent on online courses. Students agree that they take online courses when traditional formats are not available.
Respondents were asked: “Please rate your level of agreement with the statements below regarding your experience with Online courses (Distance Education) at HCC:”

Awareness of Coleman College for Health Sciences

Eighty-six percent of all respondents were aware that HCC offers programs in Health Sciences.
Respondents were asked: “To your knowledge, does Houston Community College offer programs in the Health Sciences, such as nursing, dental hygiene, etc.?”
Student Awareness of Health Sciences Programs
All Respondents Responses by Campus

• Sixty-one percent of respondents said they were aware that HCC has a campus in The Texas Medical Center.
• Thirty-five percent correctly named Coleman as the campus in the medical center.
Respondents were asked: “To your knowledge, does Houston Community College offer programs in the Health Sciences, such as nursing, dental hygiene, etc.?”
Student Awareness of Campus in the Medical Center
All Respondents
Responses by Campus

Community Respondent Profile

Gender and Age – By Market
Market
Total CCA NECA NWCA SECA SWCA
% % % % % %
Gender
Male 41 36 45 47 28 41
Female 59 64 55 53 72 59
Age
Under 25 10 5 11 5 21 11
25-34 25 27 28 21 23 25
35-44 17 17 18 19 22 11
45-54 20 20 20 20 13 24
55-64 15 15 12 18 15 15
65 or older 13 16 11 18 6 13

Gender and Age – By Ethnicity and Household Income
Ethnicity Household Income
Total Af-Am Asian Hisp CaucUnder $35k
$35-74.9k $75k+
% % % % % % % %
Gender
Male 41 24 52 34 52 36 36 51
Female 59 76 48 66 48 64 64 49
Age
Under 25 10 8 10 22 3 18 7 2
25-34 25 15 41 37 17 25 28 19
35-44 17 16 24 19 13 12 21 18
45-54 20 34 10 15 20 21 16 22
55-64 15 19 14 4 21 10 14 24
65 or older 13 8 2 2 27 13 12 14

Ethnicity and Household Income – By Market
Market
Total CCA NECA NWCA SECA SWCA
% % % % % %
Ethnicity
African-American 20 15 15 8 42 22
Asian 9 6 3 9 3 18
Hispanic 29 18 49 21 39 21
White or Caucasian 40 56 33 56 14 38
Other 2 2 0 4 2 0
Prefer not to answer 1 3 1 0 0 0
Household Income
Under $25,000 28 12 44 12 35 32
$25,000 to $34,999 12 11 13 17 13 9
$35,000 to $49,999 14 16 11 14 17 15
$50,000 to $74,999 16 17 17 18 16 15
$75,000 to $99,999 10 16 4 12 12 9
$100,000 or higher 19 27 10 27 8 20

Student Respondent Profile

Student Status
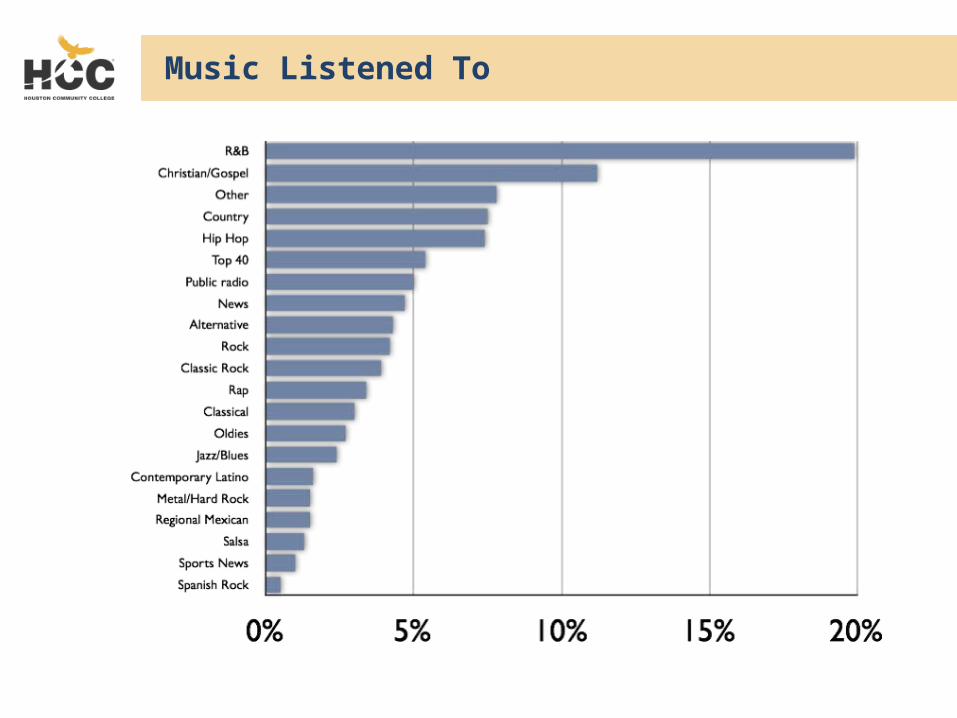
Music Listened To
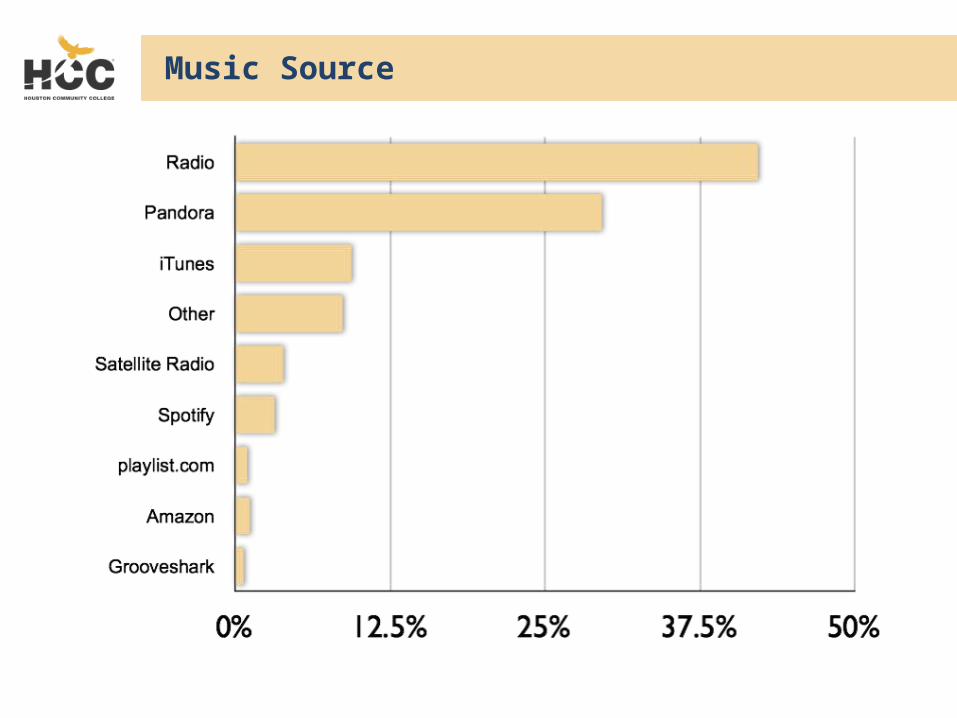
Music Source

Student Education Level
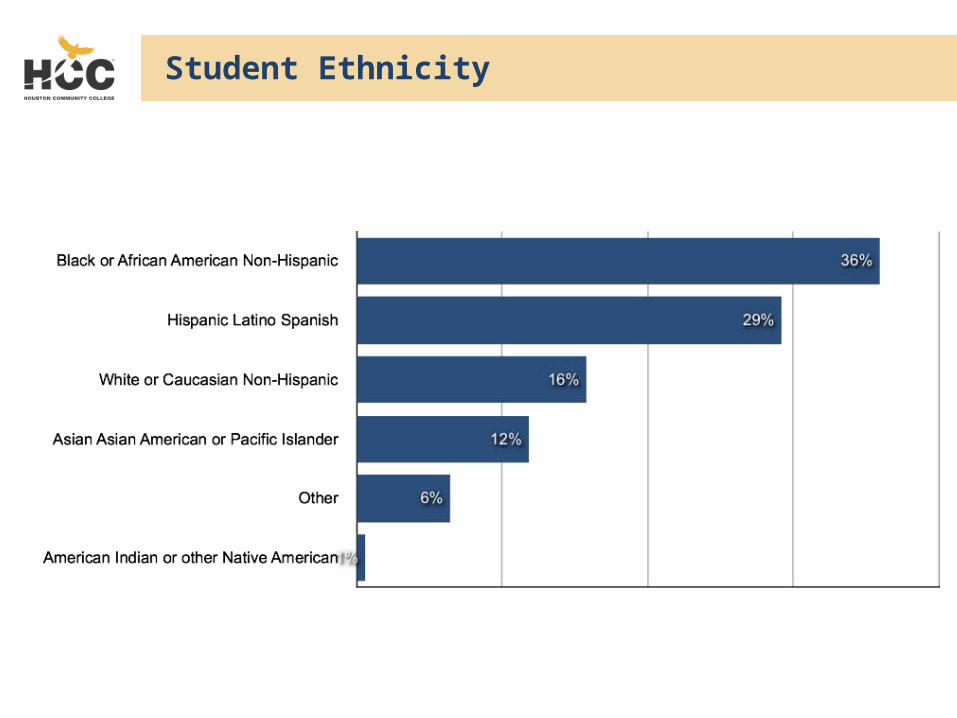
Student Ethnicity

Student Household Income