hdpe bone graft fabrication: establishing proprietary hdpe
TRANSCRIPT

University of Wollongong University of Wollongong
Research Online Research Online
University of Wollongong Thesis Collection 2017+ University of Wollongong Thesis Collections
2019
HDPE Bone Graft Fabrication: Establishing Proprietary HDPE Fabrication HDPE Bone Graft Fabrication: Establishing Proprietary HDPE Fabrication
Protocol by Selective Laser Sintering Protocol by Selective Laser Sintering
Kuan Phang Chan University of Wollongong
Follow this and additional works at: https://ro.uow.edu.au/theses1
University of Wollongong University of Wollongong
Copyright Warning Copyright Warning
You may print or download ONE copy of this document for the purpose of your own research or study. The University
does not authorise you to copy, communicate or otherwise make available electronically to any other person any
copyright material contained on this site.
You are reminded of the following: This work is copyright. Apart from any use permitted under the Copyright Act
1968, no part of this work may be reproduced by any process, nor may any other exclusive right be exercised,
without the permission of the author. Copyright owners are entitled to take legal action against persons who infringe
their copyright. A reproduction of material that is protected by copyright may be a copyright infringement. A court
may impose penalties and award damages in relation to offences and infringements relating to copyright material.
Higher penalties may apply, and higher damages may be awarded, for offences and infringements involving the
conversion of material into digital or electronic form.
Unless otherwise indicated, the views expressed in this thesis are those of the author and do not necessarily Unless otherwise indicated, the views expressed in this thesis are those of the author and do not necessarily
represent the views of the University of Wollongong. represent the views of the University of Wollongong.
Recommended Citation Recommended Citation Chan, Kuan Phang, HDPE Bone Graft Fabrication: Establishing Proprietary HDPE Fabrication Protocol by Selective Laser Sintering, Master of Philosophy (Biofabrication) thesis, Intelligent Polymer Research Institute, University of Wollongong, 2019. https://ro.uow.edu.au/theses1/879
Research Online is the open access institutional repository for the University of Wollongong. For further information contact the UOW Library: [email protected]

HDPE Bone Graft Fabrication: Establishing Proprietary HDPE
Fabrication Protocol by Selective Laser Sintering
By
Kuan Phang CHAN
Bachelor of Engineering (Honours) in Biomedical Engineering
Supervisors:
Prof. Gordon G. Wallace, Dr. Stephen Beirne, Dr. Zhilian Yue
This thesis is presented as part of the requirement for the conferral of the degree:
Master of Philosophy (Biofabrication)
This research has been conducted with the support of the University of Wollongong Higher
Degree Research – International Postgraduate Tuition Award Programme Scholarship
The University of Wollongong
Australian Institute of Innovative Materials
Intelligent Polymer Research Institute
March 2019

I
Certification
I, Kuan Phang CHAN, declare that this thesis submitted in fulfilment of the
requirements for the conferral of the degree Master of Philosophy Biofabrication from
the University of Wollongong, is wholly my own work unless otherwise referenced or
acknowledged. This document has not been submitted for qualifications at any other
academic institution.
Kuan Phang CHAN
Saturday, 4 July, 2020

II
Abstract
Cranioplasty is one of the surgeries commonly performed to restore the loss of bone and
aesthetics in the cranial region. Currently, an autologous bone graft is the preferred source of
bone to address cranial defects. However, when the defect size is more than 25 cm2 it poses
surgical challenges to reconstruct the defect as the autologous bone stock availability may not
be enough to reconstruct, nor does the geometrical shape properly fit the defect. High-density
polyethylene (HDPE) has a long history in clinical use for facial and cranioplasty
augmentation. It has been applied as a graft for reconstruction purposes with encouraging
results. The existing conventional fabrication method does not result in a porous structure in
an implant. Selective laser sintering (SLS) is selected as the fabrication medium to selectively
fuse particles to create a porous structure because a porous implant is important for graft
stabilisation in the human body. However, the knowledge on fabricating HDPE bone grafts
using SLS is limited in terms of the temperature sintering window. Furthermore, the known
challenges for HDPE fabrication are the narrow temperature sintering window and the raw
particle morphology.
The aim for this project is to establish a benchmark protocol to fabricate HDPE using the SLS
method. The HDPE used in this project is proprietary HDPE particles called StarPore™. In
order to achieve the project’s aim, the project has been divided into three phases: 1) powder
characterisation, 2) establishment of a single-level fabrication methodology, and 3)
establishment of a multi-level fabrication methodology.
Phase 1 (Chapter 2) results showed that the StarPore™ particles are trilobal and the average
particle diameter was approximately 892±30 µm. Differential scanning calorimetry (DSC)
showed a narrow temperature sintering window of between 117±1 °C and 130±1 °C for the
StarPore™ particles and thermogravimetric analysis (TGA) showed a single phase
decomposition profile with the onset temperature of decomposition at 432±7 °C. Reflectance
test showed the StarPore™ particles are highly reflective. During resting, large gaps between
StarPore™ particles were observed. The large gaps between StarPore™ particles was
approximately 200 µm to 550 µm.
A single-level fabrication platform was developed in phase 2 (Chapter 3) for single-level SLS
fabrication. The effects of sintered height, sintered depth and sintered thickness on the particle

III
morphology and physical structure for a single-level StarPore™ fabrication were examined.
The effect of laser on single-level fabrication was examined, and the particle fusion was divided
into six groups based on the level of particle fusion, with the lower limit defined as the onset
of fusion presence in the sintered structure and the upper limit defined by the presence of a
coalesced fusion structure. Overall, heat treatment of the fabricated sample at the melting
temperature improved the mechanical properties of the fabricated samples, although a
reduction in height after heat-treatment was approximately 15.2%. The ultimate tensile strength
showed an increase from 94 kPa to 950 kPa.
A multi-level fabrication platform was developed in phase 3 (Chapter 4) to fabricate multi-
level samples. Recoating mass of 1.5 g was determined to be suitable for multi-level
fabrication. Four different multi-level fabrication strategies were employed to study the effect
of laser output, scanning schematics and laser space scan on multi-level fabrication. A modified
fabrication strategy with added static compression was done after the optimisation of other
parameters as mentioned; compaction either after recoating (Recoat-C) and sintering (Sinter-
C) on the fabricated height. The compacted multi-level fabricated and compacted heat-treated
samples produced were analysed with micro-CT to determine the overall structural porosity. A
reduction of porosity was found for heat-treated samples Recoat-C and Sinter-C due to loss of
voids and structural porosity from reduced height after heat-treatment. Mechanical analysis
showed that the heat-treated multi-level sample that was compacted after recoating (Recoat-C)
exhibited higher stress tolerance of 1.76 MPa at 19.7% strain compared to samples compacted
after sintering (Sinter-C) that were about 1.65 MPa at 13.5% strain.

IV
Acknowledgements
“Brother, it is time for you to go after your dreams. We are all now better because of you. You
should take a step back and just do what you want to do, and “PaPa” and “MaMa” also agrees
with us”, it was the words that my siblings told me by phone while I was in Shenzhen, China,
early 2017. It made me burst into tears that they knew all this while I have been waiting for the
opportunity. Hence, I decided to make the difference. I would like to thank my family members,
Mr. Leong Fook Chan, Mrs. Moh Swee Lee, Ms. Keem Gwek Chan, Ms. Keem Siang Chan
and Mr. Kuan Eyong Chan for the push and encouragement for me to take the leap of faith that
will take me on a new journey of self-discovery.
Next, I would like to thank my girlfriend, Haijuan Liu, who had accompanied me through this
tough journey and the long-distance relationship. Her unconditional love and trust gave me
confidence to face obstacles every day of my journey. She was always there, and will be there
for me, and I cherish every moment we spend together.
I would also like to thank my project advisory team Professor Gordon Wallace, Dr. Stephen
Beirne and Dr. Zhilian Yue of the Intelligent Polymer Research Institute (IPRI) department of
the Australian Institute for Innovative Materials (AIIM) at the University of Wollongong. The
door to my advisory team was always open whenever I ran into challenges or questions about
my research or writing. In addition, support for the grant and administrative paper was
unwithering.
I would like to thank our industrial partner Dr. Philip Lewis and Robert Thompson from
Anatomics Australia Pty. Ltd. for their valuable time and support to ensure a smooth project
progress.
Next, I would like to say thanks to my course coordinator, Prof. Michael Higgins who was
always concerned for the welfare of my project and for his time to interview me as the candidate
for the project.
I would like to thank the staff of AIIM who had provided my training and understanding of
specific equipment to use to produce and characterise my samples. Mr. Tony Romeo and Dr.
Mitch from the UOW Electron Microscopy Centre (EMC), Mr. Grant Barnsley, Mr. Cameron

V
Angus, Mr. Jerome Clinton, Dr. Alex Martyn and Mr. Adam Taylor from UOW Translational
Research Initiative for Cellular Engineering and Printing (TRICEP), Dr. Kerry Gilmore, Dr.
Eva Tomaskovic-Crook, Dr. Sepidar Sayyar, Dr. Johnson Chung, Ali Jeirani, Dr. Xiao Liu, Dr.
Chong Yong Lee, Prof. Peter Innis, Dr. Alex Harris, Dr. Toni Campbell, Ms. Dan Yang, Mr.
Sepehr Talebian, Mr. Abdul Moqeet Haee, Mr. Habib, Mr. Alex Nagle, Mrs. XiFang Chen,
Mr. Phil (Elvis) Smugreski, Delvene McKenzie, Carin Cinnadaio, Narelle Badger, Naomi
Davies and the staff from the workshops for all their support.
Lastly, I would also like to thank my research partner, Jeremy Di Noro, for his support and
assistance towards completing my project. Without him to assist me on the micro-CT analysis,
I would not be able to complete the final experimental characterisation of the research. Jeremy
has been welcoming and will render any form of assistance to provide me with the latest update
of our project.

VI
Abbreviations
AM Additive manufacturing
BaSO4 Barium sulphate
CMF Craniomaxillofacial
DSC Differential scanning calorimetry
HA Hydroxyapatite
HDPE High-density polyethylene
MMA Methyl-methacrylate
NIR Near-Infrared
PA Polyamide
PE Polyethylene
PEEK Poly-ether-ether ketone
PMMA Poly-methyl-methacrylate
PPI Pulse per inch
SLS Selective laser sintering
TGA Thermogravimetric analyser
UTS Ultimate tensile strength
XRD X-ray diffractogram

VII
Glossary
Coalesce All sintered particles joint together to form a stable structure.
Evident fusion A much stronger and distinct joint is formed.
Fabricated The complete sintering of the single- or multi-level sample based on the
predetermined single- or multi-level fabrication strategies.
Free structure Unsintered particles that serve as the foundation for the sintered sample.
Sintered parts do not have fixed support and lies on the powder bed and
may move from its original position when an external force is applied.
Lower limit Lowest laser output to produce fusion for structure stability and be
strong enough to maintain shape
Minor fusion The onset of joint formation between deformed particles. Joints are
usually small and may not be strong enough to maintain a stable bond.
Multi-level A sintered part fabricated in a stack of levels of known recoating
thickness.
Non-virgin powder Powder that has been used and recycled for sintering purposes. The
powder has been exposed to a certain degree of heat during the previous
usage.
Recoat-C Sample compacted with static weight after the recoating step.
Single-level The first level sintered part of a raw material on a substrate or on a free
structure with a known recoating thickness.
Sinter-C Sample compacted with a static weight after the sintering step.
Sintered height Sample sintered height change (∆sH) measured from the sintering bed
surface.
Sintered depth Sample sintered depth in relation to the laser energy penetration from
the sintering bed surface.
Sintering window The range of laser output from lower limit to upper limit.
Upper limit Highest laser output that does not result in the presence of voids that are
trapped in the coalesce due to excessive energy density.
Virgin powder Raw powder that is free from any heat exposure and had not been used
before for sintering.
VIII
Symbols
∆sH Sintered height change, mm
Dlaser Laser spot size, mm
Edensity Single line energy density, J mm-2
Plaser Laser power, W
P&P Parallel and perpendicular hatch sintering
Ti Titanium
Tc Crystallisation temperature, °C
Tm Melting temperature, °C
sD Sintered depth, mm
Vscan Laser scanning speed, mm s-1

IX
Contents
Certification ............................................................................................................................ I
Abstract .................................................................................................................................. II
Acknowledgements .............................................................................................................. IV
Abbreviations ....................................................................................................................... VI
Glossary .............................................................................................................................. VII
List of Tables ...................................................................................................................... XII
List of Figures .................................................................................................................... XIII
1 Chapter 1: Introduction ................................................................................................1
1.1 The Human Cranial Bone Anatomy ............................................................................1
Craniomaxillofacial (CMF) Surgery .................................................................1
Autologous Graft ..............................................................................................2
Allogenic and Xenogenic Graft ........................................................................2
Alloplastic Graft................................................................................................3
1.2 High-Density Polyethylene (HDPE) As Allograft .......................................................7
1.3 Conventional Fabrication Of Polyethylene (PE)-Based CMF Graft ...........................8
1.4 Additive Fabrication ....................................................................................................8
Binder Jetting Printing ......................................................................................9
Selective Laser Sintering (SLS) ......................................................................10
1.4.2.1 The Effects Of Materials Properties On SLS ................................................12
1.4.2.2 Choice Of Lasers For Selective Laser Sintering ...........................................15
1.5 The Challenges In Fabrication Of High-Density Polyethylene (HDPE) Grafts ........17
1.6 Research Aims ...........................................................................................................18
2 Chapter 2: Powder Characterisation ..........................................................................21
2.1 Materials And Methods..............................................................................................21
StarPore™ Morphology ..................................................................................23
StarPore™ Optical Properties .........................................................................23
StarPore™ Thermal Properties .......................................................................24
StarPore™ Crystallinity ..................................................................................25
2.2 Results And Discussion .............................................................................................26
StarPore™ Morphology ..................................................................................27
Powder Optical Properties ..............................................................................29
Powder Thermal Properties .............................................................................31

X
Powder Crystal Phase .....................................................................................34
2.3 Chapter Conclusion ....................................................................................................35
3 Chapter 3: Establishment Of Single-Level Fabrication Methodology ......................37
3.1 Materials And Methods..............................................................................................37
Single-Level Fabrication Strategies ................................................................39
Laser Spot Size ...............................................................................................42
Fabrication Dimension Accuracy In Comparison To Designed
Dimension .....................................................................................................43
Effect Of Heat Treatment On Structural Dimension ......................................44
Mechanical Test ..............................................................................................44
3.2 Results And Discussion .............................................................................................45
Laser Sintered Particles Morphology Characterisation ..................................46
Physical Characterisation Per Laser Output ...................................................49
3.2.2.1 Physical Comparison Of Parallel 1X1.0 To Other Parallel
Fabrication Strategies ....................................................................................52
3.2.2.2 Physical Comparison Of Parallel 1x1.0 To Other Parallel And
Perpendicular (P&P) Fabrication Strategies ..............................................................55
Effect Of Laser Spot Size On The Fabrication Strategy .................................57
Fabrication Dimension Accuracy In Comparison To Designed
Dimension .....................................................................................................61
Effect Of Heat Treatment On Structural Dimensions .....................................63
Mechanical Test ..............................................................................................64
3.3 Chapter Conclusion ....................................................................................................69
4 Chapter 4: Establishment Of Multi-Level Fabrication Methodology ........................72
4.1 Materials And Method ...............................................................................................73
Determining Recoating Mass ..........................................................................74
Multi-Level Fabrication Strategies .................................................................75
Modified Fabrication With Added Compaction To Reduce
Structure Thickness .......................................................................................77
Effect Of Heat Treatment On Structural Dimension ......................................79
Micro-CT Analysis .........................................................................................79
Mechanical Test ..............................................................................................79
4.2 Results And Discussion .............................................................................................80
Determining Recoating Mass ..........................................................................81

XI
Multi-Level Fabrication Strategies .................................................................83
4.2.2.1 Multi-Level Fabrication Strategies: Laser Output ........................................85
4.2.2.2 Multi-Level Fabrication Strategies: Scanning Schematics ...........................86
4.2.2.3 Multi-Level Fabrication Strategies: Laser Scan Space .................................87
Modified Fabrication With Added Compaction To Reduce Multi-
Level Thickness ............................................................................................88
Effect Of Heat Treatment On Structural Dimensions .....................................90
Micro-CT Analysis .........................................................................................92
Mechanical Test ..............................................................................................94
4.3 Chapter Conclusion ....................................................................................................98
5 Chapter 5: Thesis Conclusion ..................................................................................100
6 Chapter 6: Future Direction .....................................................................................103
7 References ................................................................................................................105

XII
List of Tables
Table 1.1: Properties of an autologous bone graft [10]. ............................................................2
Table 1.2: Examples of HDPE applications in CMF repair.......................................................7
Table 3.1: The sample naming is based according to the type of scanning strategies
(Parallel or P&P-parallel and perpendicular), scan count and scan
space. For example, Parallel 2X1.0 means the sintering vector was
arranged parallel to each other with scan space of 1.0 mm and scan
count of 2. Scan count refers to the number of repeats on the same
sintering level. .....................................................................................................41
Table 3.2: Summary of particle analysis based on optical microscopic analysis. The
number indicated is the laser output in watt. (P&P: parallel and
perpendicular) .....................................................................................................48
Table 3.3: Summary of sinterable range based on Table 3.2. A wider laser output
sintering window at a lower upper limit is preferred for sintering as it
does not require high laser output to result in a stable sintered
structure. (P&P: parallel and perpendicular) ......................................................48
Table 3.4: Summary of particle analysis. The number indicates the laser output.
Larger laser spot size resulted in lower energy density delivered to
sintering surface and resulted in narrow laser output sintering window
(green, orange and blue). ....................................................................................58
Table 4.1: Description of the multi-level fabrication strategies. Blue colour denotes
parallel and perpendicular scanning schematics and orange colour
denotes parallel and alternate 90°on next layer scanning schematics.................76
Table 4.2: The six sample group names for all the samples prepared based on
compaction introduced after recoating or after the sintering step and
known recoating mass. ........................................................................................77
Table 4.3: The sample description for Figure 4.10, and the measured multi-level
thickness. .............................................................................................................84
Table 4.4: The lowest solid density of HDPE, 0.94 g/cm3 was used to calculate the
structural porosity of the samples before and after heat-treated. ........................93

XIII
List of Figures
Figure 1.1: Location and distribution of cranial and facial bones [3]. ....................................... 1
Figure 1.2: The radiographic image for hydroxyapatite shows multiple post
implantation fractures and it is difficult to differentiate bone from
hydroxyapatite [20]. .............................................................................................. 4
Figure 1.3: A radiographic of a metallic implant creates artefacts that prevent proper
post-surgery monitoring and make it difficult to identify bone
structure [26]. ........................................................................................................ 5
Figure 1.4: Radiographic image of cranioplasty using an implanted polyethylene
graft. The radiolucent property of polyethylene allows proper
monitoring of bone structure post-surgery [35]. ................................................... 6
Figure 1.5: Binder jetting printing schematics. A binder jetting printer uses binder
in the form droplets from the inkjet print head to create bonds at
localised area at the powder bed before a new recoating level is
deposited. The binder deposition and recoating will repeat as required
by the designed part [33]....................................................................................... 9
Figure 1.6: Schematics of the SLS process. The energy from the focused laser beam
will selectively sinter the powder bed and a new recoating level will
be added with the aid of the roller. Sintering and recoating step be
repeated as per the inputted CAD object [33]. .................................................... 10
Figure 1.7: Material factors that influence SLS [36]. The elements of
characterisation highlighted in green boxes are relevant to this thesis. .............. 13
Figure 1.8: The metastable thermodynamic region between Tm and Tc which
indicates the temperature sintering window of a raw material [36]. ................... 14
Figure 1.9: Optical properties for commercial polyamide and HDPE [61]. ............................ 15
Figure 1.10: Illustration of laser scan spacing, laser spot size or laser diameter [73].
............................................................................................................................. 16
Figure 1.11: Flowchart to show the experimental process. ..................................................... 20
Figure 2.1:Illustration of the experimental steps conducted for StarPore™ powder
characterisation. .................................................................................................. 22
Figure 2.2: Thirty randomly selected StarPore™ particles mounted between two
glass slides, for inspection by optical microscopy. ............................................. 23

XIV
Figure 2.3: Controlled thickness sample holder arrangement for use in light
reflectance studies. .............................................................................................. 24
Figure 2.4: Sample production cycle where StarPoreTM powder was exposed to heat
(red box) and the ratio of virgin and non-virgin mix was calculated
based on the assumed filled sintered depth of 1.1 mm (green box). ................... 26
Figure 2.5: Example of optical microscopy of StarPore™ particle showed that the
shape is trilobal. .................................................................................................. 27
Figure 2.6: Example of optical microscopy of StarPore™ particle. StarPore™
particles were produced via automated and extrusion process and the
thickness varies based on the flowability of the heated material. ....................... 28
Figure 2.7: Optical analysis of bulk StarPore™ powder at sintering bed surface. .................. 28
Figure 2.8: StarPore™ reflectance increases as the sample thickness (or free
structure depth) increases. ................................................................................... 29
Figure 2.9: StarPore™ transmission decreases as the sample thickness (or free
structure depth) increases. ................................................................................... 30
Figure 2.10: The TGA for three StarPore™ samples. ............................................................. 31
Figure 2.11: The average decomposition temperature onset of StarPore™
calculated at 423±7 °C and the StarPore™ DTG curve show that the
decomposition occurs almost at one step. ........................................................... 32
Figure 2.12: The DSC for three StarPore™ samples. .............................................................. 33
Figure 2.13: DSC analysis showed StarPore™ possesses a narrow temperature
sintering window compared to commercial polyamine. ..................................... 33
Figure 2.14: XRD analysis for both samples. The crystal phases 110, 200 and 020
can be seen for both the samples at 21.5°, 24.0° and 36.2° [87] except
001 which exists only for virgin StarPore™. ...................................................... 34
Figure 3.1: Showing the sintered height change (∆sH) and sintered depth (sD) that
occurs during sintering. The single-level total thickness is the
combination of measured sintered height (∆sH) and sintered depth
(sD). .................................................................................................................... 38
Figure 3.2: The illustration of the experimental steps conducted for single-level
fabrication. .......................................................................................................... 39
Figure 3.3: Sintering bed platform is positioned right below the laser source within
the laser cutter chamber. ..................................................................................... 40

XV
Figure 3.4: The illustration showing that the spot size will increase if the z distance
is either reduced or increased from the origin. The laser depth of focus
is ±2.5 mm for spot size of 130 µm. ................................................................... 43
Figure 3.5: The designed dogbone dimensions for fabricated StarPore™ dogbone. .............. 44
Figure 3.6: The dogbone sample in the mechanical tester clamp. The sample holder
(circled) acts as an intermediary to prevent deformation to the
dogbones from the clamps. ................................................................................. 45
Figure 3.7: Optical microscopy of StarPore™ particle changes at various
fabrication stages. Each sintering stage has its own colour
denomination....................................................................................................... 47
Figure 3.8: Cross section of the fabricated StarPore™ obtained from reconstructing
data from micro-CT. The sintered surface area showed a sintered
rough surface with protrusions............................................................................ 50
Figure 3.9: The graph shows the relationship of measured single-level thickness,
mm with laser output, W. The graph shows an increasing trend in
thickness with increased laser output energy. ..................................................... 51
Figure 3.10: The single-level thickness of three parallel samples from laser output
14 W to 30 W showed an increasing trend on the sample laser output.
Across the graph, there is a gradual increase in thickness for both
samples Parallel 1X1.0 and Parallel 2X1.0, except sample Parallel
1X0.5, where it showed a rapid increase in thickness. ....................................... 52
Figure 3.11: The laser spot size Ø = 130 µm, for the comparison of scan space of
1.0 mm and 0.5 mm. ........................................................................................... 53
Figure 3.12: Sample Parallel 2X1.0 showed similar sintered height changes to
sample Parallel 1X1.0, while sample Parallel 1X0.5 showed a rapid
increase in sintered height in response to the narrowing of scan space.
The red arrow indicated the increase in sintered height from sample
Parallel 1X1.0 to Parallel 1X0.5. ........................................................................ 54
Figure 3.13: The sintered depth for all the samples is similar to their sample group.
Sample Parallel 1X0.5 is the deepest followed by sample Parallel
2X1.0 and Parallel 1X1.0. The red arrow indicated the increase in
sintered depth from sample Parallel 1X1.0 to Parallel 1X0.5. ............................ 54
Figure 3.14: Fabricated single-level thickness for all three P&P sample groups
compared to sample Parallel 1X1.0. Overall single-level sintered

XVI
thickness for all three P&P sample groups increases rapidly before
reaching a plateau compared to sample Parallel 1X1.0 for which
thickness increased gradually. ............................................................................ 55
Figure 3.15: Sintered height for all three P&P samples compared to one parallel
sintered sample. Sample Parallel 1X1.0 has the lowest overall sintered
height of all the samples. Generally, overall sintered height increases
with increasing laser output. ............................................................................... 56
Figure 3.16: Sample Parallel 1X1.0 has the lowest overall sintered depth of all the
three P&P samples on equivalent laser output. ................................................... 57
Figure 3.17: The fabricated single-level thickness for the four samples sintered does
not show any distinct difference. The red box shows the rapid raise in
fabricated single-level thickness from 10 W to 16 W before reaching
a thickness plateau. ............................................................................................. 58
Figure 3.18: The sintered height for all samples sintered at origin to z= +7.5. Notice
that the overall sintered height increases from origin to z=+7.5 within
P&P 1X1.0 (origin) laser output sintering window. This could be due
to the narrowing of laser spot size that influences the energy delivered
in thermal radiation and transmission. ................................................................ 59
Figure 3.19: The laser spot size Ø = 130 µm and Ø > 130 µm (for larger laser spot
sizes). The heat irradiated from laser spot size should be larger than
the laser spot size. ............................................................................................... 59
Figure 3.20: Sintered depth does not show distinct difference between the four
samples as the average sintered depth and the standard deviation lines
overlapped with each other. ................................................................................ 60
Figure 3.21: The measured dimensions for each section between design and
sintered dogbone. Gauge length after fabrication was not showed as it
was difficult to determine the end to end points. A: Overall length, B:
Grip length, C: Grip width, D: Gauge length, E: Gauge width. ......................... 61
Figure 3.22: Dimension changes for fabricated dogbones decrease if the sintered
dimension is small............................................................................................... 62
Figure 3.23: The laser scanning schematic. The hatch offset was offset internally in
consideration of the design boundary [93]. ......................................................... 62

XVII
Figure 3.24: The dimensional changes from fabricated to after heat-treatment for
each 120 °C and 130 °C heat-treated group. A: Overall length, B: Grip
length, C: Grip width, E: Gauge width. .............................................................. 63
Figure 3.25: Optical microscopy showed that 130 °C heat-treated dogbone
produced uniformed connected structure and elasticity. While 120 °C
heat treated dogbone produce a fracture similar to the fabricated
dogbone. .............................................................................................................. 64
Figure 3.26: The stress-strain curve for all three fabricated dogbones. ................................... 65
Figure 3.27: The stress-strain curve for the average fabricated dogbone. The
ultimate tensile strength was 57±15 kPa at 2.7±0.7% strain, while the
Young’s modulus was 36±20 kPa....................................................................... 65
Figure 3.28: The stress-strain curve for all three 120 °C heat-treated dogbone. ..................... 66
Figure 3.29: The stress-strain curve for the average 120 °C heat-treated dogbone.
The ultimate tensile strength was 94±10 kPa at 2.9±0.3% strain, while
the Young’s modulus was 49±8 kPa. .................................................................. 66
Figure 3.30: The stress-strain curve for all three 130 °C heat-treated dogbones. .................... 67
Figure 3.31: The stress-strain curve for the average 130 °C heat-treated dogbone.
The ultimate tensile strength was 950±83 kPa at 12.3±0.5% strain,
while the Young’s modulus was 396±48 kPa. .................................................... 67
Figure 3.32: All single-level average stress-strain curves. The mechanical
properties for 130 °C dogbone were enhanced significantly after heat-
treatment and the UTS and strain improved approximately 10X and
4X respectively, compared to the 120 °C dogbone............................................. 68
Figure 4.1: Multi-level fabrication platform built to characterise StarPore™ multi-
level samples. The elevation of platform in the z-axis direction is
controlled by a dial and the distance is visualised at the measurement
etched at the side surface. ................................................................................... 73
Figure 4.2: Illustration of the experimental step conducted for multi-level
fabrication. .......................................................................................................... 74
Figure 4.3: The SLS process involves repetitive steps of recoating and sintering.
The layer by layer sintering process stacked on top of the previous
layers gives the fabricated part a defined volume. .............................................. 75

XVIII
Figure 4.4: Fabrication schematics for multi-level fabrication. The number of
sintering levels is 5. The first level, n = 1 was sintered at 18 W (P&P:
parallel and perpendicular). ................................................................................ 76
Figure 4.5: The axis location on the sintering bed for a multi-level fabrication
platform. .............................................................................................................. 77
Figure 4.6: Compaction in Recoat-C was conducted immediately after recoating to
ensure raw particles are interlocked with the rough surface area of the
earlier sintered level before next sintering. ......................................................... 78
Figure 4.7: Introduction of static compaction after sintering for Sinter-C samples.
Static compression was introduced to the sintered level after sintering
step. ..................................................................................................................... 78
Figure 4.8: The measured thickness and width for all the three recoating mass
sample groups. .................................................................................................... 82
Figure 4.9: The measured weight and calculated structural density for the three
recoating mass sample groups. ........................................................................... 83
Figure 4.10: The fabricated thickness for all the four samples. Blue bar denotes
multi-level sample prepared with parallel & perpendicular scanning
schematics and orange bar was multi-level sample prepared with
parallel sintering schematics rotated alternately by 90° on subsequent
level. The correlation used to prepare samples A, B, C and D is
mentioned in Table 4.3. ...................................................................................... 84
Figure 4.11: The fabricated multi-level samples for parallel and perpendicular
sintering schematics, from bottom left to right, sample A and B. ...................... 85
Figure 4.12: The fabricated multi-level samples for parallel alternate level 90°
rotate, from bottom left to right, sample C and D. .............................................. 85
Figure 4.13: Sample D average fabricated multi-level thickness compared to
Sample Recoat-C and Sample Sinter-C. ............................................................. 88
Figure 4.14: Schematic illustrating the effect of roughening in the Recoat-C vs.
Sinter-C process. Full processes are shown in Figure 4.6 for Recoat-
C and Figure 4.7 for Sinter-C. ............................................................................ 89
Figure 4.15: The measured average thickness for both sample groups before and
after heat-treatment. ............................................................................................ 90
Figure 4.16: The measured average width for both sample groups before and after
heat-treatment. .................................................................................................... 91

XIX
Figure 4.17: The measured average weight for both sample groups before and after
heat-treatment. .................................................................................................... 91
Figure 4.18: The measured average structural density for both sample groups before
and after heat-treatment. ..................................................................................... 92
Figure 4.19: The micro-CT image analysis for both samples Recoat-C and Sinter-
C and the structural porosity before and after heat-treatment. ............................ 93
Figure 4.20: Sample Recoat-C with the breakpoint show by the red arrow. ........................... 95
Figure 4.21: The stress-strain curve for all three Recoat-C heat-treated dogbones. ................ 95
Figure 4.22: The stress-strain curve for the average Recoat-C. The ultimate tensile
strength was 1.76±0.29 MPa at 19.7±0.9% strain, while the Young’s
modulus was 534±53 kPa. .................................................................................. 96
Figure 4.23: The stress-strain curve for all three Sinter-C heat-treated dogbones. ................. 96
Figure 4.24: The stress-strain curve for the average Sinter-C ultimate tensile
strength was 1.65±0.06 MPa at 13.5±3.1% strain, while the Young’s
modulus was 521±117 kPa. ................................................................................ 97
Figure 4.25: The green zone shows both the dogbone samples experience the same
stress value till a strain of 2.5%. Above strain 2.5% the stress level of
dogbone Recoat-C was higher than for dogbone Sinter-C. ................................ 97

1
1 Chapter 1: Introduction
1.1 The Human Cranial Bone Anatomy
The human skull consists of eight cranial bones and fourteen facial bones that are tightly fused
together, except for the mandible which is the only movable bone. The positions of the cranial
and facial bones in the skull are shown in Figure 1.1. The skull is further layered with various
groups of muscles, especially mimetic muscles that serve as a medium for facial expression.
Muscle contractions are controlled via electrical pulses delivered by facial nerves and
mandibular nerves. Cranial bones are flat bones [1, 2] and serve to protect the brain from
external trauma.
Figure 1.1: Location and distribution of cranial and facial bones [3].
Craniomaxillofacial (CMF) Surgery
Craniomaxillofacial surgery is a highly specialised branch of orthopaedics that focuses on the
whole area of the mouth, jaw, face, skull and associated structures. Cranio- refers to cranium,
the top portion of the skull, maxillo- refers to maxilla, the lower jaw and facial refers to the
other face area besides the cranium and maxilla. There are various factors that contribute to the
need for CMF surgery, namely oncologic resection and bone loss due to trauma. Cranioplasty
or cranial reconstruction is usually performed to address aesthetics and cerebral protection [4,
5]. It is estimated that about 2.2 million bone graft procedures are undertaken worldwide
annually with about one quarter of those in the United States alone [6]. Part of the bone grafting
procedure comes from cranioplasty and small defects less than 25 cm2 are treated with bone
grafts. Also, some sources estimate that about 25 cranioplasties are conducted for each 1

2
million people [7]. Surgical complexity increases when a defect size is more than 25 cm2 [4],
due to the higher risk of donor site morbidity, limited availability of donor stock, tissue quality,
and feasibility of harvested donor bone matches with a geometrical shape to suit the intended
implanted site [8].
Autologous Graft
Autologous bone graft (autograft) is the current gold standard for managing bone defects and
is commonly used in CMF reconstruction [9]. It possesses all the desired properties listed in
Table 1.1 for a successful grafting as the bone source is from the same individual and the
rejection rate is nominally low [10]. The application of autologous bone graft is often limited
by the defect size, its shape, and the availability of the donor site. Bone resorption is a normal
occurrence that happens for the donor bone to remodel and forms a continuous union with its
neighbouring bone resulting in shrinkage of the bone graft [11]. Sometimes, bone resorption
is not followed with bone formation and will lead to graft failure. Hence, it is important to
have enough bone size to compensate for bone shrinkage during resorption. Furthermore,
donor site morbidity limits the application of autologous bone grafting [11, 12], surgical
complexity is increased due to the need for the extra surgical site [11], and team and time
needed to complete the surgery. Ischemic time plays a crucial factor for the viability of the
harvested bone as well.
Table 1.1: Properties of an autologous bone graft [10].
Properties Definition
Osteoconduction The ability to support new bone growth inwards from peripheral contact.
Osteogenesis The formation of new bone cells by osteoblastic cells in the graft.
Osteoinduction The ability to stimulate the host osteoprogenitor cells to differentiate to
osteoblasts by local growth factors resulting in bone-formation.
Allogenic and Xenogenic Graft
Allogenic graft (allograft) is a graft derived from the same species and possesses similar
properties as with an autograft, but can have a high rejection rate if not correctly processed
prior to grafting due to the host immune responses [6]. A post-processing allogenic graft will
reduce its osteoconductive capabilities [6]. In addition, the risk of infections such as human
immunodeficiency virus (HIV) and hepatitis B and C arising from allografting has been

3
reported [6]. An allogenic graft possesses lower osteogenic properties and a higher resorption
rate [11] compared to an autologous graft. The use of allogenic grafts has declined due to
concerns of contamination and transmission of viruses [11].
A xenogeneic graft (xenograft), is derived from other species and has a high risk of interspecies
virus transmission and infection [13]. In addition, an xenograft is not considered as it causes
an acute antigenic response and lack of osteogenic response when implanted [11].
Alloplastic Graft
Alloplastic grafts are made either of a single-component or multi-component materials and are
divided into three main categories: ceramics [4], polymers [7], and metallics [14]. An
alloplastic graft should be at least biologically inert and not cause any adverse side effects to
the human host. It should possess either one or both of osteointegration and osteoconduction
properties as required for integration with the surrounding host tissue after implantation [15].
Osteointegration is defined as the material’s ability to chemically bond to a bone surface
without an intervening layer of fibrous tissue. Alloplastic grafts have become preferred options
for surgeons in bone grafting procedures since they are either readily available or easily
malleable [4].
According to Wolff’s Law, a bone is constantly remodelling itself in adaptation to external
forces and so, if all the stress has been transmitted to the graft as the main stress bearer, it will
weaken the bone surrounding the graft and thus lead to graft failure [15]. To avoid such
circumstances, an allograft should have the mechanical properties matching the targeted bone.
It needs to withstand external forces and have porosity to allow tissue ingrowth, thus forming
a highly stable complex that will be able to withstand deformation from external forces [16].
Hence, an alloplastic graft’s mechanical properties should match those of targeted bone at the
implantation site to prevent stress shielding.
Ceramic alloplastics are synthetic products composed of inorganic and ionically bonded
matrices. They have a wide variety of composition differences, porosities and structures.
Ceramic alloplastic has been used to construct and mimic the mineral phase of the bone that
allows for bone cell maturation. However, ceramic matrices are usually brittle with low fracture
resistance and so are commonly used in non-load bearing regions [17]. One of the examples of

4
ceramic alloplastic is hydroxyapatite (HA) [4] as it shares common mineral components with
bone [11, 18]. It is biocompatible and promotes bone growth [18]. Animal tests of HA shows
that osseous combination with bone tissues surrounds the implanted HA [18] and suggests that
HA promotes bone growth. Hydroxyapatite’s mechanical properties are similar to trabecular
bone [19] but it is known to be brittle [18, 19]. It is often used at a non-load bearing defect site,
especially as filler for periodontal defects [11] and small cranial defects. However, the
application of HA on cranial defects is limited when the defect size is greater than 25 cm2 as it
is prone to infection and graft fracture [4]. It has been reported that the infection rate is as high
as 62.5% for implanted HA [4]. Furthermore, it may break into many pieces in vivo due to
inadequate reabsorption of HA and remodelling of bone tissue that will result in
osteointegration failure [7]. Since, HA promotes bone growth, the alloplastic graft will fuse
together with the bone margin providing a secure positioning in vivo. However, if there is a
need to remove the implant due to disease recurrence, the implant will have to be removed
together with a portion of the bone as the implant has been tightly fused with the bone [7]. This
can pose a significant challenge for surgical planning to determine the extent of bone that needs
to be removed. Radiographic images of HA are radiopaque and similar to the bone radiographic
image. This may cause a difficulty for post-surgery monitoring (a radiographic image can be
seen in Figure 1.2).
Figure 1.2: The radiographic image for hydroxyapatite shows multiple post implantation
fractures and it is difficult to differentiate bone from hydroxyapatite [20].

5
Metallic alloplastic has been extensively used in the past as it has appropriate physical and
mechanical properties to the human bone. However, post-surgery radiographic images of
metallic implants generate artefacts that prevent proper analysis of implanted metal implants
at the bone. One of the examples of metallic implant used is titanium mesh. It is a light-weight
metallic alloplastic that offers good mechanical and biological properties [14]. Depending of
the fabrication strategy, it may result in a rough surface that increases the surface area for
cellular attachment resulting in implant fixation over time in vivo [21]. Post-surgery
radiographic images for titanium metallic implants generate artefacts that prevent distinct
radiographic monitoring of the bone and implants [22]; making it less preferred to radiolucent
alloplastic grafts. A radiographic image can be seen in Figure 1.3. Also, being metallic, there
are concerns that titanium mesh implants may corrode and release ions that can induce
inflammation [23]. This is due to the possibility that titanium ions may form a chemical bond
with bodily proteins and result in hypersensitive reactions [24] or even toxicity [25].
Figure 1.3: A radiographic of a metallic implant creates artefacts that prevent proper
post-surgery monitoring and make it difficult to identify bone structure [26].
Polymer alloplastic consist of a wide class of materials with a wide range of mechanical
properties. Polyethylene (PE) was firstly used in humans in 1948 and with the development of
porous polyethylene encouraged a certain degree of soft-tissue ingrowth. [27]. Another benefit
of using PE is that it is feasible to be implanted at a site where implants have failed due to
infection [28]. A follow up study had showed that PE remains stable after it has been implanted

6
in the human body [29, 30] and was stable for at least 30 years in some follow-up cases [28,
31, 32]. Implanted PE has a radiolucent advantage that allows distinct visualisation of post-
surgery bone structure [28, 33]. Polyethylene does not produce artefacts under radiographic
imaging [33]. The absence of artefacts is important for post-surgery monitoring of an implanted
graft at the site by determining how well the implant is integrated with the surrounding tissue.
The absence of artefacts and the distinct bone image in a radiographic image can be seen in
Figure 1.4. After implantation, PE remains stable in vivo and does not show any evidence of
degradation nor resorption [29, 30]. However, as PE is inherently hydrophobic it may limit the
tissue ingrowth and risk graft rejection [34].
Figure 1.4: Radiographic image of cranioplasty using an implanted polyethylene graft.
The radiolucent property of polyethylene allows proper monitoring of bone structure
post-surgery [35].
In summary, post-surgery stability of an implanted allograft is important to prevent undesirable
effects and post-surgery radiographic image provides crucial information on the extent of
implantation success by monitoring the extent of implant integration with the surrounding
tissues. Polyethylene (PE) possesses radiolucent properties that allow clear imaging of bone
and the extent of ingrowth. The distinct bone image is not seen for metallic implant due to
artefacts. In ceramic implants it is because of similar radiopaque image contrast to bone. Also,
PE has a lower risk of osteointegration failure compared to hydroxyapatite (HA), as HA may
break into pieces. Polyethylene does corrode and may cause an allergic effect compared to
metallic implants. However, PE might have some limitations due to its mechanical strength;

7
hence a higher molecular weight polyethylene, which is high-density polyethylene (HDPE),
was selected to be explored in this research.
1.2 High-Density Polyethylene (HDPE) As Allograft
The application of HDPE as an alloplastic graft material has been extensively studied and used
as an alternative to craniomaxillofacial (CMF) autologous grafts in the past. It consists of
repeating units of (CH2-CH2) that form the polymer backbone chain of its molecular structure
[36]. High-density polyethylene has been clinically used with satisfactory outcomes and with
minimal to no complications. Table 1.2 illustrates the HDPE’s clinical applications. Because
of its mechanical properties, a HDPE graft is usually confined to a non-load bearing or
articulating site at the CMF region.
Table 1.2: Examples of HDPE applications in CMF repair.
Year Implantation Site Ref
1990 Auricular region [37]
1993 Cranial-temporal bone region [38]
1998
Nasal region [39]
Orbital, temporal, frontal, maxillary and mandible region [40]
2002 Cranial-pterional bone region [41]
2003 Nasal, orbital, temporal, mandible, frontal region [42]
2004 Zygomatic, mandibular, temporal, frontal, orbital, auricular, maxillary and nasal
region.
[43]
2008 Nasal region [44]
2012 Cranial region [45]
Chin, nasal, maxilla, glabella region [16]
2014 Mandibular, orbital floor, nasal and chin region [46]
2018 Cranial-pterional bone region [47]
Graft porosity plays a crucial role in determining the efficacy of an implanted alloplastic graft.
Some of the earliest biological studies of HDPE were conducted in 1976 and showed that tissue
ingrowth was observed in porous HDPE with pores as small as 40 µm, and, over the 16-week
study [48], concluded that optimal ingrowth occurred for the pore size range of 100 to 135 µm.
Other studies suggest that the pore size should be between 100 to 150 µm to have an optimal
ingrowth of fibro-vascular tissue [15]. However, vascularisation into porous grafts with pore
sizes as large as 300 µm and as small as 30 µm has been reported as well [49]. In 2009, a study
showed that vascularisation of a porous HDPE graft supported immobilisation of the graft at
the implanted site [50]. Also, the vascularisation will stabilise the graft at the implanted site
and reduces graft micro-motion which further enhances tissue ingrowth [41]. Furthermore, an

8
increased fibrovascular tissue ingrowth into the graft contributes to infection resistance
originating from the graft as the supply of antibody and nutrients is exchanged via newly
formed blood vessels [51]. A 3D topology method can be used to provide information on pore
structure [52] and to give a visualisation of the possibility of how tissue ingrowth will occur.
A porous graft increases the surface area for cell attachment and graft stabilisation. Thus, it is
important to have an optimised fabricated pore structure for the purpose of graft stability and
the fabrication method is critical. This is further explored in the next section.
1.3 Conventional Fabrication Of Polyethylene (PE)-Based CMF Graft
Literature on the current fabrication of PE-based CMF grafts is limited. The only PE-based
CMF graft found in the literature is about the HDPE-sheet called MEDPOR™ [53].
MEDPOR™ comes in various thicknesses and sizes [29]. This HDPE-sheet is usually shaped
intraoperatively [54, 55]. No literature was found on how the HDPE-sheet was manufactured
or fabricated.
A literature search showed that there are two conventional ways that HDPE alloplastic are
fabricated. The conventional ways are computer numerical controlled (CNC) machining and
injection moulding. The CNC machining technique [56] uses a block of HDPE that is shaped
using a series of computer controlled cutting tools that are used to subtract material from the
bulk to fabricate an implant. This method creates waste and does not result in a porous graft; a
crucial characteristic for graft stabilisation. Injection moulding is a procedure to fabricate
HDPE alloplastic by extruding the material in the melted state and at high pressure into a
predesigned mould [57]. This method is disadvantageous as it requires excess material to create
an anatomical specific graft mould and does not allow the creation of a porous structure that is
important for a graft. Because of the limitations mentioned for both CNC machining and
injection moulding, it is important to explore alternative fabrication techniques that allow for
the control of fabricated pores and less waste. Thus, additive fabrication techniques are
explored in Section 1.4.
1.4 Additive Fabrication
Additive manufacturing is defined as a process of joining materials to make objects designed
using 3D CAD model data. The process involves selectively joining materials layer by layer

9
rather than by subtractive manufacturing [58]. This section discusses the introduction of binder
jetting printing, selective laser sintering (SLS), and materials selection for SLS
characterisation.
Binder Jetting Printing
Binder jetting printing is a selective fabrication method using a regular ink-jet print-head that
selectively uses binder to connect loose powders temporarily to form a fabricated part [59].
The binder jetting printing schematics is shown in Figure 1.5. Post-processing is required to
remove the binder and stabilise the connection permanently [60]. Water-based binders, such as
maltodextrin used to fabricate porous structure for binder jetting printing, also acts as a porogen
[61]. Depending on the hydrophilicity of the raw material, the binder may not necessarily bind
to the raw materials during fabrication and post-processing is required to ensure proper binding
of parts [61]. However, because of its hydrophobicity, a water-based binder is not suitable for
polyethylene [61]. The organic solvent used to remove porogens may leave some residual
solvent after post-processing and an additional step is then required to completely remove the
solvent, thus prolonging post-processing time [61]. In other literature, the use of chloroform as
a binder has shown that about 0.5 wt% (5000 ppm) residue was still left after post-processing
for a week [62]. Because of to the hydrophobicity of HDPE and the possible use of organic
solvent that may be toxic to human, binder jetting printing was not furthered explored.
Figure 1.5: Binder jetting printing schematics. A binder jetting printer uses binder in the
form droplets from the inkjet print head to create bonds at localised area at the powder
bed before a new recoating level is deposited. The binder deposition and recoating will
repeat as required by the designed part [33].

10
Selective Laser Sintering (SLS)
Selective laser sintering (SLS) is a level-by-level process that involves elevated temperatures,
with or without the use of additives, to selectively induce coalescence of polymer particles by
laser in a temperature- and gaseous-controlled environment [63]. An illustration of the SLS
process is shown in Figure 1.6. Typically, a closed environment is flushed with inert gases [64],
such as nitrogen to prevent oxidation of particles. Selective laser sintering can produce solid
parts without the addition of binders or additives if the energy required to sinter particles is
high enough to induce coalescence [65], or the material itself possesses very high light
absorbance properties.
Figure 1.6: Schematics of the SLS process. The energy from the focused laser beam will
selectively sinter the powder bed and a new recoating level will be added with the aid of
the roller. Sintering and recoating step be repeated as per the inputted CAD object [33].
The first feasibility study of sintering polyethylene (PE) was conducted with a customised laser
sintering platform to produce a single-level sintered part and was conducted in a non-controlled
temperature- and gaseous- environment [66]. Raw particle size affects the pore size, as smaller
raw particle size creates smaller pore size [67]. Also, smaller raw particle size resulted in higher
elastic modulus and ultimate tensile strength because of higher densification from sintering
[67]. Recoating thickness and sintered part uniformity are directly influenced by the raw
particle size. The recoating thickness needs to be at least thicker than the largest raw particle
size in order to provide sufficient thickness for a new recoating level to spread the particles
across the sintered platform and create a smooth surface for the next sintering step [67].
Sintering a complex part using PE was showed to be feasible; however, the mechanical

11
properties of the sintered implant was unsatisfactory and post-processing via heat-treatment
was needed to improve the tensile strength of the sintered part [68].
Fabricated PE has a high degree of part distortion during sintering if the temperature gradient
difference between the powder bed temperature and the raw material melting temperature is
too high [69]. A distorted part may cause part movement when a roller or blade passes over the
powder bed surface [69]. Increasing the laser scan count from one to two before recoating can
overcome this problem as the laser will repeat sintering twice on the same area before a new
recoating level is added [69]. This allows a gradual introduction of laser energy to each level,
resulting in less part distortion.
In addition, part position in the build platform affects the mechanical properties of the sintered
sample. When a sample is sintered in the middle of the build platform, it will have enough time
for phase stabilisation before a new level of powder is deposited. The sintered part should be
allowed to remain in the powder bed after final deposition of recoating level to gradually cool
the sample. This allows adequate time for molecular chain rearrangement, which will result in
better tensile properties [70].
The effect of energy density on the flexural strength of sintered PE was studied using a CO2
laser [71] at various laser outputs and laser scan speeds to process multi-level samples. The
study was conducted with four lower laser outputs of 6, 8, 10 and 12 W that produced energy
densities of 0.016, 0.021, 0.027 and 0.032 J/mm2 respectively. It was found that the laser energy
density of 0.027 J/mm2 resulted in the highest flexural strength [71]. Volumetric shrinkage
increases as the laser energy density increases from -33.0% for 0.016 J/mm2 to -61.5% for
0.032 J/mm2 [71] respectively. Factors such as materials, process parameters, sample
geometries and thermal inconsistencies contribute to volumetric changes. In order to prevent
the sintered part curling, pre-heating the powder was necessary to achieve a sample with
uniform build [71].
Increasing laser output whilst maintaining laser scanning speed and spot size, increases the
sintered height [72]. The sintering depth will increase together with laser output as the heat
induction and penetration will be greater [72]. In addition, particle size will also influence the
sintering height. As the particles increase in size, the sintering height will follow as well [72].

12
In summary, SLS possesses certain advantages compared to binder jetting printing. First, the
laser can selectively deliver localised energy to cause fusion between particles compared to
droplets of binder that formed temporary fusion between particles. This allows faster part
fabrication as no post-processing is required to stabilise the fusion between particles. Second,
the use of binders in the binder jetting process may be toxic to humans; even prolonged post-
processing may leave a minute amount of binder in the fabricated part, whereas, for SLS, there
might be toxicity issues that are associated with degradation of particles during sintering. Third,
as HDPE is the material that is explored in this research, HDPE fabrication with binder jetting
printing is not suitable because there is no suitable binder solution. Thus, HDPE fabrication
using SLS techniques is further explored. Understanding the properties that influence a material
for SLS allows for a better understanding of experimental design for HDPE fabrication. This
is further explored in Section 1.4.2.1.
1.4.2.1 The Effects Of Materials Properties On SLS
There are three main factors that influence the material used for SLS: particle morphology,
thermal properties and optical properties. These factors were grouped into either intrinsic or
extrinsic properties [36]. Intrinsic properties were attributed to the molecular structure of the
material itself and are not easily manipulated, while extrinsic properties are influenced by the
material’s pre-processed condition, such as raw material morphology, before laser sintering.
The intrinsic properties and extrinsic properties relationship is shown in Figure 1.7 [36].

13
Figure 1.7: Material factors that influence SLS [36]. The elements of characterisation
highlighted in green boxes are relevant to this thesis.
The ideal raw material particle morphology for SLS should be at least near spherical and have
a smooth surface to facilitate free flowing behaviour [36]. The sinter material particle size
distribution should be mostly of small particles, preferably between 20 μm and 80 μm, to induce
adhesion between particles and increases powder free flow behaviour [36]. Non-spherical raw
materials, such as cryogenic milled powders, are often unsuccessful in SLS processing [36]. In
other literature, reduced raw material particle size had an effect in increased reflectivity of the
powder bed and reduced laser power absorption [73]. The current known benefits of small
particle size are high packing density, increased surface smoothness, and ability to manufacture
detailed features [73]. Particle morphology can be characterised using optical microscopy [73].
Two-dimensional particle images were obtained and post-processed to give the measured
particle size distribution and shape.
Thermal analysis techniques were used to track physiochemical properties as a function of
temperature. Crystallisation, melting and decomposition temperatures can be determined by
thermal analysis. Thermal gravimetric analysis (TGA) measures the mass of sample as a
function of temperature and it is important to characterise the material stability at an elevated
temperature as, in SLS processes, the powder bed temperature is often raised [73]. Differential
scanning calorimetry (DSC) analysis is used to measure the differences in energy between a
sample and a reference material as a function of temperature. From DSC, the endothermic

14
(melting) and exothermic (crystallisation) reaction occurs upon heating and subsequent
cooling. The temperature range between the material’s crystallisation temperature, Tc, and its
melting temperature, Tm, shows the temperature sintering window [36, 69, 70] and a wide
temperature range between the melting and crystallisation is important. A typical DSC graph
is shown in Figure 1.8.
Figure 1.8: The metastable thermodynamic region between Tm and Tc which indicates the
temperature sintering window of a raw material [36].
Optical properties show the working range of laser energy absorbance of a raw material as a
function of wavelength. Material optical property is important to determine the suitable laser
wavelength to induce sintering. The laser wavelengths can be identified by the absorbance
peaks after undergoing optical spectrophotometer analysis. The lack of an absorbance peak of
a material to absorb localised energy delivered by laser requires an increased laser output [63].
This, in turn, will increase the energy expenditure required for fabrication.
In summary, it is important to identify a material’s particle morphology, thermal properties and
optical properties. In selective laser sintering, a material powder shape should be near spherical
to allow free flow characteristics for smooth recoating and a denser packing. This will allow
for a denser fabricated part. Second, the thermal properties of a material are important to create
a controlled temperature environment that utilises minimal energy for sintering and post-
processing. Lastly, the optical properties of a material will determine the choice of laser
selected for sintering and this is further explored in Section 1.4.2.2.

15
1.4.2.2 Choice Of Lasers For Selective Laser Sintering
An investigative study of 10.6 µm CO2 laser absorbance in high-density polyethylene (HDPE)
and commercial polyamide material showed that HDPE lacks an absorbance peak at 10.6 µm
and required an increased laser output to compensate for the lack of energy absorbed to sinter
HDPE [63]. Figure 1.9 shows the optical properties for both HDPE and commercial polyamide.
A 10.6 µm CO2 laser is well suited for sintering polymers as most polymers have high light
absorption [74] within the infrared range. A comparative study comparing CO2 laser and
Nd:YAG laser on hydroxyapatite-high density polyethylene (HA-HDPE) powder was
conducted to see how particle fusion was influenced by laser source and particle size [75] . It
was found that a large amount of particle fusion was observed for samples sintered by CO2
laser whereas Nd:YAG laser produced a large amount of coalesced particles [75]. Fusion is
defined as connective structures formed between solid raw material particles that receive
enough energy to melt into viscous liquid that flows into the void space between particles
forming sintered connections [76].
Figure 1.9: Optical properties for commercial polyamide and HDPE [63].
Single line energy density can be calculated based on the distribution of laser energy output
from a straight line and is defined by dividing laser output power by laser spot size or beam

16
diameter and laser scan speed. Specific energy was calculated as showed in Equation 1.1 [75,
77].
𝐄𝐝𝐞𝐧𝐬𝐢𝐭𝐲 = 𝐏𝐥𝐚𝐬𝐞𝐫
𝐕𝐬𝐜𝐚𝐧 ∗ 𝐃𝐥𝐚𝐬𝐞𝐫 Equation 1.1
Edensity = Single line energy density, J mm-2
Plaser = Laser power, W
Vscan = laser scanning speed, mm s-1
Dlaser = laser spot size, mm
In some cases, single line energy density was calculated by Equation 1.1 with the laser spot
size, Dlaser, substituted with scan spacing [77]. The illustration of laser scan spacing, laser spot
size or laser diameter together with laser scanning direction is shown in Figure 1.10 [75].
Figure 1.10: Illustration of laser scan spacing, laser spot size or laser diameter [75].
In summary, it is crucial to understand the optical properties of HDPE as SLS may utilise
specific wavelengths of the light source to deliver energy to a localised area. Furthermore, the
energy density delivered to the sintering surface should be sufficient to induce fusion between
HDPE particles. In this present research, the fabrication was conducted with a CO2 laser light
source in a non-controlled temperature. The CO2 laser light source was chosen as it induces a
large amount of particle fusion compared to a Nd:YAG laser. Particle fusion is important for a
stable fabricated part and CO2 laser is well suited for polymers. The next section will elaborate
the challenges of fabricating HDPE using SLS methods.

17
1.5 The Challenges In Fabrication Of High-Density Polyethylene (HDPE) Grafts
Feasibility studies of fabrication of HDPE for knee implants by selective laser sintering (SLS)
has been undertaken in the past [68]. High density polyethylene has been used clinically and
has been implanted at the cranial region [38, 41, 45]. However, the fabrication method of the
implant is not clearly mentioned. A quick online search has shown that there are four HDPE
allograft products being used clinically in the market place under the names of Medpor [78],
SYNPOR® [79], SU-POR® [80] and StarPore™ [81]. StarPore™ is the focus of this project
due to the trilobal particle morphology that produced an open pore trabecular structure similar
to the native bone when fabricated conventionally and it is a proprietary product of Anatomics
Pty. Ltd. Current conventional fabrication methods used to produce porous bone grafts from
StarPore™ are based on a compression moulding technique developed by Anatomics Pty. Ltd.
This method requires the production of single use customised moulds for each patient, resulting
in wastage of materials and additional cost.
The use of SLS is well established in medical applications as SLS does not require special
support structures to maintain the fabricated part during sintering. It is supported by the levels
of powder deposited at interval cycles and the unsintered powder can be removed or recycled
after the fabricated part is complete [82]. Hence, SLS may be an alternative method for
producing customised porous StarPore™ implants.
The current challenges for the fabrication of StarPore™ using SLS are the narrow temperature
sintering window of opportunity and particle morphology. Because of the proprietary
manufacturing method, the morphology of raw materials lacks the ideal spherical shape and
the particles are large. This project will focus on the understanding of StarPore™ fabrication
characteristics and development of sintering protocols to produce a reproducible fabrication
result. In order to overcome the challenges, the research aims were divided into three phases: -
1) powder characterisation, 2) establishment of a single-level fabrication methodology and 3)
establishment of a multi-level fabrication methodology.
18
1.6 Research Aims
The aim of this research was to establish a fabrication protocol for proprietary high-density
polyethylene, StarPore™. In order to achieve the research aim, the research was divided into
three phases. The first phase, powder characterisation, was conducted to give an understanding
on the intrinsic and extrinsic properties of StarPore™ powder, and to determine the challenges
that might be associated with it during fabricating a single-level sample. The second phase
involved characterising particle and physical changes qualitatively and quantitatively with
various fabricating strategies on a single-level fabrication, and then to proceed to mechanical
testing to characterise the properties of a fabricated single-level sample. The third phase
involved characterisation of a multi-level sample in order to determine which single-level
fabrication strategy was suitable. In addition, fabricated multi-level porosity and multi-level
mechanical properties were characterised. The details of each of the project phases are as
follow:
Phase 1: Powder Characterisation Phase
The purpose of this phase was to determine the morphological properties, thermal properties,
optical properties and the crystallinity phase of StarPore™ using the following steps:
• StarPore™ powder morphology was visualised under optical microscopy to determine
the particle shape and size.
• StarPore™ reflectance and transmission properties were characterised through optical
spectroscopy.
• StarPore™ sample purity and decomposition temperature were examined via
thermogravimetric analysis (TGA). Melting temperature and crystallisation
temperature were ascertained via differential scanning calorimetry (DSC).
• StarPore™ crystal phase examination was conducted via micro-CT to determine the
crystal phase changes for virgin and non-virgin powder.
The results and discussion of this phase are given in Chapter 1.
Phase 2: Establishment Of Single-Level Fabrication Methodology
The purpose of this phase was to determine the effect of different scanning strategies on a
single-level sintered part and to perform mechanical tests on the product as given in the
following steps:

19
• Sintered StarPore™ structural changes in terms of sintered height change (∆sH), and
sintered depth (sD) from the sintering bed surface were characterised quantitatively and
qualitatively. The quantitative characterisation is to give a picture of the structural
changes of the sintered single-level, and qualitative characterisation is to identify the
observable distinct particle changes throughout the sintering process. Once the
qualitative characterisation has been determined, the laser output sintering window can
then be determined.
• Single-level StarPore™ sintered with different laser spot size was used to determine
the structural and particle changes. This was conducted to determine the suitable
sintering focal distance from the lens which will result in the thinnest single-level
thickness.
• Dimensional changes were characterised for fabricated dogbones to design a dogbone
to determine a suitable hatch offset that was used in Phase 3. Also, dimensional changes
for heat-treated dogbones compared to the fabricated dogbones were characterised.
• To characterise and optimise mechanical properties for a single-level sintered sample.
The results and discussion of this phase are given in Chapter 3.
Phase 3: Establishment Of Multi-Level Fabrication Methodology
The purpose of this phase was to determine the effect of different fabrication strategies on a
multi-level platform, to perform mechanical tests, and to gauge the changes in porosity. The
experimental steps are given below.
• Multi-level StarPore™ sintered with various fabrication strategies such as scanning
schematics, scan spacing, laser output and introduction of compaction was investigated
and characterised to determine an overall thinnest sintered sample per sintered level.
• Multi-level StarPore™ pre- and post-heat-treated structural porosity was characterised
via structural porosity calculation and micro-CT analysis to determine the porosity
percentage resulting from fabrication and the changes after heat-treatment.
• Dimensional changes of the heat-treated samples compared to the fabricated samples
were characterised.
• To characterise and improve mechanical properties for a multi-level sintered sample
The results and discussion of this phase are given in Chapter 4.
The experimental phase summary is shown in Figure 1.11.
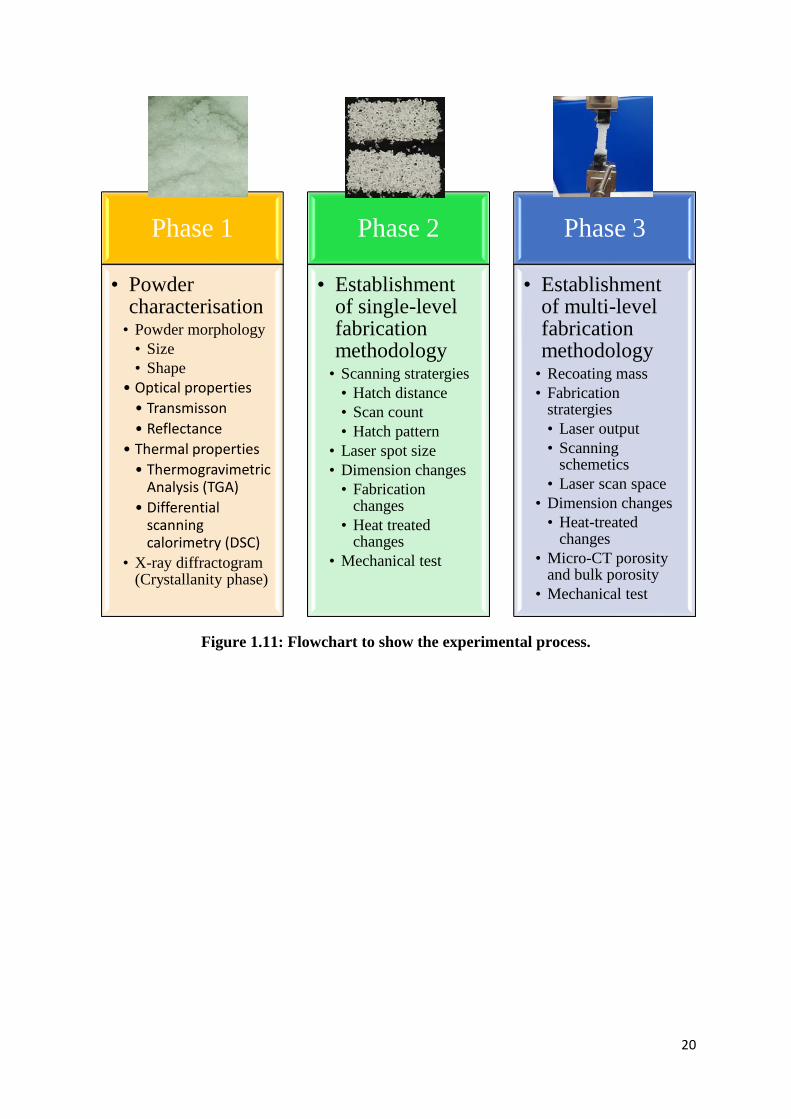
20
Figure 1.11: Flowchart to show the experimental process.
Phase 1
• Powder characterisation
• Powder morphology
• Size
• Shape
• Optical properties
• Transmisson
• Reflectance
• Thermal properties
• Thermogravimetric Analysis (TGA)
• Differential scanning calorimetry (DSC)
• X-ray diffractogram (Crystallanity phase)
Phase 2
• Establishment of single-level fabrication methodology
• Scanning stratergies
• Hatch distance
• Scan count
• Hatch pattern
• Laser spot size
• Dimension changes
• Fabrication changes
• Heat treated changes
• Mechanical test
Phase 3
• Establishment of multi-level fabrication methodology
• Recoating mass
• Fabrication stratergies
• Laser output
• Scanning schemetics
• Laser scan space
• Dimension changes
• Heat-treated changes
• Micro-CT porosity and bulk porosity
• Mechanical test

21
2 Chapter 2: Powder Characterisation
It has been identified from the literature review in Chapter 1, that high-density polyethylene
(HDPE) has two limitations. These two limitations are a narrow temperature sintering window
and non-ideal particle morphology. The significance of these limitations is twofold. Firstly, a
narrow temperature sintering window is disadvantageous because excessive energy applied
outside of this temperature window may lead to warping or distortion of the sintered powder
layer, and secondly, selective laser sintering platforms typically require a spherical particle
morphology in order to have control over the sintering processes. However, in this present
research the StarPore™ has a distinct trilobal shape in order to produce an open trabecular
structure that mimics the bone structure. As this material differs from commonly employed
powders it was essential to gather an understanding of raw particle structural changes under
different processing parameters and then to determine the effect of particle and physical
changes on the proposed selective sintering process. Finally, it was necessary to develop
strategies to accommodate particle changes during controlled multi-level sintering of
proprietary HDPE, StarPore™.
Understanding the physical characteristics of StarPore™ in terms of morphology, thermal
properties and optical properties was important to determine its inherent processing limitations
and to develop possible ways to overcome the limitations. Section 2.1 focuses on the
characterisation methods for StarPore™ in terms of morphology, optical properties, thermal
properties and crystal phases. Section 2.2 focuses on the results of these characterisation studies
which will be used to determine suitable fabrication strategy parameters discussed in Chapter
3.
2.1 Materials And Methods
StarPore™ particles prepared via an automated extrusion and pelletising process, were
supplied by Anatomics (Australia) Pty. Ltd. as produced. The material was used as provided,
with no additional pre-processing or treatment performed prior to characterisation and
experimental use. The supplied StarPore™ particles were imaged using optical microscopy to
characterise the particles morphology individually and in bulk (Section 2.2.1) and the optical
characteristics for StarPore™ were examined for a range of wavelengths in various bulk sample
thicknesses to represent the powder bulk depth from the sintering surface (Section 2.1.2). The

22
thermal properties of StarPore™ were later examined to determine the material purity,
decomposition temperature and temperature sintering window (Section 2.1.3) and, lastly, the
powder crystallinity was examined for virgin and non-virgin StarPore™ powders (Section
2.1.4).
The illustration of the overall experimental step discussed in Chapter 2 is shown in Figure 2.1.
Figure 2.1: Illustration of the experimental steps conducted for StarPore™ powder
characterisation.

23
StarPore™ Morphology
To perform an assessment of the supplied powder particle morphology, thirty particles were
chosen at random from the bulk supply for inspection and measurement via 2D microscopy.
Microscope images were captured via a Leica M205A (Leica, Germany). Sample particles
were arranged and securely mounted between two standard 1.0 mm thick glass microscope
slides (25 mm x 75 mm) to prevent movement or deformation during imaging, as shown in
Figure 2.2.
Figure 2.2: Thirty randomly selected StarPore™ particles mounted between two glass
slides, for inspection by optical microscopy.
StarPore™ Optical Properties
Optical characteristics of bulk powder volumes with graduated thicknesses (1.0, 1.3, 2.9, 4.5,
5.6 and 8.0 mm) were examined with a UV-3600 UV-VIS-NIR spectrophotometer (Shimadzu,
Japan). Thickness increments were based on available acrylic sheeting. The intent of examining
graduated powder thicknesses was to provide insight into the effect that this would have on
light reflectance from the bulk surface and light transmission through the relatively large voids
between particles.
Experiments were conducted over a wavelength range of 350 nm to 2000 nm. Barium sulphate,
BaSO4, was used as a reflectance standard because of its high reflectance rate of approximately
99% [83]. Optical properties of HDPE from wavenumbers 6.0 µm to 25.0 µm have been
reported in the literature [63]. Wavenumber is a reciprocal of wavelength. Thus, in this research
a lower wavelength than 6.0 µm was studied. The wavenumbers are from 28,571 cm-1
(wavelength: 350 nm) to 5,000 cm-1 (wavelength: 2000 nm).

24
Variable thickness sample holders were built from laser-cut acrylic sheets of known thickness,
with a Ø 20 mm hole cut from the mid-section to serve as a chamber to hold the raw StarPore™
powder. These laser-cut sheets were then individually packed with the sample powder and
sealed using two glass slides with a tape as showed in Figure 2.3.
Figure 2.3: Controlled thickness sample holder arrangement for use in light reflectance
studies.
StarPore™ Thermal Properties
Thermogravimetric analysis (TGA) was conducted with a TGA Q500 instrument (TA
Instruments, Delaware, USA) to identify the decomposition temperature onset of StarPore™
and sample purity of supplied StarPore™ material. Thermogravimetric analysis was conducted
with temperature increment rate of 10 °C/min under a nitrogen atmosphere, over a temperature
range from room temperature to 650 °C. The onset of decomposition temperature was
determined by the intersection of stable weight gradient and rapid weight loss gradient. Three
TGA samples were used. The purpose of TGA was to determine the highest temperature that
can be applied in the selective laser sintering (SLS) chamber during sintering process.
Differential scanning calorimetry analysis (DSC) was conducted with a DSC Q100 (TA
Instruments, Delaware, USA) to determine the temperature sintering window of StarPore™
from the difference between crystallisation temperature, Tc, and melting temperature, Tm.
Differential scanning calorimetry was conducted with temperature increment rate of 10 °C/min
over a temperature range of 30 °C to 250 °C. Three DSC samples were used. The crystallisation
temperature, Tc, and melting temperature, Tm, range was used to determine the suitable
temperature conditions for sintering StarPore™ and to post-process the sintered part.

25
In this research, the fabrication was conducted on a customised sintering platform under an
ambient temperature environment. Different fabrication strategies were employed to
characterise the change to StarPore™ particles and physical structure. The temperature range
of crystallisation temperature, Tc, and melting temperature, Tm, was used during post-
processing of fabricated parts to enhance their mechanical strength.
StarPore™ Crystallinity
X-ray powder diffraction (XRD) was conducted with an MMA XRD analyser (GBC Scientific
Equipment, VIC, Australia) to determine the crystallinity of StarPore™ powder samples as
provided, and also for samples of StarPore™ powder that had gone through sintering cycles
(for discussion in later sections on processing and construct fabrication). The crystallinity was
expressed in arbitrary unit against 2 theta (2θ). The XRD scan angle was conducted from 10°
to 60° with increments of 2° per minute.
In this thesis, virgin powder refers to fresh unused power free from any heat exposure that had
not been used before for sintering, while non-virgin powder refers to recycled powder that had
gone through sintering cycles and was recycled for sintering purposes. Non-virgin powder was
assumed to have been exposed to elevated temperatures during previous sintering cycles.
During the sintering process, thermal exposure may have changed the crystal phase of the non-
virgin powder. Understanding the intensity peaks may give some idea about the limit of the
recyclability of the StarPore™ powder. The characterisation of crystal phases of the virgin and
non-virgin powder is the focus of the research. The recyclability limit is outside the scope of
this research and should be examined in the future.
Figure 2.4 shows the collection of non-virgin powder from the custom sintering platform. The
sintering platform designed volume was 55 mm × 55 mm × 20 mm. The fabricated sample size
was 20 mm × 20 mm and the thickness varied based on laser output parameters. After
fabricating a sample, the sample was removed from the sintering platform. The platform was
then topped-up with fresh virgin powder, thoroughly mixed and excess removed with a flat
blade to level the sintering platform for the next sample fabrication. A calculation was
conducted to estimate the ratio of the top-up virgin powder to the non-virgin powder, the top-

26
up virgin powder for the sintered depth was assumed to be 1.1 mm based on the average
sintered depth from laser output 14 W to 30 W (Figure 3.9). Hence, volume of virgin powder
and non-virgin powder was about 440 mm3 and 60,060 mm3 and the ratio volume of virgin to
non-virgin powder was 1:137.
Figure 2.4: Sample production cycle where StarPoreTM powder was exposed to heat (red
box) and the ratio of virgin and non-virgin mix was calculated based on the assumed filled
sintered depth of 1.1 mm (green box).
2.2 Results And Discussion
StarPore™ particle morphology was studied to understand the physical appearance of the
particles during resting on the sintering bed and how increasing laser output affects the particle
and physical changes. This is further elaborated in Section 2.2.1.
The efficiency of light being transmitted and reflected at a set of wavelengths to determine the
energy absorbed at different sintering bed depth (thickness) is described in Section 2.2.2.
The gap between melting (Tm) temperature and crystallisation (Tc) temperature is the operating
temperature range. It is crucial to know the range of temperature that can be utilised to post-

27
process the fabricated material without resulting in excessive structural changes. Furthermore,
understanding the decomposition curve of the material provides important information on
StarPore™ material purity. The operating temperature and material purity are elaborated on in
Section 2.2.3.
The crystal phases for virgin and non-virgin StarPore™ were characterised to give an early
understanding of the quality of StarPore™ particles used. Virgin StarPore™ exposed to
irradiated temperature and recycled for the next sintering process, may had reduce the sintered
efficacy due to the change in crystal phases. The characterisation of crystal phases was
elaborate Section 2.2.4.
StarPore™ Morphology
Optical microscope analysis revealed the irregular trilobal particle morphology of StarPore™,
a key feature of this product. The trilobal particle morphology produced an open porous
trabecular structure resembling that of native bone conventionally fabricated via the moulding
process. A subset of six raw particles were measured from the larger sample set of thirty
particles as the orientation of the remaining particles prevented clear observation of their lobal
structures. Another subset of six particles was chosen for particle thickness. Nominal measured
diameter and lobal widths over the small sample subset were 892±30 µm and 226±32 µm
respectively. One of the characterised particles is shown in Figure 2.5. The thickness of the
particles was 522±110 µm and is shown in Figure 2.6. These morphological properties of
StarPore™ contrast dramatically with the morphologies of sintering polymers polyethylene
[63, 66, 69, 71] and polyamide-12 [63, 84, 85], commonly reported in the literature as being
spherical in nature with particle diameters of between 100 µm and 150 µm.
Lobal width Lobal radius
Figure 2.5: Example of optical microscopy of StarPore™ particle showed that the shape
is trilobal.
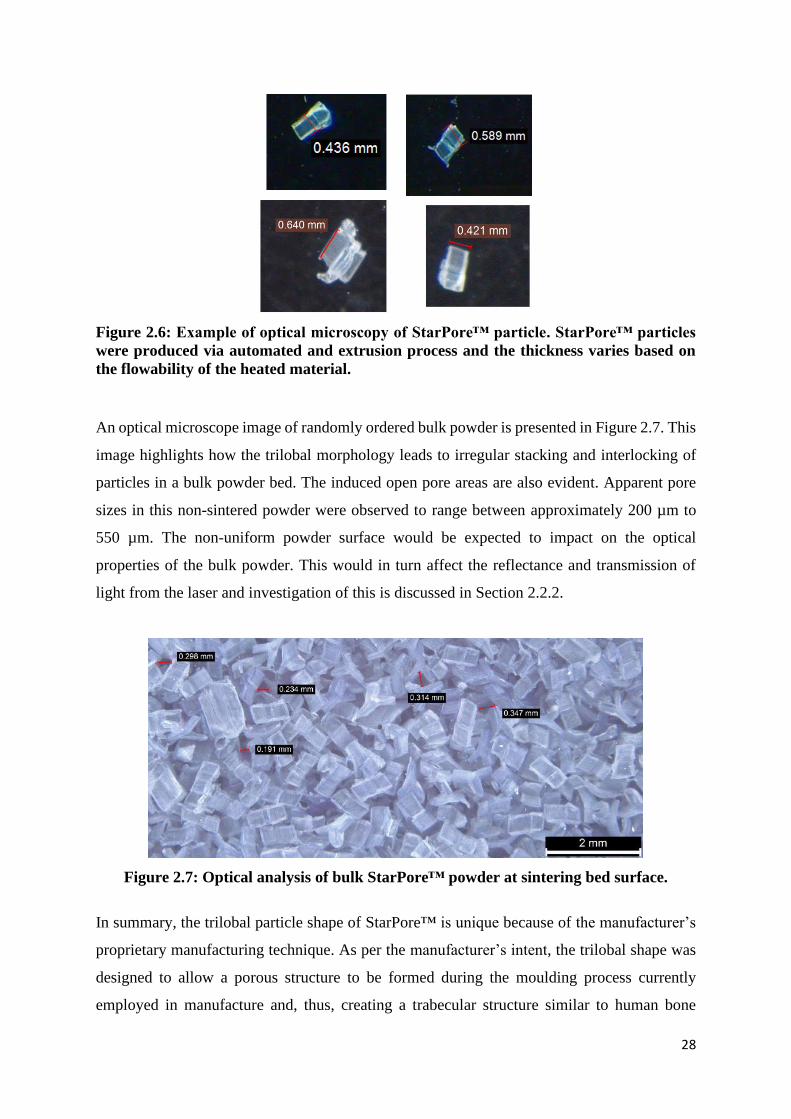
28
Figure 2.6: Example of optical microscopy of StarPore™ particle. StarPore™ particles
were produced via automated and extrusion process and the thickness varies based on
the flowability of the heated material.
An optical microscope image of randomly ordered bulk powder is presented in Figure 2.7. This
image highlights how the trilobal morphology leads to irregular stacking and interlocking of
particles in a bulk powder bed. The induced open pore areas are also evident. Apparent pore
sizes in this non-sintered powder were observed to range between approximately 200 µm to
550 µm. The non-uniform powder surface would be expected to impact on the optical
properties of the bulk powder. This would in turn affect the reflectance and transmission of
light from the laser and investigation of this is discussed in Section 2.2.2.
Figure 2.7: Optical analysis of bulk StarPore™ powder at sintering bed surface.
In summary, the trilobal particle shape of StarPore™ is unique because of the manufacturer’s
proprietary manufacturing technique. As per the manufacturer’s intent, the trilobal shape was
designed to allow a porous structure to be formed during the moulding process currently
employed in manufacture and, thus, creating a trabecular structure similar to human bone

29
trabecular structure. However, the trilobal shape of StarPore™ particle may pose some
challenges during the fabricating process. The trilobal shape prevents the particle free flow
behaviour that allows smooth recoating process and higher packing density. Optical analysis
on bulk StarPore™ shows that the trilobal shape also creates large gaps between particles at
rest. The large particle size also contributes to the gaps between the particles. This would be
expected to have an impact on optical reflectance and transmission properties and is discussed
in the following section.
Powder Optical Properties
Prepared samples were examined to quantify the StarPore™ materials reflectance in
comparison to a highly reflective standard. Figure 2.8 presents reflectance data over six packed
sample thicknesses between 1.0 mm and 8.0 mm. The captured data clearly show that measured
percentage reflectance increases with increased sample thickness; from approximately 60% for
sample thickness of 1.0 mm to as high as 90% for sample thickness of 8.0 mm. The increase in
reflectance percentage could be due to the compounding effect of raw StarPore™ reflectance
because of gaps at the surface that allows light to travel between the gaps to be reflected by the
raw StarPore™ below the surface. In addition, the light could be scattered during the
experiment in response to particle morphology, and the scattering increases as the sample
thickness increases.
Figure 2.8: StarPore™ reflectance increases as the sample thickness (or free structure
depth) increases.
0102030405060708090
100
350 450 550 650 750 850 950 1050 1150 1250 1350 1450 1550 1650 1750 1850 1950
Re
fle
ctan
ce (
%)
Wavelength (nm)
Reflectance vs Wavelength
1.0mm 1.3mm 2.9mm 4.5mm 5.6mm 8.0mm
1.0mm
8.0mm
Increasing thickness

30
The opposite was seen for the transmission curve in Figure 2.9, where the transmission reduces
from approximately 30% for sample thickness of 1.0 mm to less than 5% for sample thickness
5.6 mm. Other subsequent samples are not shown as they had a similar trend to sample
thickness 5.6 mm. This showed that the 1.0 mm thickness of the bulk sample was insufficient
to prevent light transmission through the surface exposed to the light source. This is due to the
large particles size that created large gaps in between the particles. The large gaps allowed light
to pass through and transmit to the subsequent gaps below the surface. It took about 5.6 mm
thickness to reduce the transmission to 5%. And this clearly showed that irradiated heat from
a laser may penetrate the sintering bed by 5.6 mm.
Figure 2.9: StarPore™ transmission decreases as the sample thickness (or free structure
depth) increases.
In summary, the large StarPore™ particle size and shape allowed light to be transmitted
through the gaps between the particles at the surface to the particles below. This may have an
effect on light been scattered through the bulk and reduce the energy delivered to the localised
surface area. The light transmission through the bulk was also limited by the large particle size
and shape and a depth of 5.6 mm was needed to reduce light transmission through the powder
bulk by 5%. The light transmission reduces, and reflectance increases when the overall bulk
thickness is increased. Because of the high light reflectance (~60%) and transmission (~30%)
for 1.0 mm thickness, an increase of laser output energy was required to induce fusion between
StarPore™ particles [63, 36]. This will be further explored in Chapter 3 with various laser
outputs for each fabrication strategies.
-505
101520253035
350 450 550 650 750 850 950 1050 1150 1250 1350 1450 1550 1650 1750 1850 1950
Tran
smis
sio
n (
%)
wavelength (nm)
Transmission vs Wavelength
1.0mm 1.3mm 2.9mm 4.5mm 5.6mm
Increasing thickness
1.0 mm
5.6mm

31
Powder Thermal Properties
Thermogravimetric analyses (TGA) of the three samples are showed in Figure 2.10 and the
average TGA is showed in Figure 2.11. The three StarPore™ decomposition curves showed a
single-phase decomposition which suggests the material was made of pure high-density
polyethylene (HDPE). A derivative thermogravimetry (DTG) was calculated from the TGA
curve to show that the decomposition occurs almost totally in one step (Figure 2.11). The
measured weights for the three TGA samples were 10.7 mg, 9.3 mg and 10.8 mg. The onset of
decomposition starts when the temperature reaches approximately 423±7 °C (Figure 2.11).
This showed that StarPore™ remained relatively stable until reaching the decomposition onset
temperature. A literature review of the HDPE decomposition temperature range was found to
be 390 °C to 490 °C [86]. This supported the decomposition temperature of StarPore™ as it
falls in this range.
Figure 2.10: The TGA for three StarPore™ samples.
0%
20%
40%
60%
80%
100%
120%
0 100 200 300 400 500 600 700
Wei
ght
Rem
ain
ing
(%)
Temperature (°C)
TGA: StarPore™
StarPore™ TGA 1
StarPore™ TGA 2
StarPore™ TGA 3

32
Figure 2.11: The average decomposition temperature onset of StarPore™ calculated at
423±7 °C and the StarPore™ DTG curve show that the decomposition occurs almost at
one step.
Digital scanning calorimetry (DSC) analysis of the three samples is shown in Figure 2.12 and
the average crystallisation and melting temperatures were approximately 117±0.6 °C and
130±1.5 °C respectively. The measured weights for the three DSC samples were 4.0 mg, 5.0
mg and 5.0 mg. The average StarPore™ heat flow cycle is shown in Figure 2.13. According to
MatWeb material property data, the HDPE melting temperature range is 118 °C to 137 °C and
crystallisation temperature range is 108 °C to 120 °C [87], this supported the melting and
crystallisation temperature of StarPore™. StarPore™ possessed a very narrow temperature
sintering window of approximately 13 °C. A commercial polyamide DSC was conducted as
well and the crystallisation and melting temperature are at 154 °C and 186 °C respectively
(Figure 2.13). A literature review showed that the crystallisation and melting temperatures for
commercial polyamide are 143 °C and 184 °C respectively [88], indicating a substantially
larger working window of approximately 40 °C. In general, a wider sintering process window
allows for greater flexibility in applied energy, more controlled cooling and solidification, and,
in turn, a reduced potential for deformation or warping of the sintered layer [36].
-0.20
-0.15
-0.10
-0.05
0.00
0.05
0.10
0
0.2
0.4
0.6
0.8
1
1.2
0 100 200 300 400 500 600
Der
ivat
ive
Wei
ght
Loss
(%
/min
)
Wei
ght
Rem
ain
ing
(%)
Temperature (°C)
Average StarPore™ TGA and DTG
x = 423±7°Cy = 98.9±0.3%
DTG
TGA

33
Figure 2.12: The DSC for three StarPore™ samples.
Figure 2.13: DSC analysis showed StarPore™ possesses a narrow temperature sintering
window compared to commercial polyamine.
In summary, the single-phase TGA curve for StarPore™ showed the material was
manufactured with pure HDPE and the decomposition temperature was approximately 423±7
°C. The melting temperature for StarPore™ is 130±1.5 °C and the crystallisation temperature
is 117±0.6 °C, showed that the fabricated StarPore™ has a very narrow sintering temperature
range. This narrow range thus had to be considered for the development of fabrication strategies
presented and explored in Chapter 3.
-30
-20
-10
0
10
20
30
0 50 100 150 200 250 300
Hea
t Fl
ow
(m
W)
Temperature (°C)
DSC: StarPore™
StarPore™ DSC 1StarPore™ DSC 2StarPore™ DSC 3
-30
-20
-10
0
10
20
30
0 50 100 150 200 250 300
Hea
t Fl
ow
(m
W)
Temperature (°C)
Average StarPore™ DSC and Commercial Polyamide
Average StarPore™ DSC
Commercial polyamide130±1.5°C
StarPore™ sintering window
Commercial polyamide sintering window
117±0.6°C
154°C
186°C

34
Powder Crystal Phase
Figure 2.14 shows the XRD analysis of StarPore™ virgin and non-virgin powder. Two major
peaks at 21.5° and 24.0° were observed and are consistent with HDPE peaks reported in other
literature [63, 89, 90]. The peak intensity for 21.5° reduces from 9959 a.u. (virgin StarPore™)
to 9122 a.u. (non-virgin StarPore™). While peak intensity for 24.0° reduced from 2944 a.u. to
2777 a.u. for raw and recycled StarPore™ respectively. In addition, both the peaks at 21.5° and
24.0° could be of orthorhombic phase 110 and 200 [63]. Also, a crystal phase 020 at 36.2° was
observed for both samples [89]. Trace amount of amorphous monoclinic 001 was observed at
19.5° [91, 92] for virgin sample only.
Figure 2.14: XRD analysis for both samples. The crystal phases 110, 200 and 020 can be
seen for both the samples at 21.5°, 24.0° and 36.2° [89] except 001 which exists only for
virgin StarPore™.
In conclusion, both virgin and non-virgin samples showed similar peaks for crystal phases at
21.5°, 24.0° and 36.2°, with the intensity peaks for non-virgin samples lower than for virgin
samples by -8% and -6% for 21.5° and 24.0° respectively. This suggests that the recycled
StarPore™ powder may have reduced sintering efficacy as it was reused. The crystal phases
for virgin and non-virgin StarPore™ will be studied in the future.
0
2000
4000
6000
8000
10000
12000
10 15 20 25 30 35 40 45 50 55 60
Inte
nsi
ty (
a.u
. -ar
bit
aty
un
it)
2θ (°)
XRD: StarPore™ Virgin, Non-virgin
Virgin StarPore™ (fresh powder)
Non-virgin StarPore™ (recycled powder)
200
020
110
001
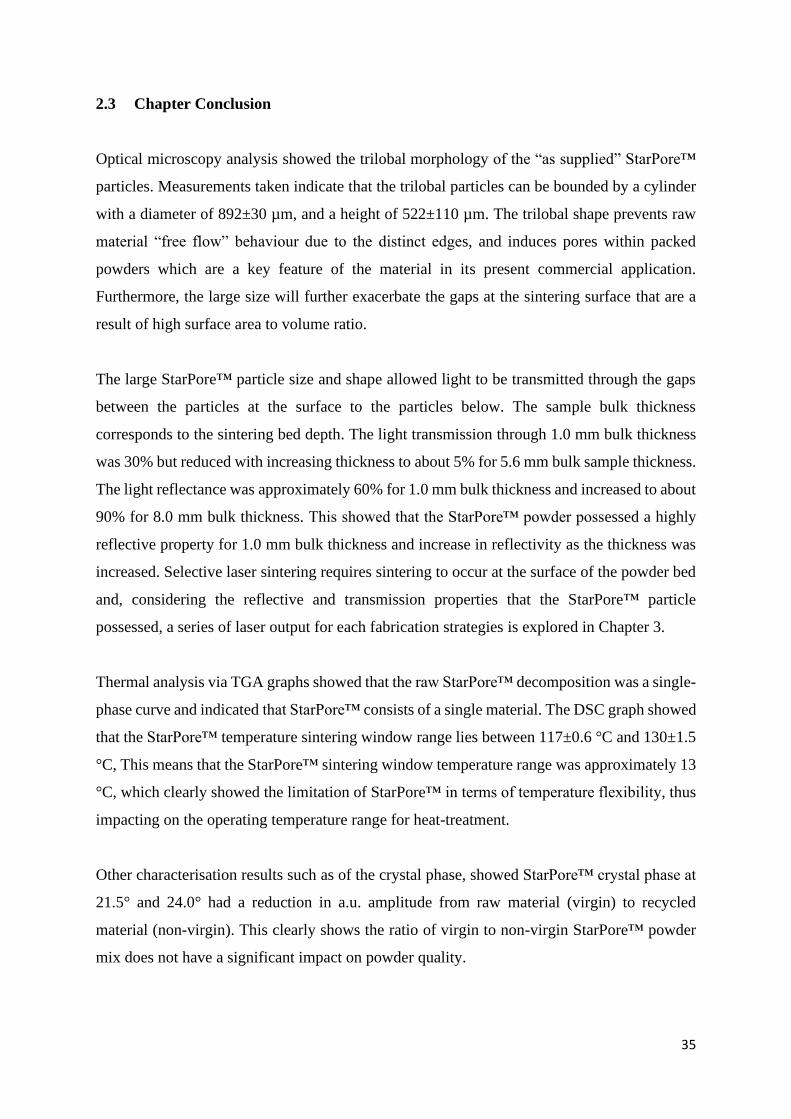
35
2.3 Chapter Conclusion
Optical microscopy analysis showed the trilobal morphology of the “as supplied” StarPore™
particles. Measurements taken indicate that the trilobal particles can be bounded by a cylinder
with a diameter of 892±30 µm, and a height of 522±110 µm. The trilobal shape prevents raw
material “free flow” behaviour due to the distinct edges, and induces pores within packed
powders which are a key feature of the material in its present commercial application.
Furthermore, the large size will further exacerbate the gaps at the sintering surface that are a
result of high surface area to volume ratio.
The large StarPore™ particle size and shape allowed light to be transmitted through the gaps
between the particles at the surface to the particles below. The sample bulk thickness
corresponds to the sintering bed depth. The light transmission through 1.0 mm bulk thickness
was 30% but reduced with increasing thickness to about 5% for 5.6 mm bulk sample thickness.
The light reflectance was approximately 60% for 1.0 mm bulk thickness and increased to about
90% for 8.0 mm bulk thickness. This showed that the StarPore™ powder possessed a highly
reflective property for 1.0 mm bulk thickness and increase in reflectivity as the thickness was
increased. Selective laser sintering requires sintering to occur at the surface of the powder bed
and, considering the reflective and transmission properties that the StarPore™ particle
possessed, a series of laser output for each fabrication strategies is explored in Chapter 3.
Thermal analysis via TGA graphs showed that the raw StarPore™ decomposition was a single-
phase curve and indicated that StarPore™ consists of a single material. The DSC graph showed
that the StarPore™ temperature sintering window range lies between 117±0.6 °C and 130±1.5
°C, This means that the StarPore™ sintering window temperature range was approximately 13
°C, which clearly showed the limitation of StarPore™ in terms of temperature flexibility, thus
impacting on the operating temperature range for heat-treatment.
Other characterisation results such as of the crystal phase, showed StarPore™ crystal phase at
21.5° and 24.0° had a reduction in a.u. amplitude from raw material (virgin) to recycled
material (non-virgin). This clearly shows the ratio of virgin to non-virgin StarPore™ powder
mix does not have a significant impact on powder quality.

36
From the above findings, it was considered that the one major limitation of StarPore™ was a
narrow temperature sintering window, while particle morphology may not be a limitation as it
is a unique feature that allows for producing open trabecular structures similar to that of bone.
The material characterisation data is discussed in the following Chapter 3 that examines the
effect of different fabrication strategies on single-layer powder bed sintering to determine
suitable fabrication strategies before progressing to multi-level fabrication studies in Chapter
4.
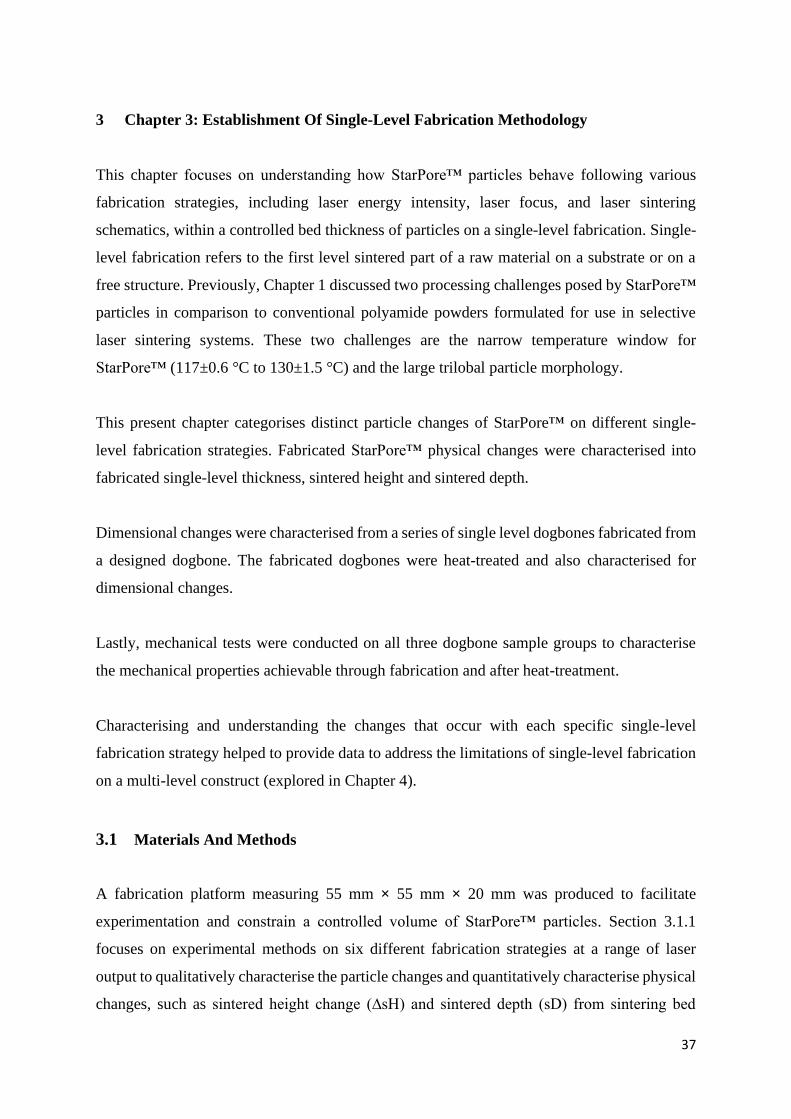
37
3 Chapter 3: Establishment Of Single-Level Fabrication Methodology
This chapter focuses on understanding how StarPore™ particles behave following various
fabrication strategies, including laser energy intensity, laser focus, and laser sintering
schematics, within a controlled bed thickness of particles on a single-level fabrication. Single-
level fabrication refers to the first level sintered part of a raw material on a substrate or on a
free structure. Previously, Chapter 1 discussed two processing challenges posed by StarPore™
particles in comparison to conventional polyamide powders formulated for use in selective
laser sintering systems. These two challenges are the narrow temperature window for
StarPore™ (117±0.6 °C to 130±1.5 °C) and the large trilobal particle morphology.
This present chapter categorises distinct particle changes of StarPore™ on different single-
level fabrication strategies. Fabricated StarPore™ physical changes were characterised into
fabricated single-level thickness, sintered height and sintered depth.
Dimensional changes were characterised from a series of single level dogbones fabricated from
a designed dogbone. The fabricated dogbones were heat-treated and also characterised for
dimensional changes.
Lastly, mechanical tests were conducted on all three dogbone sample groups to characterise
the mechanical properties achievable through fabrication and after heat-treatment.
Characterising and understanding the changes that occur with each specific single-level
fabrication strategy helped to provide data to address the limitations of single-level fabrication
on a multi-level construct (explored in Chapter 4).
3.1 Materials And Methods
A fabrication platform measuring 55 mm × 55 mm × 20 mm was produced to facilitate
experimentation and constrain a controlled volume of StarPore™ particles. Section 3.1.1
focuses on experimental methods on six different fabrication strategies at a range of laser
output to qualitatively characterise the particle changes and quantitatively characterise physical
changes, such as sintered height change (∆sH) and sintered depth (sD) from sintering bed

38
surface and overall fabricated single-level thickness, after fabrication. Single-layer thickness is
the total thickness of the sintered height change (∆sH) and sintered depth (sD) measured. Figure
3.1 shows the structural changes, such as sintered height change (∆sH) and sintered depth (sD)
from sintering bed surface and overall fabricated single-level thickness, during sintering.
Section 3.1.2 focuses on fabrication with different laser spot sizes and particle and physical
changes were categorised in the same manner as described in Section 3.1.1. Section 3.1.3
focuses on the fabricated accuracy from the fabricated dogbone to the designed dogbone and
Section 3.1.4 focuses on the dimensional changes of heat-treated dogbone and the fabricated
dogbone in Section 3.1.3. Section 3.1.5 focuses on the mechanical properties of the fabricated,
120°C and 130°C heat treated dogbone sample groups.
Figure 3.1: Showing the sintered height change (∆sH) and sintered depth (sD) that occurs
during sintering. The single-level total thickness is the combination of measured sintered
height (∆sH) and sintered depth (sD).
The illustration of the overall experimental step described in Chapter 3 is shown in Figure 3.2.

39
Figure 3.2: The illustration of the experimental steps conducted for single-level
fabrication.
Single-Level Fabrication Strategies
A commercial laser cutting platform equipped with a 10.6 µm CO2 laser (Universal Laser
Systems, USA) was employed to provide laser energy and control X, Y positioning of the
focused laser beam. A beam focus tool was used as per the manufacturer’s instructions to set
the distance between the laser outlet lens and the top surface of the powder bed. This distance
(50.8 mm) was set as per the manufacturer’s instructions [93] to achieve a laser spot size of
130 µm at the top surface of the powder bed and focus depth of ±2.5 mm. The commercial
laser cutting platforms afforded control over laser output energy (W), laser spot size (mm) and

40
scan space (mm). Laser output energy (W) is the energy intensity delivered, laser spot size
(mm) is the laser beam diameter size on the surface, and scan space (mm) refers to the distance
between two rastering lines that are arranged parallel to each other. Figure 3.3 shows the build
platform for single-level investigation.
Figure 3.3: Sintering bed platform is positioned right below the laser source within the
laser cutter chamber.
Fabrication was conducted with the laser output in the range from 2 W to 30 W with increments
of 2 W. Laser scan speed was set to approximately 20% of the maximum laser vector speed of
500 mm/s (a theoretical calculation for the maximum laser scan speed at 100% was about 500
mm/s). The laser scan speed at 20%, which was about 100 mm/s, was selected after trial and
error. Laser scan speed at 500 mm/s did not result in any sintered part at that speed and the
speed was subsequently reduced to 100 mm/s where an apparent sintered part was achieved.
Pulse per inch (PPI) was set to 1000. Setting PPI to the maximum of 1000 pulses per inch
meant the laser was pulsing 1000 times per linear inch of travel and closely resembles a
continuous laser output. The sintering was conducted in a lab-controlled environment at 22 °C
and 45% humidity
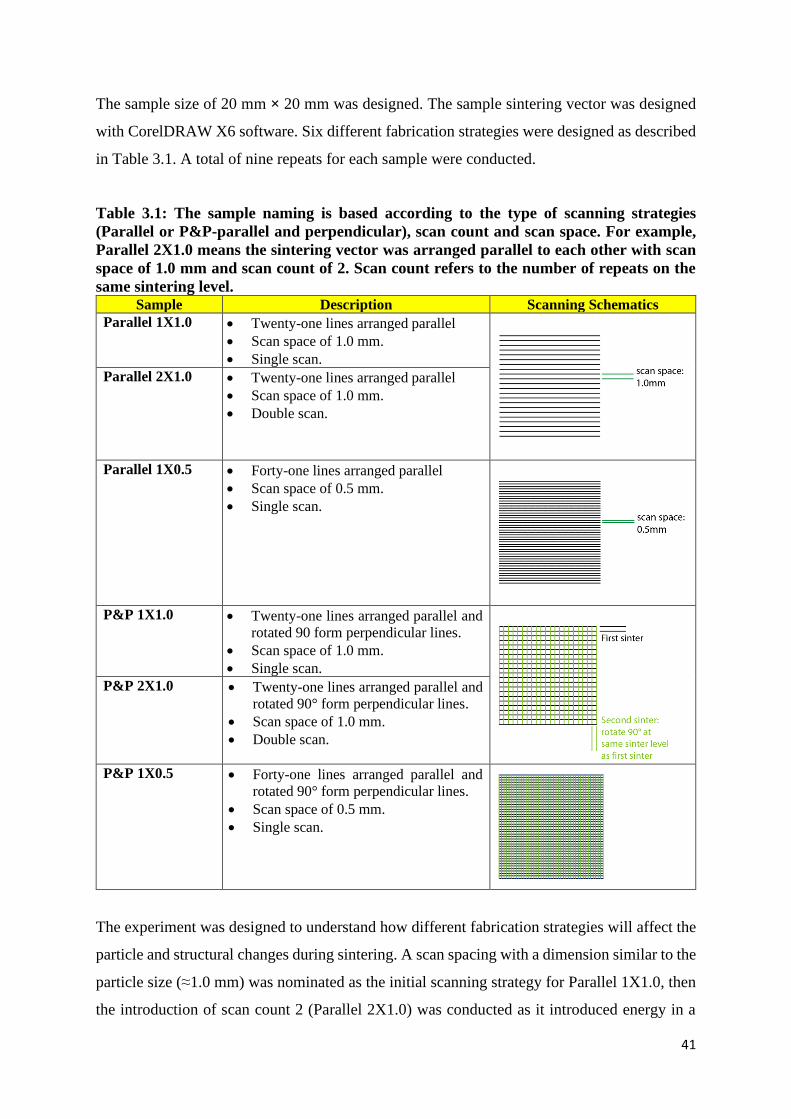
41
The sample size of 20 mm × 20 mm was designed. The sample sintering vector was designed
with CorelDRAW X6 software. Six different fabrication strategies were designed as described
in Table 3.1. A total of nine repeats for each sample were conducted.
Table 3.1: The sample naming is based according to the type of scanning strategies
(Parallel or P&P-parallel and perpendicular), scan count and scan space. For example,
Parallel 2X1.0 means the sintering vector was arranged parallel to each other with scan
space of 1.0 mm and scan count of 2. Scan count refers to the number of repeats on the
same sintering level. Sample Description Scanning Schematics
Parallel 1X1.0 • Twenty-one lines arranged parallel
• Scan space of 1.0 mm.
• Single scan.
Parallel 2X1.0 • Twenty-one lines arranged parallel
• Scan space of 1.0 mm.
• Double scan.
Parallel 1X0.5 • Forty-one lines arranged parallel
• Scan space of 0.5 mm.
• Single scan.
P&P 1X1.0 • Twenty-one lines arranged parallel and
rotated 90 form perpendicular lines.
• Scan space of 1.0 mm.
• Single scan.
P&P 2X1.0 • Twenty-one lines arranged parallel and
rotated 90° form perpendicular lines.
• Scan space of 1.0 mm.
• Double scan.
P&P 1X0.5 • Forty-one lines arranged parallel and
rotated 90° form perpendicular lines.
• Scan space of 0.5 mm.
• Single scan.
The experiment was designed to understand how different fabrication strategies will affect the
particle and structural changes during sintering. A scan spacing with a dimension similar to the
particle size (≈1.0 mm) was nominated as the initial scanning strategy for Parallel 1X1.0, then
the introduction of scan count 2 (Parallel 2X1.0) was conducted as it introduced energy in a

42
gradual manner to the earlier sintered part resulting in greater definition. Next, reducing scan
space to 0.5 mm (Parallel 1X0.5), was conducted as a comparison to sample Parallel 2X1.0
because the energy delivered by both samples is twice as much as sample Parallel 1X1.0.
However, the energy delivered to sample Parallel 1X0.5 was directly on a non-sintered raw
particle surface, whereas sample Parallel 2X1.0 was sintered twice, with the second sintering
repeated on the same hatching lines on the earlier sintered part. Lastly, the experiment was
repeated with P&P configuration. Parallel and perpendicular configuration was sintering
conducted on the same level, whereby, the first sintering was conducted with a parallel
sintering pattern and then the parallel pattern is rotated 90° for the second sintering.
After successful sample sintering, a modified tabletop digital Vernier calliper was used to
measure the sintered height changes (∆sH). Next, the sintered sample was removed and
measured with a handheld Vernier calliper for the overall sintered sample single-level
thickness. Sintered depth (sD) was obtained by subtracting overall fabricated single-level
thickness from the sintered height. The sintered samples particle changes were observed under
a LEICA M205A optical microscope and micro-CT to qualitatively characterise particle
changes with increased laser output. The scanned micro-CT image was reconstructed with
software called Materialise MIMICS.
Laser Spot Size
The laser spot size at a focal point distance of 50.8 mm (2 inches) from the laser lens was 130
µm according to the manufacturer’s standard [93] and the depth of focus is ±2.5 mm. The focal
distance of 50.8 mm that produce a laser spot size of 130 µm will be known as the origin. Laser
spot sizes were manipulated via adding distance between the lens and the sintering bed from
origin. The focal point distance was set to +1.5 mm, +4.5 mm, and +7.5 mm away from origin.
The “+” denomination shows the added distance in mm from origin (in the direction away from
lens). It is not possible to accurately calculate new laser spot size for the new focal point
distance as the lens depth of focus range is about ±2.5 mm based on the manufacturer’s manual.
Theoretically, we can assume the laser spot size enlarges when the distance between the lens
and sintering bed increases or decreases compared to the spot size at the origin. The laser
diagram and the description of the new position of the spot sizes are showed in Figure 3.4.
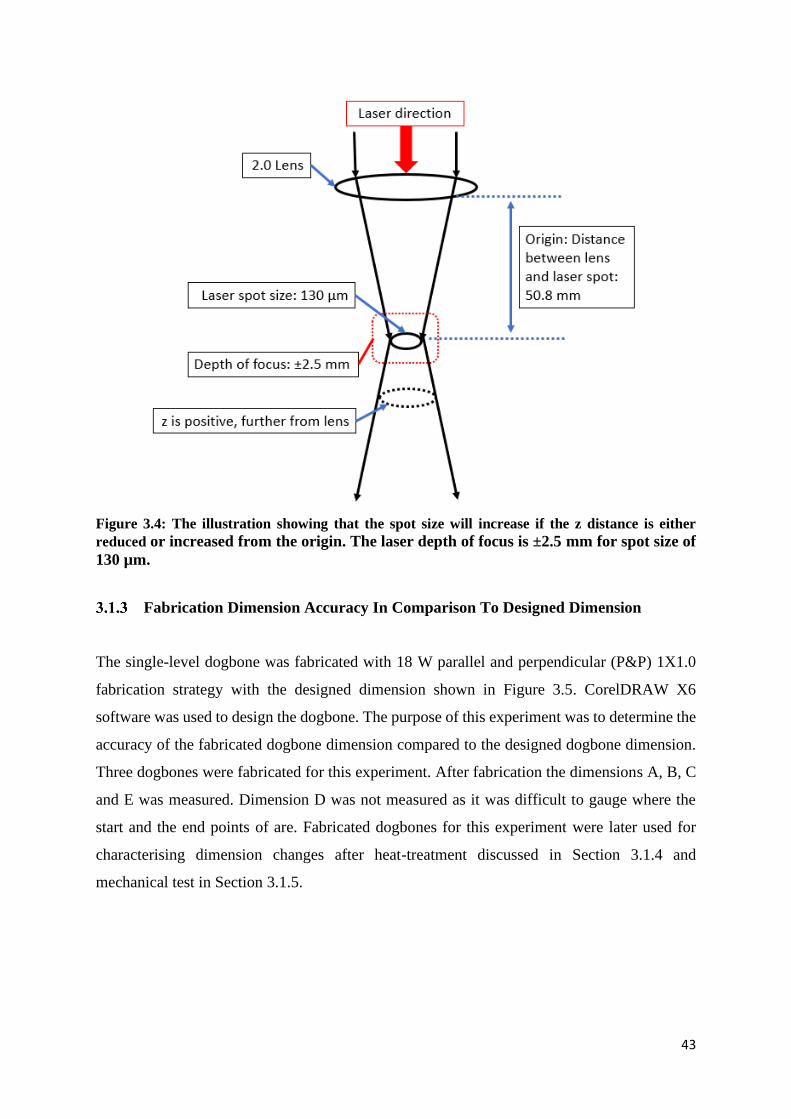
43
Figure 3.4: The illustration showing that the spot size will increase if the z distance is either
reduced or increased from the origin. The laser depth of focus is ±2.5 mm for spot size of
130 µm.
Fabrication Dimension Accuracy In Comparison To Designed Dimension
The single-level dogbone was fabricated with 18 W parallel and perpendicular (P&P) 1X1.0
fabrication strategy with the designed dimension shown in Figure 3.5. CorelDRAW X6
software was used to design the dogbone. The purpose of this experiment was to determine the
accuracy of the fabricated dogbone dimension compared to the designed dogbone dimension.
Three dogbones were fabricated for this experiment. After fabrication the dimensions A, B, C
and E was measured. Dimension D was not measured as it was difficult to gauge where the
start and the end points of are. Fabricated dogbones for this experiment were later used for
characterising dimension changes after heat-treatment discussed in Section 3.1.4 and
mechanical test in Section 3.1.5.

44
Figure 3.5: The designed dogbone dimensions for fabricated StarPore™ dogbone.
Effect Of Heat Treatment On Structural Dimension
The single-level dogbone was fabricated with 18 W parallel and perpendicular (P&P) 1X1.0
fabrication strategy with the designed dimensions shown in Figure 3.5. Sintered HDPE parts
usually possess poor mechanical properties, and heat-treatment was necessary to improve the
properties [68]. The purpose of this experiment was to determine the dimensional changes of
the heat-treated dogbone compared to the fabricated dogbone dimensions. Two groups of heat-
treated dogbone were prepared: 1) the 120 °C heat-treated dogbone and 2) 130 °C heat-treated
dogbone. The selection of 120 °C and 130 °C as the heat-treatment temperatures was based on
the DSC results (Figure 2.13). The dogbone was exposed to heat for one hour with a ±3 °C
temperature error range measured with a digital thermocouple. The samples were put on top of
parchment paper in a glass Petri dish during heat-treatment. Three dogbones were fabricated
for each of the groups. After fabrication the dimensions A, B, C and E were measured.
Dimension D was not measured as it was difficult to gauge where the starting and the ending
points were. Heat-treated dogbones for this experiment were later used for mechanical tests
described in Section 3.1.5.
Mechanical Test
Samples prepared in Section 3.1.3 and 3.1.4 were used in this experiment. The purpose of the
single-level mechanical test was to characterise the stress-strain properties of the three sample
groups mentioned above. The three groups were: 1) Fabricated, 2) 120 °C heat-treated and 3)
130 °C heat-treated. The samples were then tested using an EZ Mechanical Tester by
Shimadzu, under a stress rate of 1 mm/min with maximum load cell capacity of 5 kN. Before
the samples were tested, they were glued to a sample holder at each end to act as an
intermediary between the dogbone samples and the mechanical test clamp. The purpose of the
sample holder was to avoid premature deformation caused by direct clamping to the clamp

45
before the mechanical test. The single-level dogbone dimensions are shown in Figure 3.5 and
an example dogbone with sample holder in position at the mechanical tester clamp is shown in
Figure 3.6.
Figure 3.6: The dogbone sample in the mechanical tester clamp. The sample holder
(circled) acts as an intermediary to prevent deformation to the dogbones from the clamps.
3.2 Results And Discussion
Particle changes for Parallel 1X1.0 single-level sintered with a range of laser output from 2 W
to 30 W were carefully observed under an optical microscope to determine the particle changes
qualitatively and characterise the changes as discussed in Section 3.2.1. All other samples
particle changes are discussed and the laser output sintering window determined.
Physical changes for Parallel 1X1.0 single-level sintered depth and sintered height in relation
to increased laser output was carefully measured to give an overall picture of the physical
changes expected with increased laser output during sintering (discussed in Section 3.2.2).

46
After obtaining the general idea of particle and physical changes for Parallel 1X1.0 single-level
sample, comparison with other sintering schematics are considered and discussed in Section
3.2.2.1 (parallel scanning schematics) and Section 3.2.2.2 (parallel and perpendicular scanning
schematics).
Next, after optimising the laser output sintering window for fabrication strategies, samples
fabricated with 18 W P&P 1X1.0 were studied for the effect of increasing laser spot size with
constant laser output on particles and physical changes. The changes are discussed in Section
3.2.3.
Single-level dogbones were fabricated from a designed dogbone to access the fabrication
changes and to determine the hatch offset that was applied in Chapter 4. The dimensional
changes for fabricated dogbones compared to the designed dogbone are discussed in Section
3.2.4. Two groups of dogbone were fabricated and heat treated at 120 °C and 130 °C
respectively to determine the dimensional changes after heat treatment (discussed in Section
3.2.5).
Lastly, single level dogbone mechanical tests on sintered and heat-treated samples are
discussed in Section 3.2.6.
Laser Sintered Particles Morphology Characterisation
Six distinct particle changes were observed based on StarPore™ morphology changes
fabricated with different laser outputs (see Figure 3.7). The sintering onset began when raw
particles received enough energy to deform without particle fusion (Figure 3.7-A). As the
energy density was increased, the deformed particles formed minor fusion between particles
(Figure 3.7-B), and evident fusion between particles grew as the laser energy output increased
(Figure 3.7-C), subsequently leading to formation of a coalesced structure (Figure 3.7-D).
Further increases in laser output caused vaporisation and voids within the coalesced structure
(Figure 3.7-E), and finally led to degradation and a burnt coalesced structure as excessive
energy was delivered (Figure 3.7-F).

47
A Particles deformed. No fusion observed. Fragile.
• Onset of sintering begins when the raw StarPore™ particles
received the minimum energy threshold to begin deforming.
• The particles lose their trilobal shape partially and start to
expand in size.
• Fusion between particles was not observed at this stage.
B Particles deformed with minor fusion
• Lower sintering limit.
• Increasing the laser energy output above the minimum
energy threshold, causes the StarPore™ to deform and melt.
• During melting, fusion between particles occurs.
• Some particle trilobal shape are observed
C Particles deformed with evident fusion.
• Fusion more evident.
D Presence of fusion and coalesce
• Upper sintering limit.
• Evident fusion was observed when the sintered StarPore™
particles completely lose their trilobal shape and join to form
a coalesced structure.
E Presence of dual layer, voids within coalesce
• Voids were formed within the melted coalesced structure.
• The upper sintered layer appears to be melted rather than
coalesced. While the coalesced structure below the melted
surface remained the same.
F Presence of burnt area.
• Burnt area present as the laser energy delivered is too high.
• Frequent fire flashes were observed during sintering.
Figure 3.7: Optical microscopy of StarPore™ particle changes at various fabrication
stages. Each sintering stage has its own colour denomination.

48
The overall colour-coded microscopic analysis summary for all the six sintered samples is
shown in Table 3.2. The optical analyses served to determine the lower limit and upper limit
of sintering respectively. The laser output lower limit was defined by the fusion produced by
the lowest laser output while the laser output upper limit was capped at the highest sintering
laser output that does not result in the presence of voids that are trapped in the coalesced HDPE
that is the result of excessive energy delivered to the sintering bed. The laser output range
between the laser output lower limit and the upper limit is the laser output sintering window.
Table 3.2: Summary of particle analysis based on optical microscopic analysis. The
number indicated is the laser output in watt. (P&P: parallel and perpendicular) Sample Laser Output (W)
Parallel 1X1.0 2 4 6 8 10 12 14 16 18 20 22 24 26 28 30
Parallel 2X1.0 2 4 6 8 10 12 14 16 18 20 22 24 26 28 30
Parallel 1X0.5 2 4 6 8 10 12 14 16 18 20 22 24 26 28 30
P&P 1X1.0 2 4 6 8 10 12 14 16 18 20 22 24 26 28 30
P&P 2X1.0 2 4 6 8 10 12 14 16 18 20 22 24 26 28 30
P&P 1X0.5 2 4 6 8 10 12 14 16 18 20 22 24 26 28 30
Produce unsintered sample.
Particles deformed. No fusion observed. Fragile.
Particles deformed with minor fusion.
Particles deformed with evident fusion.
Presence of fusion and coalesced particles
Presence of dual layer, voids within coalesced particles.
Presence of burnt area.
The summarised laser output sintering window, upper and lower limits for the six single-level
fabrication strategies are shown in Table 3.3.
Table 3.3: Summary of sinterable range based on Table 3.2. A wider laser output
sintering window at a lower upper limit is preferred for sintering as it does not require
high laser output to result in a stable sintered structure. (P&P: parallel and
perpendicular) Sample Lower limit Upper limit Sintering
window
Parallel 1X1.0 16 W 30 W 14 W
Parallel 2X1.0 14 W 30 W 16 W
Parallel 1X0.5 8 W 20 W 12 W
P&P 1X1.0 12 W 24 W 12 W
P&P 2X1.0 10 W 18 W 8 W
P&P 1X0.5 6 W 10 W 4 W
In summary, the particle changes were categorised into six different categories based on the
particle morphology fabricated from a range of laser output for each fabrication strategy. From

49
the particle changes, the onset of sintering begins when the particles receive sufficient energy
to cause minor fusion with each other; this was known as the lower sintering limit. The upper
sintering limit ends just before the laser output formed voids within the coalesced structure.
Hence, from the defined limits the laser output sintering window for each fabrication strategy
was determined with the widest range for sample group Parallel 2X1.0 (14 W to 30 W).
However, the laser output sintering window resulted in only two types of particle fusion: 1)
minor and 2) evident. The sample group fabricated with P&P 1X1.0 fabrication strategy was
selected to explore the laser spot size effect (Section 3.2.3), the dimension fabrication accuracy
(Section 3.2.4 and Section 3.2.5) and the single-level mechanical (Section 3.2.6) as it has about
equal distribution of fusion within each laser output sintering window. The laser output was
selected at 18W for sample P&P 1X1.0 as it is the average laser output sintering window for
the sample.
Physical Characterisation Per Laser Output
StarPore™ particles fuse together to form a fabricated single-level structure when sufficient
energy is delivered to sinter raw particles. During sintering, the raw materials expand in
accordance with the energy received from the laser and the particle expansion above the
sintering bed surface is the sintered height. Sintered depth was calculated in the terms of laser
energy penetration through the sintering bed surface that will induce fusion between raw
particles. The increase in laser energy delivered will influence greater heat induction and
penetration, thus allowing greater sintering depth [72].
Sintering StarPore™ particles resulted in a rough surface as the particles are trilobal and large.
Measurement of the sintered height was conducted carefully with a modified tabletop digital
Vernier calliper in order not to accidentally “push” the fabricated samples into the sintering
bed, as the samples rested on the powder bed. Moreover, the fabricated part surface was rough
and may have significant protrusions because of the trilobal shape of StarPore™. The sintering
process causes the particles to enlarge in size and expand in all directions. This results in a
rough surface and may have significant protrusion, and this was accounted for during sintered
height measurement. This protrusion was accounted for in the sintered height measurement, as
the tabletop digital calliper has a flat jaw that was levelled accordingly to gauge the sintered
height. If the flat jaw was not carefully levelled down to just rest above the rough surface (and
sometimes protrusion), it pushes the fabricated part down into the sintering bed and give a

50
measurement error for the sintered height. The cross-section of the fabricated sample and
measurement described are showed in Figure 3.8.
A scan of a cross-
section for a sintered
single-level sample,
3D view
Cross-section of a
fabricated sample,
cross-section, front
view
A red line is drawn
on the top of the
fabricated sample.
The topology of the
fabricated sample
cross section
A horizontal black
line and vertical blue
lines give visual
representation of
different heights on
the cross section.
Figure 3.8: Cross section of the fabricated StarPore™ obtained from reconstructing data
from micro-CT. The sintered surface area showed a sintered rough surface with
protrusions.
Sintered height measurement based on tabletop Vernier calliper jaw
based on tabletop Vernier calliper jaw
Rough surface with protrusion
Topology of fabricated sample top area

51
Fabricated sample Parallel 1X1.0 with single-level thickness (compound of sintered height and
sintered depth), is shown in Figure 3.9. As the graph shows, the fabricated single-level
thickness increased with increased laser output. No measurement was taken for laser output 12
W and below, as the fabricated part was fragile and breaks upon physical movement and the
lower laser output (about 8 W) does not result in any noticeable sintering, hence no
measurement was taken. Because of the raw StarPore™ particles morphology, large
measurement errors are seen in the graph. Another possible reason that may contribute to the
measurement error could be the method of physical measurement with a handheld Vernier
calliper.
Figure 3.9: The graph shows the relationship of measured single-level thickness, mm with
laser output, W. The graph shows an increasing trend in thickness with increased laser
output energy.
In summary, the sintered height for sample Parallel 1X1.0 showed an increased height trend
with increased laser output. The sintered depth for sample Parallel 1X1.0 showed that the laser
energy penetration depth remained similar throughout the laser output. However, for laser
output 12 W and below, no measurement was given as the sample was too fragile and breaks
upon physical movement or the energy delivered by laser output is insufficient. The physical
changes of sample Parallel 1X1.0 was compared to other parallel samples (Section 3.2.2.1) and
P&P sample (Section 3.2.2.2) and are further elaborated in the respective sections.
0.0
0.5
1.0
1.5
2.0
2.5
3.0
3.5
4.0
6 8 10 12 14 16 18 20 22 24 26 28 30
Thic
knes
s (m
m)
Laser Output (W)
Single-level sintered thickness (Parallel 1X1.0)
Parallel 1X1.0 Sintered Depth Parallel 1X1.0 Sintered Height
Laser output 12 W and below resultedin fragile sample or insufficient energy to induce sintering
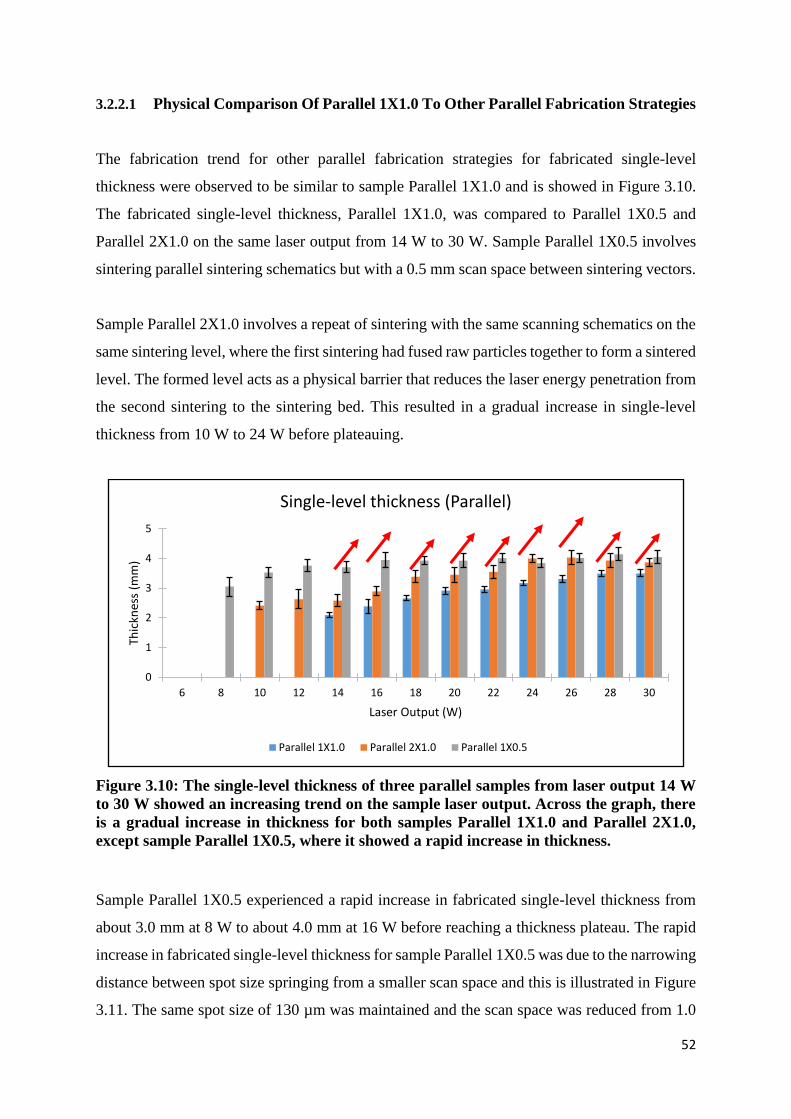
52
3.2.2.1 Physical Comparison Of Parallel 1X1.0 To Other Parallel Fabrication Strategies
The fabrication trend for other parallel fabrication strategies for fabricated single-level
thickness were observed to be similar to sample Parallel 1X1.0 and is showed in Figure 3.10.
The fabricated single-level thickness, Parallel 1X1.0, was compared to Parallel 1X0.5 and
Parallel 2X1.0 on the same laser output from 14 W to 30 W. Sample Parallel 1X0.5 involves
sintering parallel sintering schematics but with a 0.5 mm scan space between sintering vectors.
Sample Parallel 2X1.0 involves a repeat of sintering with the same scanning schematics on the
same sintering level, where the first sintering had fused raw particles together to form a sintered
level. The formed level acts as a physical barrier that reduces the laser energy penetration from
the second sintering to the sintering bed. This resulted in a gradual increase in single-level
thickness from 10 W to 24 W before plateauing.
Figure 3.10: The single-level thickness of three parallel samples from laser output 14 W
to 30 W showed an increasing trend on the sample laser output. Across the graph, there
is a gradual increase in thickness for both samples Parallel 1X1.0 and Parallel 2X1.0,
except sample Parallel 1X0.5, where it showed a rapid increase in thickness.
Sample Parallel 1X0.5 experienced a rapid increase in fabricated single-level thickness from
about 3.0 mm at 8 W to about 4.0 mm at 16 W before reaching a thickness plateau. The rapid
increase in fabricated single-level thickness for sample Parallel 1X0.5 was due to the narrowing
distance between spot size springing from a smaller scan space and this is illustrated in Figure
3.11. The same spot size of 130 µm was maintained and the scan space was reduced from 1.0
0
1
2
3
4
5
6 8 10 12 14 16 18 20 22 24 26 28 30
Thic
knes
s (m
m)
Laser Output (W)
Single-level thickness (Parallel)
Parallel 1X1.0 Parallel 2X1.0 Parallel 1X0.5

53
mm to 0.5 mm between sintered lines, the spread area of energy from the laser via thermal
irradiated area could have overlapped thus resulting in greater energy being delivered to the
sintering surface. Hence, fabrication strategy sample Parallel 1X0.5 resulted in the highest
single-level thickness in the parallel category.
Figure 3.11: The laser spot size Ø = 130 µm, for the comparison of scan space of 1.0 mm
and 0.5 mm.
Figure 3.12 shows the sintered height for all the three parallel samples. The other parallel
sample group showed a similar trend to sample Parallel 1X1.0. Sample Parallel 2X1.0 showed
a lower laser output at 8 W that produced a noticeable sintered height and gradual increase
before plateauing at 20 W. Sample Parallel 1X0.5 showed a rapid increase in sintered height
from 8 W to 14 W before its sintered height plateau. For the same laser output from 10 W to
30 W, all samples show an increasing trend in sintered height from sample Parallel 1X1.0 to
Parallel 1X0.5, except for laser output 22 W.

54
Figure 3.12: Sample Parallel 2X1.0 showed similar sintered height changes to sample
Parallel 1X1.0, while sample Parallel 1X0.5 showed a rapid increase in sintered height in
response to the narrowing of scan space. The red arrow indicated the increase in sintered
height from sample Parallel 1X1.0 to Parallel 1X0.5.
Figure 3.13 shows the sintered depth for all parallel sintered strategy samples, and there is no
clear trend observed for the same laser output from 14 W to 30 W, except for 18 W, 20 W and
22 W, where the sintered depth increases from sample Parallel 1X1.0 to Parallel 1X0.5.
Figure 3.13: The sintered depth for all the samples is similar to their sample group.
Sample Parallel 1X0.5 is the deepest followed by sample Parallel 2X1.0 and Parallel
1X1.0. The red arrow indicated the increase in sintered depth from sample Parallel 1X1.0
to Parallel 1X0.5.
0.0
0.5
1.0
1.5
2.0
2.5
3.0
3.5
6 8 10 12 14 16 18 20 22 24 26 28 30
Hei
ght
(mm
)
Laser Output (W)
Sintered height (Parallel)
Parallel 1X1.0 Parallel 2X1.0 Parallel 1X0.5
0.0
0.5
1.0
1.5
2.0
2.5
6 8 10 12 14 16 18 20 22 24 26 28 30
Dep
th (
mm
)
Laser Output (W)
Sintered depth (Parallel)
Parallel 1X1.0 Parallel 2X1.0 Parallel 1X0.5

55
In summary, the fabricated single-level thickness for all the parallel fabrication strategies
showed an increase with increasing laser output energy. The increase in single-level thickness
corresponds to the increase in sintered height and sintered depth. In a multi-level fabrication, a
deep sintered depth is important in order to induce fusion between the sintered levels.
3.2.2.2 Physical Comparison Of Parallel 1x1.0 To Other Parallel And Perpendicular
(P&P) Fabrication Strategies
The fabricated single-level thickness comparison of all three sample P&P groups to sample
Parallel 1X1.0 is shown in Figure 3.14. Fabricated single-level thickness for sample P&P 1X0.5
was measured only for laser outputs 6 W to 10 W, as laser output 12 W and above frequently
caused fire flashes because of excessive energy delivered to the sintering surface. The presence
of fire flashes during sintering was undesirable as it will cause polymer degradation, voids
expansion by trapped gases [71] and vaporisation of HDPE polymer [64]. For sample P&P
2X1.0, frequent fire flashes were observed at laser output 26 W and above, hence single-level
thickness was not measured either. Both samples P&P 1X1.0 and P&P 2X1.0 showed a rapid
increase in fabricated single-level thickness before reaching a plateau of about 4.0 mm and 4.4
mm at 16 W respectively. Overall, the single-level thickness increased from sample Parallel
1X1.0 to P&P 1X0.5. Sample P&P 1X0.5 was included because of high degradation from fire
flashes.
Figure 3.14: Fabricated single-level thickness for all three P&P sample groups compared
to sample Parallel 1X1.0. Overall single-level sintered thickness for all three P&P sample
groups increases rapidly before reaching a plateau compared to sample Parallel 1X1.0
for which thickness increased gradually.
0
1
2
3
4
5
6 8 10 12 14 16 18 20 22 24 26 28 30
Thic
knes
s (m
m)
Laser Output (W)
Single-level thickness (P&P)
Parallel 1X1.0 P&P 1X1.0 P&P 2X1.0 P&P 1X0.5

56
Figure 3.15 shows sample P&P 1X1.0 sintered height was higher than sample Parallel 1X1.0
counter part because of the difference in fabrication strategies that allow greater laser energy
to be delivered to the overall sintering surface. Sample P&P 2X1.0 showed a gradual increase
in sintered height from 8 W to 16 W and the trend was similar to P&P 1X1.0.
Figure 3.15: Sintered height for all three P&P samples compared to one parallel sintered
sample. Sample Parallel 1X1.0 has the lowest overall sintered height of all the samples.
Generally, overall sintered height increases with increasing laser output.
The sintered depth comparison between all P&P samples to sample Parallel 1X1.0 is shown in
Figure 3.16. The sintered depth for all P&P samples in the set showed a similar trend to sample
Parallel 1X1.0 and the sintering depth for each sample group remains similar throughout the
laser output. However, a higher laser energy penetration occurs at the same laser output for all
P&P samples compared to sample Parallel 1X1.0, with sample P&P 2X1.0 being the deepest.
0.0
0.5
1.0
1.5
2.0
2.5
3.0
3.5
6 8 10 12 14 16 18 20 22 24 26 28 30
Hei
ght
(mm
)
Laser Output (W)
Sintered Height (P&P)
Parallel 1X1.0 P&P 1X1.0 P&P 2X1.0 P&P 1X0.5

57
Figure 3.16: Sample Parallel 1X1.0 has the lowest overall sintered depth of all the three
P&P samples on equivalent laser output.
In summary, the fabricated single-level thickness for all the P&P fabrication strategies showed
an increase in thickness on increasing laser output energy. The increase in single-level
thickness corresponds to the increase in sintered height and sintered depth. However, the P&P
fabrication strategies are susceptible to frequent fire flashes because of the high energy
delivered to the sintering surface.
Effect Of Laser Spot Size On The Fabrication Strategy
Sample 18 W parallel and perpendicular (P&P) 1X1.0 was selected for investigating the
influence of different spot size on particle and physical changes. The study of the laser output
sintering window in Table 3.3 (page 48), showed sample 18 W P&P 1X1.0 has the widest
desired sintered particle types from fusion to coalescence at a lower laser output compared to
other samples. Optical microscopy on particle changes for all the different sample P&P groups
showed that the laser output sintering window reduces as the distance between the lens and the
sintering bed increases. The narrowing of laser output sintering window reduces the flexibility
to choose a range of laser outputs for a constant laser scan speed. The narrowing of sintering
limit was because the decrease of laser energy density delivered to the sintering surface as the
distance spot size increases while maintaining the same laser output. The particle changes are
showed in Table 3.4 with colour-coded description in Table 3.2 (page 48).
0.0
0.5
1.0
1.5
2.0
2.5
3.0
6 8 10 12 14 16 18 20 22 24 26 28 30
Dep
th (
mm
)
Laser Output (W)
Sintered depth (P&P)
Parallel 1X1.0 P&P 1X1.0 P&P 2X1.0 P&P 1X0.5

58
Table 3.4: Summary of particle analysis. The number indicates the laser output. Larger
laser spot size resulted in lower energy density delivered to sintering surface and resulted
in narrow laser output sintering window (green, orange and blue). Sample Laser Output (W)
P&P 1X1.0, origin 2 4 6 8 10 12 14 16 18 20 22 24 26 28 30
P&P 1X1.0, z=+1.5 2 4 6 8 10 12 14 16 18 20 22 24 26 28 30
P&P 1X1.0, z=+4.5 2 4 6 8 10 12 14 16 18 20 22 24 26 28 30
P&P 1X1.0, z=+7.5 2 4 6 8 10 12 14 16 18 20 22 24 26 28 30
The fabricated single-level thickness for all the four P&P sample groups sintered at different
focal distances is shown in Figure 3.17. Overall, the fabricated single-level thickness for the
sample P&P 1X1.0 sintered at distance appears to rise gradually in fabricated single-level
thickness from 10 W to 14 W before reaching a plateau. This showed the maximum achievable
single-level thickness and the other three P&P sample groups showed a similar trend. No
measurements were taken at laser output 8 W for samples sintered at distance +1.5, +4.5 and
+7.5 from origin, as the sample was fragile. The thickness of a single-level sample was
important as a thick sample results in poorer resolution for a multi-level fabrication. Hence, a
thinner sample will be preferable for multi-level sintering in (Chapter 4).
Figure 3.17: The fabricated single-level thickness for the four samples sintered does not
show any distinct difference. The red box shows the rapid raise in fabricated single-level
thickness from 10 W to 16 W before reaching a thickness plateau.
According to Figure 3.18, the trend line at origin produced the lowest overall sintered height
compared to other samples at the same laser output. Increasing the sintering distance will
enlarge the laser spot size and reduces the energy density delivered to the sintering bed at
constant laser output and laser scan speed as per Equation 1.1. However, within the laser output
0
1
2
3
4
5
8 10 12 14 16 18 20 22 24 26 28 30
Thic
knes
s (m
m)
Laser Output (W)
Single-level thickness (+1.5,+4.5,+7.5)
P&P 1X1.0, origin P&P 1X1.0, z= +1.5 P&P 1X1.0, z= +4.5 P&P 1X1.0, z= +7.5

59
sintering windows for sample P&P 1X1.0, the sintered height increases from origin to z= +7.5
for the same laser output. As the sintering was conducted at the scan space of 1.0 mm, the
spread areas of indirect energy from the laser via thermal radiation and transmission [94] for
an enlarged laser spot size could be overlapped. This will contribute to additional indirect
energy delivered to an earlier sintered vector line and thus further increase the sintered height.
Because of this, the sintered height increases from origin to +7.5. Figure 3.19 shows the
described laser spot size sintered at origin compared to larger laser spot sizes.
Figure 3.18: The sintered height for all samples sintered at origin to z= +7.5. Notice that
the overall sintered height increases from origin to z=+7.5 within P&P 1X1.0 (origin) laser
output sintering window. This could be due to the narrowing of laser spot size that
influences the energy delivered in thermal radiation and transmission.
Figure 3.19: The laser spot size Ø = 130 µm and Ø > 130 µm (for larger laser spot sizes).
The heat irradiated from laser spot size should be larger than the laser spot size.
0.0
0.5
1.0
1.5
2.0
2.5
3.0
3.5
8 10 12 14 16 18 20 22 24 26 28 30
Sin
teri
ng
hei
ght
(mm
)
Laser Output (W)
Sintered height (+1.5,+4.5,+7.5)
P&P 1X1.0, origin P&P 1X1.0, z= +1.5 P&P 1X1.0, z= +4.5 P&P 1X1.0, z= +7.5

60
Sintered depth for all the four P&P 1X1.0 (origin to +7.5) sample sets is shown in Figure 3.20,
the sintered depth gradually decreases as the energy density decreases with increasing laser
spot size. Moreover, depth for each individual sintered group remains similar throughout the
laser output with the sintered depth deepest at origin and the least at z= +7.5. This can be
attributed to laser energy density delivered to the sintering surface; the higher the laser density,
the greater the energy penetration through the sintering bed surface, thus producing a sintered
structure beneath the surface.
Figure 3.20: Sintered depth does not show distinct difference between the four samples
as the average sintered depth and the standard deviation lines overlapped with each
other.
In summary, the fabricated single-level thickness for all four P&P samples sintered at different
focal points produced similar thicknesses; the increase in sintered height was offset with the
decrease in sintered depth for each laser output at different sintering distance. On the same
laser output, sample fabricated at origin produced the overall lowest sintered height and the
deepest sintered depth, while there is no significant change in the fabricated single-level
thickness. A lower sintered height and a deeper sintered depth is crucial for multi-level
fabrication as the recoating level does not need to be thick, and the sintered level beneath the
sintered part will receive enough energy to form fusion with the newly sintered level on the
recoating level.
0.0
0.5
1.0
1.5
2.0
2.5
3.0
8 10 12 14 16 18 20 22 24 26 28 30
Dep
th (
mm
)
Laser Output (W)
Sintered depth (+1.5,+4.5,+7.5)
P&P 1X1.0, origin P&P 1X1.0, z= +1.5 P&P 1X1.0, z= +4.5 P&P 1X1.0, z= +7.5

61
Fabrication Dimension Accuracy In Comparison To Designed Dimension
The fabricated and designed dogbone dimensions are showed in Figure 3.21. The sintered
dogbone measured dimension was larger than the designed dimension because the sintering
was conducted at the designed dogbone hatch boundary. The irradiated heat from the laser
melts and fuses neighbouring particles together with the sintered particles forming a wider
sintered structure.
Des
ign
ed
Fa
bri
cate
d
Figure 3.21: The measured dimensions for each section between design and sintered
dogbone. Gauge length after fabrication was not showed as it was difficult to determine
the end to end points. A: Overall length, B: Grip length, C: Grip width, D: Gauge length,
E: Gauge width.
The dimension changes between designed and fabricated dogbones are shown in Figure 3.22
and show that gauge width (E) had the highest sintered changes followed by grip width (C),
grip length (B) and overall length (A). The dimension error for gauge length (D) was not
conducted due to the difficulty to ascertain the end-to-end points for the fabricated dogbone
samples. The large StarPore™ particle size (892±30 µm) had contributed to the large increase
in gauge width (E), while no significant change was found on the overall length (A). The large
fabricated change for gauge width could be due the irritated heat from the laser that indirectly
melt and fuse the neighbouring particles, thus forming a larger structure.

62
Figure 3.22: Dimension changes for fabricated dogbones decrease if the sintered
dimension is small.
To address the indirect fusion of neighbouring particles, a hatch offset was required to improve
sintering accuracy. Hatch offset is mentioned is showed in Figure 3.23. The average difference
between fabricated and designed dogbone dimension A, B, C and D was 1.2±0.6 mm, and the
half of the average difference was 0.6 mm. Hence, a hatch offset was decided to be 0.5 mm. At
this stage, the mechanical properties of the single-level dogbone was of interest, hence, the
hatch offset is not discussed in this chapter but is applied in Chapter 4.
Figure 3.23: The laser scanning schematic. The hatch offset was offset internally in
consideration of the design boundary [95].
In summary, irradiation heat from the laser will indirectly melt and fuse the neighbouring
particles around the designed part, in this case the designed dogbone boundary. It was found
that the large StarPore™ particle size (892±30 µm) may have contributed to the large increase
in fabricated dimensions where the designed dimension was small, for this case +28% increase
for gauge width (E), 6.0 mm, while large design dimension was +0.7% for overall dogbone
length (A). The average dimensional changes were calculated to be 1.2±0.6 mm and the hatch
offset of 0.5 mm was chosen. The hatch offset was applied in subsequent fabrication strategies
(Chapter 4). The fabricated dogbone was used in single-level mechanical test (Section 3.2.6)
to gauge their mechanical properties.

63
Effect Of Heat Treatment On Structural Dimensions
Changes between fabricated dogbone dimension and the heat-treated groups of 120 °C and 130
°C are shown in Figure 3.24. From the figure, there are no significant changes in the overall
dimensions of A, B C and E after heat-treatment. However, apparent changes were noticed for
grip length and gauge width. They reduced by 5.2% and 10.3% respectively for dogbone heat-
treated at 130 °C. This could be an outcome of material vaporisation during heat treatment,
thus causing a distortion to the dogbone. Reduction was 6.5% and -15.2% for sample groups
heat-treated at 120 °C and 130 °C respectively. As the fabricated dogbone was exposed to
elevated temperatures above the crystallisation temperature, the structure was gradually
softened, and gravity comes into effect, reducing the height of the fabricated dogbone sample.
Material softening had caused a flat surface profile for the dogbone bottom surface that was on
the parchment paper.
120 °C 130 °C
Fab
rica
ted
Thickness: 3.1±0.2 mm
Thickness: 3.3±0.2 mm
Hea
t-tr
eate
d
Thickness: 2.9±0.2mm
Thickness: 2.8±0.1mm
Ch
an
ges
Thickness: -6.5%
Thickness: -15.2%
Figure 3.24: The dimensional changes from fabricated to after heat-treatment for each
120 °C and 130 °C heat-treated group. A: Overall length, B: Grip length, C: Grip width,
E: Gauge width.
In conclusion, heat-treatment had an overall effect on the height due to material softening and
significant height reduction was seen for 130 °C heat-treated dogbone. No significant changes

64
were seen in overall dimensions of A, B C and E. The heat-treated dogbones were used in
single-level mechanical tests (Section 3.2.6) to gauge their mechanical properties.
Mechanical Test
The dogbones studied in Section 3.2.4 and Section 3.2.5 were subject to mechanical testing.
The post mechanical test dogbone pictures are shown in Figure 3.25. All the fabricated
dogbones produced fracture lines near the dogbone grip as the structural strength at this part
was weak. Another group of fabricated dogbones was prepared and tested, and the results were
similar, hence, the result for the first group of three fabricated dogbones was accepted.
Dogbone samples treated at 120 °C and 130 °C, showed break points at the middle of the gauge
section. The break points for 120 °C heat-treated dogbone sample was a fracture like effect
with minor elastic breakage, and the 130 °C heat-treated dogbone sample had elastic breakage.
Post-mechanical test dogbone samples Optical microscopy on dogbone sample
Sin
tere
d
120
°C @
1 h
ou
r
13
0°C
@ 1
ho
ur
Figure 3.25: Optical microscopy showed that 130 °C heat-treated dogbone produced
uniformed connected structure and elasticity. While 120 °C heat treated dogbone produce
a fracture similar to the fabricated dogbone.

65
Stress-strain curves for all single-level fabricated dogbones and the average fabricated dogbone
are showed in Figure 3.26 and Figure 3.27 respectively. The fabricated dogbones were
extremely fragile, and fracture occurred near to the sample grip when tested. This was due to
the weak fusion between particles. The average ultimate tensile strength (UTS) for the three
fabricated dogbones was 57±15 kPa at 2.7±0.7% strain, while the Young’s modulus was 36±20
kPa. The Young’s modulus was obtained by dividing the linear difference in tensile stress over
tensile strain before the solid material undergo plastic deformation.
Figure 3.26: The stress-strain curve for all three fabricated dogbones.
Figure 3.27: The stress-strain curve for the average fabricated dogbone. The ultimate
tensile strength was 57±15 kPa at 2.7±0.7% strain, while the Young’s modulus was 36±20
kPa.
0
10
20
30
40
50
60
70
80
0 1 2 3 4 5 6 7 8 9 10
Stre
ss (
kPa)
Strain (%)
Stress-Strain Curve (Fabricated dogbone)
Fabricated 1
Fabricated 2
Fabricated 3
0
10
20
30
40
50
60
0 1 2 3 4 5 6 7
Stre
ss (
kPa)
Strain (%)
Stress-Strain Curve (Average Fabricated dogbone)
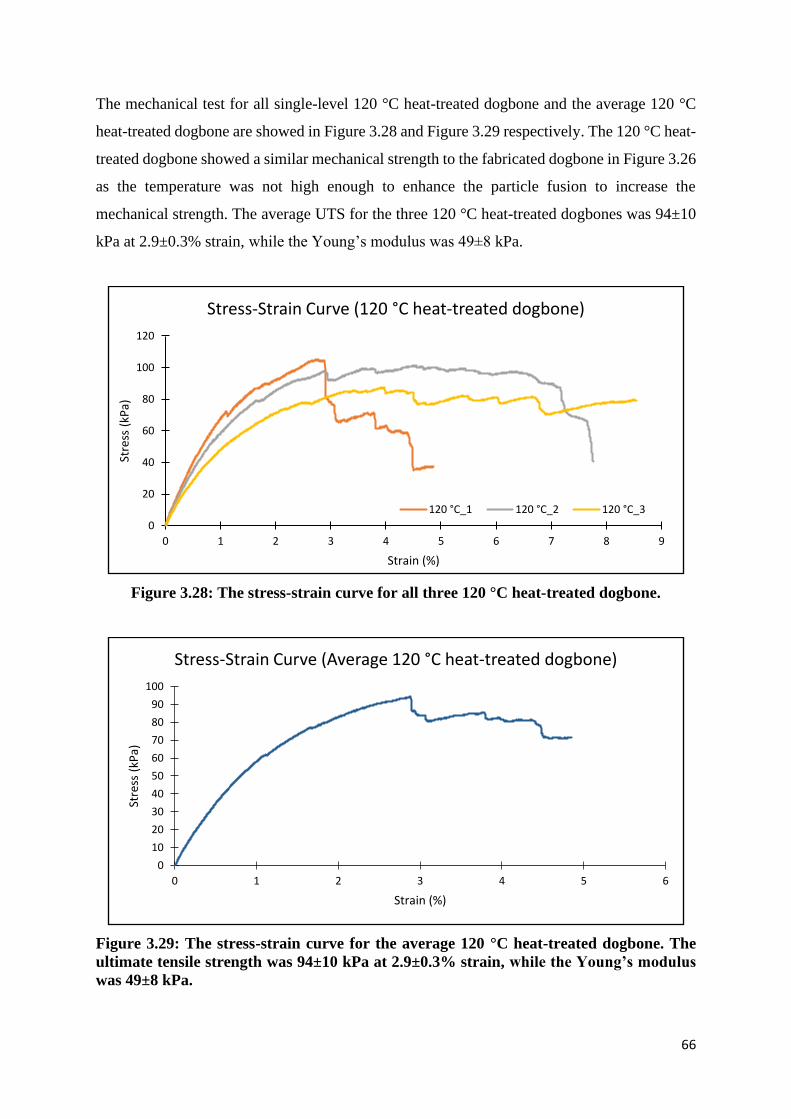
66
The mechanical test for all single-level 120 °C heat-treated dogbone and the average 120 °C
heat-treated dogbone are showed in Figure 3.28 and Figure 3.29 respectively. The 120 °C heat-
treated dogbone showed a similar mechanical strength to the fabricated dogbone in Figure 3.26
as the temperature was not high enough to enhance the particle fusion to increase the
mechanical strength. The average UTS for the three 120 °C heat-treated dogbones was 94±10
kPa at 2.9±0.3% strain, while the Young’s modulus was 49±8 kPa.
Figure 3.28: The stress-strain curve for all three 120 °C heat-treated dogbone.
Figure 3.29: The stress-strain curve for the average 120 °C heat-treated dogbone. The
ultimate tensile strength was 94±10 kPa at 2.9±0.3% strain, while the Young’s modulus
was 49±8 kPa.
0
20
40
60
80
100
120
0 1 2 3 4 5 6 7 8 9
Stre
ss (
kPa)
Strain (%)
Stress-Strain Curve (120 °C heat-treated dogbone)
120 °C_1 120 °C_2 120 °C_3
0
10
20
30
40
50
60
70
80
90
100
0 1 2 3 4 5 6
Stre
ss (
kPa)
Strain (%)
Stress-Strain Curve (Average 120 °C heat-treated dogbone)

67
The mechanical test for all single-level 130 °C heat-treated dogbones and the average 130 °C
heat-treated dogbone are shown in Figure 3.30 and Figure 3.31 respectively. The 130 °C heat-
treated dogbone mechanical strength is distinctly different from the earlier two dogbone
samples as the fusion between the particles is strong and results in elastic breakage, thus
producing a high stress-strain curve. The average UTS for the three 130 °C heat-treated
dogbones was 950±83 kPa at 12.3±0.5% strain, while the Young’s modulus was 396±48 kPa.
Figure 3.30: The stress-strain curve for all three 130 °C heat-treated dogbones.
Figure 3.31: The stress-strain curve for the average 130 °C heat-treated dogbone. The
ultimate tensile strength was 950±83 kPa at 12.3±0.5% strain, while the Young’s modulus
was 396±48 kPa.
0
200
400
600
800
1000
1200
0 1 2 3 4 5 6 7 8 9 10 11 12 13 14 15 16 17 18 19 20 21 22
Stre
ss (
kPa)
Strain (%)
Stress-Strain Curve (130 °C heat-treated dogbone)
130 °C_1 130 °C_2 130 °C_3
0
200
400
600
800
1000
1200
0 1 2 3 4 5 6 7 8 9 10 11 12 13 14 15 16 17 18 19
Stre
ss (
kPa)
Strain (%)
Stress-Strain Curve (Average 130 °C heat-treated dogbone)

68
All the three sample groups of single-level average dogbone stress-strain relationships are
compared in Figure 3.32. Mechanical tests showed that fabricated dogbone had the poorest
properties, followed by the 120 °C heat-treated sample and the 130°C heat-treated sample. This
clearly showed that heat-treated dogbone at 130 °C performed better than the fabricated
material but with a certain degree of height shrinkage. In order to replicate the results of the
heat-treated samples at 130 °C in the real world, it would be necessary to either design the graft
larger to compensate for the shrinkage that will occur during heat-treatment or to heat-treat at
temperature lower than 130 °C for a longer duration. Either way, both ways require further
study to determine their efficacy.
Figure 3.32: All single-level average stress-strain curves. The mechanical properties for
130 °C dogbone were enhanced significantly after heat-treatment and the UTS and strain
improved approximately 10X and 4X respectively, compared to the 120 °C dogbone.
In summary, 130 °C heat-treated dogbone samples appear to be glossy in appearance compared
to sintered dogbone, while the 120 °C heat-treated dogbone was partially glossy compared to
the 130 °C heat-treated dogbone. The heat treatment at 130 °C produced a more uniform
connected structure, and this contributed to enhancing overall mechanical strength of the 130
°C heat-treated dogbone samples. According to the literature, heat-treated sintered parts will
experience an increase in tensile strength [68]. The 120 °C heat-treated dogbone showed a clear
fracture and lacked elastic breakage. This showed that heat-treating at 120 °C does not produce
0
200
400
600
800
1000
1200
0 1 2 3 4 5 6 7 8 9 10 11 12 13 14 15 16 17 18 19
Stre
ss (
kPa)
Strain (%)
All single-level average stress-strain curve
130°C_avg 120°C_avg Avg. Sinter
UTS: 10X
Strain: 4X

69
the desired improvement in mechanical properties and heat-treating the materials temperatures
near or at 130 °C will produce the desired improvements.
3.3 Chapter Conclusion
Sintered StarPore™ samples showed six distinct particle changes during sintering – they were
i) onset of particle deformation, ii) particles deformed with minor fusion between particles, iii)
particles deformed with evident fusion, iv) presence of fusion and coalescence, v) presence of
voids within coalescence and vi) presence of burnt areas. The desired structural characteristics
are the onset of raw particle fusion produced by the lowest laser output, until particle
coalescence by the highest laser output per fabrication strategy. This showed the laser output
sintering window of each fabrication strategies conducted in a non-controlled temperature and
gaseous environment. At this stage, it is important to understand changes in particle
characteristics in order to design an appropriate printing protocol.
Single-level StarPore™ structural changes were characterised in terms of changes in sintered
height and sintered depth for different fabrication strategies. It was found that different
fabrication strategies result in an increase in either single-level thickness, sintered height and
sintered depth, and the increase is either gradual or rapid. Sometimes, if the energy delivered
is too high, fire flashes will occur that results in polymer degradation.
Of the six fabrication strategies, the parallel fabrication strategy appears to be the most
appropriate for multi-level fabrication as the fabricated single-level thickness is relatively
thinner than its P&P counterpart. A thinner fabricated single-level thickness equates to a lower
sintered height and sintered depth that may be suitable for multi-level fabrication. Additionally,
the P&P fabrication strategy results in excessive energy delivered to the sintering surface and
has less flexibility in the laser output sintering window than parallel fabrication strategies.
However, P&P may be useful to act as a connection between substrate and the subsequent
sintered layer in a multi-level sintered part as it can provide support to fix the sintered part onto
substrate and prevent the sintered part being pushed away by the recoating mechanism.
Sintering using different laser spot sizes was conducted by manipulating the lens and the
sintering bed distance. The greater the distance between the lens and the sintering bed, the

70
larger the laser spot size. Sintering distance further than the origin was found to produce a
narrow laser output sintering window. This was due to the laser energy density reducing as the
laser spot size increases while maintaining the same laser output. The large laser spot size
increases the sintered height and decreases the sintered depth. Hence, it can be deduced that
sintering at the origin resulted in lower sintered height and a deeper sintered depth. Also, deeper
sintered depth is crucial for multi-level laser sintering as the lower sintered height does not
require a thick recoating level, and the sintered depth is crucial for forming fusion between
sintered levels.
Fabricated dogbones show that the overall dimension was larger than the designed dogbone.
The changes in dimensions was affected by the irradiated heat from the laser during sintering
that had caused the StarPore™ particles at the designed border to melt and fused with the
overall fabricated structure thus forming a larger part. The fabrication changes can be addressed
with a calculated hatch offset of 0.5 mm. The offset was applied in all fabrication strategies
discussed in Chapter 4.
Heat-treated dogbones showed a reduced height caused by material softening. No significant
changes to other dimensions were found except for grip length and gauge width that were
reduced by 5.2% and 10.3% respectively for dogbone heat-treated at 130 °C. This could be due
to material vaporisation during heat treatment. Reduction of thickness was found and the
thickness reduction was 6.5% and 15.2% for sample groups heat-treated at 120 °C and 130 °C
respectively. During heat-treatment, the fabricated dogbone was exposed to elevated
temperatures that gradually soften the structure. The soft structure was affected by gravity
leading to a reduction in height. Detailed post-processing conditions were not further explored
and will be studied in the future.
Mechanical tests showed that fabricated samples possess an extremely low mechanical strength
and the dogbone sample fractures near to the sample grip at low applied stress. Optical
microscopy on the sintered dogbone showed that the sintered particles lacks proper fusion to
withstand mechanical strain, and thus results in sample fracture at low applied stress. Heat-
treatment at 120 °C for one hour does little to improve the mechanical strength and optical
microscopy showed the fracture point has some element of elastic breakage. Heat-treatment at
130 °C for one hour significantly improved the fabricated sample mechanical strength. Optical
microscopy showed elastic breakages and the fabricated particles were glossy and coalesced.

71
Heat-treatment should be conducted cautiously and the temperature range should be as
consistent as possible to the set temperature. Overheating the sample will soften the fabricated
sample, reduce the post-treatment height and lead to possible melting. Fabricated samples heat-
treated at 120 °C do not show any distinct measurable structural changes. Fabricated samples
heat-treated at 130 °C reduced the sample height by about 15.2%. This is not ideal for a multi-
level sample as the sample distortion at the end of heat-treatment will be too great and not as
designed.

72
4 Chapter 4: Establishment Of Multi-Level Fabrication Methodology
This chapter focuses on understanding how multi-level fabricated StarPore™ behaves over
various fabrication strategies. Multi-level fabrication refers to level-by-level fabrication that
involves alternating recoating and sintering steps with a known recoating level thickness. The
recoating level thickness was set to 1.0 mm based on the StarPore™ particle size (≈1.0 mm).
The alternating recoating and sintering steps are a cyclic process that repeats till the desired
structure is fabricated. Previously (Chapter 3), the effect of different fabrication strategies on
particles and physical structure, the determination of a suitable sintering distance from the lens,
and post-production to enhance the mechanical properties of produced samples was discussed.
The laser output sintering window varies for each fabrication strategy and parallel fabrication
strategies produced a thinner fabricated single-level thickness than the parallel and
perpendicular (P&P) counterparts. Sintering at origin, whereby the laser spot size was smaller,
resulted in the thinnest fabricated part with a wider laser output sintering window compared to
samples sintered with a larger laser spot size (sintering distance increased further than origin
while maintaining the same laser output). Samples fabricated with a larger laser spot size were
found to be thicker and had a narrow laser output sintering window.
When a single-level sample was sintered at low laser output, it resulted in a lower sintered
height compared to sintering at higher laser outputs. However, the resultant sample may be
fragile as the fusion between the particles is not strong enough to hold the fabricated structure.
Increasing the laser output increases the fusion strength between the particles and increases the
sintered height. The increase in sintered height was undesirable as it creates problems during
recoating for a multi-level construct. Hence, the introduction of static weights to the fabrication
strategy may be the solution to control the sintered height regardless of the laser output.
As 130 °C, the heat-treated fabricated single-level sample showed an increase in mechanical
properties by a magnitude of 10X compared to the 120 °C heat-treated sample, but with an
expanse in height reduction by 15.2%. Characterisation of dimension changes for multi-level
fabrication is considered in this chapter in order to determine the suitable post processing
conditions.

73
Characterisation of structural porosity and structural changes for both pre- and post- heat-
treated fabricated multi-level samples and, lastly, mechanical tests of the multi-level sintered
samples are discussed in this chapter.
4.1 Materials And Method
A simple multi-level fabrication platform with movable z-axis and sinter area of 60 mm × 60
mm was built. The movable z-axis allows multi-level structures to be sintered and stacked on
top of each other, level by level, with a known recoating thickness. The moveable z-axis height
was managed with a dial and the change in z-axis height indicates the recoating thickness. The
z-axis height change can be observed with measurements that are etched to the platform
transparent surface. As the dial is rotate clockwise it will move the z-axis upwards and the
change in height before and after the dial rotation indicates the recoating thickness. The multi-
level fabrication platform is shown in Figure 4.1.
Figure 4.1: Multi-level fabrication platform built to characterise StarPore™ multi-level
samples. The elevation of platform in the z-axis direction is controlled by a dial and the
distance is visualised at the measurement etched at the side surface.
Section 4.1.1 focuses on determining the suitable recoating mass of a recoating level for a
multi-level fabrication. This step provides important information on the optimum amount of
StarPore™ powder needed for a recoating thickness of 1.0 mm and an area of 60 mm × 60 mm.
The optimised recoating mass was used for subsequent multi-level fabrication discussed in this
chapter. Section 4.1.2 focuses on four different multi-level fabrication strategies in terms of
laser output, sintering schematics and laser scan space to determine the overall thinnest sintered
Dail

74
multi-level structure. Section 4.1.3 focuses on managing the sintered height per sintered level
with added compaction in order to fabricate a multi-level thickness that corresponds to the total
recoating thickness. Section 4.1.4 focuses on the dimension changes of multi-level heat-treated
samples and fabricated samples. Section 4.1.5 focuses on porosity characterisation from micro-
CT analysis and bulk porosity for heat-treated samples and fabricated samples. Section 4.1.6
focuses on mechanical properties of fabricated and heat-treated dogbone samples.
The illustration of the overall experimental step described in Chapter 4 is shown in Figure 4.2.
Figure 4.2: Illustration of the experimental step conducted for multi-level fabrication.
Determining Recoating Mass
To fabricate a multi-level sample, a cyclic and repeating process of sintering and recoating was
performed to sinter stack levels of a known recoating thickness per level. The recoating
thickness was set to be 1.0 mm based on the raw materials particle size. The fabrication strategy
of parallel and perpendicular (P&P) 1X1.0 at 18 W was used to act as an intermediary level to
the substrate and throughout the levels as this fabrication strategy and laser output produced an

75
evident fusion at the lowest laser output possible. Sample size was designed to be 20 mm × 20
mm on the xy-plane for each level. Based on the summary of Section 3.2.4, the design sample
dimension hatch offset of 0.5 mm was applied in this experiment. Three sample groups were
prepared and named following their respective premeasured recoating masses for an area of 36
cm2: 1.0 g, 1.5 g and 2.0 g. Four samples were made for each sample group and all samples
were fabricated up to five levels. The primary purpose of this experiment was to determine a
suitable recoating mass per level and the optimised recoating mass was used for all multi-level
fabricated parts described in Chapter 4. The secondary purpose was to measure the fabricated
dimensions and compare them to the design dimensions when a hatch offset of 0.5 mm was
used. Other parameters such as weight and structural density were measured and calculated.
The final multi-level sample fabrication strategy is shown in Figure 4.3.
Figure 4.3: The SLS process involves repetitive steps of recoating and sintering. The layer
by layer sintering process stacked on top of the previous layers gives the fabricated part
a defined volume.
Multi-Level Fabrication Strategies
Four sample groups were prepared with different fabrication strategies mentioned in Table 4.1.
A total of five levels were sintered together. The sample size was designed to be 20 mm × 20
mm on the xy-plane at each level. Based on the summary of Section 3.2.4, the design sample
dimension hatch offset of 0.5 mm was applied in this experiment. Four repeats were conducted
for each sample group. A recoating mass of 1.5 g was applied for the recoating level based on

76
the summary in Section 4.2.1. The final multi-level sample fabrication schematics for all the
samples are showed in Figure 4.4.
Table 4.1: Description of the multi-level fabrication strategies. Blue colour denotes
parallel and perpendicular scanning schematics and orange colour denotes parallel and
alternate 90°on next layer scanning schematics.
Sample Scanning schematics Scan
space
(mm)
Laser
output
(W)
Recoating
thickness
(mm)
Total levels
including
intermediary level
A Parallel and perpendicular 1.0 18 1.0 5
B Parallel and perpendicular 1.0 12 1.0 5
C Parallel and alternate 90°on
next layer
1.0 12 1.0 5
D Parallel and alternate 90°
on next layer
0.5 12 1.0 5
Figure 4.4: Fabrication schematics for multi-level fabrication. The number of sintering
levels is 5. The first level, n = 1 was sintered at 18 W (P&P: parallel and perpendicular).
The purpose of the experiment was to understand how different fabrication strategies will affect
the overall multi-level fabricated thickness. The fabrication strategies of parallel and
perpendicular (P&P) with laser output of 18 W and laser scan space of 1.0 mm were nominated
as the fabrication strategy for Sample A (Table 4.1). Then the laser output was reduced to 12
W while the other fabrication strategies were maintained (Sample B) and then the scanning
schematics was changed to alternate level 90° rotations on subsequent levels (Sample C) as a
comparison to P&P sintering for each level. Lastly, the laser scan space was reduced to 0.5 mm

77
(Sample D). After successful sample sintering, a handheld digital Vernier calliper was used to
measure the fabricated height of the samples.
Modified Fabrication With Added Compaction To Reduce Structure Thickness
Sample D from the summary in Section 4.2.2.3 was selected for this experiment. Sample D
fabrication strategies were repeated for this experiment with a premeasured recoating mass of
1.5 g based on the summary in Section 4.2.1. Static compaction of 3.0 kg weight was added
for one minute to the samples at different stages of fabrication. The samples compacted after
recoating was referred as Recoat-C and the samples that were compacted after sintering was
referred to as Sinter-C. The sample size was 20 mm × 20 mm on the xy-axis (Figure 4.5). Hatch
offset of 0.5 mm was applied. Each sample has five sintered levels in total and four samples
were prepared for each sample group. The detailed description of the samples is named in Table
4.2.
Figure 4.5: The axis location on the sintering bed for a multi-level fabrication platform.
Table 4.2: The six sample group names for all the samples prepared based on compaction
introduced after recoating or after the sintering step and known recoating mass.
Compaction Introduction Recoating Mass Sample Group Name
Compaction introduced after
recoating step 1.5 g Recoat-C
Compaction introduced after
sintering step 1.5 g Sinter-C
The purpose of this experiment was to reduce the fabricated multi-level thickness to its
supposed calculated thickness of 5.0 mm based on a five-level fabrication, with each recoating
thickness of 1.0 mm per level. The fabrication strategies for sample group Recoat-C and Sinter-
C is shown in Figure 4.6 and Figure 4.7 respectively.

78
Figure 4.6: Compaction in Recoat-C was conducted immediately after recoating to ensure
raw particles are interlocked with the rough surface area of the earlier sintered level
before next sintering.
Figure 4.7: Introduction of static compaction after sintering for Sinter-C samples. Static
compression was introduced to the sintered level after sintering step.

79
Effect Of Heat Treatment On Structural Dimension
The multi-level Sample D that was fabricated with 12 W alternate rotate 90° on subsequent
fabricated levels (Section 4.1.3) is described in this section. There were four samples prepared
for each fabricated and heat-treated group. The purpose of this experiment was to determine
the changes in dimension of the fabricated sample after heat-treatment. A recoating mass of
1.5 g was applied to the recoating level and 0.5 mm hatch offset was applied to the designed
dimension of 20 mm × 20 mm in this experiment. Fabricated samples were heat-treated in an
oven with a measured temperature of 130±3 °C for 1 hour as measured with a digital
thermocouple. The samples were put on top of parchment paper in a glass Petri dish during
heat-treatment. The sample dimension was measured before and after the heat-treatment with
a handheld Vernier calliper. The fabricated and heat-treated samples were then used to
determine sample porosity (Section 4.1.5).
Micro-CT Analysis
The purpose of this experiment was to characterise the porosity of the fabricated and heat-
treated samples. Samples from Section 4.1.4 were used in this section. A Micro-CT scan was
performed, and image analysis conducted using open source software (ImageJ) to determine
the fabricated sample structural porosity changes before and after heat-treatment for all six
sample groups.
Bulk porosity based on solid HDPE density was calculated as well. Solid HDPE density was
approximately 0.940 to 0.965 g/cm3 [96]. The bulk porosity was calculated with Equation 4.1.
Porosity (%) = (Soliddensity − Structuraldensity
Soliddensity) ∗ 100% Equation 4.1
Mechanical Test
The purpose of the multi-level mechanical test was to characterise the stress-strain properties
of the two sample groups mentioned. The two groups were Recoat-C dogbone and Sinter-C
dogbone, and the samples were prepared using the steps described in Section 4.1.3 and Section

80
4.1.4. The dogbone was fabricated with the same dimension as showed in Figure 3.5 (page 44).
Mechanical tests were conducted for samples fabricated with recoating mass of 1.5 g with
controlled compaction after the recoating and sintering process steps. A recoating mass of 1.5
g was applied for the recoating level based on the summary in Section 4.2.1. Fabricated samples
were then heat-treated at 130°C for 1 hour before the mechanical test. Three repeats were
conducted for both sample groups and tested at a 1 mm/s stress rate.
Before the samples were tested, they were glued to a sample holder on each end to act as an
intermediary between the dogbone samples and the mechanical test clamp. The purpose of the
sample holder was to avoid premature deformation from direct clamping the samples to the
clamp before the mechanical test. The example of the dogbone with sample holder used to
position at the mechanical clamp was showed in Figure 3.6 (page 45).
4.2 Results And Discussion
Multi-level fabrication is a cyclic process of repetitive recoating and sintering steps. The
recoating level thickness was determined by the particle size. In this research, StarPore™
particles are large (≈1.0 mm). Thus, the recoating thickness was set to 1.0 mm. The amount of
powder deposited to sintering bed was studied to determine the optimised StarPore™ recoating
mass needed to be deposited to the sintering bed. The recoating mass is discussed in Section
4.2.1.
After a suitable recoating mass was determined, four different fabrication strategies were
explored to determine the multi-level fabrication strategy with the smallest thickness that can
be fabricated. The parameters that were studied were laser output, sintering schematic and laser
scan space. The multi-level fabrication strategies are elaborated in Section 4.2.2.
Since StarPore™ particles are large (≈1.0 mm) and the multi-level fabrication thickness was
often thicker than the total applied recoating thickness. Hence, modified fabrication with
addition of compaction step will allow greater control of the fabricated level. Two different
modified multi-level fabrications were explored. The compaction step after recoating is named
Recoat-C and compaction after sintering is called Sinter-C. These modified fabrication
strategies are further elaborated in Section 4.2.3.

81
The fabricated StarPore™ was then heat-treated to improve the mechanical properties. Heat-
treated samples often undergo dimensional changes and the fabricated StarPore™ dimensions
before and after heat-treatment were measured. Changes in dimension are further elaborated in
Section 4.2.4.
Micro-CT analysis was conducted on the fabricated StarPore™ sample in order to determine
the structural porosity, and bulk porosity was calculated. Porosity analysis is further elaborated
in Section 4.2.5.
Lastly, multi-level dogbones were fabricated with modified fabrication strategies and heat-
treated to improve mechanical properties. This is further elaborated in Section 4.2.6.
Determining Recoating Mass
The measured thickness and width of the samples with recoating mass of 1.0 g, 1.5 g and 2.0
g for a sintering area of 36 cm2 is shown in Figure 4.8. The premeasured recoating mass with
standard deviation was 1.0±0.003 g, 1.5±0.004 g and 2.0±0.003 g. The overall fabricated
multilevel thickness showed that the average sample thickness increased with increasing
recoating mass from 9.4±0.2 mm (1.0 g) up to 10.2±0.4 mm (2.0 g). However, because of the
standard deviation of each three recoating mass showed an increase in fabricated multi-level
from recoating mass of 1.0 g to 1.5 g only and further increasing the recoating mass to 2.0 g
has no further effect on the fabricated multi-level thickness.
The measured average fabricated width compared to the designed width, with hatch offset of
0.5 mm, showed little change. The measured width was 20.1±0.2 mm (1.0 g), 19.9±0.2 mm
(1.5 g) and 19.9±0.2 mm (2.0 g). This shows that the hatch offset of 0.5 mm resulted in accurate
translation of the designed dimension of 20 mm × 20 mm to the fabricated dimension.

82
Figure 4.8: The measured thickness and width for all the three recoating mass sample
groups.
Figure 4.9 shows the measured average weight and calculated average structural density for
the three recoating mass groups. The measured weight of the three recoating mass groups
showed a trend to increase from 611±18 mg (1.0 g) to 698±18 mg (2.0 g). However, the
standard deviation of 1.5 g to 2.0 g showed no distinct changes in average weight. The measured
weight increases in tandem with the increase in measured thickness.
Structural density was calculated based on the measured dimensions of each respective
recoating mass sample groups. A slight change (an increase) in structural density between
sample group 1.0 g and 1.5 g was calculated and no significant change was seen between
recoating mass 1.5 g and 2.0 g sample groups. The calculated structural density increases in
tandem with the increase in measured thickness.
0
2
4
6
8
10
12
1.0 g 1.5 g 2.0 g
Thic
knes
s (m
m)
Recoating mass
Thickness
0
2
4
6
8
10
12
14
16
18
20
22
1.0 g 1.5 g 2.0 g
Wid
th (
mm
)
Recoating mass
Width

83
Figure 4.9: The measured weight and calculated structural density for the three recoating
mass sample groups.
During recoating, a recoating mass of 1.0 g does not provide enough volume to spread across
the fabrication bed and no excess raw powder was removed. Because of this it can observed
that samples for recoating mass of 1.0 g have the lowest weight. Recoating mass of 1.5 g
resulted in a little excess of raw particles being removed and recoating mass of 2.0 g was
overflowing. This may have retained more raw particles per level that contributed to the
increased thickness, and thus affected weight and structural density.
In summary, the increase in measured weight and calculated structural density was affected by
the increase in multi-level fabricated thickness. A recoating mass of 1.0 g under fills the
sintering area, a recoating mass of 1.5 g results in a little excess of raw particles being removed,
while 2.0 g was overflowing. This resulted in an increase in measured thickness between
recoating mass of 1.0 g and 1.5 g and no significant increase for recoating mass of 2.0 g. Thus,
recoating mass of 1.5 g was selected for all the multi-level fabrications described in Chapter 4.
Multi-Level Fabrication Strategies
The fabricated multi-level samples thicknesses are shown in Figure 4.10, and the samples
description, the fabricated and calculated per level thicknesses, are shown in Table 4.3.
0
100
200
300
400
500
600
700
800
1.0 g 1.5 g 2.0 g
Wei
ght
(mg)
Recoating mass
Weight
0.00
0.02
0.04
0.06
0.08
0.10
0.12
0.14
0.16
0.18
0.20
1.0 g 1.5 g 2.0 gStru
ctu
ral d
ensi
ty (
g/cm
3)
Recoating mass
Structural Density

84
Figure 4.10: The fabricated thickness for all the four samples. Blue bar denotes multi-
level sample prepared with parallel & perpendicular scanning schematics and orange bar
was multi-level sample prepared with parallel sintering schematics rotated alternately by
90° on subsequent level. The correlation used to prepare samples A, B, C and D is
mentioned in Table 4.3.
Table 4.3: The sample description for Figure 4.10, and the measured multi-level
thickness. Sample Sintering
schematics
Scan
space
(mm)
Laser
output
(W)
Recoating
thickness
(mm)
Total
levels
Fabricated
thickness
(mm)
Per-level
thickness
(mm)
A Parallel &
perpendicular
1.0 18 1.0 5 10.8±0.6 2.2±0.2
B Parallel &
perpendicular
1.0 12 1.0 5 10.6±0.3 2.1±0.2
C Parallel, alternate
90°
1.0 12 1.0 5 8.1±0.2 1.6±0.3
D Parallel, alternate
90°
0.5 12 1.0 5 9.1±0.2 1.8±0.4
The fabricated samples A, B, C and D mentioned are showed in Figure 4.11 for parallel and
perpendicular sintering schematics and Figure 4.12 for parallel alternate 90° rotate sintering
schematics.
0
2
4
6
8
10
12
A B C D
Thic
knes
s (m
m)
Sample
Multi-level fabrication thickness

85
Figure 4.11: The fabricated multi-level samples for parallel and perpendicular sintering
schematics, from bottom left to right, sample A and B.
Figure 4.12: The fabricated multi-level samples for parallel alternate level 90° rotate,
from bottom left to right, sample C and D.
The multi-level fabrication was arranged in a way to technically fabricate an average thinnest
fabricated height. The fabricated height based on laser difference is further elaborated in
Section 4.2.2.1, then the change in scanning schematics in Section 4.2.2.2 and, lastly, the
change in laser scan space in Section 4.2.2.3.
4.2.2.1 Multi-Level Fabrication Strategies: Laser Output
The fabricated thickness outcome for sample A was 10.8±0.6 mm for five levels thick produced
through the normal fabrication strategy that involves a cyclic repeat of sintering and recoating
steps. The thick sample could be due to the high laser output that caused the raw particle to
A B
A B
C D
C D

86
expand in size, and in sintered height. As the raw StarPore™ particle size was large (≈1.0 mm),
sintering increased the sintered height [72] and subsequent cyclic recoating and sintering
further compounded the overall sintered height. Calculated per-level thickness for Sample A
was 2.2±0.2 mm.
To reduce the sintered height, Sample B was sintered with a lower laser output (12 W) while
maintaining the other fabrication strategies. The multi-level fabricated thickness was measured
at 10.6±0.3 mm for a total of five levels. Calculated per-level thickness for sample B was
2.1±0.2 mm, this showed that there was no distinct difference between samples A and B multi-
level fabrication strategies.
In summary, there are no distinct differences in the multi-level fabricated height with different
laser outputs except for Sample B. Sample B was fabricated with a much lower laser output.
Sample B was selected to be further compared to Sample C in terms of difference in sintering
schematics (Section 4.2.2.2).
4.2.2.2 Multi-Level Fabrication Strategies: Scanning Schematics
Samples B and C, with a difference in scanning schematics, were compared. Sample B was
fabricated with parallel and perpendicular scanning schematics and Sample C was fabricated
with parallel alternate 90° rotations on the next layer. Based on Table 4.3 (page 84), fabricated
multi-level Sample B had an overall thickness of 10.6±0.3 mm and per level thickness of
2.1±0.2 mm, while Sample C had an overall thickness of 8.1±0.2 mm and per level thickness
of 1.6±0.3 mm. The reduction in overall thickness for Sample C compared to Sample B was
significant and a result of the difference in the energy delivered to each level.
Based on a single-level view, the amount of energy delivered to Sample B per level was two
times the amount of energy being delivered to Sample C, as Sample B level was sintered twice
because of the parallel and perpendicular scanning schematics and Sample C was only a
parallel scanning schematic. Thus, the additional energy delivered to the surface resulted in
greater sintered height and is supported by the research discussed in Section 3.2.2 (page 49).

87
In summary, the change in sintering schematic resulted in lower fabricated multi-level
thickness because of the reduced energy delivered to each level. Overall thickness of Sample
B was 10.6±0.3 mm and per level thickness of 2.1±0.2 mm, while Sample C had an overall
thickness of 8.1±0.2 mm and per level thickness of 1.6±0.3 mm. Thus, Sample C was selected
to further compare with Sample D in terms of difference in laser scan space (Section 4.2.2.3).
4.2.2.3 Multi-Level Fabrication Strategies: Laser Scan Space
Sample C and D are compared in this section; they have a different laser scan space. Both
samples C and D were fabricated with parallel alternate 90° rotation on the next layer at 12 W
laser output. Sample C scan size was 1.0 mm while Sample D was 0.5 mm. Based on Table 4.3
(page 84), fabricated multi-level Sample C had an overall thickness of 8.1±0.2 mm and per
level thickness of 1.6±0.3 mm, while Sample D had an overall thickness of 9.1±0.2 mm and
per level thickness of 1.8±0.4 mm. No significant changes between the samples were seen.
When comparing Samples C and D sintered depth in (Figure 3.13) the samples were sintered
with parallel scanning schematics at 12 W but with a laser scan space of 1.0 mm and 0.5 mm
respectively. The calculated sintered depth for Sample D was 1.7±0.3 mm, and this translates
as a deeper laser energy penetration into the sintering bed that will deliver energy to enhance
fusion between the newly sintered levels to the level beneath. Sample C sintered depth at 12 W
could be lower than 1.0±0.2 mm (there is no data for 12 W parallel 1X1.0; hence 14 W was
taken as reference). Furthermore, the sintered depth standard deviation for sample D indicates
the energy penetration could be as little as 1.4 mm, and this clearly shows that the energy
penetration depth for sample D fabrication strategies was still able to produce an interlayer
fusion, as the sintering depth was greater than the recoating thickness of 1.0 mm. While Sample
C minimum sintered depth could be as deep as 0.8 mm.
In summary, the difference in fabricated multi-level thickness between sample C and D was
about 1.0 mm. In a multi-level fabrication, the sintered depth plays an important role to create
an interlayer fusion. The lowest sintered depth for Sample C was as low at 0.8 mm; while
Sample D sintered depth was about 1.4 mm and was deep enough to create an interlayer fusion
for a recoating thickness of 1.0 mm. However, the total multi-level thickness for Sample D was
9.1±0.2 mm and was considered too thick for five fabricated levels where each level recoating

88
thickness was 1.0 mm. Thus, Sample D was selected to be further explored (Section 4.2.3) in
order to find ways to reduce the overall fabricated multi-level thickness.
Modified Fabrication With Added Compaction To Reduce Multi-Level Thickness
The overall Sample D multi-level thickness of 9.1±0.2 mm was considered too thick for a five
level fabrication. Each level recoating thickness was 1.0 mm; thus, the theoretical fabricated
thickness was supposed to be near to 5.0 mm. Compaction was introduced to the fabrication
process to compress the overall fabricated thickness. The fabricated multi-level thicknesses for
both compacted samples and the comparison to Sample D are shown in Figure 4.13. There was
reduction in average fabricated multi-level thickness from Sample D to Sample Recoat-C and
Sinter-C. The average measured thickness for Sample Recoat-C was 8.4±0.3 mm and for
Sample Sinter-C was 7.5±0.3 mm.
Figure 4.13: Sample D average fabricated multi-level thickness compared to Sample
Recoat-C and Sample Sinter-C.
During the fabrication strategy for Sample Recoat-C, immediate deposition of raw particles to
the sintered level after sintering, and later introduction of compaction, may have pushed more
raw particles into the heated sintered level. This may have created an interlocking surface
between each level after sintering. While, for Sample Sinter-C, the introduction of static
compression after sintering flattened and levelled out the rough surface of the sintered level
and this resulted in a smoother recoating process. The illustration for both Sample Recoat-C
and Sinter-C compaction steps for the first level as an example is shown in Figure 4.13.
0.0
2.0
4.0
6.0
8.0
10.0
Sample D Recoat-C Sinter-C
Thic
knes
s (m
m)
Comparision of Average fabricated multi-level thickness for compacted samples to Sample D

89
Figure 4.14: Schematic illustrating the effect of roughening in the Recoat-C vs. Sinter-C
process. Full processes are shown in Figure 4.6 for Recoat-C and Figure 4.7 for Sinter-C.
The fabricated multi-level thickness for Sample Recoat-C was greater than for Sample Sinter-
C. This could be because the recoating process may have shielded the sintered level from direct
compaction from the weights, and because the time taken from the sintering step to the
recoating process and then compaction may have allowed the sintered level to cool and solidify
to a certain extent; thus reducing the effect of compaction. Immediate compaction after
sintering for Sample Sinter-C may have flattened and levelled the sintered level before the
recoating process, thus resulting in an overall lower fabricated multi-level thickness compared
to Sample Recoat-C.
In summary, both fabrication strategies for Sample Sinter-C may provide better control of the
overall fabrication strategy and better fabricated multi-level thickness, but the Sample Recoat-
C may provide better structural integrity that comes from the interlocking structure between
each sintered level. As there is no significant difference in fabricated thickness or benefits of
sample fabrication strategies, both samples were further explored for heat-treated dimensional
change (Section 4.2.4) and structural porosity changes before and after heat-treatment (Section

90
4.2.5). Mechanical tests were conducted on two dogbone group sets: Sample Recoat-C and
Sinter-C (Section 4.2.6).
Effect Of Heat Treatment On Structural Dimensions
Both the samples Recoat-C and Sinter-C fabricated dimensions were measured before and after
heat-treatment. The heat-treatment was conducted at 130±3 °C for 1 hour. The recoating mass
was 1.5 g. The average change in thickness in the sample groups is shown in Figure 4.15. After
heat-treatment, both samples showed height reduction. Sample Recoat-C height reduction was
from 8.8±0.4 mm to 8.4±0.2 mm and Sample Sinter-C was 8.1±0.5 mm to 7.9±0.4 mm.
Figure 4.15: The measured average thickness for both sample groups before and after
heat-treatment.
Figure 4.16 shows the measured width for both the sample groups. No significant change was
found for the width following heat-treatment. The measured width before and after heat-
treatment for Recoat-C was 19.9±0.2 mm to 19.6±0.1 mm, while for Sinter-C it was 19.9±0.2
mm to 19.8±0.3 mm.
0
1
2
3
4
5
6
7
8
9
10
fabricated heat-treated
Thic
knes
s (m
m)
Average Thickness (Recoat-C)
0
1
2
3
4
5
6
7
8
9
10
fabricated heat-treated
Thic
knes
s (m
m)
Average Thickness (Sinter-C)
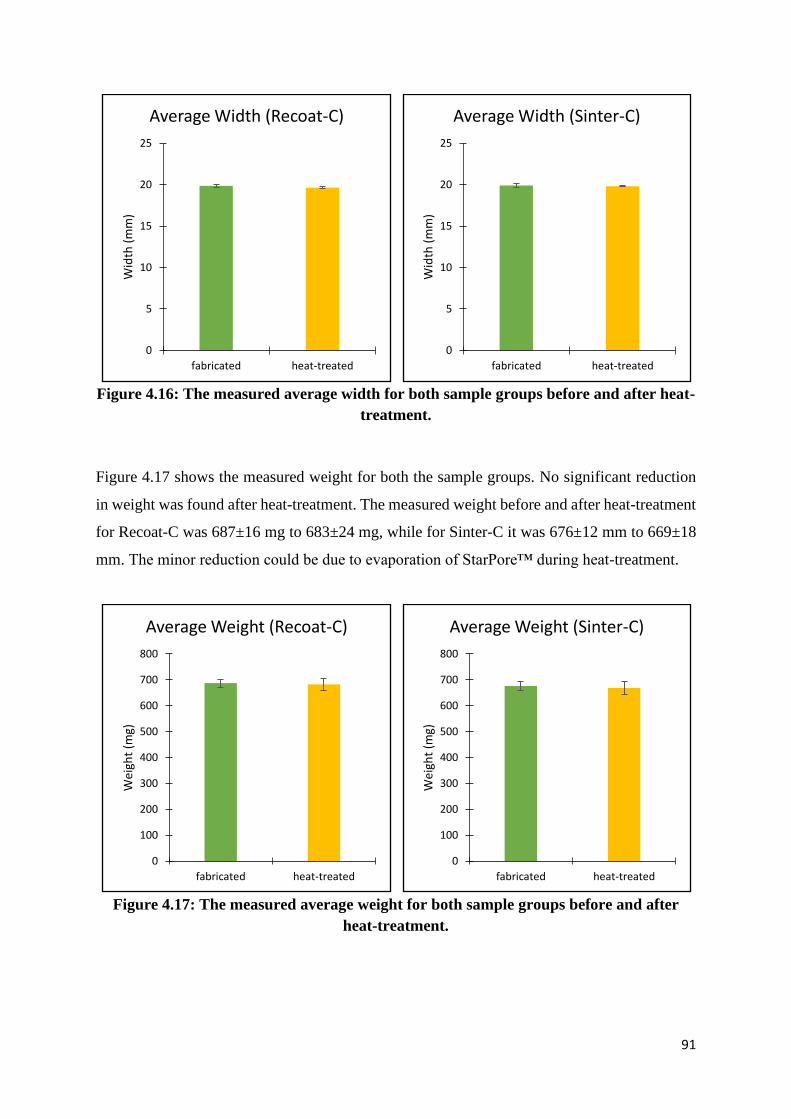
91
Figure 4.16: The measured average width for both sample groups before and after heat-
treatment.
Figure 4.17 shows the measured weight for both the sample groups. No significant reduction
in weight was found after heat-treatment. The measured weight before and after heat-treatment
for Recoat-C was 687±16 mg to 683±24 mg, while for Sinter-C it was 676±12 mm to 669±18
mm. The minor reduction could be due to evaporation of StarPore™ during heat-treatment.
Figure 4.17: The measured average weight for both sample groups before and after
heat-treatment.
0
5
10
15
20
25
fabricated heat-treated
Wid
th (
mm
)Average Width (Recoat-C)
0
5
10
15
20
25
fabricated heat-treated
Wid
th (
mm
)
Average Width (Sinter-C)
0
100
200
300
400
500
600
700
800
fabricated heat-treated
Wei
ght
(mg)
Average Weight (Recoat-C)
0
100
200
300
400
500
600
700
800
fabricated heat-treated
Wei
ght
(mg)
Average Weight (Sinter-C)

92
Figure 4.18 shows the measured structural density for the sample groups. There was an increase
in structural density after the samples were heat-treated. The measured structural density before
and after heat-treatment for Recoat-C was 0.20±0.01g/cm3 to 0.21±0.01 g/cm3, while for
Sinter-C it was 0.21±0.02 g/cm3 to 0.22±0.01 g/cm3.
Figure 4.18: The measured average structural density for both sample groups before
and after heat-treatment.
In summary, both Recoat-C and Sinter-C showed thickness reduction after heat-treatment. No
significant weight reduction was found. Therefore, for both sample groups, the overall
structural density had increased after heat-treatment. There were no significant changes in
width after heat-treatment of either sample group. Both sample groups were further explored
for structural porosity (Section 4.2.5) and in mechanical tests (Section 4.2.6).
Micro-CT Analysis
The micro-CT image analysis and structural porosity changes for fabricated Samples Recoat-
C and Sinter-C before and after heat-treatment is shown in Figure 4.19. The structural porosity
before heat-treatment for the samples Recoat-C and Sinter-C was 69.7% and 68.9%
respectively. After heat-treatment, the structural porosity of Recoat-C and Sinter-C reduced to
66.2% and 65.7% respectively.
0.00
0.05
0.10
0.15
0.20
0.25
fabricated heat-treated
Stru
ctu
ral D
ensi
ty (
g/cm
3)
Average Structural Density (Recoat-C)
0.00
0.05
0.10
0.15
0.20
0.25
fabricated heat-treated
Stru
ctu
ral D
ensi
ty (
g/cm
3)
Average Structural Density (Sinter-C)

93
Recoat-C Sinter-C B
efore
hea
t-tr
eate
d
Structural porosity: 69.7%
Structural porosity: 68.9%
Aft
er h
eat-
trea
ted
Structural porosity: 66.2%
Structural porosity: 65.7%
Figure 4.19: The micro-CT image analysis for both samples Recoat-C and Sinter-C and
the structural porosity before and after heat-treatment.
Bulk porosity before and after heat-treated for Samples Recoat-C and Sinter-C was calculated
using Equation 4.1 and the structural density in Figure 4.18. Table 4.4 shows the calculated
bulk porosity for the samples before and after heat-treatment. Both samples showed a reduction
in bulk porosity after heat-treatment.
Table 4.4: The lowest solid density of HDPE, 0.94 g/cm3 was used to calculate the
structural porosity of the samples before and after heat-treated. Sample Fabricated bulk porosity Heat-treated bulk
porosity
%
change
Recoat-C 78.7% 77.7% -1.0%
Sinter-C 77.7% 76.6% -1.1%
94
The decrease in structural porosity after heat-treatment was caused by the decrease in height.
The structural reduction may fill up smaller pores or voids, thus reducing the overall porosity.
In addition, the expansion of particles during heat-treatment may fill small voids, thus
contributing to reduction of structural porosity.
Limitations such as inconsistencies during the fabrication strategies could be due to manual
preparation and fabrication of samples that introduce an element of human error. Moreover, in
the micro-CT scan, scale accuracy was not automatically shown in the analysis acquired, and
this presents an obstacle to measuring the size of the sintered pores. Detailed measurement of
pore size was not conducted and only overall structural porosity and bulk porosity were
determined. Further experiments need to be conducted in the future to determine the structural
porosity of the sintered part.
In summary, heat-treated samples showed a decrease in porosity in micro-CT analysis and
overall bulk porosity and the decrease could be due to the decrease in height that fills smaller
pores or voids. As well, particle expansion during heat-treatment may fill small voids, further
reducing the overall porosity.
Mechanical Test
Mechanical tests were conducted on sintered dogbones with a recoating mass of 1.5 g and using
the same fabrication strategies as sample Recoat-C and Sinter-C. A recoating mass of 1.5 g
was chosen because was minimal excess of StarPore™ particles removed during the recoating
process. Three repeats for sample Recoat-C and Sinter-C were conducted. The Recoat-C and
Sinter-C dogbone samples that were used in the mechanical test are shown in Figure 4.20. The
dogbones for both samples show elastic breakages at the middle of the gauge.
The mechanical test for all the multi-level Recoat-C heat-treated dogbone samples and average
values are shown in Figure 4.21 and Figure 4.22 respectively. The ultimate tensile strength
(UTS) for the multi-level Recoat-C heat-treated dogbone sample was 1.76±0.29 MPa at
19.7±0.9% strain, while the Young’s modulus was 534±53 kPa. The stress-strain curve for the
three samples of Recoat-C, show a wide error range for UTS, and this could be due to the
inconsistent time taken to recoat the sintered level before the addition of weights.

95
Post-mechanical test dogbone samples Optical microscopy on dogbone sample
Rec
oat-
C
Sin
ter-
C
Figure 4.20: Sample Recoat-C with the breakpoint show by the red arrow.
Figure 4.21: The stress-strain curve for all three Recoat-C heat-treated dogbones.
0.0
0.5
1.0
1.5
2.0
2.5
0 5 10 15 20 25 30
Stre
ss (
MP
a)
Strain (%)
Stress-Strain Curve (Recoat-C) Recoat-C 1
Recoat-C 2
Recoat-C 3

96
Figure 4.22: The stress-strain curve for the average Recoat-C. The ultimate tensile
strength was 1.76±0.29 MPa at 19.7±0.9% strain, while the Young’s modulus was 534±53
kPa.
Results of the mechanical test for all the multi-level Sinter-C heat-treated dogbone samples and
the average are shown in Figure 4.23 and Figure 4.24 respectively. The UTS for the multi-level
Sinter-C heat-treated dogbone sample was 1.65±0.06 MPa at 13.5±3.1% strain, while the
Young’s modulus was 521±117 kPa. The stress-strain curve for the three samples of Sinter-C,
showed a constant stress-strain curve.
Figure 4.23: The stress-strain curve for all three Sinter-C heat-treated dogbones.
0.0
0.5
1.0
1.5
2.0
0 5 10 15 20 25 30
Stre
ss (
MP
a)
Strain (%)
Stress-Strain Curve (Average Recoat-C)
0.0
0.5
1.0
1.5
2.0
0 5 10 15 20 25
Stre
ss (
MP
a)
Strain (%)
Stress-Strain Curve (Sinter-C)
Sinter-C 1
Sinter-C 2
Sinter-C 3

97
Figure 4.24: The stress-strain curve for the average Sinter-C ultimate tensile strength was
1.65±0.06 MPa at 13.5±3.1% strain, while the Young’s modulus was 521±117 kPa.
Both the average multi-level dogbone samples in Figure 4.25 show that Recoat-C and Sinter-
C experienced a gradual increase in stress and strain percentage. An apparent stress difference
was noticeable at 2.5% strain, when Recoat-C stress is 2.9% higher than for Sinter-C. The stress
value for dogbone Recoat-C at strain 2.5% is 1.30 MPa while for dogbone Sinter-C it is 1.27
MPa. Hence, Young’s Modulus for both dogbone Recoat-C and Sinter-C were 535±53 kPa and
521±117 kPa respectively. On the other hand, for sample Recoat-C ultimate tensile strength
(UTS) was 1.76±0.29 MPa at 19.7±0.9% strain and for sample Sinter-C UTS was 1.65±0.06
MPa at 13.5±3.1% strain.
Figure 4.25: The green zone shows both the dogbone samples experience the same stress
value till a strain of 2.5%. Above strain 2.5% the stress level of dogbone Recoat-C was
higher than for dogbone Sinter-C.
0.0
0.5
1.0
1.5
2.0
0 5 10 15 20 25
Stre
ss (
MP
a)
Strain (%)
Stress-Strain Curve (Average Sinter-C)
0.0
0.5
1.0
1.5
2.0
0 1 2 3 4 5 6 7 8 9 10 11 12 13 14 15 16 17 18 19 20 21 22 23 24 25 26 27
Stre
ss (
MP
a)
Strain (%)
Stress-Strain Curve (Average Recoat-C and Average Sinter-C)
Avg. Recoat-C
Avg. Sinter-C
Green zone indicates the both samples
experience the same stress-strain values
before apparent difference at 2.5% strain

98
In summary, the higher mechanical properties for sample Recoat-C compared to Sinter-C could
be due to the presence of an interlocking structure that was present due to static compression
that was added after the recoating process. During recoating, particles will fill the gaps created
from sintering and static compression immediately after recoating will enhance the bonding as
the sintered level cools down. Subsequent sintering of the recoated compressed level will fuse
the particles to the earlier sintered level and form a new level on top of the earlier sintered
level. Heat-treating the dogbone will gradually enhance the interlocking effect. Hence, when
the dogbone is subjected to stress loading, the stress is distributed evenly between levels
because of the interlocking structure. For sample Sinter-C, the better mechanical properties
could be due to the compaction immediately after sintering. This causes even levelling of
protrusion leading to a smooth sintered surface that does not provide an interlocking structure
for subsequent recoating and sintering; thus, lower mechanical properties for dogbone Sinter-
C. This clearly shows that dogbone sintered with Recoat-C fabrication strategies resulted in
higher mechanical properties.
4.3 Chapter Conclusion
As introduced in Chapter 3, a fabricated level thickness encompasses the total sintered height
and sintered depth. The sintered height should be minimal in order to have a smooth recoating
process and thinner recoating level. However, presence of protrusion due to morphology
characteristics poses certain challenges, as some protrusion will protrude beyond the recoating
level thickness and prevent a smooth recoating level surface. As a result, recoating thickness
was set to 1.0 mm to reduce protruding protrusion and to accommodate the large raw particle
size. A recoating mass of 1.5 g provided sufficient coverage to a sinter area without resulting
in excess raw material. Hatch offset employed to the design stage resulted in accurate
translation of designed dimension to the fabricated dimension.
A multi-level fabrication strategy that involved parallel scanning that was rotated 90° on
alternate levels, with 0.5 mm laser scan space and with laser output at 12 W, was chosen as the
sintered depth was 1.7±0.3 mm. This indicated that the minimum sintered depth was 1.4 mm
and it was deep enough to produce an interlayer fusion. However, the overall thickness for
fabricated multi-level Sample D was 9.1±0.2 mm and it was considered too thick for a
99
fabricated five level sample with recoating thickness of 1.0 mm each level. Thus, modified
fabrication with compaction was employed.
The modified fabrication with compaction is the unique approach in this thesis to address the
rough surface level produced after sintering. The modified fabrication with compaction showed
a decrease in the overall fabricated multi-level height for both samples Recoat-C and Sinter-C
compared to non-compacted fabricated samples. The measured thickness for fabricated multi-
level Recoat-C was 8.4±0.3 mm and for Sinter-C it was 7.5±0.3 mm (compared to Sample D
at 9.1±0.2 mm). Sample Recoat-C was higher than Sinter-C, because of the time taken
following the sintering step for recoating and compaction may have allowed the sintered level
to cool and solidify to a certain extent, thus reducing the effect of compaction because the
recoating level may have shielded the sintered level from direct compaction from the weights.
For Sinter-C the immediate compaction introduced after sintering, may have flattened and
levelled the sintered surface before the recoating process, thus resulting in an overall lower
fabricated multi-level thickness.
The structural porosity between the calculated samples and measured samples (from the CT
scan) showed large difference. This could be due to certain limitations such as inconsistencies
in sample preparation and software limitations. Further experiments on structural porosity
should be conducted after a mechanised fabrication platform has been built.
Mechanical tests on dogbones fabricated with the Recoat-C fabrication strategy showed that
both samples Recoat-C and Sinter-C had insignificant stress differences when the strain level
was about 2.5% and below. Above 2.5% strain, sample Recoat-C stress values began to
increase more quickly than for sample Sinter-C values. Recoat-C ultimate tensile strength
(UTS) was 11.76±0.29 MPa at 19.7±0.9% strain and sample Sinter-C UTS was 1.65±0.06 MPa
at 13.5±3.1% strain. Introduction of static compaction either after sintering or recoating may
have affected the overall inter-level connection. Applying static compaction after sintering will
flatten the sintered protrusion and this provides smooth surface for subsequent recoating and
sintering process. Applying static compaction after recoating (Recoat-C) will allow raw
particles to fill in the gaps and create an interlocking mechanism between two sintered levels
after sintering, thus providing a better mechanical strength compared to sample Sinter-C.

100
5 Chapter 5: Thesis Conclusion
In Chapter 2, the StarPore™ experimental results suggest that laser sintering is feasible but a
normal sintering method is not suitable to fabricate raw StarPore™ particles into a desired
structure. The native shape of the particles, being trilobal, was designed by the manufacturer
to produce a trabecular like structure similar to bones from the proprietary manufacturing
method. The trilobal particle shape hinders the ease of recoating onto the sintering bed and
requires physical assistance to evenly spread the particles throughout the sintering bed. Second,
the expansion of sintered particles upwards produces a sintered height and rough surfaces.
The laser output sintering window, between the upper and lower sintering limits of raw
StarPore™, produced with different fabrication strategies show six distinct particle changes
caused by the energy from the laser. A wide laser output sintering window is much preferred
as it allows flexibility in the laser output. Laser output flexibility is important for sintering raw
StarPore™ as the temperature sintering window range is narrow (about 117±0.6 °C to 130±1.5
°C). Moreover, of the six distinct particle changes, it was found that the acceptable particle
changes are from the raw particles that received sufficient energy to result in a fused structure
to the highest laser energy that results in coalescence of structure without the presence of a dual
layer structure or of trapped voids. Voids trapped in the formed coalesced structure are not
desirable as it may lead to biological or chemical risks if implanted in the human body.
The structural level, the changes in sintered height (∆sH), sintered depth (sD), and overall
fabricated single-level thickness has been successfully quantified. Overall, as laser output
increases the single-level thickness increases. However, in some situation, when the laser
output is too high, there will be excessive energy density delivered to the raw StarPore™
sintering bed surface. This results in frequent fire flashes that contribute to degradation of
polymer and renders it useless for further fabrication purpose. Low sintered height and deep
sintered depth is crucial for multi-level fabrication as a low sintered height is beneficial for a
thinner recoating thickness and deep sintered depth for creating interlayer fusion. The
experiment recoating thickness was set to be 1.0 mm thick because of the morphology of the
raw particles and physical labour was included during the recoating process. The StarPore™
narrow temperature sintering window and lack of absorbance requires careful utilisation of
laser output, and a sintering hatch pattern to control the fabrication process.

101
Laser spot size characterisation shows that sintering conducted at the larger spot size while
maintaining the same laser output results in increased sintered height. This is due to the reduced
gap between sintering lines, and a subsequent increase in overlapping of irradiated energy from
the laser. Sintered depth decreases as the laser spot size increases and this is undesirable for
multi-level fabrication.
Multi-level fabrication involves sintering multiple levels onto one another. The large raw
particle size and presence of a rough surface caused during recoating as the free structure of
the sintered sample moves in accordance with the direction of the recoating mechanism.
Sintering the first level to the substrate fixes the sintered part in position and prevents sintered
part movement. A recoating mass of 1.5 g is optimal to cover the recoating area as minimal
excess material was removed during recoating. A parallel alternate 90° rotation hatch pattern
with a 0.5 mm scan distance is suitable for multi-level fabrication as the sintered height is not
too high and a lower laser energy output can be used. With lower laser energy, the sintered
height will be lower and there is less impact on the subsequent recoating process.
The decrease in structural porosity after heat-treatment is caused by the decrease in height.
Filling of smaller pores or voids reduces the overall porosity and leads to reduction of structural
porosity. The expansion of fused particles during heat-treatment will also fills up smaller pores
and voids.
Heat-treatment improves the sintered quality and introduction of static compression
immediately after recoating seems to improve the bonding between sintered levels because of
an improved interlocking structure and a consequent higher ultimate tensile strength. Sintered
height may be managed by using controlled compaction after recoating, however, the reduction
in height after heat-treatment remains an issue as we would prefer the height not to change.
It is possible to fabricate a StarPore™ graft with laser sintering provided that that static
controlled compaction and a parallel alternate 90° rotated hatch with 0.5 mm scan space is
used. Moreover, a recoating thickness of about 1.0 mm is for the StarPore™ particles.
In conclusion, the proposed fabrication protocol is as follows:
• The sample should be first sintered to the substrate.

102
• A fabrication strategy with a parallel alternate 90° rotated hatch with 0.5 mm scan space
at laser energy of 12 W should be used.
• After sintering the first level, a recoating mass of 1.5 g should be spread across the
sintering area and a static compression of 3.0 kg applied.
• The sintering, recoating and compaction steps are repeated until the desired part is
achieved.
• Lastly, the sintered part is heat treated at 130±3 °C for 1 hour.

103
6 Chapter 6: Future Direction
Studies (see Chapter 2) demonstrated that the optical characteristics of StarPore™ at the
particle level has “dips” or “valleys” at laser wavelength 1215 nm, 1395 nm and 1731 nm. This
suggests that energy absorbance at this point, or near to this point, was likely and this showed
delivered laser output energy to sintering surface will be readily absorbed by raw StarPore™
powder to induce fusion between StarPore™ particles. Additives to raw StarPore™ could be
explored as an alternative to increase energy absorbance and reduce the laser output necessary
for sintering. Alternatively, additives of the same material as StarPore™ but in a smaller size
should be explored as the smaller particle size means a larger surface area per volume, greater
exposure to laser energy and less energy to sinter.
At Chapter 3, single-level level, StarPore™ was sintered in a non-controlled temperature
environment and higher laser output was required to deliver enough energy to sinter the
particles. Sometimes, full melting, burnt parts due to fire flashes, and presence of voids were
due to the high laser energy. The introduction of a controlled temperature and inert gaseous
sintering chamber may prevent sample burning, lower the required laser output to sinter, and
prevent trapped bubbles. The use of a thermal camera may assist in such analysis to determine
the minimum sintering temperature that will cause fire sparks or trapped voids. Furthermore,
laser spot size should be revisited as the laser spot size used is too small (about 130 µm) for
the large raw StarPore™ particles that are approximately 892±30 µm in diameter. Hence, larger
laser spot sizes with various energies should be explored.
Ways to improve the sintered sample density must be revisited in order to create a mechanically
stronger implant. The recoating mass is one aspect that must be focussed on in order to improve
the packing density per area before sintering. As fabricated sample density is dependent on the
recoating density, increasing the recoating density before sintering will increase the sintered
sample density. In addition, adding a compression force to the recoating level after sintering
could reduce the sintered height and increase the per-level density. This step should be revisited
as well.
Pore characteristics should be revisited after a proper mechanised system is designed that can
uniformly reproduce the fabricated samples, as the current procedure relied heavily on manual

104
processes. Improving the heat-treatment condition should also be revisited as the current post-
processing condition improved the mechanical properties but at the expense of the fabricated
part height. This is undesirable considering a large bone graft that may be sintered in the future.
A series of temperature ranges between the crystallisation and melting temperatures, and the
time taken to heat treat, should be explored in the future.
Biological characterisation of the successful fabricated multi-level StarPore™ should be
conducted both in vitro and in vivo to assess the biological behaviour of fabricated structures.
These studies are important to further guide the fabrication process to develop structures with
optimal biological properties as required for the targeted application.

105
7 References
[1] A. Mouton, “Lumen Learning,” Pressbooks, [Online]. Available:
https://courses.lumenlearning.com/wm-biology2/chapter/types-of-bone/. [Accessed 5
November 2018].
[2] Visible Body, “Visible Body: Learn Site,” [Online]. Available:
https://www.visiblebody.com/learn/skeleton/types-of-bones. [Accessed 16 August
2018].
[3] L. Learning, “Boundless Anatomy and Physiology: The Skull,” [Online]. Available:
https://courses.lumenlearning.com/boundless-ap/chapter/the-skull/. [Accessed 03
Aug 2019].
[4] J. C. Lee and E. J. Volpicelli, “Bioinspired Collagen Scaffolds in Cranial Bone
Regeneration: From Bedside to Bench,” Advance Healthcare Materials, vol. 6, no. 17,
pp. 1-21, 2017.
[5] E. Nout and M. Y. Mommaerts, “Considerations in computer-aided design for inlay
cranioplasty: technical note,” Oral and Maxillofacial Surgery, vol. 22, pp. 65-69,
2018.
[6] P. V. Giannoudis, H. Dinopoulos and E. Tsiridis, “Bone Substitutes: An Update,”
International Journal of the Care of the Injured, vol. 37, no. 36S, pp. S20-S27, 2005.
[7] B. Zanotti, N. Zingaretti, A. Verlicci, M. Robiony, A. Alfieri and P. C. Parodi,
“Cranioplasty: Review of Materials,” Journal of Craniofacial Surgery, vol. 27, no. 8,
pp. 2061-2072, 2016.
[8] F. M. M. Marreiros, Y. Heuze, M. Verius, C. Unterhofer, W. Freysinger and W.
Recheis, “Custom implant design for large cranial defects,” International Journal of
Computer Assisted Radiology and Surgery, vol. 11, pp. 2217-2230, 2016.
[9] David A. Hidalgo, Andrea L. Pusic, “Free-Flap mandiblular Reconstruction: A 10-
Year Follow-Up Study,” American Association of Plastic Surgeons, vol. 110, no. 2,
pp. 438-449, 2001.
[10] Hans Christoph Pape, Andrew Evans, Philipp Kobbe, “Autologous Bone Graft:
Properties and Techniques,” Journal of Orthopaedic Trauma, pp. S36-S40, 2010.

106
[11] Christopher J. Damien, J. Russell Parsons, “Bone Graft and Bone Graft Substitutes: A
Review of Current Technology and Applications,” Journal of Applied Biomaterials,
vol. 2, pp. 187-208, 1991.
[12] R. Alfotawi and A. Ayoub, “Reconstruction of maxillofacial bone defects:
Contemporary methods and future techniques,” American Journal of Advances in
Medical Science, vol. 2, no. 1, pp. 18-27, 2014.
[13] Jitendra Kumar, Vaibhav Jain, Somesh Kishore, Harish Pal, “Journey of Bone Graft
Materials in Periodontal Therapy: A Chronological Review,” Journal of Dental and
Allied Sciences, vol. 5, pp. 30-34, 2016.
[14] R. d. S. Leão, J. R. S. Maior, C. A. d. A. Lemos, B. C. d. E. Vasconcelos, M. A. J. R.
Montes, E. P. Pellizzer and S. L. D. d. Moraes, “Complications with PMMA compared
with other materials used in cranioplasty: a systematic review and meta-analysis,”
Brazilian Oral Research, vol. 32, no. 31, pp. 1-12, 2018.
[15] W. R. Moore, S. E. Graves and G. I. Bain, “Synthetic Bone Graft Substitutes,” ANZ
Journal of Surgery, vol. 71, pp. 354-361, 2001.
[16] I. Neichajev, “Facial Reconstruction Using Porous High-Density Polyethylene
(Medpor): Long-Term Results,” International Society of Aesthetic Plastic Surgery,
vol. 36, pp. 917-927, 2012.
[17] M. S. Nickoli and W. K. Hsu, “Ceramic-Based Bone Grafts as a Bone Graft Extender
for Lumbar Spine Arthrodesis: A Systematic Review,” Global Spine Journal, vol. 4,
pp. 211-216, 2014.
[18] G. V. Salmoria, E. A. Fancello, C. R. Roesler and F. Dabbas, “Functional graded
scaffold of HDPE/HA prepared by selective laser sintering: microstructure and
mechanical properties,” The International Journal of Advanced Manufacturing
Technology, vol. 65, pp. 1529-1534, 2013.
[19] S. Koëter, S. J. Tigchelaar, P. Farla, L. Driessen, A. V. Kampen and P. Buma,
“Coralline Hydroxyapatite is a Suitable Bone Graft Substitute in an Intra-Articular
Goat Defect Model,” Journal of Biomedical Materials Research Part B: Applied
Biomaterials, vol. 90B, pp. 116-122, 2008.
[20] L. Hollier and S. Stal, “Calcium Phosphate Cement Cranioplasty: Clinical and
Radiographic Follow-up,” The Internet Journal of Plastic Surgery, vol. 2, no. 1, pp.
1-6, 2003.

107
[21] M. M. Hatamleh, X. Wu, A. Alnazzawi, J. Watson and D. Watts, “Surface
characteristics and biocompatibility of Surface characteristics and biocompatibility of
cranioplasty titanium implants following different surface treatments,” Dental
Materials, vol. 34, pp. 676-683, 2018.
[22] S. Mukherjee, B. Thakur, I. Haq, S. Hettige and A. J. Martin, “Complications of
titanium cranioplasty—a retrospective analysis of 174 patients,” Acta
Neurochirurgica, vol. 156, pp. 989-998, 2014.
[23] D. Zaffe, C. Bertoldi and U. Consolo, “Element release from titanium devices used in
oral and maxillofacial surgery,” Biomaterials, vol. 24, pp. 1093-1099, 2003.
[24] M. Goutam, C. Giriyapura, S. K. Mishra and S. Gupta, “Titanium Allergy: A
Literature Review,” Indian Journal of Dermatology, vol. 59, p. 630, 2014.
[25] K. T. Kim, M. Y. Eo, T. T. H. Nguyen and S. M. Kim, “General review of titanium
toxicity,” International Journal of implant Dentistry, vol. 5, no. 10, 2019.
[26] M. Kahn, M. Calayag, A. Patel and J. G. Pilitsis, “Pediatric cranioplasty: lessons from
a 1940s neurosurgical procedure,” Interdisciplinary Neurosurgery: Advance
Techniques and Case Management, vol. 1, no. 4, pp. 73-75, 2014.
[27] D. A. Harris, A. J. Fong, E. P. Buchanan, L. Monson, D. Khechoyan and S. Lam,
“History of Synthetic Materials in Alloplastic Cranioplasty,” Neurosurgical Focus,
vol. 36, no. 4, pp. 1-5, 2014.
[28] N. J. Mokal and M. F. Desai, “Clavarial reconstruction using high-density porous
polyethylene cranial hemispheres,” Indian Journal of Plastic Surgery, vol. 44, no. 3,
pp. 422-431, 2011.
[29] J. K. Liu, O. N. Gottfried, C. D. Cole, W. R. Dougherty and W. T. Couldwell, “Porous
polyethylene implant for cranioplasty and skull base reconstruction,” Neurosurgical
Focus, vol. 16, no. 3, p. ECP1, 2004.
[30] C. A. Homsy, “Bio-Compatibility in selection of materials for implantation,” Journal
of Biomedical Materials Research Part B: Applied Biomaterials, vol. 4, no. 3, pp. 341-
356, 1970.
[31] S. Deshpande and A. Munoli, “Long-term results of high-density porous polyethylene
implants in facial skeletal augmentation: An Indian perspective,” Indian Journal of
Plastic Surgery, vol. 43, no. 1, pp. 34-39, 2010.

108
[32] W. R. Dougherty and T. Wellisz, “The Natural History of Alloplastic Implant in
Orbital Floor Reconstruction: An Animal Model,” Journal of Craniofacial Surgery,
vol. 5, no. 1, pp. 26-32, 1944.
[33] J. H. Oh, “Recent advances in the reconstruction of cranio-maxillofacial defects using
computer-aided design/computer-aided manufacturing,” Maxillofacial Plastic and
Reconstructive Surgery, vol. 40, no. 2, 2018.
[34] K. S. Hong, S. H. Kang, J. B. Lee, Y. G. Chung, H. K. Lee and H. S. Chung,
“Cranioplasty with the Porous Polyethylene Implant (Medpor) for Large Cranial
Defect,” Journal of Korean Neurosurgical Society, vol. 38, no. 2, pp. 96-101, 2005.
[35] B. Marlier, J. C. Kleiber, M. Bannwarth, E. Theret, C. Eap and C. Litre,
“Reconstruction ofcranioplasty using medpor porouspolyethylene implant,”
Neurochirurgie, vol. 63, no. 6, pp. 468-472, 2017.
[36] M. Schmid, A. Amado and K. Wegener, “Polymer powders for selective laser
sintering (SLS),” American Institute of Physics, vol. 1664, no. 160009, pp. 1-5, 2015.
[37] A. Shanbhag, H. Friedman, J. Augustine and A. v. Recum, “Evaluation of Porous
Polyethylene for Extermal Ear Reconstruction,” Annals of Plastic Surgery, vol. 24,
pp. 32-39, 1990.
[38] M. Lacey and O. Antonyshyn, “Use of Porous High-Density Polyethylene Implants in
Temporal Contour Reconstruction,” The Journal of Craniofacial Surgery, vol. 4, no.
2, pp. 74-78, 1993.
[39] T. R. III, A. P. Sclafani and P. Sabini, “Use of Porous High Density in Revision
Phinoplasty and in the Platyrrine Nose,” Aesthetic Plastic Surgery, pp. 211-221, 1998.
[40] J. L. Frodel and S. Lee, “The use of High-Density Polyethylene Implants in Facial
Deformities,” Archive of Otolaryngol Head Neck Surgery, vol. 124, pp. 1219-1223,
1998.
[41] H. K. Park, M. Dujovny, F. G. Diaz and M. Guthikonda, “Biomechanical Properties
of High-Density Polyethylene for Pterional Prosthesis,” Neurological Research, vol.
24, pp. 671-676, 2002.
[42] M. J. Yaremchuk, “Facial Skeletal Reconstruction Using Porous Polyethylene,”
Plastic and Reconstructive Surgery, vol. 111, no. 6, pp. 1818-1826, 2003.

109
[43] A. Menderes, C. Baytekin, A. Topcu, M. Yilmaz and A. Barutcu, “Craniofacial
Reconstruction With High-Density Porous Polyethylene Implants,” Journal of
Craniofacial Surgery, vol. 15, no. 5, pp. 719-724, 2004.
[44] J. M. Sykes and K. G. Patel, “Use of Medpor Implants in Rhinoplasty Surgery,”
Operative Techniques in Otolaryngology, vol. 19, pp. 273-277, 2008.
[45] J. C. Wang, S. Y. Wang, L. Gui, L. Wei and J. Xu, “Porous Polyethelene Combines
With Split Clavarial Bone Graft to Cover Complex Clavarial Defect,” Journal of
Craniofacial Surgery, vol. 23, no. 6, pp. 1802-1804, 2012.
[46] A. Rai, A. Datarkar, A. Arora and D. Adwani, “Utility of High Density Porous
Polyethylene Implants in Maxillofacial Surgery,” Journal of Oral and Maxillofacial
Surgery, vol. 13, no. 1, pp. 42-46, 2014.
[47] S. H. Im, J. Song, S. K. Park, E. Y. Rha and Y.-M. Han, “Cosmetis Reconstruction of
Frontotemporal Depression Using Polyethylene Implant after Pterional Craniotomy,”
BioMed Research International, pp. 1-6, 2018.
[48] J. Klawitter, J. Bagwell, A. Weinstein and B. Sauer, “An Evaluation of Bone Growth
into Porous High Density Polyethylene,” Journal of Biomedical Material Research,
vol. 10, pp. 311-323, 1976.
[49] Q. L. Loh and C. Choong, “Three-Dimensional Scaffolds for Tissue Engineering
Applications: Role of Porosity and Pore Size,” Tissue Engineering, vol. 19, no. 6, pp.
485-502, 2013.
[50] R. V. Oliveira, L. S. d. S. Nunes, H. N. Filho, L. D. A. Holgado, D. A. Rineiro and M.
A. Matsumoto, “Fibrovascularization and Osteogenesis in High-Density Porous
Polyethylene Implants,” The Journal of Craniofacial Surgery, vol. 20, no. 4, pp. 1120-
1124, 2009.
[51] M. Yilmaz, “Craniofacial Reconstruction With High-Density Porous Polyethylene
Implants,” Journal of Craniofacial Surgery, vol. 15, no. 5, pp. 719-724, 2004.
[52] K. S. Sing, “Characterization of porous materials: past, present and future,” Colloids
and surfaces. A, Physicochemical and engineering aspects, vol. 241, pp. 3-7, 2004.
[53] O. Aryasit, D. S. Ng, A. S. C. Goh, K. I. Woo and Y.-D. Kim, “Delayed onset porous
polyethylene implant-related inflammation after orbital blowout fracture repair: Four
case reports,” BMC Opthalmology, vol. 16:94, 2016.
110
[54] A. Uysal, S. Ozbek and M. Ozcan, “Comparision of the biological activities of high-
density porous polyethylene implants and oxidized regenerated cellulose-wrapped
diced cartilage grafts,” Plastic and Reconstructive Surgery, vol. 112, no. 2, pp. 540-
546, 2003.
[55] J. K. Kim, S. B. Lee and S. Y. Yang, “Cranioplasty using autologous bone versus
porous polyethylene versus custom-made titanium mesh: A retrospective review of
108 patients.,” Journal of Korean Neurosurgical Society, vol. 61, no. 6, pp. 737-746,
2018.
[56] M. Kyomoto, T. Moro, T. Konno, H. Takadama, N. Yamawaki, H. Kawaguchi, Y.
Takatori, K. Nakamura and K. Ishihara, “Enhanced wear resistance of modified cross-
linked polyethylene by grafting with poly(2-methacryloyloxyethyl
phosphorylcholine),” Journal of Biomedical Materials Research Part A, vol. 82, no.
1, pp. 10-17, 2007.
[57] Z. P. Wang, Y. F. Huang, J. Z. Xu, B. Niu, X. L. Zhang, G. J. Zhong, L. Xu and a. Z.
M. Li, “Injection-molded hydroxyapatite/polyethylene bone-analogue biocomposites
via structure manipulation,” Journal of Materials Chemistry B, vol. 3, pp. 7585-7593,
2015.
[58] L. Baich, G. Manogharan and H. Marie, “Study on infill print design on production
cost-time of 3D printed ABS parts,” International Journal of Rapid Manufacturing,
vol. 5, no. 3/4, pp. 308-319, 2015.
[59] S. Bose, S. Vahabzabeh and A. Bandyopadhyay, “Bone Tissue Engineering Using 3D
Printing,” Materials Today, vol. 16, no. 12, pp. 496-504, 2013.
[60] Y. Tang, Y. Zhou, T. Hoff, M. Garon and Y. Zhao, “Elastic Modulus of 316 Stainless
Steel Lattice Structure Fabricated via Binder Jetting Process,” Materials Science and
Technology, vol. 32, no. 7, pp. 648-658, 2016.
[61] J. Suwanprateeb and R. Chumnanklang, “Three-Dimensional Printing of Porous
Polyethylene Structure Using Water-Based Binders,” Journal of Biomedical Materials
Research Part B: Applied Biomaterials, vol. 78B, pp. 138-145, 2006.
[62] R. A. Giordano, B. M. Wu, S. W. Borland, L. G. Cima, E. M. Sachs and M. J. Cima,
“Mechanical properties of dense polylactic acid structures fabricated by three
dimensional printing,” Journal of Biomaterials Science, Polymer Edition, vol. 8, no.
1, pp. 63-75, 1996.

111
[63] G. Salmoria, J. Leite, C. Ahrens, A. Lago and A. Pires, “Rapid manufacturing of
PA/HDPE blend specimens by selective laser sintering: Microstructural
characterization,” Polymer Testing, vol. 26, no. 3, pp. 361-368, 2007.
[64] L. Hao, M. M. Savalani, Y. Zhang, K. E. Tanner and R. A. Harris, “Selective Laser
Sintering of Hydroxyapatite Reinforced Polyethylene Composites for Bioactive
Implants and Tissue Scaffold Development,” The Proceedings of the Institution of
Mechanical Engineers, Part H: Journal of Engineering in Medicine, vol. 220, no. 4,
pp. 521-531, 2006.
[65] J. P. Kruth, P. Mercelis, J. V. Vaerenbergh, L. Froyen and M. Rombouts, “Binding
mechanisms in selective laser sintering and selective laser melting,” Rapid
Prototyping, vol. 11, no. 1, pp. 26-36, 2005.
[66] J. T. Rimell and P. M. Marquis, “Selective Laser Sintering of Ultra High Molecular
Weight Polyethylene for Clinical Applications,” Journal of Biomedical Materials
Research, vol. 53, no. 4, pp. 414-420, 2000.
[67] G. V. Salmoria, C. H. Ahrens, P. Klauss, R. A. Paggi, R. G. Oliveira and A. Lago,
“Rapid Manufacturing of Polyethylene Parts With Controlled Pore Size Gradients
Using Selective Laser Sintering,” Journal of Materials Research, vol. 10, no. 2, pp.
211-214, 2007.
[68] S. Changhui, H. Aibing, Y. Yongqiang, W. Di and Y. Jia-kuo, “Customized
UHMWPE tibial insert directly fabricated by selective laser sintering,” International
Journal of Advance Manufacturing Technology, vol. 85, pp. 1217-1226, 2016.
[69] R. D. Goodridge, R. J. Hague and C. J. Tuck, “An empirical study into laser sintering
of ultra-high molecular weight polyethylene (UHMWPE),” Journal of Materials
Processing Technology, vol. 210, pp. 72-80, 2010.
[70] J. Bai, B. Zhang, J. Song, G. Bi, P. Wang and J. Wei, “The effect of processing
conditions on the mechanical properties of polyethylene produced by selective laser
sintering,” Polymer Testing, vol. 52, pp. 89-93, 2016.
[71] Y. Khalil, A. Kowalski and N. Hopkinson, “Influence of energy density on flexural
properties of laser-sintered UHMWPE,” Additive Manufacturing, vol. 10, pp. 67-75,
2016.
[72] L. Hao, M. S. Y. Zhang, K. Tanner and R. Harris, “Effects of material morphology
and processing conditions on the characteristics of hydroxyapatite and high-density

112
polyethelene biocomposites by selective laser sintering,” Proceedings of the
Institution of Mechanical Engineers, Part L, vol. 220, pp. 125-137, 2006.
[73] A. T. Sutton, C. S. Kriewall, M. C. Leu and J. W. Newkirk, “Powder characterisation
techniques and effects of powder characterisation on part properties in powder-bed
fusion processes,” Virtual and physical prototyping, vol. 12, no. 1, pp. 3-29, 2017.
[74] J. Kurth, X. Wang, T. Laoui and L. Froyen, “Laser and materials in selective laser
sintering,” Rapid Prototyping, vol. 23, no. 4, pp. 357-371, 2003.
[75] M. Savalani, L. Hao and R. Harris, “Evaluation of CO2 and Nd:YAG lasers for the
selective laser sintering of HAPEX,” Proceedings of the Institution of Mechanical
Engineers, vol. 220, no. B2, pp. 171-182, 2006.
[76] J. P. Kurth, G. Levy, F. Klocke and T. H. C. Childs, “Consolidation Phenomena in
Laser and Powder-Bed Based Layered Manufacturing,” Annals of the CIRP, vol. 56,
no. 2, pp. 730-759, 2007.
[77] A. Pilipovic, T. Brajlih and I. Drstvensek, “Influence of Processing Parameters on
Tensile Properties of SLS Polymer Product,” Polymers, vol. 10, no. 11, pp. 1208-1225,
2018.
[78] P. A. Rubin, J. K. Popham, J. R. Bilyk and J. W. Shore, “Comparison of Fibrovascular
Ingrowth into Hydroxyapatite and Porous Polyethylene Orbital Implants,” Ophthalmic
Plastic and Reconstructive Surgery, vol. 10, no. 2, pp. 96-103, 1994.
[79] D. Synthes, “SYNPOR® Porous Polyethylene Implants,” DePuy Synthes, 4 February
2019. [Online]. Available:
https://www.depuysynthes.com/hcp/cmf/products/qs/synpor. [Accessed 27 February
2019].
[80] Poriferous, “Su-POR, A Product of Poriferous,” Poriferous, 2019. [Online]. Available:
http://www.poriferous.com/. [Accessed 27 February 2019].
[81] A. P. Ltd, “PoreStar: A new class of implant material,” Anatomics Pty Ltd, 2019.
[Online]. Available: http://www.anatomics.com/applications/cranio-maxillo-
facial/facial-implants/porestar/. [Accessed 27 February 2019].
[82] D. Pham and R. Gault, “A Comparision of Rapid Prototyping Technologies,”
International Journal of Machine Tools and Manufacture, vol. 38, pp. 1257-1287,
1998.

113
[83] Y. Liu, X. Guo, Q. Gu, G. He, S. Yang and H. Jin, “Formation and application of high
reflectivity controllable barium sulfate microspheres,” Crystals, vol. 8, no. 9, pp. 333-
342, 2018.
[84] J. L. Leite, G. V. Salmoria, R. A. Paggi, C. H. Ahrens and A. S. Pouzada,
“Microstructural characterization and mechanical properties of functionally graded
PA12/HDPE parts by selective laser sintering,” The International Journal of
Advanced Manufacturing Technology, vol. 59, pp. 583-591, 2012.
[85] G. Salmoria, V. Lauth, M. Cardenuto and R. Magnago, “Characterization of
PA12/PBT specimens prepared by selective laser sintering,” Optics and Laser
Technology, vol. 98, pp. 92-96, 2018.
[86] S. Kumar and R. Singh, “Thermolysis of High-Density Polyethylene to Petroleum
Products,” Journal of Petroleum Engineering, pp. 1-7, 2013.
[87] M. M. P. Data, “Overview of materials for High Density Polyethylene (HDPE),
Injection Molded,” MatWeb Material Property Data, [Online]. Available:
http://www.matweb.com/search/DataSheet.aspx?MatGUID=fce23f90005d4fbe8e12a
1bce53ebdc8&ckck=1. [Accessed 30 January 2020].
[88] D. L. Bourell, T. J. Watt, D. K. Leigh and B. Flucher, “Performance Limitations in
Polymer Laser Sintering,” Physics Procedia, vol. 56, pp. 147-156, 2014.
[89] M. Laridjani and P. Leboucher, “The Structural Dilemma of Bulk Polyethylene: An
Intermediary Structure,” PLoS ONE, vol. 4, no. 7, p. e6228, 2009.
[90] T. Furukawa, H. Sato, Y. Kita, K. Matsukawa, H. Yamaguchi, S. Ochiai, H. W. Siesler
and Y. Ozaki, “Molecular Structure, Crystallinity and Morphology of
Polyethylene/Polypropylene Blends Studied by Raman Mapping, Scanning Electron
Microscopy, Wide Angle X-Ray Diffraction, and Differential Scanning Calorimetry,”
Polymer Science, vol. 38, pp. 1127-1136, 2006.
[91] R. Caminiti, L. Pandolfi and P. Ballirano, “Structure of Polyethylene from X-Ray
Powder Diffraction: Influence of the Amorphous Fraction on Data Analysis,” Journal
of Marcomolecular Science, Part B, vol. 39, no. 4, pp. 481-492, 2000.
[92] A. A. Alsaygh, J. Al-hamidi, F. D. Alsewailem, I. M. Al-Najjar and V. L. Kuznetsov,
“Characterization of Polyethylene Synthesized by Zirconium Single Site Catalysts.,”
Applied Petrochemical Research, vol. 4, pp. 79-84, 2014.

114
[93] “Universal Laser System,” Universal Laser System - Available Lenses, [Online].
Available: https://www.ulsinc.com/available-lenses. [Accessed 24 May 2019].
[94] M. Sagar and K. Elangovan, “Consolidation & Factors Influencing Sintering Process
in Polymer Powder Based Additive Manufacturing,” IOP Conference Series:
Materials Science and Engineering, vol. 225, p. 012075, 2017.
[95] E. Louvis, P. Fox and C. J. Sutcliffe, “Selective Laser Melting of Aluminium
Components,” Journal of Materials Processing Technology, vol. 211, pp. 275-284,
2011.
[96] G. Bonifazi, G. Capobianco and S. Serranti, “A hierarchical classification approach
for recognition of low-density (LDPE) and high-density polyethylene (HDPE) in
mixed plastic waste based on short-wave infrared (SWIR) hyperspectral imaging,”
Spectrochimica Acta Part A: Molecular and Biomolecular Spectroscopy, vol. 198, pp.
115-122, 2018.