he bi survey 15 - qlik: data analytics for modern …go.qlik.com/rs/497-bmk-910/images/qlik in the...
TRANSCRIPT

BI SURVEYTH
E 15The world´s largest survey of business intelligence software users
A summary of selected highlights produced for
Qlik

THE BI Survey 15 Qlik highlights (1)
11.08.2015 © BARC 2015 2

THE BI Survey 15 Qlik highlights (2)
11.08.2015 © BARC 2015 3
Introduction
11.08.2015 © BARC 2015 4
The BI Survey 15 is based on findings from the world's largest and most comprehensive survey of business intelligence end-
users, conducted earlier this year. In total, 3,267 people responded to The Survey with 2,414 answering a series of detailed
questions about their usage of a named product. Altogether, 35 products (or groups of products) are analyzed in detail.
The BI Survey 15 examines BI product selection and usage among users in categories (KPIs) including business benefits,
proportion of employees using the product, competitiveness, innovation, performance, customer satisfaction and agility. There
are a total of 35 KPIs. This document only contains a selection of the headline findings for Qlik. It does not show all the KPI
results.
We asked several questions that helped us measure the business benefits derived from respondents’ deployments. The
combined results were then used as a calibration tool – The Business Benefits Index (BBI) - which is widely used throughout
The Survey to assess the correlation between various factors and the achievement of benefits.
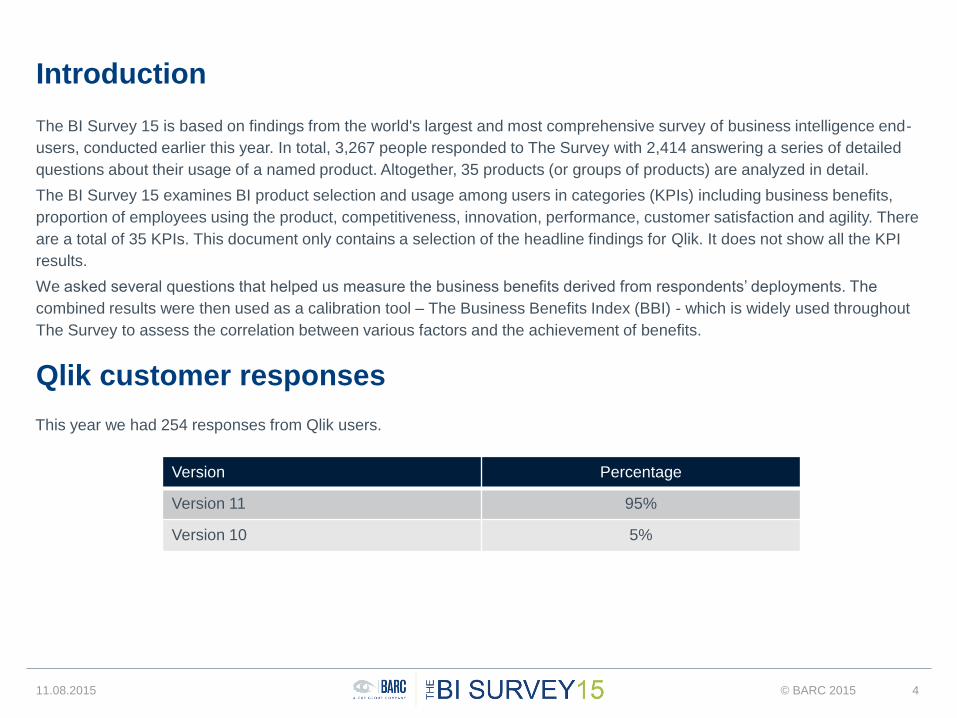
Qlik customer responses
This year we had 254 responses from Qlik users.
Version Percentage
Version 11 95%
Version 10 5%

User and use case demographics
11.08.2015 © BARC 2015 5
Current vs. Planned Use (n = 254)
87%
79%
78%
75%
33%
28%
28%
11%
14%
15%
18%
31%
44%
38%
Dashboards/Scorecards
Standard/Enterprise reporting
Data analysis
Ad hoc query
Financial consolidation
Predictive analysis/Data mining
Budgeting/Planning
In use Planned
© BARC
THE BI Survey 15

11.08.2015 © BARC 2015 6
User and use case demographics
Company Size (employees) (n = 248) Casual vs. Power Users (n = 230)
Licensing Model (n = 231)
Percentage of employees using Qlik
Qlik 16%
Average of all
products17%
Number of users using Qlik
Median 78
Mean 262
10%
62%
28%
Less than 100
100 - 2500
More than 2500 75%
75%
25%
25%
Qlik
Average of all products
Casual users Power users
72%
16%
11%
1%
Purchased licenses up-front
Part of a bundle/suite
Monthly/yearly subscription
Open source
© BARC
THE BI Survey 15

11.08.2015 © BARC 2015 7
Peer Groups
The BI Survey 15 features a range of different types of BI tools so we
use peer groups to help identify competing products. Firstly, tools are
divided into those used in large-scale and mid-sized deployments
based on reported median user numbers. Products deployed in mid-
sized scenarios are further divided into regional peer groups based on
whether they have a significant presence in each geographical region,
as well as the location of respondents in The BI Survey. A final peer
group includes only large international vendors.
Qlik features in the following peer groups:
• Large international vendors
• mid-sized deployments (German-speaking
region)
• mid-sized deployments (EMEA)
• mid-sized deployments (Americas)
• mid-sized deployments (APAC)
The KPIs
The BI Survey 15 provides the reader with well-designed KPI dashboards packed with concise information, which can be
absorbed at a glance. The KPIs all follow these simple rules:
• Only measures that have a clear good/bad trend are used as the basis for KPIs
• KPIs may be based on one or more measures from The BI Survey
• Only products with samples of at least 20 - 30 (depending on the KPI) for each of the questions that feeds into the KPI
are included
• Each KPI is normalized so that the overall sample has a value of 1.0. Note that the average for each peer group will
usually be either higher or lower than 1.0 because each peer group is a subset of the overall sample.
• When viewing the peer group KPI charts, the peer group average is indicated by a dotted vertical line. The scale shows
the positive and negative deviation from the peer group average. Values to the right of the line are above average, while
values to the left are below average. The products are sorted by value in descending order.
The terms ‘top-ranked’ and ‘leader’ are used in the following KPI chart titles. ‘Top-ranked’ indicates first position. ‘Leader’
denotes a position in the top 25% of products listed in the chart.

Business benefits – Top ranked
Peer group: large international vendors
11.08.2015 © BARC 2015 8
Based on the achievement level of a variety of business benefits
0.00
-0.30 0.25
Qlik
Information Builders
Tableau
MicroStrategy
MS SSRS
IBM Cognos TM1
Infor
Oracle BI FS
MS Excel & Pow. pr.
IBM Cognos BI
SAP BO WebI
SAP BO Design St.
SAP BEx
SAP BO Analysis
SAS
Average of peer group
© BARC
THE BI Survey 15

Business benefits – Leader
Peer group: mid-sized deployments (German-speaking region)
11.08.2015 © BARC 2015 9
Based on the achievement level of a variety of business benefits
0.01
-0.40 0.30
TARGIT
Qlik
arcplan
Bissantz
Tableau
evidanza
Cubeware
cubus
MS SSRS
prevero
BOARD
IBM Cognos TM1
Corporate Planning
Infor
MS Excel & Pow. pr.
Jedox
SAP BO Design St.
SAS
Average of peer group
© BARC
THE BI Survey 15

Business benefits – Leader
Peer group: mid-sized deployments (EMEA)
11.08.2015 © BARC 2015 10
Based on the achievement level of a variety of business benefits
-0.40 0.30
PhocasDimensional Insight
TARGITYellowfin
Qlikarcplan
CyberscienceTableau
Cubewarecubus
MS SSRSBOARD
IBM Cognos TM1Pyramid Analytics
Corporate PlanningInfor
MS Excel & Pow. pr.Logi Analytics
JedoxSAP BO Design St.
SAS
Average of peer group
© BARC
THE BI Survey 15

Business benefits – Leader
Peer group: mid-sized deployments (Americas)
11.08.2015 © BARC 2015 11
Based on the achievement level of a variety of business benefits
-0.40 0.30
PhocasDimensional Insight
TARGITYellowfin
QlikarcplanChartio
CyberscienceTableau
MS SSRSDundasBOARD
IBM Cognos TM1Pyramid Analytics
InforMS Excel & Pow. pr.
Logi AnalyticsEntrinsik
SAP BO Design St.SAS
Average of peer group
© BARC
THE BI Survey 15

Business benefits – Leader
Peer group: mid-sized deployments (APAC)
11.08.2015 © BARC 2015 12
Based on the achievement level of a variety of business benefits
0.00
-0.40 0.30
Phocas
Yellowfin
Qlik
arcplan
Tableau
MS SSRS
IBM Cognos TM1
CALUMO
Infor
MS Excel & Pow. pr.
SAP BO Design St.
SAS© BARC
THE BI Survey 15
Average of peer group

Project success – Leader
Peer group: large international vendors
11.08.2015 © BARC 2015 13
Based on the implementation satisfaction level and the frequency of projects completed on time and on
budget
0.00
-0.20 0.20
Tableau
Qlik
IBM Cognos TM1
Information Builders
MS SSRS
SAP BO Analysis
SAP BO Design St.
MicroStrategy
MS Excel & Pow. pr.
Infor
IBM Cognos BI
SAP BO WebI
SAP BEx
Oracle BI FS
SAS
Average of peer group
© BARC
THE BI Survey 15

Investment per seat – Leader
Peer group: mid-sized deployments (German-speaking region)
11.08.2015 © BARC 2015 14
Based on median license fees, annual fees and external implementation fees, adjusted by the number of
users
-0.90 3.30
MS Excel & Pow. pr.
Qlik
cubus
Cubeware
Tableau
arcplan
BOARD
Jedox
Infor
Bissantz
evidanza
Average of peer group
© BARC
THE BI Survey 15

Investment per seat – Leader
Peer group: mid-sized deployments (EMEA)
11.08.2015 © BARC 2015 15
Based on median license fees, annual fees and external implementation fees, adjusted by the number of
users
-0.80 3.20
MS Excel & Pow. pr.
Phocas
Qlik
cubus
Cubeware
Pyramid Analytics
Tableau
arcplan
Dimensional Insight
Cyberscience
BOARD
Jedox
Yellowfin
Infor© BARC
THE BI Survey 15
Average of peer group

Investment per seat – Leader
Peer group: mid-sized deployments (Americas)
11.08.2015 © BARC 2015 16
Based on median license fees, annual fees and external implementation fees, adjusted by the number of
users
-0.80 3.20
MS Excel & Pow. pr.
Phocas
Qlik
Pyramid Analytics
Tableau
arcplan
Dimensional Insight
Cyberscience
BOARD
Yellowfin
Infor
Average of peer group
© BARC
THE BI Survey 15

Investment per seat – Leader
Peer group: mid-sized deployments (APAC)
11.08.2015 © BARC 2015 17
Based on median license fees, annual fees and external implementation fees, adjusted by the number of
users
0.01
-1.00 3.10
MS Excel & Pow. pr.
Phocas
Qlik
Tableau
arcplan
Yellowfin
Infor
CALUMO© BARC
THE BI Survey 15
Average of peer group

Investment – Leader
Peer group: mid-sized deployments (German-speaking region)
11.08.2015 © BARC 2015 18
Based on a combination of the ‘Investment per seat’, ‘Seats per admin’ and 'Price-to-value perception' KPIs
0.04
-0.50 1.60
MS Excel & Pow. pr.
cubus
Cubeware
Qlik
arcplan
BOARD
Tableau
Jedox
Infor
evidanza
Bissantz
Average of peer group
© BARC
THE BI Survey 15

Investment – Leader
Peer group: mid-sized deployments (Americas)
11.08.2015 © BARC 2015 19
Based on a combination of the ‘Investment per seat’, ‘Seats per admin’ and 'Price-to-value perception' KPIs
0.02
0.01
-0.01
-0.50 1.60
MS Excel & Pow. pr.
Phocas
Pyramid Analytics
Qlik
arcplan
Dimensional Insight
BOARD
Tableau
Cyberscience
Yellowfin
Infor
Average of peer group
© BARC
THE BI Survey 15

Polystructured data analysis – Leader
Peer group: large international vendors
11.08.2015 © BARC 2015 20
Based on how many sites currently use machine data analysis, text data analysis and social media analysis
with their BI tool
-0.01
-0.02
-0.70 1.10
Tableau
SAS
MS Excel & Pow. pr.
Qlik
MS SSRS
IBM Cognos BI
Information Builders
MicroStrategy
IBM Cognos TM1
Oracle BI FS
SAP BO WebI
Infor
SAP BO Design St.
SAP BEx
SAP BO Analysis
Average of peer group
© BARC
THE BI Survey 15

Polystructured data analysis – Leader
Peer group: mid-sized deployments (German-speaking region)
11.08.2015 © BARC 2015 21
Based on how many sites currently use machine data analysis, text data analysis and social media analysis
with their BI tool
-0.02
-0.60 1.10
Tableau
SAS
TARGIT
MS Excel & Pow. pr.
Qlik
MS SSRS
evidanza
Bissantz
IBM Cognos TM1
Jedox
cubus
arcplan
Cubeware
Infor
prevero
SAP BO Design St.
BOARD
Corporate Planning
Average of peer group
© BARC
THE BI Survey 15

Polystructured data analysis – Leader
Peer group: mid-sized deployments (EMEA)
11.08.2015 © BARC 2015 22
Based on how many sites currently use machine data analysis, text data analysis and social media analysis
with their BI tool
-0.70 1.00
TableauSAS
TARGITMS Excel & Pow. pr.
QlikCyberscience
YellowfinMS SSRS
PhocasLogi Analytics
Pyramid AnalyticsDimensional Insight
IBM Cognos TM1Jedoxcubus
arcplanCubeware
InforSAP BO Design St.
BOARDCorporate Planning
Average of peer group
© BARC
THE BI Survey 15

Considered for purchase – Top ranked
Peer group: large international vendors
11.08.2015 © BARC 2015 23
Based on whether respondents considered purchasing the product
-1.30 2.40
Qlik
MS Excel & Pow. pr.
Tableau
MS SSRS
IBM Cognos BI
SAP BO WebI
SAP BO Analysis
IBM Cognos TM1
MicroStrategy
Oracle BI FS
SAP BO Design St.
SAP BEx
SAS
Infor
Information Builders
Average of peer group
© BARC
THE BI Survey 15

Considered for purchase – Top ranked
Peer group: mid-sized deployments (German-speaking region)
11.08.2015 © BARC 2015 24
Based on whether respondents considered purchasing the product
-1.00 2.90
Qlik
MS Excel & Pow. pr.
Tableau
MS SSRS
IBM Cognos TM1
SAP BO Design St.
Cubeware
SAS
BOARD
arcplan
Infor
Bissantz
Jedox
Corporate Planning
evidanza
prevero
TARGIT
cubus
Average of peer group
© BARC
THE BI Survey 15

Considered for purchase – Top ranked
Peer group: mid-sized deployments (EMEA)
11.08.2015 © BARC 2015 25
Based on whether respondents considered purchasing the product
-0.90 3.10
QlikMS Excel & Pow. pr.
TableauMS SSRS
IBM Cognos TM1SAP BO Design St.
CubewareSAS
BOARDarcplan
InforJedox
Corporate PlanningCyberscience
YellowfinDimensional Insight
TARGITcubus
Pyramid AnalyticsLogi Analytics
Phocas
Average of peer group
© BARC
THE BI Survey 15

Considered for purchase – Top ranked
Peer group: mid-sized deployments (Americas)
11.08.2015 © BARC 2015 26
Based on whether respondents considered purchasing the product
-0.90 3.10
QlikMS Excel & Pow. pr.
TableauMS SSRS
IBM Cognos TM1SAP BO Design St.
SASBOARDarcplan
InforCyberscience
YellowfinDundas
Dimensional InsightTARGIT
Pyramid AnalyticsLogi Analytics
EntrinsikPhocasChartio
Average of peer group
© BARC
THE BI Survey 15

Considered for purchase – Top ranked
Peer group: mid-sized deployments (APAC)
11.08.2015 © BARC 2015 27
Based on whether respondents considered purchasing the product
-0.05
-1.40 2.70
Qlik
MS Excel & Pow. pr.
Tableau
MS SSRS
IBM Cognos TM1
SAP BO Design St.
SAS
arcplan
Infor
Yellowfin
Phocas
CALUMO© BARC
THE BI Survey 15
Average of peer group

Competitiveness – Top ranked
Peer group: large international vendors
11.08.2015 © BARC 2015 28
Combines the ‘Considered for purchase’, ‘Competitive win rate’ and ‘Chosen as standard’ KPIs
-0.50 0.80
Qlik
MS Excel & Pow. pr.
MS SSRS
Tableau
SAP BO WebI
IBM Cognos BI
SAP BEx
SAP BO Analysis
SAP BO Design St.
IBM Cognos TM1
MicroStrategy
Oracle BI FS
SAS
Information Builders
Infor
Average of peer group
© BARC
THE BI Survey 15

Competitiveness – Top ranked
Peer group: mid-sized deployments (German-speaking region)
11.08.2015 © BARC 2015 29
Combines the ‘Considered for purchase’, ‘Competitive win rate’ and ‘Chosen as standard’ KPIs
0.02
-0.50 1.00
Qlik
MS Excel & Pow. pr.
MS SSRS
Tableau
SAP BO Design St.
IBM Cognos TM1
Bissantz
arcplan
SAS
cubus
Cubeware
TARGIT
evidanza
Infor
Jedox
BOARD
Corporate Planning
prevero
Average of peer group
© BARC
THE BI Survey 15

Competitiveness – Top ranked
Peer group: mid-sized deployments (EMEA)
11.08.2015 © BARC 2015 30
Combines the ‘Considered for purchase’, ‘Competitive win rate’ and ‘Chosen as standard’ KPIs
0.01
-0.40 1.00
Qlik
MS SSRS
SAP BO Design St.
Cyberscience
Dimensional Insight
SAS
Cubeware
TARGIT
Jedox
Yellowfin
Corporate Planning
Average of peer group
© BARC
THE BI Survey 15

Competitiveness – Top ranked
Peer group: mid-sized deployments (Americas)
11.08.2015 © BARC 2015 31
Combines the ‘Considered for purchase’, ‘Competitive win rate’ and ‘Chosen as standard’ KPIs
0.01-0.01
-0.40 1.00
QlikMS Excel & Pow. pr.
MS SSRSTableau
SAP BO Design St.IBM Cognos TM1
CybersciencePhocasChartio
Dimensional InsightEntrinsikarcplan
SASPyramid Analytics
TARGITInfor
BOARDYellowfin
Logi AnalyticsDundas
Average of peer group
© BARC
THE BI Survey 15

Competitiveness – Top ranked
Peer group: mid-sized deployments (APAC)
11.08.2015 © BARC 2015 32
Combines the ‘Considered for purchase’, ‘Competitive win rate’ and ‘Chosen as standard’ KPIs
-0.50 0.80
Qlik
MS Excel & Pow. pr.
MS SSRS
Tableau
SAP BO Design St.
IBM Cognos TM1
CALUMO
Phocas
arcplan
SAS
Infor
Yellowfin© BARC
THE BI Survey 15
Average of peer group

Recommendation – Leader
Peer group: large international vendors
11.08.2015 © BARC 2015 33
Based on how many users would recommend the product to others
-0.70 0.60
Tableau
Qlik
Information Builders
IBM Cognos TM1
MS SSRS
SAP BO Design St.
MicroStrategy
MS Excel & Pow. pr.
SAP BO WebI
SAP BO Analysis
SAS
IBM Cognos BI
Infor
Oracle BI FS
SAP BEx
Average of peer group
© BARC
THE BI Survey 15

Recommendation – Leader
Peer group: mid-sized deployments (German-speaking region)
11.08.2015 © BARC 2015 34
Based on how many users would recommend the product to others
-0.70 0.40
Bissantz
TARGIT
Tableau
cubus
Qlik
BOARD
Jedox
prevero
IBM Cognos TM1
evidanza
arcplan
Corporate Planning
MS SSRS
SAP BO Design St.
MS Excel & Pow. pr.
Cubeware
SAS
Infor
Average of peer group
© BARC
THE BI Survey 15

Collaboration – Leader
Peer group: large international vendors
11.08.2015 © BARC 2015 35
Based on how many sites currently use collaboration features with their BI tool
-0.01
-0.60 0.80
MS Excel & Pow. pr.
Tableau
Qlik
Oracle BI FS
SAP BO Analysis
Information Builders
Infor
MicroStrategy
SAS
IBM Cognos TM1
MS SSRS
SAP BO WebI
SAP BO Design St.
IBM Cognos BI
SAP BEx
Average of peer group
© BARC
THE BI Survey 15

Data discovery/visualization – Leader
Peer group: large international vendors
11.08.2015 © BARC 2015 36
Based on how many sites currently use data discovery/visualization with their BI tool
0.00
-0.50 0.80
Tableau
Qlik
MS Excel & Pow. pr.
MicroStrategy
Oracle BI FS
SAP BO WebI
MS SSRS
SAP BO Design St.
SAS
IBM Cognos BI
Information Builders
Infor
SAP BEx
SAP BO Analysis
IBM Cognos TM1
Average of peer group
© BARC
THE BI Survey 15

Data discovery/visualization – Leader
Peer group: mid-sized deployments (German-speaking region)
11.08.2015 © BARC 2015 37
Based on how many sites currently use data discovery/visualization with their BI tool
0.01
-0.50 0.80
Tableau
Qlik
TARGIT
MS Excel & Pow. pr.
Bissantz
BOARD
MS SSRS
SAP BO Design St.
SAS
cubus
evidanza
Jedox
arcplan
Cubeware
Corporate Planning
Infor
prevero
IBM Cognos TM1
Average of peer group
© BARC
THE BI Survey 15

Data discovery/visualization – Leader
Peer group: mid-sized deployments (EMEA)
11.08.2015 © BARC 2015 38
Based on how many sites currently use data discovery/visualization with their BI tool
-0.60 0.60
TableauYellowfin
Pyramid AnalyticsQlik
Dimensional InsightPhocas
CyberscienceTARGIT
Logi AnalyticsMS Excel & Pow. pr.
BOARDMS SSRS
SAP BO Design St.SAS
cubusJedox
arcplanCubeware
Corporate PlanningInfor
IBM Cognos TM1
Average of peer group
© BARC
THE BI Survey 15

Data discovery/visualization – Leader
Peer group: mid-sized deployments (Americas)
11.08.2015 © BARC 2015 39
Based on how many sites currently use data discovery/visualization with their BI tool
0.00
-0.70 0.60
ChartioTableau
YellowfinPyramid Analytics
QlikDimensional Insight
PhocasCyberscience
DundasTARGIT
Logi AnalyticsMS Excel & Pow. pr.
BOARDEntrinsik
MS SSRSSAP BO Design St.
SASarcplan
InforIBM Cognos TM1
Average of peer group
© BARC
THE BI Survey 15

Data discovery/visualization – Leader
Peer group: mid-sized deployments (APAC)
11.08.2015 © BARC 2015 40
Based on how many sites currently use data discovery/visualization with their BI tool
-0.60 0.70
Tableau
Yellowfin
Qlik
Phocas
MS Excel & Pow. pr.
MS SSRS
SAP BO Design St.
SAS
arcplan
CALUMO
Infor
IBM Cognos TM1© BARC
THE BI Survey 15
Average of peer group

Mobile BI – Leader
Peer group: large international vendors
11.08.2015 © BARC 2015 41
Based on how many sites currently use mobile BI with their BI tool
-0.03
-1.00 1.30
SAP BO Design St.
Tableau
MicroStrategy
Qlik
Oracle BI FS
Information Builders
IBM Cognos BI
SAP BO WebI
SAP BEx
MS Excel & Pow. pr.
MS SSRS
Infor
SAS
IBM Cognos TM1
SAP BO Analysis
Average of peer group
© BARC
THE BI Survey 15

Mobile BI – Leader
Peer group: mid-sized deployments (German-speaking region)
11.08.2015 © BARC 2015 42
Based on how many sites currently use mobile BI with their BI tool
-0.90 1.40
SAP BO Design St.
Tableau
TARGIT
Qlik
evidanza
Bissantz
arcplan
Cubeware
Jedox
MS Excel & Pow. pr.
MS SSRS
BOARD
Infor
Corporate Planning
cubus
SAS
IBM Cognos TM1
prevero
Average of peer group
© BARC
THE BI Survey 15

Location intelligence – Leader
Peer group: large international vendors
11.08.2015 © BARC 2015 43
Based on how many sites currently use spatial/location analysis with their BI tool
-0.03
-1.00 2.10
Tableau
IBM Cognos BI
Qlik
MicroStrategy
MS Excel & Pow. pr.
Information Builders
MS SSRS
SAS
Oracle BI FS
SAP BO Design St.
IBM Cognos TM1
SAP BO WebI
SAP BEx
Infor
SAP BO Analysis
Average of peer group
© BARC
THE BI Survey 15

Location intelligence – Leader
Peer group: mid-sized deployments (German-speaking region)
11.08.2015 © BARC 2015 44
Based on how many sites currently use spatial/location analysis with their BI tool
-0.03
-0.05
-1.00 2.10
Tableau
Bissantz
evidanza
Qlik
MS Excel & Pow. pr.
TARGIT
MS SSRS
arcplan
Cubeware
SAS
cubus
SAP BO Design St.
BOARD
IBM Cognos TM1
Jedox
Infor
Corporate Planning
prevero
Average of peer group
© BARC
THE BI Survey 15

Location intelligence – Leader
Peer group: mid-sized deployments (EMEA)
11.08.2015 © BARC 2015 45
Based on how many sites currently use spatial/location analysis with their BI tool
-0.02
-1.00 2.10
TableauYellowfin
Pyramid AnalyticsQlik
MS Excel & Pow. pr.TARGIT
MS SSRSarcplan
CubewareSAS
PhocasLogi Analytics
cubusDimensional InsightSAP BO Design St.
BOARDCyberscience
IBM Cognos TM1Jedox
InforCorporate Planning
Average of peer group
© BARC
THE BI Survey 15

Location intelligence – Leader
Peer group: mid-sized deployments (Americas)
11.08.2015 © BARC 2015 46
Based on how many sites currently use spatial/location analysis with their BI tool
-1.00 2.00
TableauYellowfin
ChartioPyramid Analytics
QlikDundas
MS Excel & Pow. pr.TARGIT
MS SSRSarcplan
SASPhocas
Logi AnalyticsDimensional InsightSAP BO Design St.
BOARDCyberscience
IBM Cognos TM1Entrinsik
Infor
Average of peer group
© BARC
THE BI Survey 15

Location intelligence – Leader
Peer group: mid-sized deployments (APAC)
11.08.2015 © BARC 2015 47
Based on how many sites currently use spatial/location analysis with their BI tool
-1.00 1.90
Tableau
Yellowfin
Qlik
MS Excel & Pow. pr.
MS SSRS
arcplan
SAS
Phocas
SAP BO Design St.
IBM Cognos TM1
CALUMO
Infor© BARC
THE BI Survey 15
Average of peer group

Innovation – Leader
Peer group: large international vendors
11.08.2015 © BARC 2015 48
Combines the ‘Cloud BI’, ‘Collaboration’, 'Data discovery/visualization', ‘Mobile BI’, 'Operational BI',
'Location intelligence' and ‘Visual design standards’ KPIs to measure the product’s level of innovation
0.01
-0.50 0.80
Tableau
SAP BO Design St.
Qlik
MS Excel & Pow. pr.
MicroStrategy
Information Builders
MS SSRS
IBM Cognos BI
Oracle BI FS
SAP BO WebI
Infor
SAS
IBM Cognos TM1
SAP BEx
SAP BO Analysis
Average of peer group
© BARC
THE BI Survey 15

Query performance – Leader
Peer group: large international vendors
11.08.2015 © BARC 2015 49
How quickly queries respond, adjusted by data volume
0.00
-0.40 0.90
SAP BO Design St.
Qlik
IBM Cognos TM1
Tableau
SAS
Infor
MS SSRS
Oracle BI FS
Information Builders
SAP BO Analysis
SAP BEx
MS Excel & Pow. pr.
IBM Cognos BI
MicroStrategy
SAP BO WebI
Average of peer group
© BARC
THE BI Survey 15

Query performance – Leader
Peer group: mid-sized deployments (German-speaking region)
11.08.2015 © BARC 2015 50
How quickly queries respond, adjusted by data volume
0.00
-0.01
-0.50 0.60
SAP BO Design St.
evidanza
Jedox
Qlik
Bissantz
Corporate Planning
TARGIT
cubus
arcplan
BOARD
IBM Cognos TM1
Tableau
prevero
Cubeware
SAS
Infor
MS SSRS
MS Excel & Pow. pr.
Average of peer group
© BARC
THE BI Survey 15

Query performance – Leader
Peer group: mid-sized deployments (EMEA)
11.08.2015 © BARC 2015 51
How quickly queries respond, adjusted by data volume
-0.01-0.02-0.03
-0.50 1.30
Dimensional InsightSAP BO Design St.
JedoxQlik
Corporate PlanningPhocas
Pyramid AnalyticsTARGIT
cubusarcplanBOARD
IBM Cognos TM1YellowfinTableau
CubewareLogi Analytics
SASInfor
MS SSRSCyberscience
MS Excel & Pow. pr.
Average of peer group
© BARC
THE BI Survey 15

Query performance – Leader
Peer group: mid-sized deployments (Americas)
11.08.2015 © BARC 2015 52
How quickly queries respond, adjusted by data volume
-0.01
-0.01
-0.01
-0.70 1.40
Dimensional Insight
SAP BO Design St.
Qlik
Phocas
Pyramid Analytics
TARGIT
arcplan
BOARD
IBM Cognos TM1
Yellowfin
Tableau
Logi Analytics
SAS
Dundas
Infor
MS SSRS
Cyberscience
MS Excel & Pow. pr.
Entrinsik
Average of peer group
© BARC
THE BI Survey 15

Query performance – Leader
Peer group: mid-sized deployments (APAC)
11.08.2015 © BARC 2015 53
How quickly queries respond, adjusted by data volume
-0.01
-0.01
-0.40 0.70
SAP BO Design St.
Qlik
Phocas
arcplan
IBM Cognos TM1
Yellowfin
Tableau
SAS
Infor
MS SSRS
MS Excel & Pow. pr.© BARC
THE BI Survey 15
Average of peer group

Performance satisfaction – Leader
Peer group: large international vendors
11.08.2015 © BARC 2015 54
Measures the frequency of complaints about the system’s performance
-0.30 0.20
Tableau
Qlik
IBM Cognos TM1
Information Builders
SAS
MicroStrategy
SAP BO WebI
MS SSRS
MS Excel & Pow. pr.
Oracle BI FS
Infor
SAP BO Analysis
IBM Cognos BI
SAP BO Design St.
SAP BEx
Average of peer group
© BARC
THE BI Survey 15

Performance satisfaction – Leader
Peer group: mid-sized deployments (German-speaking region)
11.08.2015 © BARC 2015 55
Measures the frequency of complaints about the system’s performance
-0.01
-0.40 0.30
Jedox
Tableau
Qlik
Bissantz
IBM Cognos TM1
evidanza
TARGIT
cubus
SAS
BOARD
arcplan
MS SSRS
Corporate Planning
MS Excel & Pow. pr.
prevero
Infor
Cubeware
SAP BO Design St.
Average of peer group
© BARC
THE BI Survey 15

Performance – Top ranked
Peer group: large international vendors
11.08.2015 © BARC 2015 56
A combination of the ‘Query performance’ and ‘Performance satisfaction’ KPIs
0.00
-0.30 0.40
Qlik
SAP BO Design St.
IBM Cognos TM1
Tableau
SAS
Information Builders
MS SSRS
Oracle BI FS
Infor
MS Excel & Pow. pr.
MicroStrategy
SAP BO Analysis
SAP BO WebI
SAP BEx
IBM Cognos BI
Average of peer group
© BARC
THE BI Survey 15

Performance – Leader
Peer group: mid-sized deployments (German-speaking region)
11.08.2015 © BARC 2015 57
A combination of the ‘Query performance’ and ‘Performance satisfaction’ KPIs
0.00
-0.30 0.30
evidanza
Jedox
Qlik
Bissantz
SAP BO Design St.
TARGIT
cubus
Corporate Planning
IBM Cognos TM1
Tableau
arcplan
BOARD
SAS
prevero
MS SSRS
Cubeware
Infor
MS Excel & Pow. pr.
Average of peer group
© BARC
THE BI Survey 15

Performance – Leader
Peer group: mid-sized deployments (EMEA)
11.08.2015 © BARC 2015 58
A combination of the ‘Query performance’ and ‘Performance satisfaction’ KPIs
0.010.01
-0.01
-0.30 0.70
Dimensional InsightJedox
QlikPhocas
SAP BO Design St.Pyramid Analytics
YellowfinTARGIT
cubusCorporate Planning
IBM Cognos TM1TableauarcplanBOARD
CyberscienceSAS
Logi AnalyticsMS SSRSCubeware
InforMS Excel & Pow. pr.
Average of peer group
© BARC
THE BI Survey 15

Performance – Leader
Peer group: mid-sized deployments (Americas)
11.08.2015 © BARC 2015 59
A combination of the ‘Query performance’ and ‘Performance satisfaction’ KPIs
0.01
0.00
-0.01
-0.40 0.80
Dimensional Insight
Qlik
Phocas
SAP BO Design St.
Pyramid Analytics
Yellowfin
TARGIT
IBM Cognos TM1
Tableau
arcplan
BOARD
Cyberscience
Dundas
SAS
Logi Analytics
MS SSRS
Infor
MS Excel & Pow. pr.
Entrinsik
Average of peer group
© BARC
THE BI Survey 15

Performance – Top ranked
Peer group: mid-sized deployments (APAC)
11.08.2015 © BARC 2015 60
A combination of the ‘Query performance’ and ‘Performance satisfaction’ KPIs
0.01
-0.30 0.30
Qlik
Phocas
SAP BO Design St.
Yellowfin
IBM Cognos TM1
Tableau
arcplan
SAS
MS SSRS
Infor
MS Excel & Pow. pr.© BARC
THE BI Survey 15
Average of peer group

Product satisfaction – Top ranked
Peer group: large international vendors
11.08.2015 © BARC 2015 61
Based on the frequency of problems encountered with the product
-0.50 0.80
Qlik
Tableau
IBM Cognos TM1
SAS
Information Builders
MicroStrategy
MS Excel & Pow. pr.
MS SSRS
Infor
IBM Cognos BI
Oracle BI FS
SAP BO WebI
SAP BEx
SAP BO Analysis
SAP BO Design St.
Average of peer group
© BARC
THE BI Survey 15

Product satisfaction – Leader
Peer group: mid-sized deployments (APAC)
11.08.2015 © BARC 2015 62
Based on the frequency of problems encountered with the product
0.00
-0.90 1.30
Phocas
Qlik
arcplan
CALUMO
Yellowfin
Tableau
IBM Cognos TM1
SAS
MS Excel & Pow. pr.
MS SSRS
Infor
SAP BO Design St.© BARC
THE BI Survey 15
Average of peer group

Vendor support – Leader
Peer group: large international vendors
11.08.2015 © BARC 2015 63
Measures user satisfaction with the level of vendor support provided for the product
-0.50 0.50
Information Builders
Tableau
Qlik
SAS
MicroStrategy
SAP BO Design St.
Infor
MS SSRS
SAP BO Analysis
IBM Cognos TM1
SAP BEx
MS Excel & Pow. pr.
IBM Cognos BI
Oracle BI FS
SAP BO WebI
Average of peer group
© BARC
THE BI Survey 15

Implementer support – Leader
Peer group: large international vendors
11.08.2015 © BARC 2015 64
Measures user satisfaction with the level of the implementer’s support for the product
0.00
0.00
-0.30 0.40
Information Builders
IBM Cognos TM1
Qlik
Tableau
MicroStrategy
SAS
MS SSRS
SAP BO WebI
MS Excel & Pow. pr.
SAP BEx
Infor
Oracle BI FS
IBM Cognos BI
Average of peer group
© BARC
THE BI Survey 15

Customer satisfaction – Top ranked
Peer group: large international vendors
11.08.2015 © BARC 2015 65
Combines the ‘Product satisfaction’, ‘Vendor support’ and ‘Implementer support’ KPIs
-0.40 0.40
Qlik
Tableau
Information Builders
SAS
IBM Cognos TM1
MicroStrategy
MS SSRS
Infor
MS Excel & Pow. pr.
SAP BEx
IBM Cognos BI
SAP BO WebI
Oracle BI FS
Average of peer group
© BARC
THE BI Survey 15

Flexibility for users – Leader
Peer group: large international vendors
11.08.2015 © BARC 2015 66
Based on how often the product was chosen for its flexibility, and on the frequency of complaints about user
flexibility post-implementation
0.00
-0.40 0.40
Tableau
Qlik
IBM Cognos TM1
Information Builders
Infor
SAP BO Design St.
MS Excel & Pow. pr.
SAS
MicroStrategy
IBM Cognos BI
MS SSRS
SAP BO Analysis
SAP BO WebI
Oracle BI FS
SAP BEx
Average of peer group
© BARC
THE BI Survey 15

Ease of use – Leader
Peer group: large international vendors
11.08.2015 © BARC 2015 67
Based on how often the product was chosen for its ease of use, and on the level of complaints about ease
of use post-implementation
0.00
-0.50 0.70
Tableau
Qlik
Information Builders
SAP BO WebI
MS Excel & Pow. pr.
MicroStrategy
SAP BO Design St.
MS SSRS
SAP BO Analysis
IBM Cognos TM1
Oracle BI FS
IBM Cognos BI
Infor
SAS
SAP BEx
Average of peer group
© BARC
THE BI Survey 15

Ease of use – Leader
Peer group: mid-sized deployments (German-speaking region)
11.08.2015 © BARC 2015 68
Based on how often the product was chosen for its ease of use, and on the level of complaints about ease
of use post-implementation
0.00
-0.50 0.60
Tableau
BOARD
Qlik
cubus
Jedox
arcplan
TARGIT
Cubeware
MS Excel & Pow. pr.
prevero
Corporate Planning
Bissantz
SAP BO Design St.
MS SSRS
evidanza
IBM Cognos TM1
Infor
SAS
Average of peer group
© BARC
THE BI Survey 15