head vanguard’s economic and investment outlook · the return outlook for fixed income remains...
TRANSCRIPT

Vanguard Research September 2014
Head
■■ Global growth will remain frustratingly fragile in 2016. Global trade and manufacturing activity will likely struggle, and additional “growth scares” should be expected. Nevertheless, Vanguard’s non-consensus view is that the world’s ongoing structural deceleration is converging toward a more balanced growth equilibrium. This structural convergence is not yet complete, given the need for debt deleveraging in China and other emerging markets.
■■ In Australia, risks remain tilted to the downside, as the economy navigates a difficult transition from mining-led to broad-based growth. A cyclical economic recovery is likely to emerge over coming years as the drag from mining investment fades, however, in our view this is unlikely until 2017 at the earliest.
■■ As we have discussed in Vanguard’s past outlooks, policymakers are likely to continue to face difficulties achieving 2% inflation over the medium term. As of December 2015, however, some of the most pernicious long-term deflationary forces are beginning to moderate cyclically for the first time since 2006.
■■ We anticipate a “dovish tightening” cycle by the U.S. Federal Reserve, and we continue to view the global low-rate environment as secular, not cyclical. Although not bearish, Vanguard’s outlook for bonds remains guarded, given the low interest rate environment.
■■ Vanguard’s outlook for global stocks is broadly unchanged since 12 months ago, with returns centred in the range 7% to 10%. In our view, Australian and global ex Australia stocks do not appear to be overvalued.
■■ Going forward, the investment environment is likely to be more challenging and volatile. Investors with an appropriate level of discipline, diversification, and patience are likely to be rewarded over the next decade with fair inflation-adjusted returns.
Vanguard Research December 2015
Vanguard’s economic and investment outlookAustralian edition

2
Vanguard Investment Strategy GroupVanguard Global Economics Team
Joseph Davis, Ph.D. Global Chief Economist
Americas
Roger A. Aliaga-Díaz, Ph.D. Principal and Senior Economist
Harshdeep Ahluwalia, M.Sc.
Michael DiJoseph, CFA
Vytautas Maciulis, CFA
Zoe B. Odenwalder
David Pakula
Andrew J. Patterson, CFA
Christos Tasopoulos, M.Sc.
Ravi Tolani
Matthew C. Tufano
Europe
Peter Westaway, Ph.D. Chief Economist, Europe
Biola Babawale, M.Sc.
Tom Kynge
Asia-Pacific
Qian Wang, Ph.D. Senior Economist
Alexis Gray, M.Sc.
Jessica Mengqi Wu, M.Sc.
Editorial noteThis publication is an update of Vanguard’s annual Economic and Investment Outlook. We present our economic and market perspectives for 2016 for key economies around the globe. Aided by Vanguard Capital Markets Model® simulations and other research, we also forecast future performance for a broad array of fixed income and equity asset classes.
AcknowledgmentsWe thank Lara de la Iglesia for her significant contributions to this piece and the work of the Global Economics Team. Further, we would like to acknowledge the work of Vanguard’s broader Investment Strategy Group, without whose tireless research efforts this piece would not be possible.
Lead authors
Joseph Davis, Ph.D.Global Chief Economist
Roger A. Aliaga-Díaz, Ph.D.Principal and Senior Economist
Peter Westaway, Ph.D.Chief Economist, Europe
Qian Wang, Ph.D.Senior Economist
Alexis Gray, M.Sc.Economist
Harshdeep Ahluwalia, M.Sc.Senior Investment Strategist
3
ContentsGlobal outlook summary ................................................................................................................................................................................................4
I. Global economic perspectives ...................................................................................................................................................................6 Global economic outlook: Sustained fragility, structural convergence ............................................................................................6
Australia: Moderate growth with downside risks ............................................................................................................................................. 10
China: Sharp slowdown, but no recession ................................................................................................................................................................13
Japan: Monetary policy can’t act alone ........................................................................................................................................................................15
Euro area: Some bright spots emerging ......................................................................................................................................................................15
United States: At full employment, trend-like growth .................................................................................................................................. 16
Emerging markets: Structural slowdown, although systemic crisis unlikely in 2016 .....................................................18
II. Global capital markets outlook ...............................................................................................................................................................20 Global fixed income markets .................................................................................................................................................................................................... 20
Global equity markets ...................................................................................................................................................................................................................... 24
Implications for balanced portfolios...................................................................................................................................................................................28
III. Appendix: Vanguard Capital Markets Model® and index benchmarks .....................30
Notes on asset-return distributions
The asset-return distributions shown here represent Vanguard’s view on the potential range of risk premiums that may occur over the next ten years; such long-term projections are not intended to be extrapolated into a short-term view. These potential outcomes for long-term investment returns are generated by the Vanguard Capital Markets Model® (VCMM—see also the description in the appendix) and reflect the collective perspective of our Investment Strategy Group. The expected risk premiums—and the uncertainty surrounding those expectations—are among a number of qualitative and quantitative inputs used in Vanguard’s investment methodology and portfolio construction process.
IMPORTANT: The projections or other information generated by the VCMM regarding the likelihood of various investment outcomes are hypothetical in nature, do not reflect actual investment results, and are not guarantees of future results. Distribution of return outcomes from the VCMM are derived from 10,000 simulations for each modeled asset class. Simulations are as of September 30, 2015. Results from the model may vary with each use and over time. For more information, see the appendix.
Vanguard’s distinct approach to forecastingTo treat the future with the deference it deserves, Vanguard believes that market forecasts are best viewed in a probabilistic framework. This publication’s primary objectives are to describe the projected long-term return distributions that contribute to strategic
asset allocation decisions and to present the rationale for the ranges and probabilities of potential outcomes. This analysis discusses our global outlook from the perspective of an Australian investor with a dollar-denominated portfolio.
4
Global outlook summary Global economy: Structural convergence
World economic growth will remain frustratingly fragile. As in past versions of Vanguard’s Economic and Investment Outlook, we view a world not in secular stagnation but, rather, in the midst of structural deceleration. Vanguard’s non-consensus view is that the global economy will ultimately converge over time toward a more balanced, unlevered, and healthier equilibrium, once the debt-deleveraging cycle in the global private sector is complete.
Most significantly, the high-growth “Goldilocks” era enjoyed by many emerging markets over the past 15 years is over. We anticipate “sustained fragility” for global trade and manufacturing, given China’s ongoing rebalancing and until structural, business-model adjustment occurs across emerging markets. We do not anticipate a Chinese recession in the near term, but China’s investment slowdown represents the greatest downside risk.
The growth outlook for developed markets, on the other hand, remains modest, but steady. As a result, the developed economies of the United States and Europe should contribute their highest relative percentage to global growth in nearly two decades.
Australia has been in the midst of both a structural and cyclical slowdown over recent years. This has been driven by a combination of slower credit growth, slower productivity growth and more recently, by a substantial fall in mining investment. A cyclical economic recovery is likely to emerge over coming years as the drag from mining investment fades, however, in our view this is unlikely until late 2017 at the earliest. Our base case in 2016 is, therefore, 2% to 3% growth with moderate downside risks.
Now at full employment, the U.S. economy is unlikely to accelerate in 2016, yet is on course to experience its longest expansion in nearly a century, underscoring our continuing view of its resiliency. Indeed, our long-held
estimate of 2% U.S. trend growth is neither “new” nor “subpar” when one both accounts for structurally lower population growth and removes the consumer-debt-fueled boost to growth between 1980 and the global financial crisis that began in 2007. Our interpretation fully explains the persistent drop in U.S. unemployment despite below-average economic growth.
Inflation: Secular deflationary bias waning
As we have discussed in past outlooks, policymakers are likely to continue struggling to achieve 2% core inflation over the medium term. As of December 2015, however, some of the most pernicious deflationary forces (commodity prices, labour “slack”) are beginning to moderate cyclically. Inflation trends in the developed markets should firm, and even begin to turn, in 2016. That said, achieving more than 2% core inflation across developed markets could take several years and will ultimately require a more vibrant global rebound.
Monetary policy and interest rates: A ‘dovish tightening’ by a lonely Fed Convergence in global growth dynamics will continue to necessitate and generate divergence in policy responses. The U.S. Federal Reserve is likely to pursue a “dovish tightening” cycle that removes some of the unprecedented accommodation exercised due to the “exigent circumstances” of the global financial crisis. In our view, there is a high likelihood of an extended pause in interest rates at, say, 1%, that opens the door for balance-sheet normalisation and leaves the inflation-adjusted federal funds rate negative through 2017.
Elsewhere, further monetary stimulus is highly likely. The European Central Bank (ECB) and Bank of Japan (BoJ) are both likely to pursue additional quantitative easing and, as we noted in our 2015 outlook, are unlikely to raise rates this decade. This view is another potential factor that could result in a pause for the federal funds rate this business cycle.

In Australia, the low level of core inflation means the door is open for the Reserve Bank of Australia (RBA) to cut the cash rate further if the economy requires support. Importantly, any decisions made by the RBA are likely to follow close monitoring of Federal Reserve policy in 2016.
Chinese policymakers have arguably the most difficult task of engineering a “soft landing” by lowering real borrowing costs and the real exchange rate without accelerating capital outflows. The margin of error is fairly narrow, and policymakers should aggressively stimulate the economy this year in an attempt to stabilise below-target growth.
Investment outlook: Still conservative
Vanguard’s outlook for global stocks is broadly unchanged since 12 months ago, with returns centred in the range 7-10%. In our view, Australian and global ex Australia stocks do not appear to be overvalued.
Although not bearish, Vanguard’s outlook for bonds remains guarded, given the low-interest-rate environment. We continue to view the global low rate environment as secular, not cyclical.
Bonds. The return outlook for fixed income remains positive, yet muted. The expected long-run median return of the broad taxable fixed income market is centred in the 2.5%–3.5% range. It is important to note that we expect
the diversification benefits of investment-grade fixed income in a balanced portfolio to persist under most scenarios. As we stated in our 2015 outlook, even in a rising-rate environment, duration tilts are not without risks, given global inflation dynamics and our expectations for monetary policy.
Stocks. After several years of suggesting that low economic growth need not equate with poor equity returns, our medium-run outlook for global equities is centred in the range 7-10%. That said, our long-term outlook is not bearish and can even be viewed as constructive when adjusted for the low-rate environment. Our long-standing concern over “froth” in certain past high-performing segments of the capital markets has been marginally tempered by the general relative underperformance of those market segments in 2015.
Asset allocation. Going forward, the global crosscurrents of structural deceleration, and the exiting from or insufficiency of near-0% short-term rates imply that the investment environment is likely to be more challenging and volatile. Even so, Vanguard firmly believes that the principles of portfolio construction remain unchanged, given the expected risk–return trade-off among asset classes. Investors with an appropriate level of discipline, diversification, and patience are likely to be rewarded over the next decade with fair inflation-adjusted returns.
5
Indexes used in our historical calculations
The long-term returns for our hypothetical portfolios are based on data for the appropriate market indexes through September 2015. We chose these benchmarks to provide the best history possible, and we split the global allocations to align with Vanguard’s guidance in constructing diversified portfolios.
Australian equities: ASX All Ordinaries Index from 1958 through 1969; MSCI Australia Index thereafter.
Australian bonds: Bloomberg Ausbond Composite Index from 1989 through 2004, and Barclays Australian Aggregate Bond Index thereafter.
Global ex-Australia equities: S&P 500 Index from 1958 through 1969; MSCI World Ex Australia Index from 1970 through 1987; MSCI ACWI Ex Australia Index thereafter.
Global ex-Australia bonds: Standard & Poor’s High Grade Corporate Index from 1958 through 1968, Citigroup High Grade Index from 1969 through 1972, Lehman Brothers U.S. Long Credit AA Index from 1973 through 1975, and Barclays U.S. Aggregate Bond Index from 1975 through 1989, Barclays Global Aggregate from 1990 through 2001 and Barclays Global Aggregate Ex AUD Index thereafter.
Global equities: 50% Australian equities and 50% Global Ex-Australian equities.
Global bonds: 40% Australian bonds and 60% Global Ex-Australian bonds.

I. Global economic perspectives
Global economic outlook: Sustained fragility, structural convergence
Global growth will remain frustratingly fragile in 2016. As in past versions of Vanguard’s Economic and Investment Outlook, we view a world economy in the midst of structural deceleration (see Figure I-1). Indeed, Vanguard’s non-consensus view is that the global economy will ultimately converge over time toward a more balanced, unlevered, and healthier equilibrium, once the debt-deleveraging cycle in the global private
sector is complete (this will not occur in 2016). We believe that those who see an even weaker future of secular stagnation are too pessimistic with respect to future productivity growth (which is cyclically depressed) and are overlooking the benefits of an unlevered expansion.
Based on unfavourable demographics worldwide and a lower or negative contribution from private-sector debt and credit expansion, the gap in gross domestic product (GDP) growth between emerging markets and developed economies should converge, a structural theme that is a reversal of the past 15 years (see Figure I-2). Adverse demographic projections have been anticipated for years, and are a drag on long-term growth affecting both developed and emerging market economies.2
6
Figure I-1. Most of the world is in structural deceleration
A scorecard for growth convergence
United States
Euro area China Japan
United Kingdom Canada Australia
Percentage of world GDP 22.4% 17.1% 13.3% 6.2% 3.7% 2.3% 1.9%
Estimated trend growth rates (%)
Pre-recession average (1990–2007) 3.0 2.0 10.0 1.4 2.9 2.5 3.4
Projected future (2016–2020) 2.1 1.5 6.3 0.5 2.1 2.0 2.8
Growth headwinds
Slowing growth of labour force Slower population growth and aging of population
Private-sector debt deleveraging Debt-deleveraging cycle, constraining willingness to spend
Sluggish capital investment Falling cost of technology and demographic effects on businesses’ growth plans
Fiscal sustainability and committed fiscal austerity Unsustainable debt dynamics may result in suboptimal policies and uncertainty
Commodity exports dependency Weak commodity price outlook
Currency strength Tighter financial conditions, weaker manufacturing and exports
Rising income inequality Falling purchasing power of consumers with highest propensity to spend
■ Highly significant factor ■ Moderately significant factor ■ Factor not present
Notes: Slowing growth of labour force: Birth rates minus mortality rates (slope of the trend line, 1960–present); Private-sector debt deleveraging: Percentage increase in household debt (% of GDP) from 2008 to December 2015; Sluggish capital investment: Difference between average fixed capital formation as percentage of GDP, 2000–2007 and 2008–latest; Fiscal sustainability and committed fiscal austerity: Fiscal space estimates based on Moody’s Economy.com model, as of February 2015 and difference in structural government budget balance over next two years (2016–2017); Commodity exports dependency: Qualitative assessment of commodity export dependence; Currency strength: Level of real effective exchange rate as of September 2015 (>100, overvalued/<100, undervalued); Rising income inequality: Average percentage point change in the income share of top 1% of income (1980–2010). Also, for China, we factor local government debt into our debt deleveraging rating.Sources: Vanguard calculations, based on data from International Monetary Fund (IMF)—World Economic Outlook, Organisation for Economic Co-operation and Development, United Nations, U.S. Bureau of Economic Analysis, U.S. Federal Reserve System, Moody’s Analytics, and Thomson Reuters Datastream.
2 Much less certain are long-term projections for future productivity growth, particularly regarding the pace of technological innovation in countries closer to the technological frontier. For developed economies, a reasonable expectation for productivity growth is that they will get back to the modest levels of the 2000s (before the global financial crisis of 2007), somewhat lower than in previous decades.

7
The ongoing and, in our view, persistent slowdown in emerging markets is a critical feature of structural convergence (Figure I-3). Most significantly, the high-growth “Goldilocks” era enjoyed by many emerging markets over the past 15 years is over. Indeed, we anticipate “sustained fragility” for the global export and manufacturing sectors, which at present are in or close to recession. Such weakness should linger for a time, given China’s ongoing rebalancing and until structural, business-model adjustment occurs across emerging markets. We do not anticipate a Chinese recession in the near term, but China’s investment slowdown represents the greatest downside risk.
Our base case holds that the six-year-old global recovery continues in 2016 at a modest pace, marked by occasional “growth scares” in an environment of lower trend growth.
The growth outlook for developed markets, on the other hand, remains modest, but steady. As a result, the developed economies of the United States and Europe should contribute their highest relative percentage to global growth in nearly two decades.
Figure I-2. Structural deceleration = growth convergence
a. Demographic headwinds b. Narrowing growth gap
Notes: Population growth and potential GDP data and projections based on IMF estimates of output gap and real GDP growth by country. Developed and emerging market group totals estimated as GDP-weighted average of individual countries. Groupings follow IMF designation. Source: Vanguard, based on data from International Monetary Fund—World Economic Outlook, October 2015.
Per
iod
ave
rag
e g
row
th r
ate
(an
nu
al)
Per
iod
ave
rag
e g
row
th r
ate
(an
nu
al)
1.0
1.5
2.0
2.5
3.0%
0.35
0.45
0.55
0.65
0.75%
1980–2000 2000–2015 2015–2020
An
nu
alis
ed G
DP
gro
wth
Emerging markets (left axis)Developed markets (right axis)
2000–2015 2016–20200
1
2
3
4
5
7%
6
Convergence
Emerging marketsDeveloped markets
Figure I-3. Emerging market adjustment continues
a. Growth has consistently disappointed b. Pace of debt accumulation raises concerns
Sources: Vanguard calculations, based on data from IMF, Organisation for Economic Co-operation and Development, and J.P.Morgan.
GD
P g
row
th r
ate
3
4
5
6
7
8%
0
5
10
15
20
25
30
$35
$11
$32
2007 2015
U.S
. do
llars
(tr
illio
ns)
Expected as of 2010
Expected as of 2012
Expected as of 2014
Vanguard expectations
2016201420122010 20182011 2013 2015 2017
Actualgrowth

8
2016 global growth outlook: Just decent
Economic growth in the United States is expected to converge toward its long-term trend of about 2% per year, as the modest cyclical thrust of the last year fades. As Figure I-4a shows, our proprietary U.S. leading indicators dashboard points toward a slight deceleration from 2014 and 2015. The most positive (green) indicators are those associated with housing, consumer and business confidence, the service sector, and the labour market. The “red signals,” associated with manufacturing and trade, reflect, in part, a drag associated with a stronger dollar.
Using regression analysis, we mapped our proprietary indicators to a distribution of potential scenarios for U.S. economic growth in 2016, as shown in Figure I-4b. The odds of growth at or exceeding 2.5% in 2016 (28%) are lower than they had been for 2015, and are now more balanced with the potential for growth to stagnate and fall below 1% (33%). Our base case indicates convergence to the long-term trend (39%) in 2016, with growth in real GDP averaging about 2% for the year.
Notably, our forecast growth distribution for the United States in 2016 is slightly weaker than that of either the Federal Reserve or a consensus survey of economists.3
As was the case in 2015, our euro-area dashboard of leading indicators (Figure I-4c) anticipates a moderate growth acceleration in 2016. The significant decline in “red indicators” throughout 2015, as shown in the figure, is indicative of abating cyclical risks (yellow) and slight upward pressure on trend growth (green). This translates to more balanced risks around trend, with a reduction in downside risks relative to 2015 (Figure I-4d).
Our 2016 outlook for China points to a continued slowdown, notably slower than the pre-global financial crisis level of 10%. Vanguard’s proprietary economic indicators dashboard for China, shown in Figure I-4e, suggests that still-remaining areas of concern for 2016 are manufacturing, financial conditions, and housing. Figure I-4f estimates a high (71%) probability that the country’s real GDP growth will fall below 7% (these are much higher odds than our 2015 projection of 37%), with low but nontrivial odds of a “hard landing” (real GDP growth of 5% or less is forecast in 2016) estimated at 14%.
3 The Federal Reserve Bank of Philadelphia, Survey of Professional Forecasters, estimated real GDP averaging 2.6% for 2016 (as of November 13, 2015). The Federal Reserve, Summary of Economic Projections, median projection of real GDP was 2.3% for 2016 (as of September 17, 2015).
Figure I-4. Vanguard global dashboard of leading economic indicators and implied economic growth for 2016
United States: Slightly below consensus a. United States: Economic indicators b. Estimated distribution of U.S. growth outcomes, 2016
Ind
icat
ors
ab
ove
/bel
ow
tre
nd
Rea
l GD
P g
row
th (
year
-ove
r-ye
ar)
0
25
50
75
100%
Pro
bab
ility
–6
–4
6
4
2
0
–2
8
10%
1998 2000 2004 2006 2009 2013
Above-trend growth:labour marketBelow trend and positive momentum: Financial markets,consumer creditBelow trend and negative momentum: Manufacturing
Real GDP year-over-year (right axis)
0
10
20
30
40
50% Odds of a slowdown
33%
Odds of an acceleration
28%
Trendgrowth
39%
14%
19%17%
11%
Recession: Less than 0%Stagnation: 0% to 1%Trend: 1% to 2.5%Cyclical rebound: 2.5% to 3.5%Acceleration: More than 3.5%
201520112002
Notes: Distribution of growth outcomes generated by bootstrapping the residuals from a regression based on a proprietary set of leading economic indicators and historical data, estimated from 1960 to 2015 and adjusting for the time-varying trend growth rate.Sources: Vanguard calculations, based on data from Moody’s Analytics Data Buffet, U.S. Bureau of Economic Analysis, and Federal Reserve.

9
Figure I-4 (continued). Vanguard global dashboard of leading economic indicators and implied economic growth for 2016
Euro area: Slightly above consensus c. Euro area: Economic indicators d. Estimated distribution of euro area’s growth outcomes, 2016
Ind
icat
ors
ab
ove
/bel
ow
tre
nd
Rea
l GD
P g
row
th (
year
-ove
r-ye
ar)
0
25
50
75
100%
Pro
bab
ility
–6
–4
6
4
2
0
–2
8
10%
1998 2000 2004 2006 2011 2013
Above-trend growth: Lending to households, retail tradeBelow trend and positive momentum: Financial conditions, household savingsBelow trend and negative momentum: Manufacturing,business sentiment
Real GDP year-over-year (at right)
0
10
20
30
40% Odds of a slowdown
39%
Odds of an acceleration
32%
Trendgrowth
29%
22%
10%
201520092002
16%
23%
Stagnation: 0% to 1%Trend: 1% to 2%Cyclical rebound: 2% to 3%Acceleration: More than 3%
Recession: Less than 0%
Notes: Distribution of growth outcomes generated by bootstrapping the residuals from a regression based on a proprietary set of leading economic indicators and historical data, estimated from 1960 to 2015 and adjusting for time-varying trend growth rate.Sources: Vanguard calculations, based on data from Eurostat, Destatis (Federal Statistical Office of Germany), French National Institute of Statistics and Economic Studies (INSEE), Italian National Institute of Statistics (ISTAT), Instituto Nacional de Estatistica (INE, Spanish Statistical Office), Statistics Netherlands (CBS), and Thomson Reuters Datastream.
China: Slightly below consensus e. China: Economic indicators f. Estimated distribution of China’s growth outcomes, 2016
Ind
icat
ors
ab
ove
/bel
ow
tre
nd
Rea
l GD
P g
row
th (
year
-ove
r-ye
ar)
0
25
50
75
100%
Pro
bab
ility
0
2
12
10
8
6
4
14
16%
Above-trend growth: Consumption Below trend and positive momentum: Consumer and business sentiment, housing, labour marketBelow trend and negative momentum: Manufacturing,
Real GDP year-over-year (at right)
0
10
20
30
40
50% Odds of a slowdown
36%
Odds of an acceleration
29%
Trendgrowth
35%
21%
14%
22%
8%
Hard landing: Less than 5%Slowdown: 5% to 6%Trend: 6% to 7%Acceleration: 7% to 8%Acceleration to pre-crisis trend: Above 8%
1998 2002 2004 2011 2013 20151996 20092007
Notes: Distribution of growth outcomes generated by bootstrapping the residuals from a regression based on a proprietary set of leading economic indicators and historical data, estimated from 1990 to September 2015 and adjusting for the time-varying trend growth rate. “Target growth” is the 2016 growth target set by Chinese officials.Sources: Vanguard calculations, based on data from Moody’s Analytics Data Buffet, Thomson Reuters Datastream, and CEIC.

10
At full employment, the U.S. economy is unlikely to accelerate in 2016, yet is on course to experience its longest expansion in nearly a century, underscoring our continuing view of its resiliency. Indeed, our long-held estimate of 2% U.S. trend growth is neither “new” nor “subpar” when one both accounts for structurally lower population growth and removes the consumer debt-fueled boost to growth between 1980 and the global financial crisis that began in 2007.
Our interpretation (unlike those who subscribe to secular stagnation) fully explains the persistent drop in U.S. unemployment despite below-average economic growth.
Australia: Moderate growth with downside risks
Australia has been in the midst of both a structural and cyclical slowdown over recent years (Figure 1-5). The structural deceleration described in Figure 1-1 implies that the potential growth rate of the economy has gradually slowed from around 3.75% in 2000, to 2.75% today. This has been driven by a combination of slower credit growth (which is a healthy development) and slower productivity growth. Potential growth is likely to remain below 3% over the medium term unless Australia can unleash a new wave of productivity improvements. In essence, this means that the Australian economy needs to operate more efficiently than it has in the past. This will be challenging but is by no means impossible.
The cyclical slowdown, by contrast, is short term in nature and is largely due to the weakening of the Chinese economy and falling commodity prices. Australia exports a large volume of commodities to China, including iron ore and coal, which have fallen substantially in value over the past few years. As a result, Australian mining companies have cut investment and jobs, and government tax revenues from the mining industry have dwindled. The total drag on GDP growth from lower mining investment was almost 1.0% in 2014/15. This drag will persist in 2016 but should gradually recede from 2017 as mining investment stabilises at more sustainable levels. A cyclical economic recovery is therefore likely to emerge over coming years as the drag from mining investment fades, however, in our view this is unlikely until late 2016 at the earliest.
China’s ongoing slowdown will nonetheless continue to pose a threat to the Australian outlook. We estimate that if China were to slow suddenly from the current growth
rate of 7% down to 6%, it would subtract as much as 0.5% from Australian GDP growth (Figure I-10). The shock would transmit largely through the trade channel, however, financial markets would also respond negatively to a deterioration of conditions in China.
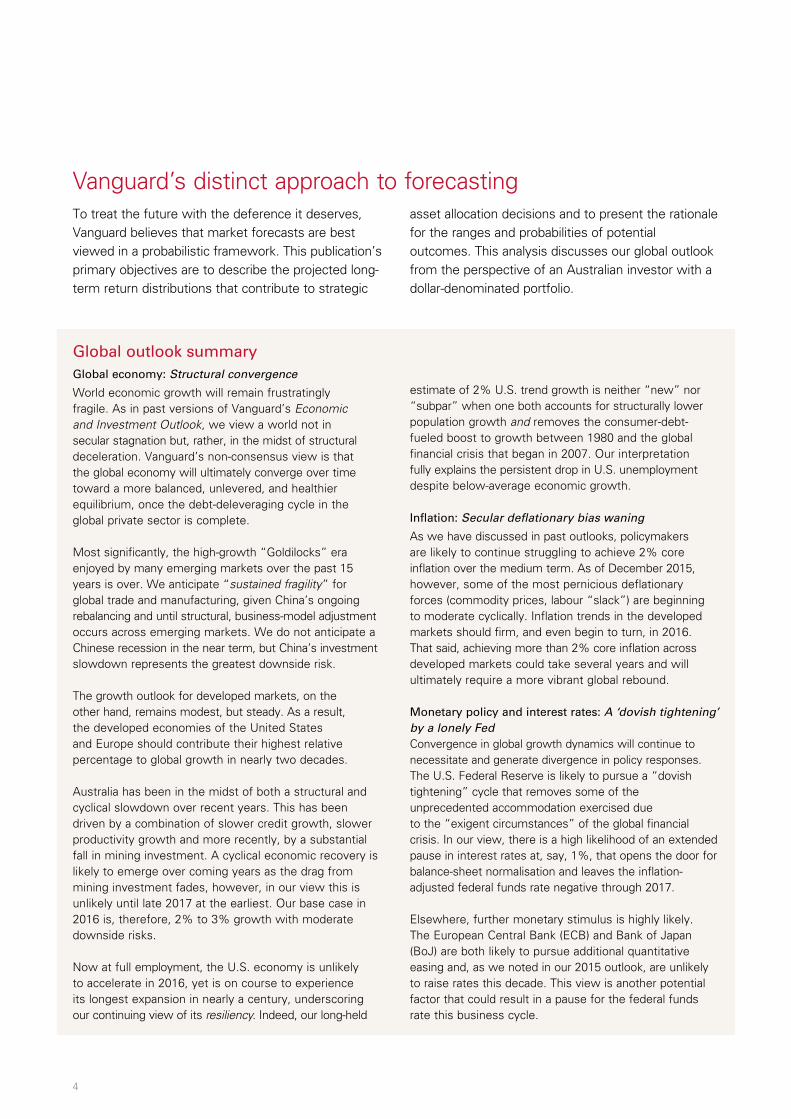
As shown in Figure I-6a, our proprietary Australian leading indicators dashboard points toward further below trend growth in 2016. This is based on the fact that the number of “green signals”, which indicate strong activity ahead, remains below 40%, while the number of “red signals” is approaching 50%. The most positive indicators are those associated with international trade, the labour market and sentiment. This suggests that the lower Australian dollar is indeed boosting exports, and that business and consumer sentiment has improved perhaps due to a mix of factors including the strong housing market, stable unemployment rate, lower currency which improves business competitiveness, and the change of Prime Minister. The more negative indicators derive from commodity and financial markets, which is not surprising given the fall in commodity prices over recent years, and the poor performance of the domestic equity market over the past six months.
Using simple regression analysis, we mapped our proprietary indicators to a distribution of potential scenarios for Australian economic growth in 2016, as shown in Figure I-6b. The odds of growth at or exceeding 3.0% in 2016 (31%) are similar to last year.
Figure 1-5. – Australian real GDP growth
Rolling 3 year annual average
1
2
3
4
5%
1995 2000 2005 2010 2015
Source: Bloomberg
11
And once again, our base case is 2 to 3% growth with moderate downside risks (38% chance of a slowdown) in 2016.
In the labour market, there is still a degree of spare capacity due to several years of sub-trend growth. This is evident in the fact that the unemployment rate remains uncomfortably high at around 6%, wage growth is weak, and many people are working fewer hours than they desire. The fact that the unemployment rate has not drifted higher signals that the labour market is quite flexible, with workers taking a pay cut and working fewer hours rather than losing their job. We do not see any evidence at the moment among our leading indicators that unemployment is likely to rise or fall on a sustained basis. In fact, we suspect the unemployment rate will maintain a central tendency of 6.0 to 6.5% over the course of the year.
Monetary policy continues to provide an important cushion to growth. Indeed, it has been clear that the low level of interest rates and the weaker Australian dollar have supported domestic and foreign demand
respectively. Net exports have added more than 1.5% to GDP annually for the past three years as the dollar has fallen. Mining has been the largest contributor to exports, and other trade-exposed industries such as tourism, agriculture, manufacturing and education should contribute more over coming years. Domestically, the support provided by monetary policy is most evident in the housing market, where house prices have rose 10.3% nationally over the year to October. This has fostered a new housing construction boom, boosting jobs and the sale of consumer durables. These trends should continue in 2016, but a small loss of momentum is expected in the housing market as regulators continue to tighten lending standards, and as supply constraints ease.
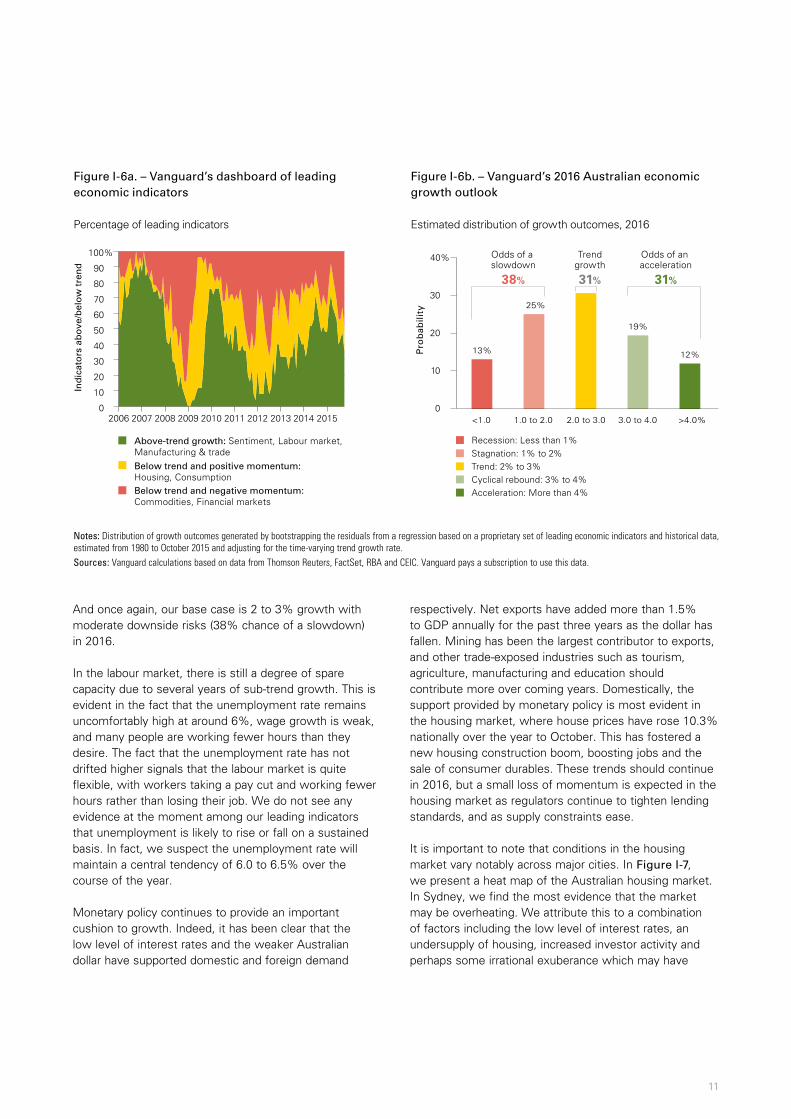
It is important to note that conditions in the housing market vary notably across major cities. In Figure I-7, we present a heat map of the Australian housing market. In Sydney, we find the most evidence that the market may be overheating. We attribute this to a combination of factors including the low level of interest rates, an undersupply of housing, increased investor activity and perhaps some irrational exuberance which may have
Figure I-6b. – Vanguard’s 2016 Australian economic growth outlook
Estimated distribution of growth outcomes, 2016
13%
25%
19%
12%
<1.0 1.0 to 2.0 2.0 to 3.0 3.0 to 4.0 >4.0% P
rob
abili
ty0
10
20
30
40% Odds of a slowdown
38%
Odds of an acceleration
31%
Trendgrowth
31%
Stagnation: 1% to 2%Trend: 2% to 3%Cyclical rebound: 3% to 4%Acceleration: More than 4%
Recession: Less than 1%
Notes: Distribution of growth outcomes generated by bootstrapping the residuals from a regression based on a proprietary set of leading economic indicators and historical data, estimated from 1980 to October 2015 and adjusting for the time-varying trend growth rate.Sources: Vanguard calculations based on data from Thomson Reuters, FactSet, RBA and CEIC. Vanguard pays a subscription to use this data.
Figure I-6a. – Vanguard’s dashboard of leading economic indicators
Percentage of leading indicators
0
10
20
30
40
50
60
70
80
90
100%
2006
Ind
icat
ors
ab
ove
/bel
ow
tre
nd
2007 2008 2009 2010 2011 2012 2013 2014 2015
Above-trend growth: Sentiment, Labour market, Manufacturing & trade Below trend and positive momentum: Housing, Consumption Below trend and negative momentum: Commodities, Financial markets
12
taken hold. Melbourne is also showing some slightly worrying signs, however we expect that the flood of new apartments should dampen property prices over the next several years. Indeed, recent data for Sydney and Melbourne suggest that the housing market may be cooling. In Perth, after several years of construction, the city now faces an oversupply of housing, and house prices have started to fall.
Looking ahead, our main fear for the housing market is a hard landing where house prices and investment fall by more than 10%. This would probably only occur due to a large external shock. For the time being, we attach only a small probability to such an event, but we acknowledge that a hard landing would have a strong negative impact on GDP. In Figure I-8a and 8b, we estimate the impact on real GDP growth of a moderate and severe housing
Figure I-7. – Housing market heat map
Real house prices (3 year % change)
Affordability*
Rental yield (%)
Dwelling price-to-income
Housing supply*
■ > 1 standard deviation deterioration from long run averages■ < 1 standard deviation deterioration from long run averages■ Improvement from long run averages
Sydney Melbourne Brisbane Adelaide Perth
49% 25% 4% 2% 4%
City
*Based on state level data
Notes: Affordability represented by family income to average loan repayments.
Sources: Vanguard calculations based on data from REIA, the ABS and HSBC.
Figure I-8a. – Real estate investment growth
Real Estate Investment1 Standard Deviation Investment Slowdown 2008 US Style Housing Crash
–30
–20
–10
0
10
20
30
40%
1992 1996 2000 2004
% Y
ear
on y
ear
2008 2012 2016
Notes: All data for 2014 and the historical average are real values. The “1 standard deviation investment slowdown” and “2008 U.S.-style housing crash” scenarios are estimated using an augmented input-output model. The housing sector is proxied by housing service sector plus 65% of the construction sector (assuming the rest to be infrastructure related construction activities). The latest available input-output table in Australia is the 2012 table released in 2015 by the Australian Bureau of Statistics. Real estate investment growth in the “2008 U.S.-style housing crash” scenario is proxied by U.S. private fixed investment: residential average annual growth 2007-2009. Both GDP growth estimates are based on slowdown in housing investment, holding all other factors constant. Sources: Australian Bureau of Statistics, CEIC, Moody’s Analytics Data Buffet, Organization for Economic Co-operation and Development, U.S. Bureau of Economic Analysis, and Vanguard calculations.
Figure I-8b. – A US style housing crash would push Australia into recession
3.5% 2.0% 0.6% –0.9%
4.3% 7.5%
–4.4%
–21.0% –25
–20
–15
–10
–5
0
5
10%
Historicalaverage
Current 1 StandardDeviation
InvestmentSlowdown
2008 US StyleHousing Crash
An
nu
al G
row
th
GDP Real Estate Investment

13
market crash. In the event of a moderate slowdown, housing investment would contract by 5% year-on-year and real GDP growth would slow to 0.6%. In a 2008 US style housing crash, housing investment would contract 21% pushing Australia into recession with real GDP growth contracting –0.9%. The shock would be initially transmitted via weaker housing investment growth, followed by a slowdown in the consumption of durable goods such as homewares. In a hard landing, house prices would undoubtedly fall as well, which would have a negative wealth effect on households.
In 2016, core inflation pressures should be contained, with a central tendency of 2.0% to 2.5%. Domestically, weak wage growth will continue to keep a lid on inflation. The foreign component of inflation was unusually weak in 2015 due to the collapse in global commodity prices, however, we expect a recovery in imported inflation this year as the weaker dollar raises import costs, but this should be limited as retailers appear reluctant to pass on higher costs given the already substantial decline in the dollar since 2013. On balance, inflation is unlikely to get out of hand in the near term. This leaves the door open for the RBA to cut the cash rate further if the economy requires support. Importantly, any decisions made by the RBA are likely to follow close monitoring of Federal Reserve policy in 2016.
China: Sharp slowdown, but no recession
Despite recent signs of stabilisation, the long-running downshift in China’s economic growth is likely to persist in coming years. As we discussed in past outlooks, the overcapacity and oversupply in China’s real estate and manufacturing sectors that built up over the past decade will continue to weigh on domestic investment for the foreseeable future (Figure I-9). We estimate that as much as 75% of the slowdown in China headline GDP growth since 2008 can be explained by the housing downturn, and that a further 10% decline in the growth rate of housing investment (our baseline expectation) could shed as much as an additional 2% from China’s official 7% growth pace. This, combined with other structural headwinds, suggests that China’s growth could fall quickly toward 5%, absent meaningful progress on structural reforms.
During this transitional period of rebalancing its economy, China’s investment slowdown represents the greatest downside risk to the global economy. As Figure I-10 illustrates, our simulations reveal that a deep Chinese recession would be sufficient to drag down other economies. Nevertheless, we do not anticipate an outright Chinese recession (i.e., negative GDP growth) in the near term, since such an event would require a 2006 U.S.-style housing crash, an outcome we assign a probability of only about 10%.4
Figure I-9. Investment growth unsustainable, but capital per employee remains low
Notes: Investment as percentage of GDP is from IMF WEO, April 2015. “Today” is defined as the average for 2014. “Asian Tigers” comprise South Korea, Hong Kong, Taiwan, and Singapore when each was at China’s 2014 nominal per capita GDP level ($7,500 in 2014 U.S. dollars). “Capital per employee” data are from Penn World Tables (version 8.1) in 2005 U.S. dollars, with “today” defined as the average for 2011.Sources: Vanguard calculations, based on data from IMF and Penn World Tables.
Investment as a percentage of GDP Capital per employee0
10
20
40
30
50%
0
50,000
100,000
150,000
200,000
250,000
300,000
$350,00047%
$292,614
$64,406
$57,700
32%
20%
China today“Asian Tigers” at China’s current income levelsUnited States today
4 For details, see Vanguard’s Global Macro Matters—China’s Key Risk: It’s Housing, Not Stocks (2015a).

14
Our somewhat sanguine assessment, however, is contingent upon more aggressive reforms and targeted stimulus by Chinese policymakers. A primary challenge for Chinese authorities is to strike a subtle balance between maintaining a relatively steady pace of growth and rebalancing the growth drivers away from investment and exports, while keeping financial risks under control. The key to rebalancing is to ensure that investment spending flows toward the most efficient uses of capital, avoiding misallocation and overinvestment in certain sectors. Normal swings in market-driven investment and credit flows coupled with the current high weight of investment spending in GDP growth could trigger
a sharp economic slowdown. Hence, macro policies hold the key to China’s growth stability. The margin of error is fairly narrow.
Although a large-scale stimulus plan appears unlikely, we expect the Chinese authorities to provide further monetary and fiscal support in 2016, in a bid to cushion against the downside risks and stabilise growth. In particular, we would anticipate further monetary easing by the People’s Bank of China in 2016 that would lower the required reserve ratio (RRR), currently at 17%, closer to the pre-crisis levels of 6%. Chinese monetary policymakers have arguably the most difficult task of engineering a soft landing by lowering real borrowing costs and the real exchange rate without accelerating capital outflows.
Figure I-11. Mixed success for ‘Abenomics’ thus far
Sources: Vanguard calculations, based on data from Japan Ministry of Finance and J.P.Morgan.
Per
cen
tag
e o
fye
ar-o
ver-
year
gro
wth
Bank lending–2
–1
2
3
4%
1
0
Abenomics’ 2% target
M2 Real GDP Nominal wages Scheduledearnings
Core CPIexcluding VAT
Pre-Abenomics (2000–2012Q3)Post-Abenomics (2012Q4–2015Q2)
Figure I-10. The global ‘tail risk’ would be an outright Chinese economic recession
Sources: Vanguard calculations, based on data from CEIC, Thomson Reuters Datastream, and Bloomberg.
GD
P g
row
th im
pac
t
–4
–3
–2
–1
0%
Asian emerging markets
Baseline (6% GDP)Recession (–1% GDP)
–5Latin
AmericaCommodityexporters
Japan Australia Euro zone UnitedStates
UnitedKingdom
15
Japan: Monetary policy can’t act alone
In Japan, the outlook is similarly not encouraging, despite aggressive monetary easing. Although the economy should be able to sustain higher levels of inflation at around 1%, given the tightening labour market and stabilisation in energy prices, real GDP growth should remain modest, as domestic investment and consumption have yet to gather momentum. This outlook is consistent with our view that monetary policy alone could be insufficient to achieve sustainable growth and inflation (see Figure I-11).
Despite falling energy prices, core inflation in Japan is rising on the trend of the closing output gap and weaker currency. However, the pace remains weak. Despite the tightening labour market, the strength of wage growth has been constrained by structural headwinds in the labour market. The rigidity in Japan’s labour market, especially the “job for life” model, has encouraged a secular expansion of part-time workers since the mid-1990s who suffer from lower incomes, less job security, and less welfare compared with full-time employees.5 This shift in the workforce composition is weighing down wage growth. As such, inflation pressures may not be strong enough to reach and sustain the Bank of Japan’s 2% core consumer price inflation target by the end of the 2016 fiscal year (March 2017).
The Japanese economy is struggling for stronger growth against structural headwinds, including a declining and aging population, weakening productivity, low return on capital, and high debt levels. There are positive signs, but a more solid pickup in private-sector activity is crucial for a sustained growth recovery. In the near term, policymakers will try to support the recovery with highly accommodative monetary policy, while fiscal policy will be constrained as a result of very high levels of public debt. Unless the reform outlook improves, we don’t expect to see a significant improvement in the growth outlook over the medium term.
Euro area: Some bright spots emerging
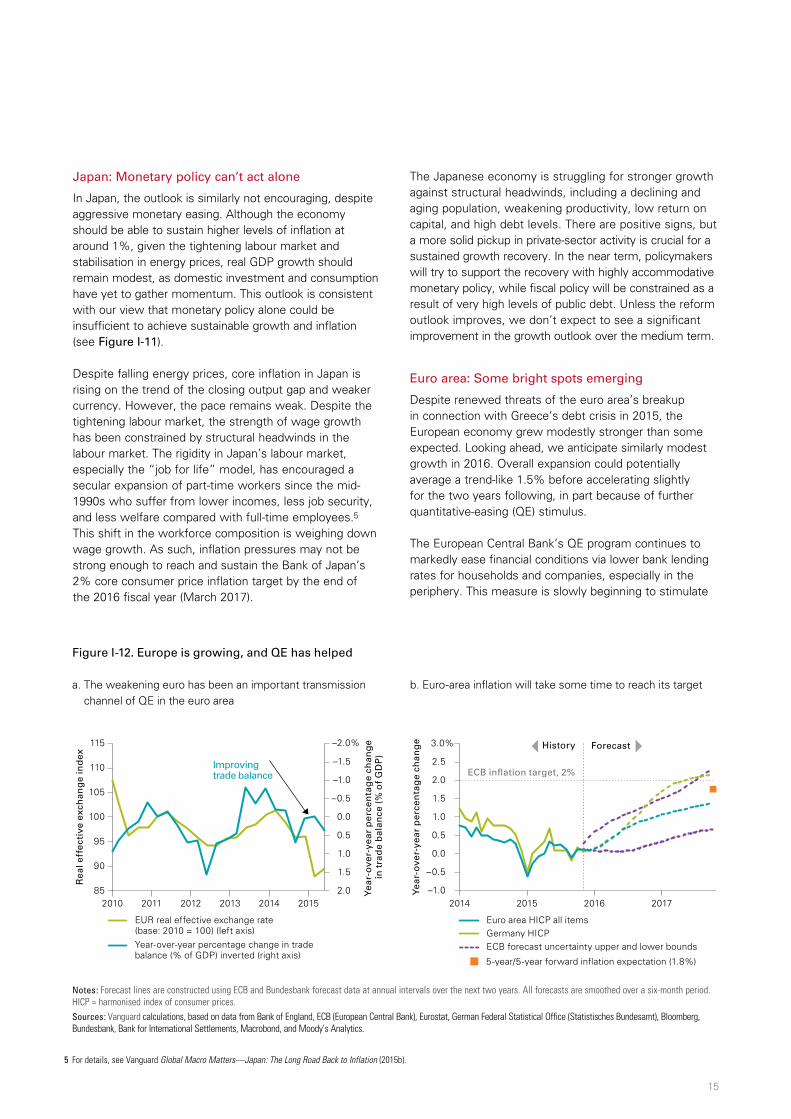
Despite renewed threats of the euro area’s breakup in connection with Greece’s debt crisis in 2015, the European economy grew modestly stronger than some expected. Looking ahead, we anticipate similarly modest growth in 2016. Overall expansion could potentially average a trend-like 1.5% before accelerating slightly for the two years following, in part because of further quantitative-easing (QE) stimulus.
The European Central Bank’s QE program continues to markedly ease financial conditions via lower bank lending rates for households and companies, especially in the periphery. This measure is slowly beginning to stimulate
Figure I-12. Europe is growing, and QE has helped
a. The weakening euro has been an important transmission b. Euro-area inflation will take some time to reach its target channel of QE in the euro area
Notes: Forecast lines are constructed using ECB and Bundesbank forecast data at annual intervals over the next two years. All forecasts are smoothed over a six-month period. HICP = harmonised index of consumer prices.Sources: Vanguard calculations, based on data from Bank of England, ECB (European Central Bank), Eurostat, German Federal Statistical Office (Statistisches Bundesamt), Bloomberg, Bundesbank, Bank for International Settlements, Macrobond, and Moody’s Analytics.
Rea
l eff
ecti
ve e
xch
ang
e in
dex
Yea
r-o
ver-
year
per
cen
tag
e ch
ang
e in
tra
de
bal
ance
(%
of
GD
P)
EUR real effective exchange rate (base: 2010 = 100) (left axis)Year-over-year percentage change in trade balance (% of GDP) inverted (right axis)
–1.0
–0.5
0.0
0.5
1.0
1.5
2.0
2.5
3.0%
2014 2015 2016 2017
Yea
r-o
ver-
year
per
cen
tag
e ch
ang
e
Euro area HICP all itemsGermany HICP ECB forecast uncertainty upper and lower bounds
–2.0%
–1.5
–1.0
–0.5
0.0
0.5
1.0
1.5
2.085
90
95
100
105
110
115
2010 2011 2012 2013 2014 2015
Improving trade balance
History Forecast
5 For details, see Vanguard Global Macro Matters—Japan: The Long Road Back to Inflation (2015b).

16
credit growth. One significant channel of QE transmission has been the exchange rate, which depreciated in both U.S. dollar and effective terms by about 10% from September 2014 through March 2015 (Figure I-12). According to model-based elasticity estimates, this could boost euro-area GDP by around 0.5%, a stimulus likely reinforced by the sharp falls in oil and commodity prices.
Granted, considerable challenges remain in terms of fiscal, banking, and structural policy, and in political structures, to make the euro area a well-functioning monetary union. But in 2016, attention should continue to focus on conventional macroeconomic issues related to inflation and growth, and particularly on the effectiveness of the ECB’s quantitative-easing program.
Fiscal policy in the euro area has also tended to provide a net stimulus to growth in 2015 because the fiscal tightening is slowing down. Given the uncertainty surrounding the effects of QE and the still-weak growth outlook, additional fiscal stimulus is probably warranted. Politically, however, this is unlikely to happen, because of the resistance to fiscal stimulus by Germany, the largest creditor country.
Given the very low level of inflation in the euro area, we still anticipate further QE stimulus, but we do not expect the ECB to raise rates for several years, perhaps waiting as late as 2020.
United States: At full employment, trend-like growth
At full employment, the U.S. economy is unlikely to accelerate this year, yet is on course to experience its longest expansion in nearly a century, underscoring our long-held view of its resiliency. As in past outlooks, we maintain that U.S. long-term (potential) GDP growth is near 2%, versus its historical average of 3.25% since 1950. This lowered projection is based on demographic headwinds and, to a lesser extent, on a more subdued expectation for labour productivity growth.
However, we see our 2% U.S. trend growth estimation as neither “new” nor “subpar” relative to pre-crisis levels, if one both accounts for structurally lower population growth and removes the consumer debt-fueled boost to growth between 1980 and the global financial crisis that began in 2007. Specifically, U.S. real GDP growth between 1980 and 2006 would have averaged nearly 2% (as opposed to the 3% measured in the data) had consumer debt (and hence the share of the economy dictated by consumer spending) not risen to drastic levels over time. We believe this calculus is underappreciated by many, and provides another justification for the Federal Reserve to initiate a gradual normalisation in monetary policy.
Vanguard’s outlook for leading U.S. economic indicators suggests that the cyclical thrust enjoyed over the last two years seems to have peaked in 2015 and may start
Figure I-13. From cyclical thrust back to trend growth
a. Convergence in real GDP growth b. Convergence in employment growth
Notes: Potential GDP growth represents Congressional Budget Office (CBO) estimates; real growth represents data provided by U.S. Bureau of Economic Analysis through third-quarter 2015. U.S. real GDP growth is assumed to return to potential over 2016–2017. Labour force growth represents historical average monthly change in labour force; 2016–2017 period represents estimate using population growth estimates and assumes constant participation rates within age cohorts. Employment growth is assumed to return to trend in labour force growth over 2016–2017.Sources: Vanguard calculations, based on data from Congressional Budget Office, U.S. Bureau of Economic Analysis, U.S. Bureau of Labour Statistics, and Moody’s Analytics Data Buffet.
Ave
rag
e an
nu
al g
row
th r
ate
per
per
iod
(p
erce
nta
ge)
U.S. potential GDP growthU.S. real GDP growth
Labour force growthEmployment growth
2002–2007
2008–2009
2010–2013
2014–2015
2016–2017
2002–2007
2008–2009
2010–2013
2014–2015
2016–2017
–300
–200
–100
0
100
200
300
–3
–2
–1
0
1
2
3
4%
Ave
rag
e m
on
thly
ch
ang
e p
er
per
iod
(th
ou
san
ds
of
wo
rker
s)

17
to fade in 2016. We expect this also to be the case for employment growth (see Figure I-13). The average pace of U.S. job growth has been more than 200,000 net new jobs per month for 2014–15, while the labour force has grown by only about 70,000 new entrants per month during the same period.
The resiliency of both the U.S. consumer and domestic demand through 2015 stands in contrast to the weakness of U.S. domestic manufacturing and export-related sectors (Figure I-14). The significant strengthening of the U.S. dollar since mid-2014 (a 12% real appreciation) has imposed a heavy toll on goods-producing sectors of the economy. However, similar to what has been the case in 2015, we don’t expect the slowdown in manufacturing to spill over to the broader economy in 2016. One reason to be less pessimistic about a strong U.S. dollar is that domestic production of goods accounts for just 12% of total U.S. final production and only 16% of all jobs in the country.
Moreover, a stronger U.S. dollar means lower import prices for U.S. consumers. Not only are imported goods and services cheaper in dollar terms (e.g., imported cars or trips overseas), but also, similar to the effect of lower gas prices, households can afford to spend more on other domestically provided services such as entertainment,
hospitality, health care, or education (see service components in Figure I-14b). More generally, nontradable sectors of the economy, such as construction, are also expected to receive support from a strong U.S. dollar.
Inflation in the United States has remained persistently below the Fed’s 2% target, even as unemployment gaps have closed at a fairly fast pace over the last three years. Similarly, wage growth has remained subdued, even as more anecdotal reports of labour market shortages in certain sectors confirm the top-down data on job openings outpacing job hires. As the labour market continues to tighten, we expect wage growth to gradually pick up above 2% through 2016 and beyond, and eventually for broader price inflation to return closer to the Fed’s official 2% target. Long-term inflation expectations are anchored around that inflation target.
Convergence in global growth dynamics will continue to necessitate and generate divergence in policy responses. The U.S. Federal Reserve is likely to pursue a “dovish tightening” cycle that removes some of the unprecedented accommodation exercised due to the “exigent circumstances” of the global financial crisis. In our view, there is a high likelihood of an extended pause in interest rates at, say, 1% that opens the door
Figure I-14. Effects of stronger U.S. dollar are not one-sided
a. Impact on employment growth b. Impact on real GDP growth and components
Notes: Estimated impacts based on regressions of macro variables (components of employment growth and real GDP growth) on Real Broad Dollar Index. Estimated effects arise from applying cumulative real appreciation since third-quarter 2014 (12%) to corresponding regression coefficients. Results are weighted by components as follows: service-providing employment (84%), goods-producing employment (16%), consumer services (46% of GDP), durable goods (7%), nondurable goods (15%), imports (15%), and exports (13%). U.S. government sector not included in this analysis.
Sources: Vanguard calculations, based on data from Moody’s Analytics Data Buffet.
An
nu
al g
row
th(p
erce
nta
ge
po
ints
)
–1.0
–0.8
–0.6
–0.4
–0.2
0.0
0.2
0.4
0.6
0.8
1.0
Service-sector employment
Manufacturing-sector employment
–0.8
–0.6
–0.4
–0.2
0.0
0.2
0.4
0.6
0.8
Sea
son
ally
ad
just
ed a
nn
ual
ra
te g
row
th (
per
cen
tag
e p
oin
t)
Private domestic demand growth
Trade balance
ExportsImportsFixed investment
ServicesNondurable goodsDurable goods
18
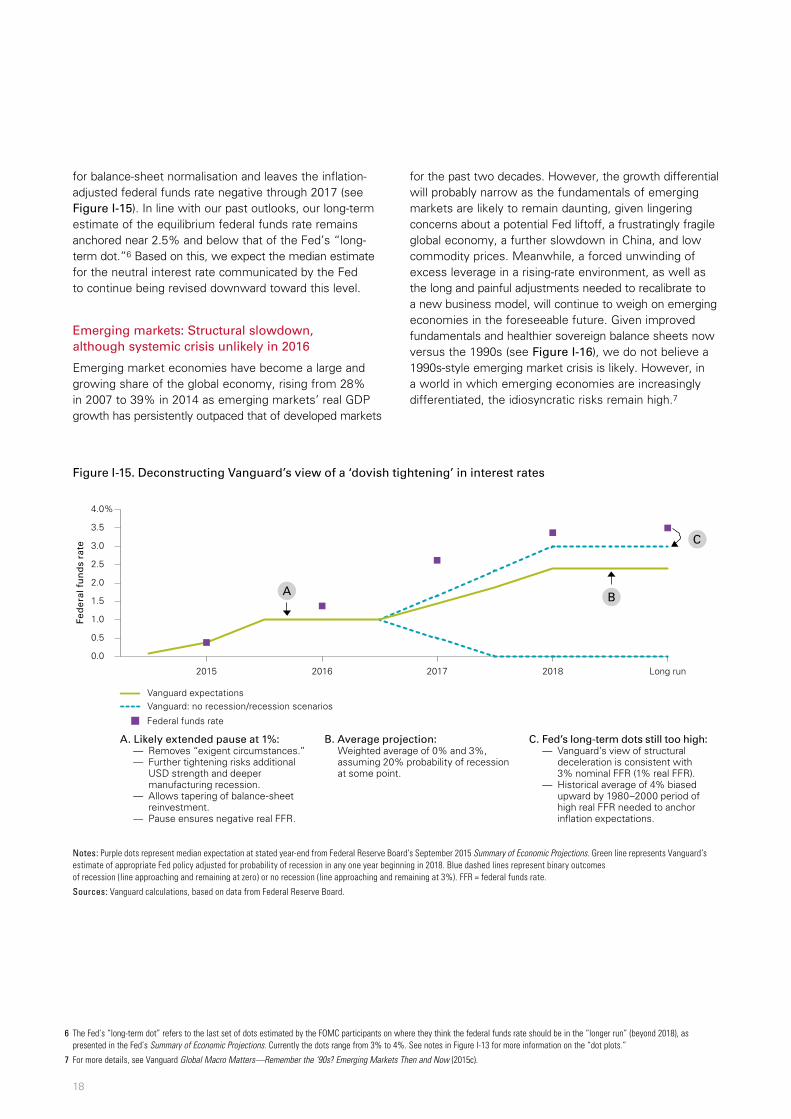
for balance-sheet normalisation and leaves the inflation-adjusted federal funds rate negative through 2017 (see Figure I-15). In line with our past outlooks, our long-term estimate of the equilibrium federal funds rate remains anchored near 2.5% and below that of the Fed’s “long-term dot.”6 Based on this, we expect the median estimate for the neutral interest rate communicated by the Fed to continue being revised downward toward this level.
Emerging markets: Structural slowdown, although systemic crisis unlikely in 2016
Emerging market economies have become a large and growing share of the global economy, rising from 28% in 2007 to 39% in 2014 as emerging markets’ real GDP growth has persistently outpaced that of developed markets
for the past two decades. However, the growth differential will probably narrow as the fundamentals of emerging markets are likely to remain daunting, given lingering concerns about a potential Fed liftoff, a frustratingly fragile global economy, a further slowdown in China, and low commodity prices. Meanwhile, a forced unwinding of excess leverage in a rising-rate environment, as well as the long and painful adjustments needed to recalibrate to a new business model, will continue to weigh on emerging economies in the foreseeable future. Given improved fundamentals and healthier sovereign balance sheets now versus the 1990s (see Figure I-16), we do not believe a 1990s-style emerging market crisis is likely. However, in a world in which emerging economies are increasingly differentiated, the idiosyncratic risks remain high.7
Figure I-15. Deconstructing Vanguard’s view of a ‘dovish tightening’ in interest rates
Notes: Purple dots represent median expectation at stated year-end from Federal Reserve Board’s September 2015 Summary of Economic Projections. Green line represents Vanguard’s estimate of appropriate Fed policy adjusted for probability of recession in any one year beginning in 2018. Blue dashed lines represent binary outcomes of recession (line approaching and remaining at zero) or no recession (line approaching and remaining at 3%). FFR = federal funds rate.
Sources: Vanguard calculations, based on data from Federal Reserve Board.
Fed
eral
fu
nd
s ra
te
0.0
0.5
1.0
1.5
2.0
2.5
3.0
3.5
4.0%
Vanguard expectationsVanguard: no recession/recession scenarios
Federal funds rate
2015 2016 2017 2018 Long run
A B
C
A. Likely extended pause at 1%: — Removes “exigent circumstances.” — Further tightening risks additional
USD strength and deeper manufacturing recession.
— Allows tapering of balance-sheet reinvestment.
— Pause ensures negative real FFR.
B. Average projection: Weighted average of 0% and 3%,
assuming 20% probability of recession at some point.
C. Fed’s long-term dots still too high: — Vanguard’s view of structural
deceleration is consistent with 3% nominal FFR (1% real FFR).
— Historical average of 4% biased upward by 1980–2000 period of high real FFR needed to anchor inflation expectations.
6 The Fed’s “long-term dot” refers to the last set of dots estimated by the FOMC participants on where they think the federal funds rate should be in the “longer run” (beyond 2018), as presented in the Fed’s Summary of Economic Projections. Currently the dots range from 3% to 4%. See notes in Figure I-13 for more information on the “dot plots.”
7 For more details, see Vanguard Global Macro Matters—Remember the ‘90s? Emerging Markets Then and Now (2015c).

19
Figure I-16. Emerging markets’ financial systems are much different today
Crisis years
External debt stocks (percentage
of GDP)
Total reserves (percentage
of total external debt)
External debt service (percentage of exports)
Total reserves/current account
deficit
Currency peg in place
(Yes or No)
Brazil 2002 48 16 71 5 No
Hungary 1997 52 36 33 Less than 1 Yes
Malaysia 1997 36 44 7 4 Yes
Mexico 1994 34 5 27 Less than 1 Yes
South Africa 1997 20 16 17 2 No
Turkey 1997 32 22 22 7 No
Argentina 2001 57 10 49 4 Yes
Indonesia 1997 52 12 30 3 Yes
Russia 1998 65 6 29 56 Yes
South Korea 1997 32 13 — 8 Yes
Today
Brazil 21 74 29 4 No
Hungary 147 24 97 8 No
Malaysia 68 63 4 4 No
Mexico 35 40 10 7 No
South Africa 38 32 8 2 No
Turkey 47 29 29 2 No
Argentina 22 21 14 6 No
Indonesia 30 37 19 3 No
Russia 35 70 32 15 No
South Korea 32 83 — 53 No
Notes: Data for external debt service as percentage of exports for Hungary and Russia begin in 2005. Data for total reserves as percentage of exports for Hungary begin in 2000.Sources: Vanguard calculations, based on data from World Bank, IMF, Oxford Economics, Bank of Korea, Korea Customs Service, Central Bank of the Russian Federation, Department of Statistics Malaysia, CEIC, Central Bank of Hungary, and The Country Chronologies and Background Material to Exchange Rate Arrangements into the 21st Century: Will the Anchor Currency Hold? (Ilzetzki, Reinhart, and Rogoff, 2011).
20
II. Global capital markets outlook
Global fixed income markets
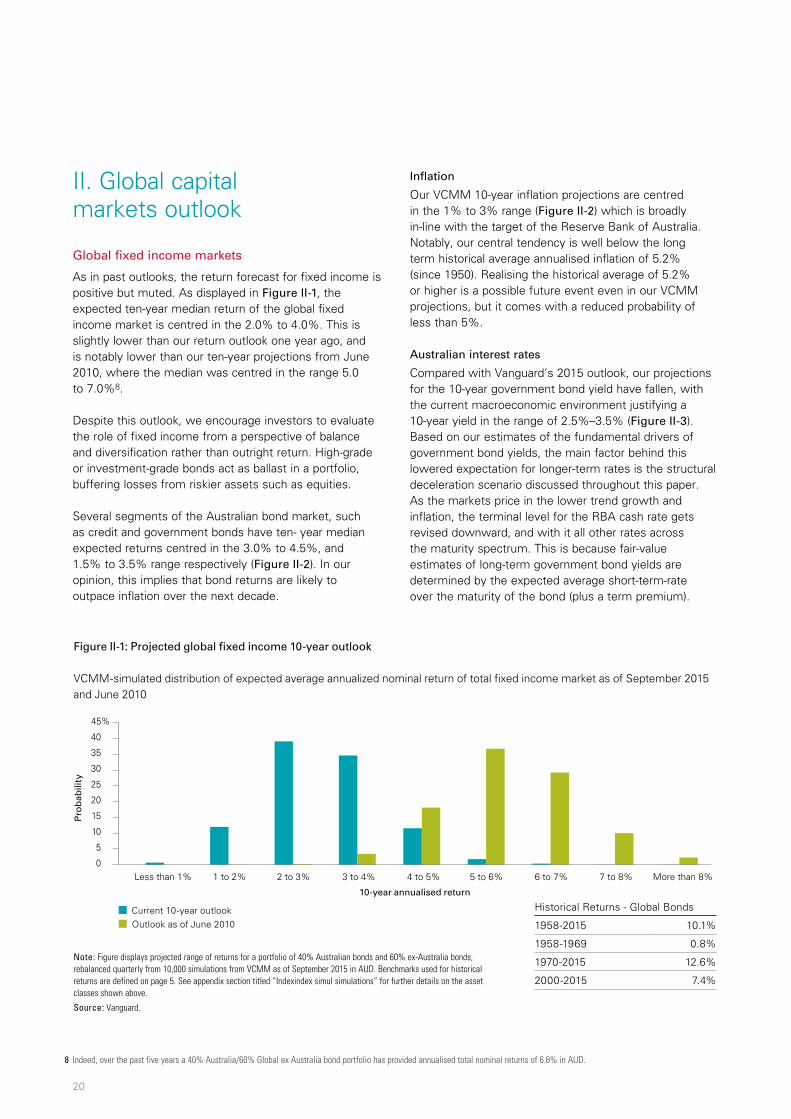
As in past outlooks, the return forecast for fixed income is positive but muted. As displayed in Figure II-1, the expected ten-year median return of the global fixed income market is centred in the 2.0% to 4.0%. This is slightly lower than our return outlook one year ago, and is notably lower than our ten-year projections from June 2010, where the median was centred in the range 5.0 to 7.0%8.
Despite this outlook, we encourage investors to evaluate the role of fixed income from a perspective of balance and diversification rather than outright return. High-grade or investment-grade bonds act as ballast in a portfolio, buffering losses from riskier assets such as equities.
Several segments of the Australian bond market, such as credit and government bonds have ten- year median expected returns centred in the 3.0% to 4.5%, and 1.5% to 3.5% range respectively (Figure II-2). In our opinion, this implies that bond returns are likely to outpace inflation over the next decade.
Inflation
Our VCMM 10-year inflation projections are centred in the 1% to 3% range (Figure II-2) which is broadly in-line with the target of the Reserve Bank of Australia. Notably, our central tendency is well below the long term historical average annualised inflation of 5.2% (since 1950). Realising the historical average of 5.2% or higher is a possible future event even in our VCMM projections, but it comes with a reduced probability of less than 5%.
Australian interest rates
Compared with Vanguard’s 2015 outlook, our projections for the 10-year government bond yield have fallen, with the current macroeconomic environment justifying a 10-year yield in the range of 2.5%–3.5% (Figure II-3). Based on our estimates of the fundamental drivers of government bond yields, the main factor behind this lowered expectation for longer-term rates is the structural deceleration scenario discussed throughout this paper. As the markets price in the lower trend growth and inflation, the terminal level for the RBA cash rate gets revised downward, and with it all other rates across the maturity spectrum. This is because fair-value estimates of long-term government bond yields are determined by the expected average short-term-rate over the maturity of the bond (plus a term premium).
Figure II-1: Projected global fixed income 10-year outlook
VCMM-simulated distribution of expected average annualized nominal return of total fixed income market as of September 2015 and June 2010
Pro
bab
ility
10-year annualised return
Outlook as of June 2010Current 10-year outlook
0
5
10
15
20
25
30
35
40
45%
Less than 1% 1 to 2% 2 to 3% 3 to 4% 4 to 5% 5 to 6% 6 to 7% 7 to 8% More than 8%
Note: Figure displays projected range of returns for a portfolio of 40% Australian bonds and 60% ex-Australia bonds, rebalanced quarterly from 10,000 simulations from VCMM as of September 2015 in AUD. Benchmarks used for historical returns are defined on page 5. See appendix section titled “Indexindex simul simulations” for further details on the asset classes shown above.
Source: Vanguard.
8 Indeed, over the past five years a 40% Australia/60% Global ex Australia bond portfolio has provided annualised total nominal returns of 6.8% in AUD.
Historical Returns - Global Bonds
1958-2015 10.1%
1958-1969 0.8%
1970-2015 12.6%
2000-2015 7.4%

21
Figure II-2: Bond market ten-year return outlook: Setting reasonable expectations
0
–1
4
5
2
3
1
–2
6
7
8
9%
10 y
ear
ann
ual
ised
ret
urn
Australianin�ation
Australiancash
Australiangovernment
bonds
Australiancreditbonds
Australianbonds
Australianlinkers
Global bondsex-Australia
hedged in AUD
5th
95th
Percentileskey:
75th
25th
Median
Volatility (median annual standard deviation of returns)
Note: Forecast corresponds to distribution of 10,000 simulations from VCMM for the 10 year annualised returns as of September 2015 in AUD for asset classes shown above. See appendix section titled “Index simulations” for further details on the asset classes shown above.
Source: Vanguard.
Figure II-3: Low yields may be here to stay
0
2
4
6
8
10
12
14
16
18%
1/03/1970 1/07/1978 1/11/1986 1/03/1995 1/07/2003 1/11/2011 1/03/2020
Yie
ld
10 year Govt. Bond Yield5th / 95th percentile25th / 75th percentile50th percentileAverage (1970 onwards)
Note: 10-year Govt. bond yield projections based on 10,000 simulations from VCMM as of September 2015.
Sources: Vanguard calculations, based on data from Thomson Reuters Datastream and the Reserve Bank of Australia.

22
Based on the VCMM projections, the 10-year government bond yield is projected to rise slowly over the next few years. The central tendency of our forecast for the 10-year yield in five years is around 3.2% which is well below the long term average (since 1970) of 8.4% and the recent average (2000 onwards) of 5.0%.
Cash and Treasury Index
The bond market continues to expect Australian government bond yields to be slightly higher 5 years ahead (Figure II-4).
Our VCMM simulations show the 10-year return distribution of cash and the government bond index in Figure II-2, where the medians look very similar with the median volatility projection of cash being lower than that of the government bond index. This might make the return outlook for cash appear more attractive than the treasury index on a risk adjusted basis, however, it is important to highlight that bonds provide stronger diversification properties. During times of equity market stress, bonds act as a ballast buffering losses from riskier assets. In addition, the dispersion of potential returns for cash is greater than for bonds, so the return outlook is more uncertain. Finally, across all three scenarios
described in Figure II-5, the Australian Treasury index does a decent job of diversifying the uncertainty of change in interest rates.
We caution investors against trying to time allocations to cash and fixed income, for example, by going short-duration. In general, a short-duration strategy entails substantial forgone income. Focusing solely on avoiding capital losses on long-term bonds ignores the fact that an upward sloping yield curve (current yield slope of 0.77% as shown in Figure II-6, which is above the historical median of 0.42%) produces significant income differences among duration strategies (Figure II-5).
Credit bonds
The central tendency for the Australian credit bond index is in the 3.0% to 4.5% range which is slightly higher than that of the government bond index. This reflects the accumulation of default and illiquidity premia that accompanies the higher risk of credit bonds (median volatility of 4.7% in Figure II-2). The credit spread for the Barclays Australian Aggregate Corporate Bond Index (as of October 2015) is 1.4% relative to the historical median of 1.0% (Figure II-6) which implies that spreads are not particularly narrow. However, one must keep in mind that spreads tend to widen in times of equity market stress.
Figure II-4: A rise in interest rates is already priced in by the markets
Australian Treasury Curve
0
1
2
3
4
5
6%
3 Months 1 Year 2 Year 5 Year 7 Year 10 Year 20 Year 30 Year
Yie
ld
Maturity
Spot curveForward curveVCMM median
VCMM 25 and 75th percentile bounds
Note: Forecast displays the 25th/75th percentile range of 10,000 simulations from VCMM for projected yields of the Australian treasury curve 5 years ahead as of September 2015.
Sources: Vanguard, Bloomberg and Moody’s Analytics.

23
Inflation-linked bonds
In the inflation-linked segment of the bond market, the distribution in our VCMM scenarios of inflation-linked bond returns is wider than that of nominal government bonds. The expected median long-term return on an Australian inflation-linked bond portfolio is lower than that of a similar-duration nominal government bond portfolio by a modest amount that represents the estimated inflation-risk
premium that is earned by nominal bonds. As expected, inflation-linked bonds generally outperform nominal Treasuries in scenarios featuring inflation scares or higher-than-expected inflation rates over a ten-year outlook.
The current break even inflation rate (BEI) is near its lowest historical level of about 2.1% (Figure II-6) and is similar to our ten year inflation expectation, (Figure II-2)
Figure II-6: Historical dashboard: Australian fixed income risk factors
2.0
2.2
2.4
2.6
2.8
3.0
3.2
3.4
Break Even In�ation (10Yr)–1.0
–0.5
0.0
0.5
1.0
1.5
2.0
Yield Slope (10Yr - 3M)
CurrentOctober 2010
0
50
100
150
200
250
300
Australian Aggregate Corporate Spread
5th
95th
Percentileskey:
75th
25th
Note: Current values for risk factors as of October 2015. 10 year break even inflation covers the period 03/2000 to present, although due to a lack of market liquidity data was not available during most of 2002-03, and 2007-09. The credit spread is the option adjusted spread for the Barclays Australian Aggregate Corporate Bond Index 100mn and covers the period 01/2005 to present. Yield slope is the ten year Government bond yield minus the three month OIS swap rate and covers the period 10/2001 to present.
Sources: Vanguard calculations based on data from Bloomberg and Barclays.
Figure II-5: Duration tilts: Short-duration strategies are not without risks
High-yield scenario
Yields above75th percentile
Low-yield scenario
Yields below25th percentile
Expected yield scenario
Yields between 25th and 75th percentiles
5th
95th
Percentileskey:
75th
25th
Median
Treasury indexShort-term treasury indexLong-term treasury index
Barclays Australian Aggregate Treasury Bond IndexBarclays Australian Aggregate Treasury 1-5 Yr Bond IndexBarclays Australian Aggregate Treasury 10+ Yr Bond Index
–5
0
5
10%
Note: Forecast displays the distribution of 10,000 simulations of VCMM for 5 year annualised returns of the asset classes shown as of September 2015 in AUD. The scenarios are obtained based on sorting the 3-month and 30 year treasury yield at the end of every year from VCMM. The three scenarios combined are a subset of the 10,000 simulations from VCMM. See appendix section titled “Index simulations” for further details on the asset classes shown above.
Source: Vanguard.

24
while the historical median BEI is at 2.6%, which reflects potentially cheap inflation protection. On a more cautionary note, inflation-linked bonds have displayed a higher probability of negative returns over shorter investment horizons because of their sensitivity to a rise in real rates. Balancing these considerations, investors should continue to evaluate the role of inflation-linked bonds in their portfolios by balancing their inflation-risk protection quality against the inflation-risk premium “given up” relative to nominal bonds.
Aggregate fixed income markets – domestic vs international
Although the central tendency of expected returns for global ex-Australia bonds appears to be slightly lower than that of Australian composite bonds (Figure II-2), we expect the diversification benefits of global fixed income in a balanced portfolio to persist under most scenarios. Yields in most developed markets are at historically low levels, particularly in Europe and Japan, yet the diversification through exposure to hedged international bonds should help offset some risk specific to the Australian fixed income market. Less-than-perfect correlation between two of the main drivers of bond returns—interest rates and inflation—is expected as global central bank policies are likely to diverge in the near term.
Global equity markets
VCMM simulations for ten-year returns of a global equity portfolio are centred between 7% to 10% (see Figure II-7). This outlook is based on a 50% Australian equity/50% unhedged developed markets ex Australia equity portfolio. Australian equity returns are expected to be broadly in line with historical returns when adjusted for inflation. This can be attributed to the fact that current valuations, a key driver of forward looking equity returns9, are close to their historical medians (Figure II-9a) in Australia. Valuations in developed markets ex Australia are slightly higher, however, implying a lower return outlook over the next 10 years when currency is ignored. The currency impact is expected to be positive, based on the principal of uncovered interest rate parity. That is to say, there is a positive interest rate differential between Australian and US interest rates which is expected to close over time, pushing the value of the Australia/US dollar exchange rate down, and thus boosting the value of foreign assets. Therefore the return outlook for Australian and unhedged developed markets ex Australia equities is broadly similar.
Figure II-7: Projected global equity 10-year return outlook
VCMM-simulated distribution of expected average annualised nominal return of global equity markets, estimated as of September 2015 and June 2010
Pro
bab
ility
10-year annualised return
Outlook as of June 2010Current 10-year outlook
0
5
10
15
20
25%
Less than 0% 0 to 3% 3 to 6% 6 to 9% 9 to 12% 12 to 15% 15 to 18% 18 to 21% More than 21%
Note: Figure displays the projected range of returns for a 50% Australia equity, 50% ex-Australia equity portfolio in AUD, rebalanced quarterly from 10,000 simulations from VCMM as of September 2015. Benchmarks used for historical returns are defined on page 5. See appendix section titled “Index simulations” for further details on the asset classes shown above.
Source: Vanguard.
Historical Returns -Global Equity
1958-2015 10.1%
1958-1969 11.0%
1970-2015 9.8%
2000-2015 5.9%
9 See Davis et al 2012.
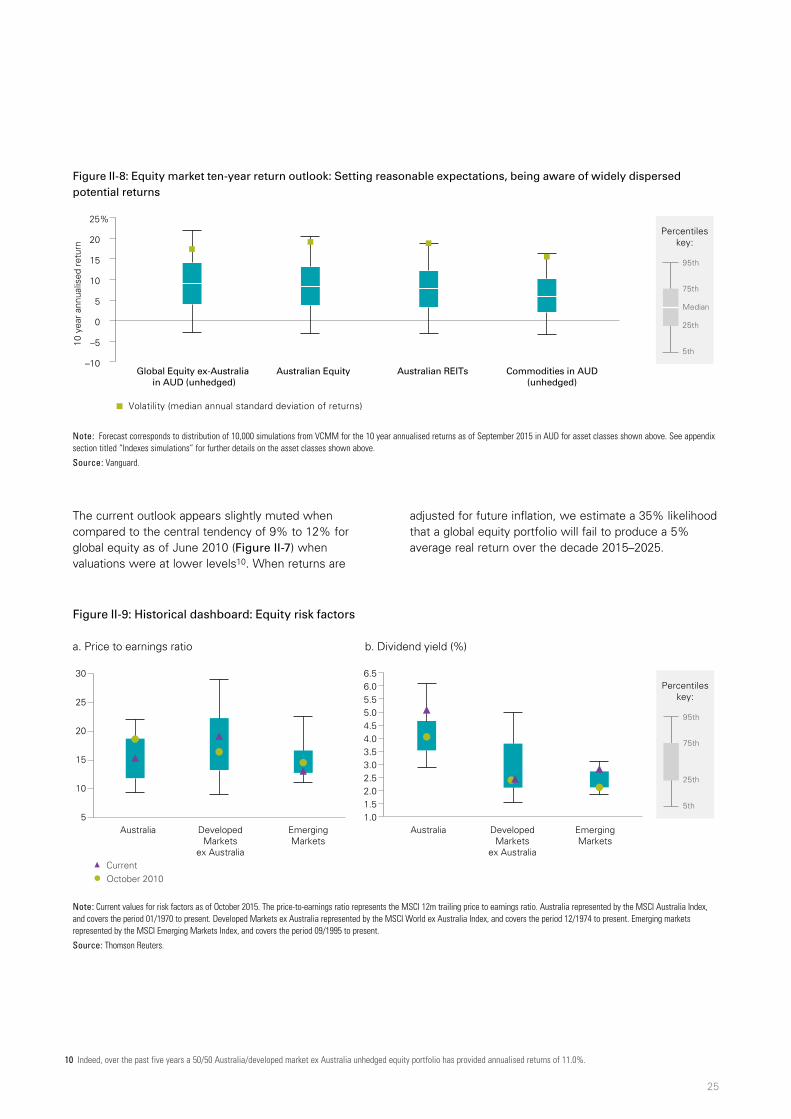
25
The current outlook appears slightly muted when compared to the central tendency of 9% to 12% for global equity as of June 2010 (Figure II-7) when valuations were at lower levels10. When returns are
adjusted for future inflation, we estimate a 35% likelihood that a global equity portfolio will fail to produce a 5% average real return over the decade 2015–2025.
10 Indeed, over the past five years a 50/50 Australia/developed market ex Australia unhedged equity portfolio has provided annualised returns of 11.0%.
Figure II-9: Historical dashboard: Equity risk factors
a. Price to earnings ratio b. Dividend yield (%)
5
10
15
20
25
30
Australia DevelopedMarkets
ex Australia
EmergingMarkets
Australia DevelopedMarkets
ex Australia
EmergingMarkets
CurrentOctober 2010
1.01.52.02.53.03.54.04.55.05.56.06.5
5th
95th
Percentileskey:
75th
25th
Note: Current values for risk factors as of October 2015. The price-to-earnings ratio represents the MSCI 12m trailing price to earnings ratio. Australia represented by the MSCI Australia Index, and covers the period 01/1970 to present. Developed Markets ex Australia represented by the MSCI World ex Australia Index, and covers the period 12/1974 to present. Emerging markets represented by the MSCI Emerging Markets Index, and covers the period 09/1995 to present.
Source: Thomson Reuters.
Figure II-8: Equity market ten-year return outlook: Setting reasonable expectations, being aware of widely dispersed potential returns
Commodities in AUD(unhedged)
Australian REITsAustralian EquityGlobal Equity ex-Australia in AUD (unhedged)
–10
–5
0
5
10
15
10 y
ear
annu
alis
ed r
etur
n 20
25%
Volatility (median annual standard deviation of returns)
5th
95th
Percentileskey:
75th
25th
Median
Note: Forecast corresponds to distribution of 10,000 simulations from VCMM for the 10 year annualised returns as of September 2015 in AUD for asset classes shown above. See appendix section titled “Indexes simulations” for further details on the asset classes shown above.
Source: Vanguard.
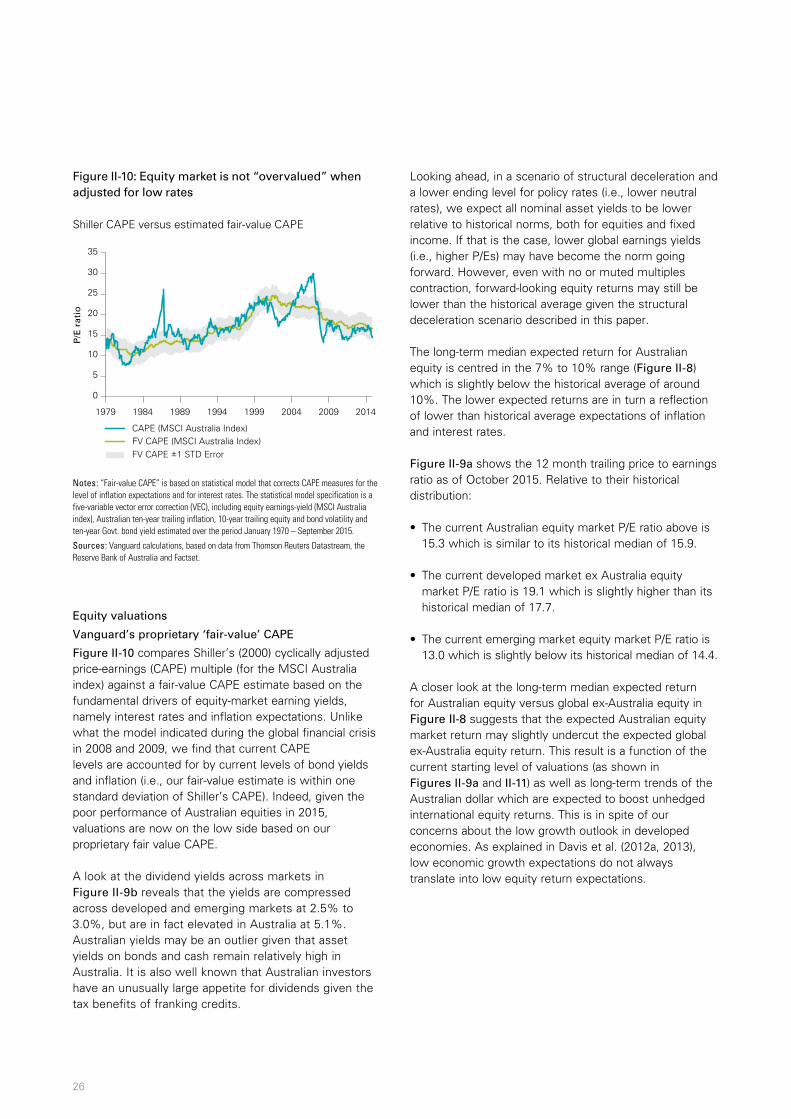
26
Equity valuations
Vanguard’s proprietary ‘fair-value’ CAPE
Figure II-10 compares Shiller’s (2000) cyclically adjusted price-earnings (CAPE) multiple (for the MSCI Australia index) against a fair-value CAPE estimate based on the fundamental drivers of equity-market earning yields, namely interest rates and inflation expectations. Unlike what the model indicated during the global financial crisis in 2008 and 2009, we find that current CAPE levels are accounted for by current levels of bond yields and inflation (i.e., our fair-value estimate is within one standard deviation of Shiller’s CAPE). Indeed, given the poor performance of Australian equities in 2015, valuations are now on the low side based on our proprietary fair value CAPE.
A look at the dividend yields across markets in Figure II-9b reveals that the yields are compressed across developed and emerging markets at 2.5% to 3.0%, but are in fact elevated in Australia at 5.1%. Australian yields may be an outlier given that asset yields on bonds and cash remain relatively high in Australia. It is also well known that Australian investors have an unusually large appetite for dividends given the tax benefits of franking credits.
Looking ahead, in a scenario of structural deceleration and a lower ending level for policy rates (i.e., lower neutral rates), we expect all nominal asset yields to be lower relative to historical norms, both for equities and fixed income. If that is the case, lower global earnings yields (i.e., higher P/Es) may have become the norm going forward. However, even with no or muted multiples contraction, forward-looking equity returns may still be lower than the historical average given the structural deceleration scenario described in this paper.
The long-term median expected return for Australian equity is centred in the 7% to 10% range (Figure II-8) which is slightly below the historical average of around 10%. The lower expected returns are in turn a reflection of lower than historical average expectations of inflation and interest rates.
Figure II-9a shows the 12 month trailing price to earnings ratio as of October 2015. Relative to their historical distribution:
• The current Australian equity market P/E ratio above is 15.3 which is similar to its historical median of 15.9.
• The current developed market ex Australia equity market P/E ratio is 19.1 which is slightly higher than its historical median of 17.7.
• The current emerging market equity market P/E ratio is 13.0 which is slightly below its historical median of 14.4.
A closer look at the long-term median expected return for Australian equity versus global ex-Australia equity in Figure II-8 suggests that the expected Australian equity market return may slightly undercut the expected global ex-Australia equity return. This result is a function of the current starting level of valuations (as shown in Figures II-9a and II-11) as well as long-term trends of the Australian dollar which are expected to boost unhedged international equity returns. This is in spite of our concerns about the low growth outlook in developed economies. As explained in Davis et al. (2012a, 2013), low economic growth expectations do not always translate into low equity return expectations.
Figure II-10: Equity market is not “overvalued” when adjusted for low rates
Shiller CAPE versus estimated fair-value CAPE
P/E
rat
io
0
5
10
15
20
25
30
35
1979 1984 1989 1994 1999 2004 2009 2014
FV CAPE ±1 STD ErrorFV CAPE (MSCI Australia Index)CAPE (MSCI Australia Index)
Notes: “Fair-value CAPE” is based on statistical model that corrects CAPE measures for the level of inflation expectations and for interest rates. The statistical model specification is a five-variable vector error correction (VEC), including equity earnings-yield (MSCI Australia index), Australian ten-year trailing inflation, 10-year trailing equity and bond volatility and ten-year Govt. bond yield estimated over the period January 1970 – September 2015.
Sources: Vanguard calculations, based on data from Thomson Reuters Datastream, the Reserve Bank of Australia and Factset.

27
However, for the purposes of asset allocation, investors should be cautious when considering tactical tilts or strategic portfolios based on just the median expected return—that is, ignoring the entire distribution of outcomes and their correlations. We urge caution for the following reasons:
• A large portion of the return distribution is overlapping (which could negate the intended outperformance with significant odds).
• The projected distributions of long-term returns shown in Figure II-7 and Figure II-8 display wide and fat tails. As discussed in Davis, Aliaga-Díaz, and Thomas (2012b), although valuations are useful in predicting stock returns over the long term, they still leave more than half the volatility of long-run returns unexplained.
• An international equity allocation of 50% of the total equity allocation for an Australian investor has typically provided reasonable diversification benefits, considering factors such as home country bias, although our “ex-ante” optimal recommendation remains market- cap proportional (Philips, 2014).
Having said this, equity portfolios with a high degree of home bias can always take advantage of global diversification benefits by rebalancing toward non-Australian exposures.
EM equity valuations
In terms of emerging markets, Vanguard’s research (see Davis et al., 2013) provides perspective on why the currently weak economic growth environment for China and other BRIC countries should not carry over to our expectations for long-term equity market returns. Markets are forward-looking and thus are already pricing in the lowered market consensus expectations for growth. This is reflected in emerging-market valuations at close to “normal” levels (see Figures II-9a and II-11), suggesting that risk-adjusted returns for emerging markets may not differ much from those of other global equities. Thus, the case for emerging markets in long-term portfolios should be based not on any projected return outperformance but, rather, on the diversification benefits of emerging markets.
Australian REITs
For Australian REITs, our long-term return simulations indicate that the median return expectation is broadly in line with that of the broad Australian equity market, based on similar valuations and volatility. REITs are a subsector of the equity market, so all of REITs potential diversification benefits should be already captured in a broad-market portfolio.
Commodity futures
Figure II-8 also includes simulations for commodity futures returns. The simulated returns show a wide distribution, with lower median returns and slightly lower median volatility than equities. Because commodity
Figure II-11: Emerging market valuations holding up versus other global equities
Prices over 12-month trailing earnings for selected equity indexes
05
1015202530354045
Australia Developed markets ex Australia Emerging markets
1990 1995 2000 2005 2010 2015
Notes: Figure displays price/earnings ratio with 12-month trailing average earnings. Australian equities represented by MSCI Australia Index, “Developed Markets ex Australia” represented by MSCI World ex Australia Index and “Emerging markets” represented by MSCI Emerging Markets Index.
Sources: Vanguard calculations based on data from Thomson Reuters Datastream.

28
futures markets are forward-looking, futures contracts are already pricing in the weak outlook for spot commodity prices. Thus, even if investors believe commodity prices may fall further, this expectation may already be reflected in current pricing.
From a portfolio construction viewpoint, commodities are a good diversifier of Australian equity risk only in the presence of supply-side shocks such as adverse weather for agricultural commodities, or geopolitical events affecting world oil production. When commodity returns are driven by global demand considerations (such as a global economic slowdown), correlations to equity markets tend to increase (in some cases, sharply), and the diversification value may be very low. For these reasons, we caution investors to keep in mind that correlations vary over time as they decide on an adequate exposure to commodities.
Implications for balanced portfolios
To examine the potential portfolio construction implications of Vanguard’s range of expected long-run returns, Figure II-12 (right-hand side) presents simulated real (inflation-adjusted) return distributions for 2015−2025 for three hypothetical portfolios ranging from more conservative to more aggressive: 30% equities/70% bonds; 50% equities/50% bonds; and 70% equities/30% bonds. The historical performance of these portfolios is shown on the left-hand side of the figure. The results have several important implications for strategic asset allocation, as discussed next.
Modest outlook for long-run returns
Amid widespread concern over the current low level of long-term Australian government bond yields, Figure II-12’s real long-run return profile for balanced portfolios may seem better than expected. However, Vanguard believes it’s important for investors to consider real-return expectations when constructing portfolios, because
Figure II-12: Projected ten-year real return outlook for balanced portfolios
History 1958-2015History 2000-201530%/70%: Equity/Bond Portfolio
50%/50%: Equity/Bond Portfolio70%/30%: Equity/Bond Portfolio
ForecastHistory
1968 1973 1978 1983 1988 1993 1998 2003 2008 2013 30%/70% 50%/50% 70%/30%
10-year annualised return
–10
–5
0
5
10
15
20
25%
–10
–5
0
5
10
15
20
25%
Real 5% 25% 50% 75% 95%History 1958-2015
History 2000-2015
30%/70% –0.2% 1.7% 3.0% 4.3% 6.2% 5.3% 4.2%
50%/50% –0.5% 2.2% 4.2% 6.1% 9.0% 5.3% 4.0%
70%/30% –1.1% 2.7% 5.3% 8.0% 12.0% 5.3% 3.6%
Note: Forecast displays the 5th/25th/75th/95th percentile range of 10,000 simulations from VCMM for projected real returns for balanced portfolios in AUD as of September 2015. Historical returns are computed using the indexes defined on page 5. The equity portfolio is 50% Australian equity and 50% global Ex-Australia equity. The bond portfolio is 40% Australian bonds and 60% global Ex-Australia bonds. See appendix section titled “Index simulations” for further details on the asset classes shown above. Hedged returns from June 1969 until 1990 based on availability of 3-month yields for the US and Australia, and use the forward rate based on interest rate differentials. After 1990, returns are hedged using Barclays methodology.
Sources: Vanguard calculations using data from Thomson Reuters Datastream, Bloomberg, Barclays Live, OECD via Federal Reserve, and Moody’s Analytics Databuffet.

29
today’s low government bond yields are, in part, associated with lower expected inflation than was the case 20 or 30 years ago.
Figure II-12 does show that the inflation-adjusted returns of a balanced portfolio for the decade ending 2025 are likely to be moderately below long-run historical averages (indicated by the small boxes for 1958−September 2015). But the likelihood of achieving real returns in excess of those since 2000 for all but the most conservative portfolios is higher.
Specifically, our VCMM simulations indicate that the average annualised returns of a 50% equity/50% bond portfolio for the decade ending 2025 are expected to centre in the 3%–5% real-return range, below the actual average real return of 5.3% for the same portfolio since 1958. Viewed from another angle, the likelihood that our portfolio would achieve at least the 1958–2015 average real return is estimated at approximately 35%, while the odds of attaining a higher real return than that achieved since 2000 (4.0%) are near 50%.
Portfolio construction strategies
Contrary to suggestions that an environment of structural deceleration, subdued inflation pressures, and permanently lower interest rates warrants some radically new investment strategy, Figure II-12 reveals that the simulated ranges of portfolio returns are upward sloping on risk. Simply put, higher risk accompanies higher (expected) return. Our analysis of equity valuations in Figure II-10 showed that the Australian equity risk premium endures, when one adjusts for the muted expectations for global inflation and interest rates. Thus, according to our VCMM simulations, the forward-looking equity risk premium expectation over bonds may not be lower than it has been in the past.
Nevertheless, although risk–return trade-offs and equity risk premiums may not be different, portfolio return expectations themselves need to be lowered based on the prospects of lower global trend growth and central banks’ lifting of policy rates very gradually over time. In this environment, we expect asset yields to be lower relative to historical norms across the board, both for equities and fixed income. Investment objectives based either on fixed spending requirements or on fixed portfolio return targets may require investors to consciously assess whether the extra risk needed to reach those goals is within reasonable risk-tolerance levels. A balanced approach may also include calibrating investment objectives against reasonable portfolio return expectations and adjusting investment behaviour, such as savings and portfolio contributions.
We encourage investors to evaluate carefully the trade- offs involved in any shifts toward risky asset classes— that is, tilting a bond portfolio toward corporate and high- yield investments or making a wholesale move from bonds into equities. The crosscurrents of valuations, structural deceleration, and divergent monetary policies imply that the investment environment is likely to be more challenging and volatile in the years ahead. Both a realistic expectation of the extra return to be gained in such an environment and an understanding of the implications for holistic portfolio risk are crucial to maintaining the discipline needed for long-term investment success.
References
Davis, Joseph H., Roger Aliaga-Díaz, and Charles J. Thomas, 2012. Forecasting Stock Returns: What Signals Matter, and What Do They Say Now? Valley Forge, Pa.: The Vanguard Group.
Davis, Joseph, Roger Aliaga-Díaz, Charles J. Thomas, and Ravi G. Tolani, 2013. The Outlook for Emerging Market Stocks in a Lower-Growth World. Valley Forge, Pa.: The Vanguard Group.
Davis, Joseph H., Qian Wang, Alexis Gray, and Harshdeep Ahluwalia, 2015. Vanguard’s Economic and Investment Outlook. The Vanguard Group.
Davis, Joseph H., Roger Aliaga-Díaz, Harshdeep Ahluwalia, and Ravi G. Tolani, 2016 (forthcoming). An Update to Forecasting Stock Returns. Valley Forge, Pa.: The Vanguard Group.
Ilzetzki, Ethan, Carmen M. Reinhart, and Kenneth S. Rogoff, 2011. The Country Chronologies and Background Material to Exchange Rate Arrangements into the 21st Century: Will the Anchor Currency Hold? Working paper.
Kinniry, Francis M., and Brian J. Scott, 2013. Reducing Bonds? Proceed with Caution. Valley Forge, Pa.: The Vanguard Group.
Vanguard Group, The, 2015a. Global Macro Matters— China’s Key Risk: It’s Housing Not Stocks. Valley Forge, Pa.: The Vanguard Group.
Vanguard Group, The, 2015b. Global Macro Matters— Japan: The Long Road Back to Inflation. Valley Forge, Pa.: The Vanguard Group.
Vanguard Group, The, 2015c. Global Macro Matters—Remember the ‘90s? Emerging Markets Then and Now. Valley Forge, Pa.: The Vanguard Group.

30
III Appendix
About the Vanguard Capital Markets Model
IMPORTANT: The projections or other information generated by the Vanguard Capital Markets Model regarding the likelihood of various investment outcomes are hypothetical in nature, do not reflect actual investment results, and are not guarantees of future results. VCMM results will vary with each use and over time.
The VCMM projections are based on a statistical analysis of historical data. Future returns may behave differently from the historical patterns captured in the VCMM. More important, the VCMM may be underestimating extreme negative scenarios unobserved in the historical period on which the model estimation is based.
The Vanguard Capital Markets Model is a proprietary financial simulation tool developed and maintained by Vanguard’s Investment Strategy Group. The model forecasts distributions of future returns for a wide array of broad asset classes. Those asset classes include
Australian and international equity markets, several maturities of the Australian Treasury and corporate fixed income markets, international fixed income markets, money markets, commodities, and certain alternative investment strategies. The theoretical and empirical foundation for the Vanguard Capital Markets Model is that the returns of various asset classes reflect the compensation investors require for bearing different types of systematic risk (beta). At the core of the model are estimates of the dynamic statistical relationship between risk factors and asset returns, obtained from statistical analysis based on available monthly financial and economic data from as early as 1960. Using a system of estimated equations, the model then applies a Monte Carlo simulation method to project the estimated interrelationships among risk factors and asset classes as well as uncertainty and randomness over time. The model generates a large set of simulated outcomes for each asset class over several time horizons. Forecasts are obtained by computing measures of central tendency in these simulations. Results produced by the tool will vary with each use and over time.
Figure III-1: Projected ten-year nominal return outlook for balanced portfolios
History 1958-2015History 2000-201530%/70%: Equity/Bond Portfolio
50%/50%: Equity/Bond Portfolio70%/30%: Equity/Bond Portfolio
ForecastHistory
0
5
10
15
20
25
30%
1968 1973 1978 1983 1988 1993 1998 2003 2008 2013 30%/70% 50%/50% 70%/30%
–5
0
5
10
15
20%
10-year annualised return
Nominal 5% 25% 50% 75% 95%History 1958-2015
History 2000-2015
30%/70% 2.0% 3.8% 5.0% 6.2% 8.0% 10.3% 7.2%
50%/50% 1.5% 4.3% 6.2% 8.2% 11.0% 10.4% 6.9%
70%/30% 0.8% 4.7% 7.4% 10.1% 14.2% 10.3% 6.6%
Note: Forecast displays the 5th/25th/75th/95th percentile range of 10,000 simulations from VCMM for projected nominal returns for balanced portfolios in AUD as of September 2015. Historical returns are computed using the indexes defined on page 5. The equity portfolio is 50% Australian equity and 50% global Ex-Australia equity. The bond portfolio is 40% Australian bonds and 60% global Ex-Australia bonds. See appendix section titled “Index simulations” for further details on the asset classes shown above. Hedged returns from June 1969 until 1990 based on availability of 3-month yields for the US and Australia, and use the forward rate based on interest rate differentials. After 1990, returns are hedged using Barclays methodology
Source: Vanguard calculations using data from Thomson Reuters Datastream, Bloomberg, Barclays Live, OECD via Federal Reserve, and Moody’s Analytics Databuffet.

31
The primary value of the VCMM is in its application to analysing potential client portfolios. VCMM asset- class forecasts—comprising distributions of expected returns, volatilities, and correlations—are key to the evaluation of potential downside risks, various risk–return trade-offs, and diversification benefits of various asset classes. Although central tendencies are generated in any return distribution, Vanguard stresses that focusing on the full range of potential outcomes for the assets considered, such as the data presented in this paper, is the most effective way to use VCMM output.
The VCMM seeks to represent the uncertainty in the forecast by generating a wide range of potential outcomes. It is important to recognise that the VCMM does not impose “normality” on the return distributions, but rather is influenced by the so-called fat tails and skewness in the empirical distribution of modelled asset-class returns. Within the range of outcomes, individual experiences can be quite different, underscoring the varied nature of potential future paths. Indeed, this is a key reason why we approach asset-return outlooks in a distributional framework, as shown in Figure III-1, which highlights balanced portfolio returns before adjusting for inflation.
Figure III-2 further illustrates this point by showing the full range of scenarios created by the model. The scatter plot displays 10,000 geometric average ten-year returns and standard deviations for Australian equities. The dispersion in returns and volatilities is wide enough to encompass historical market performance for various decades.
Index simulations
The long-term returns of our hypothetical portfolios are based on data for the appropriate market indexes through September 2015. We chose these benchmarks to provide the most complete history possible, and we apportioned the global allocations to align with Vanguard’s guidance in constructing diversified portfolios. Asset classes and their representative forecast indexes are as follows:
• Australian equities: MSCI Australia Index.
• Global ex-Australia equities: MSCI All Country World ex-Australia Index.
• Australian REITs: FTSE EPRA/NAREIT Australian Index.
• Commodity futures: Bloomberg Commodity Index in AUD (unhedged).
• Australian cash: Australian 1-Month Government Bond.
• Australian Government bonds / Treasury Index: Barclays Australian Aggregate Treasury Bond Index.
• Australian credit bonds: Barclays Australian Credit Index.
• Australian bonds: Barclays Australian Aggregate Bond Index.
• Global ex-Australia bonds: Barclays Global Aggregate ex-AUS Bond Index.
• Australian Linkers: Barclays Australia Inflation Linked Treasury Index.
• Short-term Treasury index: Barclays Australian Aggregate Treasury 1-5 Year Bond Index.
• Long-term Treasury index: Barclays Australian Aggregate Treasury 10+ Year Bond Index.
Figure III-2: VCMM simulation output for broad Australian stock market (10,000 simulations)
An
nu
alis
ed 1
0-ye
ar r
etur
ns
Annual volatility
10,000 simulations Median simulation 1970s 1980s 1990s2000s
–20
–10
0
10
20
30
40
50%
0 10 20 30 40%
Source: Vanguard. Historical returns are computed using the indexes defined on page 5.

© 2015 Vanguard Investments Australia Ltd. All rights reserved. ISGVEMOAU 012015
Connect with Vanguard™ > vanguard.com.au > 1300 655 102
This paper includes general information and is intended to assist you. Vanguard Investments Australia Ltd (ABN 72 072 881 086 / AFS Licence 227263) is the product issuer. We have not taken your circumstances into account when preparing the information so it may not be applicable to your circumstances. You should consider your circumstances and our Product Disclosure Statements (“PDSs”) before making any investment decision. You can access our PDSs at vanguard.com.au or by calling 1300 655 102. Past performance is not an indication of future performance. This publication was prepared in good faith and we accept no liability for any errors or omissions.