healthcare performance management model: system dynamics
TRANSCRIPT

1
Healthcare Performance Management Model: System Dynamics Approach
By
Hisham Amin
Deputy General manager and Marketing Manager Cairo Medical Center, Cairo, Egypt
Tel/Fax: + 2 02 452 1074, +2 012 217 1166 [email protected]
Khaled Wahba
Assistant Professor, Systems and Biomedical Engineering Department Faculty of Engineering, Cairo University Tel: +2 02 737 6006, Fax: +2 02 739 1380
[email protected] ABSTRACT Healthcare centers all over the world, and especially in the Middle East, face a situation of increasing revenues, (though at a decreasing rate), while margins of profit are decreasing markedly. In an attempt to control expenses, hospital managements have tended to respond to this situation by introducing across-the-board cost-cutting policies (most of which have targeted number of employees – increase in layoffs – employee benefits – and decrease in ‘bonuses’). In addition, managements have had a tendency to over-use ‘punishment of employees’ and increased ‘work-pressure’ as their primary response to performance short-falls. We will show that the resultant drop in employee motivation, and morale, is one of the main factors in the deterioration of ‘profit levels’. This simple study is a primary attempt to visualize, and articulate, the ‘Dynamics’ between management policies, employee motivation, patient satisfaction, and revenues and expenses (profits). It is not an attempt to ‘create’ the ‘ideal hospital model’. It is a modeling of the inter-relationships between these variables, as they exist today, in most Egyptian hospital environments. Hospital-managements must be shown that the current era of globalization and increasing competition (from inside and outside Egypt) has completely changed the ‘health market’. Management must comprehend that the main remaining ‘competitive advantage’ of any service-company is in its’ employees – the other parameters of service have been largely standardized, and are almost regarded as assumed. We will show, in our different scenarios of Policy Design, that hospitals need to implement policies to maximize utilization of their ‘human resources’, thus maximizing ‘quality of service’ and subsequent ‘patient satisfaction’. Only in this way will they be able to promote higher profit levels and ensure a more successful future in a turbulent market.

2
INTRODUCTION Between 1970 – 1990 hospitals enjoyed a ‘golden era’ of business in Egypt. However, several factors started to change the dynamics of the Egyptian health market: • The apparent high profitability of this kind of enterprise encouraged several large
investors to enter this field, and several new, large hospitals were opened; permanently changing the previous ‘monopoly’ conditions.
• The Egyptian pound started losing strength against the U.S. dollar, and most of the loans taken to start medical projects were in U.S. dollars. This was a situation for which there was no contingency plan; and a solution needed to be found immediately before these loans, and their interest, pushed the projects into bankruptcy.
• Medical insurance companies, both local and foreign, penetrated the market aggressively and changed the financing of hospital-care drastically. By definition, third-party-payor insurance companies will concentrate all their efforts towards minimizing the costs of care and placed strong pressures on hospitals in that regard. Patient referral to any particular hospital, which they now controlled, had become a function of the quality of care plus minimum prices.
Medical care in Egypt had therefore been pushed into a corner of efficiency that it was not used to, where the maximum was being demanded for the minimum. In essence, this meant that margins of profit were diminishing to levels not seen by hospitals for years. In response to these changes in the market, hospitals started in the early 1990’s, a general policy of ‘minimization of expenses’; and since employees were regarded as an expense (instead of an asset), most of these expense cuts were targeted at the work force. This took the form of a whole set of ‘typical’ policies ranging from bonus cuts to lay-offs. What everyone seemed to be over looking was that hospitals are ‘service’ companies; and the level of service given to the patients is directly proportional to the workers morale and their level of motivation. Instead, the same policies continued and drops in performance were faced by increasing levels of ‘punishment’ and ‘work-pressure’, which of-course made matters even worse. Even when there were clear signs that something major was wrong with employee motivation and morale, such as an ever-increasing level of turnover in all ranks of workforces, they were overlooked. This eventually reached a stage where between the years of 1992 and 2000, hospitals in Egypt had an average employee turnover rate of around 20 %. PROBLEM DEFINITION AND OBJECTIVE Healthcare managements seem to be under-estimating that healthcare delivery is a ‘service’; and that levels of service given to patients are directly proportional to worker morale and their level of motivation. We need to change top management’s perception of the real value of a satisfied workforce. However, we realize that in the current state of the market the primary focus and concern of hospital management is on the “bottom-line” and its effect on the ‘net profit’. It is hoped that the actual process of constructing the model will help to change the mental model by which top management views it’s employees; and to show them the qualitative and quantitative side-effects and ‘loops’ of the current employee-policies.
3
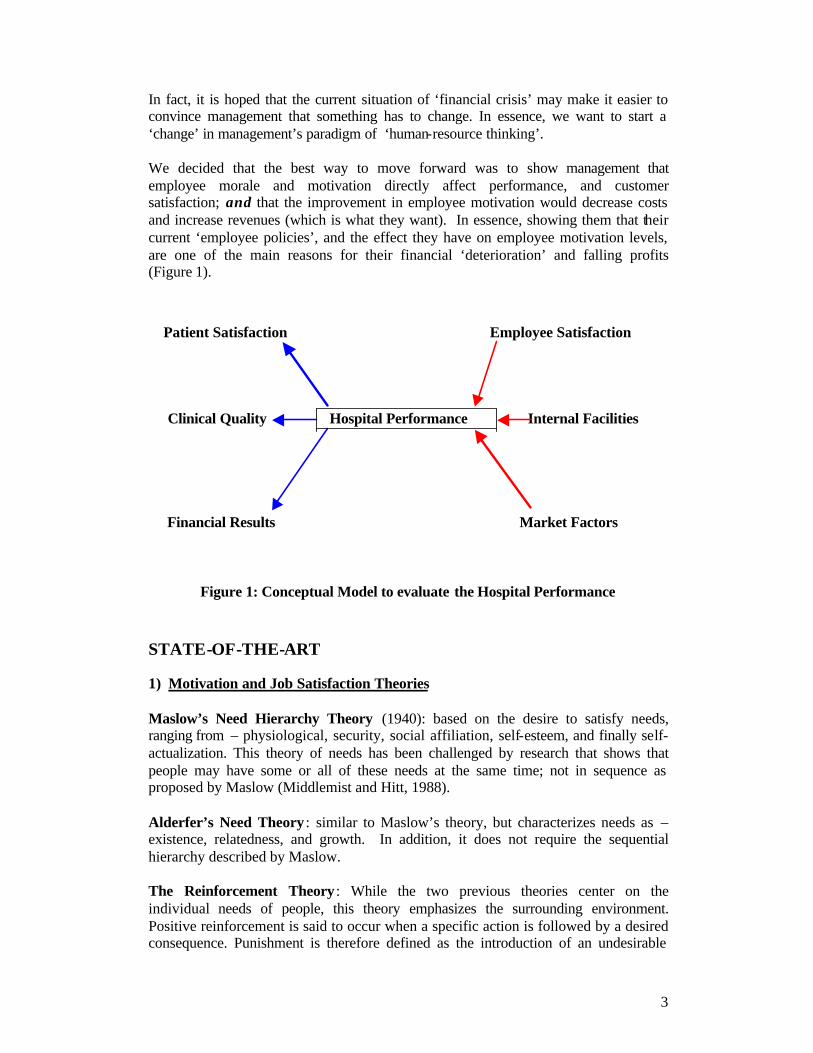
In fact, it is hoped that the current situation of ‘financial crisis’ may make it easier to convince management that something has to change. In essence, we want to start a ‘change’ in management’s paradigm of ‘human-resource thinking’. We decided that the best way to move forward was to show management that employee morale and motivation directly affect performance, and customer satisfaction; and that the improvement in employee motivation would decrease costs and increase revenues (which is what they want). In essence, showing them that their current ‘employee policies’, and the effect they have on employee motivation levels, are one of the main reasons for their financial ‘deterioration’ and falling profits (Figure 1).
Patient Satisfaction Employee Satisfaction Clinical Quality Hospital Performance Internal Facilities Financial Results Market Factors
Figure 1: Conceptual Model to evaluate the Hospital Performance STATE-OF-THE-ART 1) Motivation and Job Satisfaction Theories Maslow’s Need Hierarchy Theory (1940): based on the desire to satisfy needs, ranging from – physiological, security, social affiliation, self-esteem, and finally self-actualization. This theory of needs has been challenged by research that shows that people may have some or all of these needs at the same time; not in sequence as proposed by Maslow (Middlemist and Hitt, 1988).
Alderfer’s Need Theory : similar to Maslow’s theory, but characterizes needs as – existence, relatedness, and growth. In addition, it does not require the sequential hierarchy described by Maslow. The Reinforcement Theory : While the two previous theories center on the individual needs of people, this theory emphasizes the surrounding environment. Positive reinforcement is said to occur when a specific action is followed by a desired consequence. Punishment is therefore defined as the introduction of an undesirable

4
consequence to eliminate a specific behaviour (Callahan, 1986). This theory is good at predicting factors like quality and quantity of work, but does not offer insight into employee satisfaction.
The Goal Setting Theory: this is a cognitive approach based on the premise that individuals are more likely to be committed to achieve goals if they are high and/or difficult (Robbins, 1998). It is a theory that addresses levels of employee productivity, but does not explain satisfaction, absenteeism, or turnover.
The Expectancy Theory: in this theory Victor Vroom describes job performance as a function of a self-assessment by an individual to the expected outcomes of his/her effort (Steers and Porter, 1983). The Equity Theory : this theory asserts that employees compare the inputs they invest in their jobs and the outcomes they receive in return – in comparison with what their fellow employees invest and get in return (John, 1988). Theory X and Theory Y: in this theory, Douglas McGregor proposes two distinct views of human beings. Negative: people dislike work, are lazy, dislike responsibility, and must be coerced Positive: people like work, are creative, seek responsibility, and can be trusted. The presumption is that managers must respond to employees depending on their assumptions of their basic negative/positive behaviour patterns (Robbins, 1988).
Motivation-Hygiene Theory : Psychologist Fredrick Herzberg proposes that the opposite of satisfaction is not dissatisfaction. The removal of dissatisfying things in a job does not necessarily make the job satisfying. Herzberg describes a continuum from satisfaction to no satisfaction (motivating factors) – and another continuum from dissatisfaction to no dissatisfaction (hygiene factors). McClelland’s Theory of Needs: this theory focuses on three basic needs: need for achievement, need for power and need for affiliation, (Robbins, 1998). 2) Customer (Patient) satisfaction, Employee satisfaction, and Profit “If I take care of my people, they will take care of the customer”. Truer words have never been spoken. Yet every day we hear about organizations focusing on getting new business while ignoring the needs of their own staff. The leader must have a dream. He must be clear about what the dream is. Second they must buy into that dream themselves. If these two tenets are in place then, and only then, can leaders sell this dream to others. People have varying motivations for actions that they take. Employees’ motivation range from basic pay and benefits to higher levels of socialization, challenge or escape. Successful business people recognize these varying degrees of motivation. They have learned to help people reach the upper tier. The successful manager develops a strong reputation and connection with employees, which helps him/her recruit the best and brightest. And in turn they tell others about the great organization that they work for. It is good advertising to have

5
happy, committed employees who know they are a valued team member, (D’Egidio, 2002). Employee retention and turnover are the most objective measures of employee satisfaction/dissatisfaction in organizations. Common estimates of turnover costs range from $10,000 to $40,000 per person, depending on the position; while retention actually increases revenues. The Harvard Business review reports that a 5% increase in retention results in a 10% decrease in costs and productivity increases ranging from 25% to 65%. Many companies and organizations feel that employee compensation is the dominant factor in employee satisfaction. Consequently, employers attempt to “buy” employee satisfaction with increased pay and benefits. In today’s competitive business environment this approach can only be taken so far. Fortunately, there is a much less expensive way to create greater employee satisfaction. It is virtually cost free and it increases productivity, which significantly improves the “bottom line.” William M. Mercer, Inc. found in surveying 206 medium to large companies in 1998 that in organizations with high turnover, compensation was the most common reason given for dissatisfaction. However, in companies with very low turnover, 40% of the respondents perceived emotional factors (work satisfaction, good relationships with managers and other employees) as completely motivating their retention as compared to 21% attributing financial factors (satisfaction with compensation and benefits) as completely motivating their retention. [Note: compensation and benefits satisfy the two lowest needs of Maslow’s Hierarchy, while the emotional factors satisfy the three upper needs of the Hierarchy] A work environment that constantly raises an employee’s self-esteem, above that she/he experiences anywhere else in their life, will be where she/he most desires to spend their time and yields very high employee satisfaction with their job and costs next to nothing. Principle: People do more of what they enjoy and less of what they don’t enjoy! Consequence: People who enjoy working are more productive! Creating such a work environment is the responsibility of all corporate or organizational leadership, but most critically it is the primary job of the person the employee reports to directly. There are no business schools that teach how to create such an environment and very few training programs that train managers the behaviors necessary to do so, (Mercer, Inc., 1998). Employee satisfaction and retention have always been important issues for physicians. After all, high levels of absenteeism and staff turnover can affect the bottom line, as temps, recruitment and retraining take their toll. But few practices (in fact, few organizations) have made job satisfaction a top priority, perhaps because they have failed to understand the significant opportunity that lies in front of them. Satisfied employees tend to be more productive, creative and committed to their employers, and recent studies have shown a direct correlation between staff satisfaction and patient satisfaction. Family physicians who can create work environments that attract, motivate and retain hard-working individuals will be better positioned to succeed in a competitive health care environment that demands quality and cost-efficiency. What's more, physicians may even discover that by creating a positive workplace for their employees, they've increased their own job satisfaction as well.

6
While there is no one right way to manage people, all of whom have different needs, backgrounds and expectations, Herzberg's theory offers a reasonable starting point. By creating an environment that promotes job satisfaction, a manager can develop employees who are motivated, productive and fulfilled. This, in turn, will contribute to higher quality patient care and patient satisfaction (Kaldenberg, 1999). The advent of managed care and capitation has demanded that the physician become more than just a leader in his or her practice. For the practice to compete in the increasingly corporate world of health care, the physician must also be an efficient and effective manager. This managerial role calls for the ability to do everything from negotiating managed care contracts to guiding the day-to-day functioning of the office. As managed care demands tighter cost control from physicians, clinical office, or hospital, efficiency becomes increasingly important. For many physicians, management is not a pleasant role. They consciously "switch hats" as they move from the exam room to the manager's office. The manager's office is where tough decisions need to be made, while the exam room is where "people can be helped." This switch in roles is too dramatic for many physicians, and they prefer to leave the role of manager to others. We see this in the large number of physicians leaving private practice and either merging with larger groups or selling their practices and becoming employees. The problem is not so much that physicians are unwilling to learn or acquire appropriate managerial skills. Nor is it that they're ostriches hiding their heads in the sand. One of the major reasons physicians don't want to assume managerial roles in their practices is that they don't see management as being consistent with their altruistic mission. They are simply not motivated to accept this mantle since they don't derive any satisfaction from being efficient administrators. It's not that physicians don't want to be leaders; they just don't want to be administrators or managers. Before physicians can be expected to devote their time and energy to acquiring administrative skills, they must feel motivated to make this commitment. What many physicians don't see are the opportunities for altruism that lie within their responsibilities as managers in their own practices. The clinic site is on a par with the model of a family-run business, but it's rarely treated that way. In health care, the emphasis is never on the employees; it's always on the patients. “Physician leaders should reconsider the current paradigm of leadership in which their managerial energies are focused solely on improving patient care and the measure of success is patient satisfaction. Instead, I suggest that when physicians are in leadership or managerial roles they also focus on the satisfaction and happiness of their employees. Physician leaders can derive immense satisfaction from knowing they have created an environment in which their employees enjoy work. In a practice environment like this, the measures of success would include levels of absenteeism and staff turnover, not only patient satisfaction. Excellent patient care should always be of foremost importance; but it should not be at the expense of the staff. Study after study has shown that improving the workplace results in improved quality of health-care for patients.

7
As more physicians are able to see the altruism involved in being a good leader - the sense of satisfaction that can be derived from caring leadership - we will see more physicians ready to assume this role. They will no longer perceive management as being at odds with patient care but instead will recognize their unique position to enrich the lives of their patients and their employees”, (Syptak, 1998). SYSTEM DYNAMIC PROCESS Problem Articulation: (Using a private hospital as an example) Key variables From the above discussion of the problem, the main key variables that will be considered at this paper are:
• Employee motivation • Profit (Revenue and Expenses) • Service performance • Patient satisfaction • Number of hospital patients, and their referral sources • Number of hospital employees • Hospital management responses to performance gaps
Time horizon Past: Though the general situation was exacerbated in the past five years, we
believe the roots of the problem lie from the early 1990’s when hospitals started indiscriminate cost-cutting policies targeting mainly the work-force – [so we should look back about ten years].
Future: Trying to institute a ‘paradigm change’ in the way management perceives the value of it’s employees (and the importance of their morale levels), takes a relatively long time to implement and show results – [so we probably need to look at least five years ahead].
Dynamic problem definition (reference modes): Performance gap
1990 1996 2001 Figure 2: Service performance
8
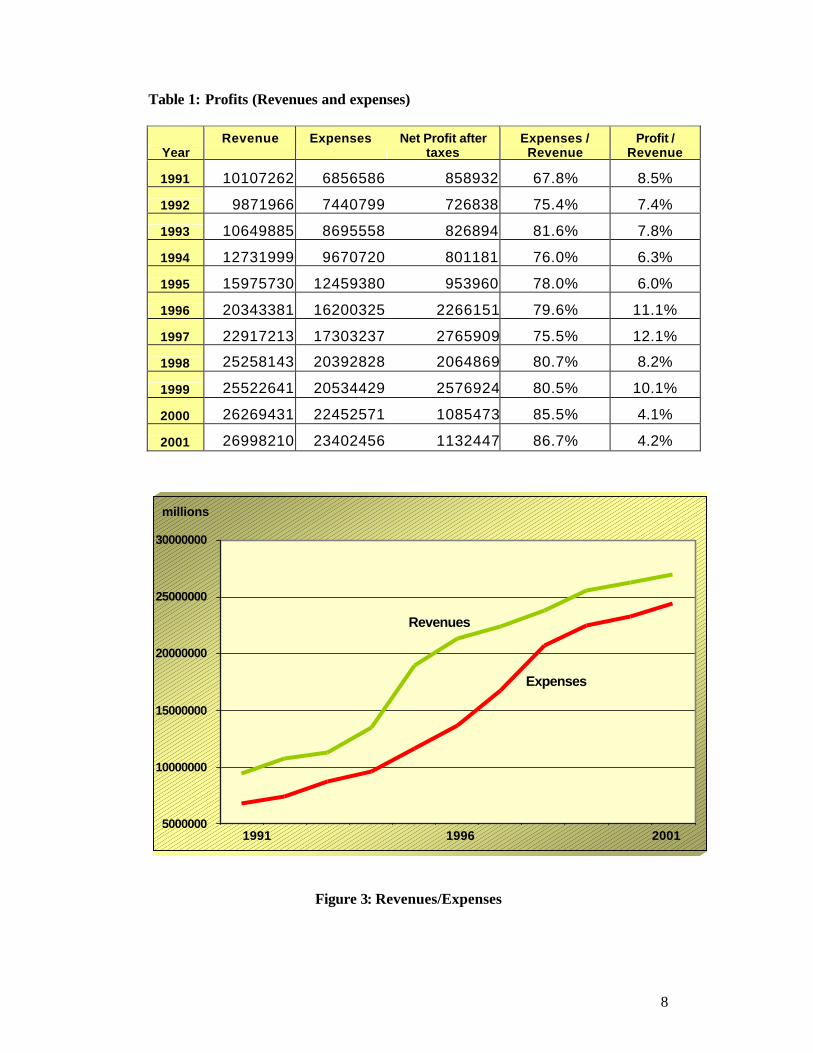
Table 1: Profits (Revenues and expenses)
Year Revenue
Expenses
Net Profit after
taxes Expenses /
Revenue Profit /
Revenue
1991 10107262 6856586 858932 67.8% 8.5%
1992 9871966 7440799 726838 75.4% 7.4%
1993 10649885 8695558 826894 81.6% 7.8%
1994 12731999 9670720 801181 76.0% 6.3%
1995 15975730 12459380 953960 78.0% 6.0%
1996 20343381 16200325 2266151 79.6% 11.1%
1997 22917213 17303237 2765909 75.5% 12.1%
1998 25258143 20392828 2064869 80.7% 8.2%
1999 25522641 20534429 2576924 80.5% 10.1%
2000 26269431 22452571 1085473 85.5% 4.1%
2001 26998210 23402456 1132447 86.7% 4.2%
5000000
10000000
15000000
20000000
25000000
30000000
1 2 3 4 5 6 7 8 9 10 11
200119961991
Revenues
Expenses
millions
Figure 3: Revenues/Expenses

9
Major patient complaints/no. of patients/year (customer surveys) No surveys were done in these years 1990 1996 2001
Figure 4: Patient Satisfaction Scale from 1 – 10 (employee surveys) No surveys were done in these years 1990 1996 2001
Figure 5: Employee Satisfaction
10
(Thousands / year) doctor contract 6000 referrals referral 5000 4000 3000 2000 private walk-in 1000 patients 1990 1996 2001
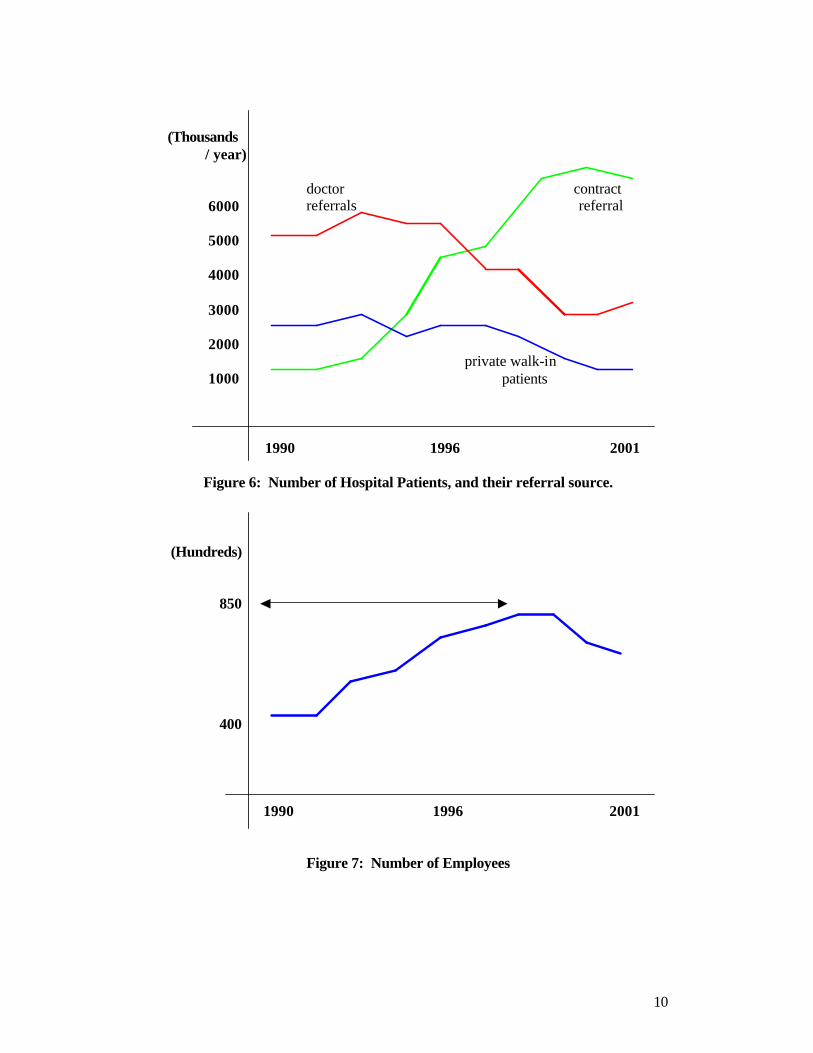
Figure 6: Number of Hospital Patients, and their referral source. (Hundreds) 850 400 1990 1996 2001
Figure 7: Number of Employees

11
25 % 50 % 75 % 2001 2000 1999 1998 1997 1996 1995 1994 1993 1992 1991 1990 Punishment Financial bonus Quality programs and training Employee-motivation policies
Figure 8: Hospital management responses to performance gaps

12
Dynamic Hypothesis 1. Patient satisfaction is directly related to the no. of patient referrals that the hospital
receives (repeat business) through ‘word of mouth’. This is particularly important in eastern cultures, such as Egypt, where people have a tendency to ‘talk a lot’ especially when they are complaining about something. – and hospitals have a tendency to underestimate the importance of this because they think that they are going to get patients anyway through their ‘contracts’. (fig. 6).
2. The increasing ‘knowledge’ available to the general public, through the media, has raised their expectations to a level where they now demand much higher levels of service. – and this has not been met by a corresponding increasing level of service by the hospitals. (fig. 4).
3. The total number of employees (and the expenses incurred for them) is a summation of the hiring rate, the lay-off rate, and the quit rate. – each of these has its contributing factors that decide it’s rate. Human resource policies in hospitals are reactionary to the amount of work needing to be done, and the levels of ‘expenses’ that the hospital can incur at the time; and there are therefore no standard policies guiding any of these ‘rates’, or the factors that affect them.(Fig.7)
4. The hospital level of service performance is a function of the amount of work done and the level of quality of that work. – but hospitals have a tendency to disregard the importance of quality, concentrating instead on servicing the maximum number of patients possible.
5. The hospital monitors ‘clinical, technical’ performance through: - defects in specific required standards. - customer satisfaction surveys.
But they do not monitor other measures of performance (from the patient’s point of view), such as laundry service, food quality … etc. 6. Hospitals respond to defects in performance (performance gap) by:
• ‘Punishment’ of employees. the most used method, completely ignoring its effect on employee motivation, and subsequent levels of quality and performance.
• Decreasing financial bonuses. the classical ‘carrot’ method which employees have learned to dislike because they eventually realized that they are not directly related to their performance, but are more a function of general ‘cost-cutting’ policies, plus who gets the bonus depends on subjective criteria usually related to who likes who.
• Increasing quality programs. - poor Management Commitment • Employee-motivation policies.- poor Management Understanding. (Fig. 8)

13
Causal Loops The Causal Loop of the hospital Performance Model is shown in figures 9 and 10.
workcapacity
Workloadworking overtime
fatigue Qualityof work
required no.ofemployees
Hiringrate
No. ofemployees
Expenses Lay-offrate
+
+
+
+-
HospitalPatients
Revenue
+
+
EmployeeMotivation
+
Public AwarenessPatient
Satisfaction
Walk-in patient
Word ofmouth
++
++
+Performance gap
requiredperformance
Actual serviceperformance
+
-
+
Hospital standards+
Hospitalwillingness to
increaseperformance
punishment+
-
-
Quitrate
-
-
Sales
Patient referral(Doctors)
PROFIT
+ -
+
+
+
+
productivity+
employee bonus+
++
+
++
+
+
+
-
+
-
-
media
1
23
4
+ +
Patient referral(contracts)
+
+
+ Quality programsand training
+
+
work redo
+
+
+
patient expectation+ +
-
-
+
Work pressure
+-
+
+
+
-
+
Figure 9: The Main Causal Loop of the Hospital Performance Model (a)

14
adoption of employeemotivation-promoting
policies+
flexiblework-hours
salary
oral / writtenpraise
days offday-care centre
on-job training
in-formal dress
involvement indecision-making
clear communicationwith management
fair promotioncriteria
working conditions
clear jobresponsibilities
transportationfacilities
cafeteria / restlounge
+
+
+
+
+
+
+
+
+
+
+
+
+
+
++
+
+ ++
++
++
+ +
Figure 10: The Main Causal Loop of the Hospital Performance Model (b)

15
Loop Analysis
workcapacity
Workloadworking overtime
fatigue Qualityof work
required no.ofemployees
Hiringrate
No. ofemployees
Expenses Lay-offrate
+
+
+
+-
HospitalPatients
Revenue
+
+
EmployeeMotivation
+
Public AwarenessPatient
Satisfaction
Walk-in patient
Word ofmouth
++
++
+Performance gap
requiredperformance
Actual serviceperformance
+
-
+
Hospital standards+
Hospitalwillingness to
increaseperformance
punishment+
-
-
Quitrate
-
-
Sales
Patient referral(Doctors)
PROFIT
+ -
+
+
+
+
productivity+
employee bonus+
++
+
++
+
+
+
-
+
-
-
media
1
23
4
+ +
Patient referral(contracts)
+
+
+ Quality programsand training
+
+
work redo+
+
+
patient expectation+ +
-
-
+
Work pressure
+-
+
+
+
-
+
Figure 11: Patient Satisfaction and Public Awareness The outlined positive, reinforcing, loop describes how Patient Satisfaction drives Word-of-mouth and Public awareness resulting in further patient referrals to the hospital in three ways: from doctors, from third-party-payor contracts, and private pt. It also shows how Patient satisfaction drives a negative, balancing, loop through increased Patient expectations, who in return require a higher performance, thus increasing the Performance gap and decreasing Patient satisfaction.

16
workcapacity
Workloadworking overtime
fatigue Qualityof work
required no.ofemployees
Hiringrate
No. ofemployees
Expenses Lay-offrate
+
+
+
+-
HospitalPatients
Revenue
+
+
EmployeeMotivation
+
Public AwarenessPatient
Satisfaction
Walk-in patient
Word ofmouth
++
++
+Performance gap
requiredperformance
Actual serviceperformance
+
-
+
Hospital standards+
Hospitalwillingness to
increaseperformance
punishment+
-
-
Quitrate
-
-
Sales
Patient referral(Doctors)
PROFIT
+ -
+
+
+
+
productivity+
employee bonus+
++
+
++
+
+
+
-
+
-
-
media
1
23
4
+ +
Patient referral(contracts)
+
+
+ Quality programsand training
+
+
work redo+
+
+
patient expectation+ +
-
-
+
Work pressure
+-
+
+
+
-
+
Figure 12:Hospital Management Responses to Performance gaps
In response to performance gaps, hospital management can; - trigger loop labeled (2) – punishment: this starts a positive loop through increased Work pressure, which increases Productivity, which increases Work capacity, which increases Service performance, which hence will decrease the Performance gap. However, the increased Work pressure also triggers two negative loops affecting Quality of work – directly, and through its negative effect on Employee motivation, which will therefore decrease both Productivity and Quality of work. - trigger loop labeled (3) – employee bonus: this triggers two positive loops through Employee motivation, increasing Productivity and Quality of work. - trigger loop labeled (4) – quality training: this starts a positive loop by increasing Quality of work, which increases Service performance, which will decrease the Performance gap.

17
workcapacity
Workloadworking overtime
fatigue Qualityof work
required no.ofemployees
Hiringrate
No. ofemployees
Expenses Lay-offrate
+
+
+
+-
HospitalPatients
Revenue
+
+
EmployeeMotivation
+
Public AwarenessPatient
Satisfaction
Walk-in patient
Word ofmouth
++
++
+Performance gap
requiredperformance
Actual serviceperformance
+
-
+
Hospital standards+
Hospitalwillingness to
increaseperformance
punishment+
-
-
Quitrate
-
-
Sales
Patient referral(Doctors)
PROFIT
+ -
+
+
+
+
productivity+
employee bonus+
++
+
++
+
+
+
-
+
-
-
media
1
23
4
+ +
Patient referral(contracts)
+
+
+ Quality programsand training
+
+
work redo+
+
+
patient expectation+ +
-
-
+
Work pressure
+-
+
+
+
-
+
Figure 13: Different Loops connecting Workload, Service performance, Number of employees, Employee motivation, as well as Profit - A negative, balancing loop: increased Workload increases required number of employees, which increases the hiring rate, which increases the actual workforce, which increases the Work capacity, which will decrease the Workload. - A negative, balancing loop: increased Workload increases Working overtime, which increases the Work capacity, which will decrease the workload. However, increased Working overtime increases Fatigue, which starts another negative loop through decreasing Quality of work. [Note that both loops result in an increase in expenses (a decrease in Profits)] - Increasing number of Hospital patients increases Revenue (and thus Profits), but it also triggers several negative balancing loops through increasing Work pressure, which has a negative impact on Employee motivation and on Quality of work.
18
workcapacity
Workloadworking overtime
fatigue Qualityof work
required no.ofemployees
Hiringrate
No. ofemployees
Expenses Lay-offrate
+
+
+
+-
HospitalPatients
Revenue
+
+
EmployeeMotivation
+
Public AwarenessPatient
Satisfaction
Walk-in patient
Word ofmouth
++
++
+Performance gap
requiredperformance
Actual serviceperformance
+
-
+
Hospital standards+
Hospitalwillingness to
increaseperformance
punishment+
-
-
Quitrate
-
-
Sales
Patient referral(Doctors)
PROFIT
+ -
+
+
+
+
productivity+
employee bonus+
++
+
++
+
+
+
-
+
-
-
media
1
23
4
+ +
Patient referral(contracts)
+
+
+ Quality programsand training
+
+
work redo
+
+
+
patient expectation+ +
-
-
+
Work pressure
+-
+
+
+
-
+
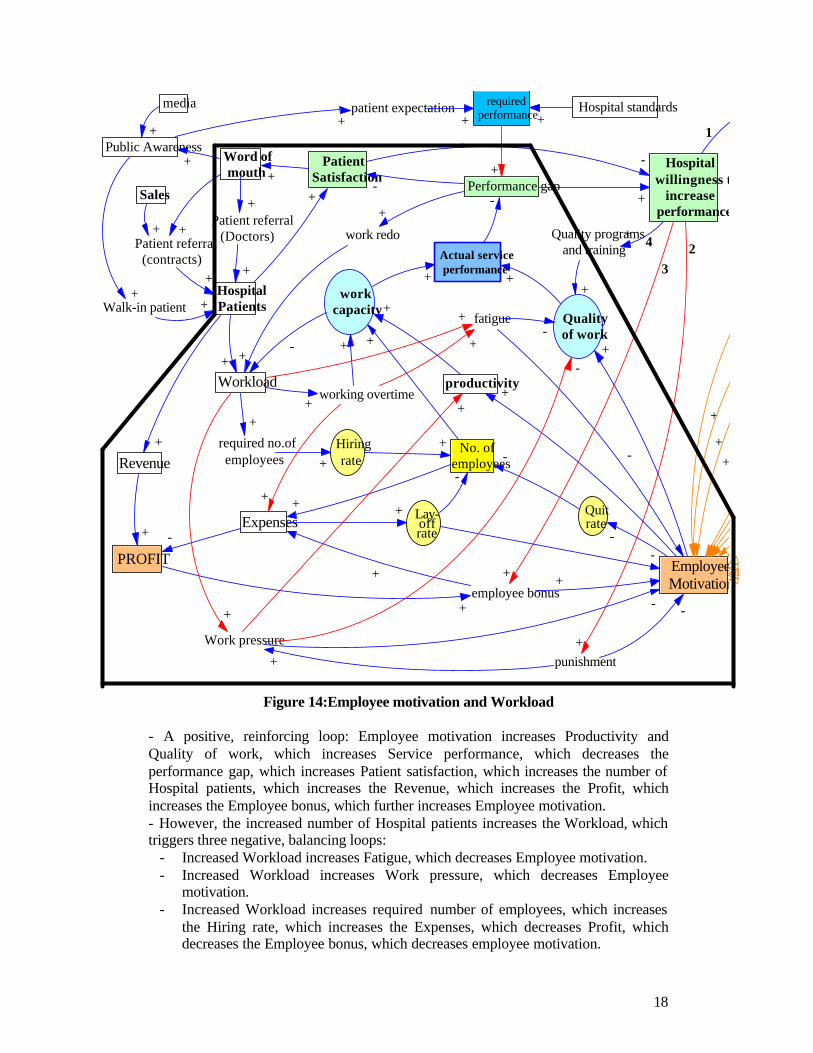
Figure 14:Employee motivation and Workload
- A positive, reinforcing loop: Employee motivation increases Productivity and Quality of work, which increases Service performance, which decreases the performance gap, which increases Patient satisfaction, which increases the number of Hospital patients, which increases the Revenue, which increases the Profit, which increases the Employee bonus, which further increases Employee motivation. - However, the increased number of Hospital patients increases the Workload, which triggers three negative, balancing loops:
- Increased Workload increases Fatigue, which decreases Employee motivation. - Increased Workload increases Work pressure, which decreases Employee
motivation. - Increased Workload increases required number of employees, which increases
the Hiring rate, which increases the Expenses, which decreases Profit, which decreases the Employee bonus, which decreases employee motivation.
19
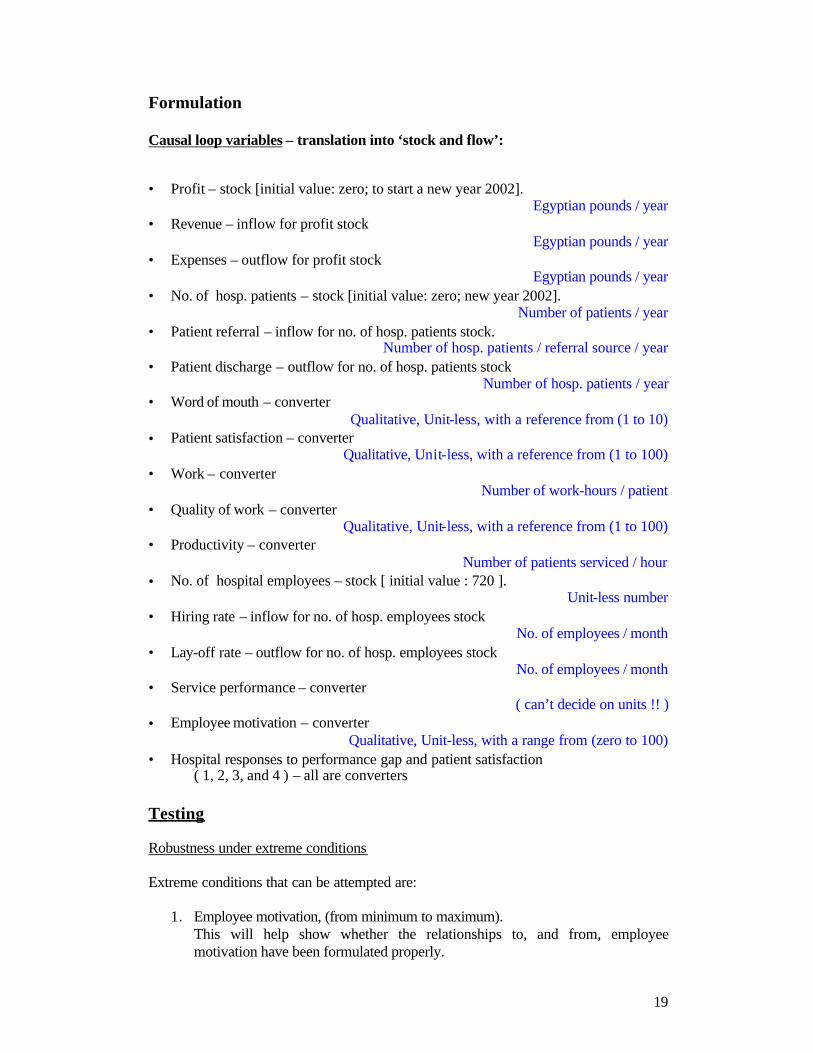
Formulation Causal loop variables – translation into ‘stock and flow’:
• Profit – stock [initial value: zero; to start a new year 2002]. Egyptian pounds / year
• Revenue – inflow for profit stock Egyptian pounds / year
• Expenses – outflow for profit stock Egyptian pounds / year
• No. of hosp. patients – stock [initial value: zero; new year 2002]. Number of patients / year
• Patient referral – inflow for no. of hosp. patients stock. Number of hosp. patients / referral source / year
• Patient discharge – outflow for no. of hosp. patients stock Number of hosp. patients / year
• Word of mouth – converter Qualitative, Unit-less, with a reference from (1 to 10)
• Patient satisfaction – converter Qualitative, Unit-less, with a reference from (1 to 100)
• Work – converter Number of work-hours / patient
• Quality of work – converter Qualitative, Unit-less, with a reference from (1 to 100)
• Productivity – converter Number of patients serviced / hour
• No. of hospital employees – stock [ initial value : 720 ]. Unit-less number
• Hiring rate – inflow for no. of hosp. employees stock No. of employees / month
• Lay-off rate – outflow for no. of hosp. employees stock No. of employees / month
• Service performance – converter ( can’t decide on units !! )
• Employee motivation – converter Qualitative, Unit-less, with a range from (zero to 100)
• Hospital responses to performance gap and patient satisfaction ( 1, 2, 3, and 4 ) – all are converters
Testing Robustness under extreme conditions Extreme conditions that can be attempted are:
1. Employee motivation, (from minimum to maximum). This will help show whether the relationships to, and from, employee motivation have been formulated properly.
20
In addition, resultant profit values at minimum motivation should be near the 2001 value, where employee motivation was at its lowest possible.
2. No. of hospital employees, (from zero to for e.g. 10,000). This is to see if, for example at zero employees, whether the model will still function and give profit ‘values’ – or whether, as it should, it will give profit values of zero because no work is being done.
3. Raising the ‘actual performance’ far above the ‘required performance’ – that is a negative performance gap – and seeing whether the model understands this and continues the simulation and gives logical results.
4. Hospital willingness to respond to performance gaps can be set at zero.
Firstly, this should bring the ‘punishment’ and ‘quality program’ variables to zero; and it should set the ‘employee motivation’ and ‘employee bonuses’ to their minimum values. Secondly, it would be interesting to know whether the model can simulate what would happen if Hospital Management did nothing in response to performance gaps.

21
Sensitivity Analysis Because the model is constructed to determine the dynamics of two main variables – ‘Profit’ and ‘employee motivation’ – it is very important that the parameters going in and out of these two variables be as accurate as possible. For example, for employee motivation:
fatigue Qualityof work
No. ofemployees
Lay-offrate
+-
EmployeeMotivation
punishment+
-
-
Quitrate
-
-+
+
productivity+
employee bonus+
+
+
++
+
+
-
-
-
+
+
-
Employee motivation policies The parameters in the ‘equations’ between employee motivation and:
• employee-motivation policies • quality of work • punishment • productivity • quit rate • lay-off rate • employee bonuses
are critical to how the model behaves, and are largely based on qualitative assumptions from interviews, surveys, and historical experience. They need to be tested, reviewed, and adjusted as is found necessary from the experience of using the model.

22
It is important at this stage to remember some of the basics of attempting to ‘model human behaviour’. The Baker Criterion states that the inputs to all decision-rules in models must be restricted to information actually available to the decision-maker. These may be based on prior ‘theory’ and /or on historical information. Actual conditions, and perceived conditions, may thus differ from ‘reality’ depending on measurement methods and beliefs. Untried contingencies and the resultant equilibrium and/or stability of the system may, or may not, emerge from the interactions of the variables and parameters within the system. They should not be assumed. The point that needs to be made here is that parameters, as they are written in the original model, are not ‘carved in stone’. They should be altered according to what sensitivity analysis and accumulated experience with the model show. Only when we are relatively sure of the ‘correctness’ of these parameters can we proceed to the next stage of using sensitivity analysis as a tool to aid in decision-making. The premise, at this stage, is that when two variables are related with a very sensitive parameter, minor changes (according to a new policy decision) in either variable will have maximum effects on the other – presumably at minimum cost and effort. The same rationale, of-course, applies to the parameters affecting the ‘Profit’ in our model – though these will probably be easier to determine quantitatively:
Workloadworking overtime
required no.ofemployees
Hiringrate
No. ofemployees
Expenses Lay-offrate
+
+
+
Revenue
+
+
+
punishment+
-
Quitrate
-
-
PROFIT
+ -
+
+
+
productivity+
employee bonus+
++ +
Work pressure
+
+
+
-

23
Policy Design 1. Employee Motivation Policies: Starting effective policies towards increasing
employee motivation – along the lines of the employee-motivation-promoting-policies outlined in the model – not just by giving, or with-holding, ‘bonuses’.
EmployeeMotivation
Hospital standards
Hospitalwillingness to
increaseperformance
adoption of employeemotivation-promoting
policies+
flexiblework-hours
salary
oral / writtenpraise
days offday-care centre
on-job training
in-formal dress
involvement indecision-making
clear communicationwith management
fair promotioncriteria
working conditions
clear jobresponsibilities
transportationfacilities
cafeteria / restlounge
+
+
+
+
+
+
+
+
+
+
+
+
+
+
+
+
+
+
+
+ + ++
++
++ +
+
-
1
23
4
+
+ employee bonuses
The expected hypothesis here is that increasing levels of employee morale and motivation will manifest itself as increasing performance increasing patient satisfaction increasing no. of hosp. patients increasing revenue and increasing profits. It will also be interesting to see if the effect is only in terms of increasing revenue, or also by decreasing expenses.

24
2. Policy on Hospital Management response to Performance gaps: Decreasing the use of ‘punishment’ of employees as the primary response of management to short-falls in performance – placing more emphasis on studying root causes within the ‘system’ for recurrent problems.
fatigue Qualityof work
No. ofemployees
+-
EmployeeMotivation
punishment+
-
-
Quitrate
-
-+
+
productivity+
employee bonus+
+
+
++
+
+
-
-
-
+
+
-
work pressure This is because of the negative impact that ‘punishment’ has on employee motivation, and subsequently on the quality of work. Note that though ‘punishment’ may result in a direct temporary increase in productivity, it will also result in a negative effect on this productivity through its effect on ‘motivation’. The expected hypothesis here is that decreasing ‘punishment’ policies will result in an increasing of employee motivation, with a direct increase in the quality of work and an increase in productivity – the sum total of which should be a big improvement in actual performance, and therefore increased patient satisfaction and more revenue (i.e. increased profits).

25
3. Policy on monitoring Performance and Patient satisfaction: Putting more emphasis on monitoring of patient satisfaction, as a measure of performance; instead of concentrating mainly on ‘technical, clinical standards’ that the patient usually does not understand.
It is a change of outlook from what we believe the service should be, to what the customer perceives as value.
PatientSatisfaction
+Performance gap
requiredperformance
+
-
Hospital standards+
Hospitalwillingness to
increaseperformance
-
-
1
++
patient expectation+ +
actual service performance
The expected hypothesis here is that direct close monitoring, and analysis, of patient satisfaction will show hospital management that something needs to be done about performance – even if analysis of performance according to preset hospital clinical standards do not show a ‘performance gap’. This should lead to an increase in the ‘willingness’ to increase performance by one of the four methods illustrated in the full model. In addition, it will probably show management that what the patient really requires in terms of friendly, respectful healthcare cannot be provided by a de-motivated staff – and hence should decrease management’s likelihood of using punishment and bonus-cutting policies; and increase their tendency to understand the importance of employee-motivation policies and the direct effect they can have on performance, patient satisfaction, and revenue.
26
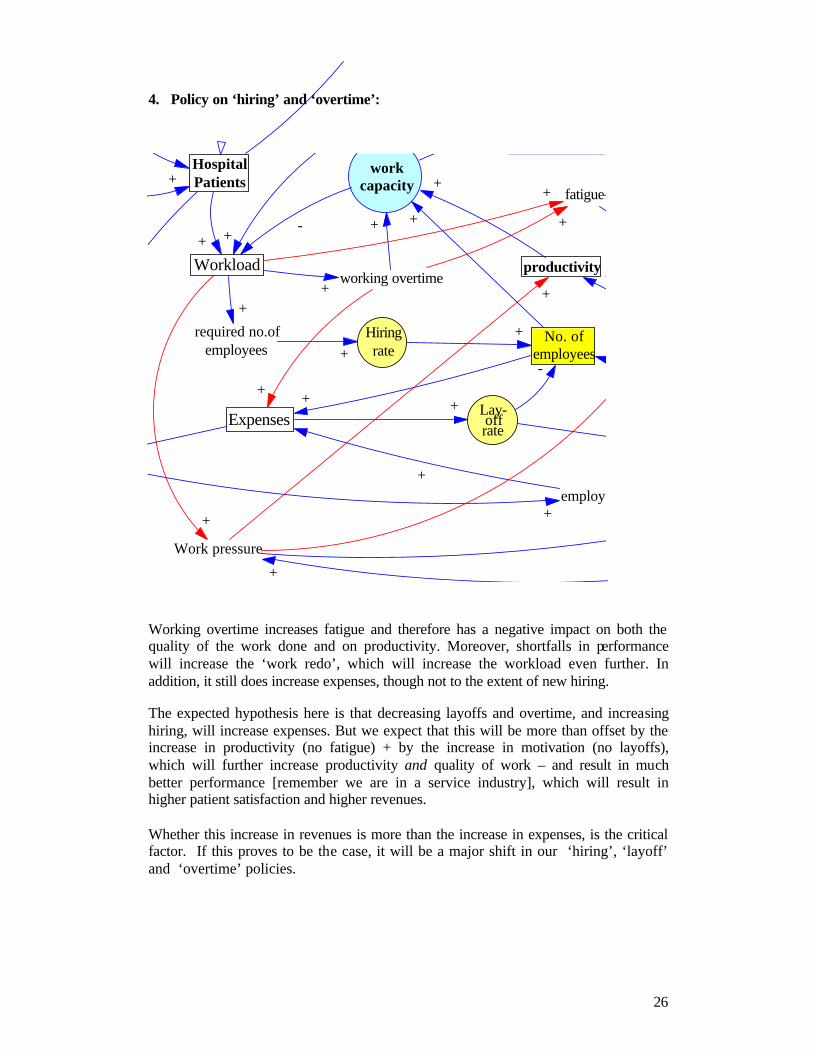
4. Policy on ‘hiring’ and ‘overtime’:
workcapacity
Workloadworking overtime
fatigue
required no.ofemployees
Hiringrate
No. ofemployees
ExpensesLay-offrate
+
+
+
+
HospitalPatients
+
+
+
-+
+
+
productivity+
employee bonus+
+
+
+
-
+
++
Work pressure
+
+
+
+
+
Working overtime increases fatigue and therefore has a negative impact on both the quality of the work done and on productivity. Moreover, shortfalls in performance will increase the ‘work redo’, which will increase the workload even further. In addition, it still does increase expenses, though not to the extent of new hiring. The expected hypothesis here is that decreasing layoffs and overtime, and increasing hiring, will increase expenses. But we expect that this will be more than offset by the increase in productivity (no fatigue) + by the increase in motivation (no layoffs), which will further increase productivity and quality of work – and result in much better performance [remember we are in a service industry], which will result in higher patient satisfaction and higher revenues. Whether this increase in revenues is more than the increase in expenses, is the critical factor. If this proves to be the case, it will be a major shift in our ‘hiring’, ‘layoff’ and ‘overtime’ policies.

27
CONCLUSIONS • Hospitals are facing a situation where revenues are continuing to increase (though
at a decreasing rate), but margins of profit are decreasing markedly. • In an attempt to control expenses, managements have for the past years introduced
across-the-board cost-cutting policies (most of which have targeted no.’s of employees – increase in layoffs – and employee benefits – decrease in ‘bonuses’).
• Hospitals in Egypt have suffered from very high ‘employee turnover rates’ – reaching 20 % in 2001.
• Patient satisfaction is decreasing gradually. • Employee satisfaction has decreased markedly. • Drops in hospital-service performance are responded to by management through a
series of policies in which ‘punishment’ is the most prominent, and increasing. • This model was ‘created’ to try and find the quantitative relationships between the
different variables affecting employee satisfaction, patient satisfaction, and profit – in Egyptian private hospitals. More importantly, it is hoped that the actual process of constructing the model will help to change the mental model by which top management views it’s employees; and to show them the qualitative and quantitative side-effects and ‘loops’ of the current employee-policies. In fact, it is hoped that the current situation of ‘financial crisis’ may make it easier to convince management that something has to change. Gradually, without frank criticism or blame for past policies, we must start a ‘change’ in management’s paradigm of ‘human-resource thinking’.
• The developed model shows several ‘side-effect’ loops of current employee policies – and it suggests several decisions that can be taken to improve the profit situation through ‘better’ employee policies.
• The degree of effectiveness of any of the proposed employee-policy amendments to improve profit depends on the sensitivity of the parameters placed within the model.
Given that the relationships between the variables are correct, the exact parameters and reference modes are the ‘bomb-shells’ within this model. Many of these parameters are qualitative in nature, and future work needs to be done to verify, test, and re-test, these parameters - before concrete policy decisions can be concluded from the model.
REFERENCE D’Egidio, Franco, 2002, Increasing Organization Vitality, (www.sas.com/organizational vitality) Kaldenberg DO, Regrut BA, 1999. Do satisfied patients depend on satisfied employees? Or do satisfied employees depend on satisfied patients? The Satisfaction Report newsletter. Volume 3. South Bend, Ind: Press, Ganey Associates Inc. Mercer, William M., Inc., 1998, Increasing Employee Satisfaction ([www.performance-unlimited.com/satisfy) Syptak, J.M., 1998. "Altruism in Practice Management: Caring for Your Staff.", Family Practice Management. October 1998: 58-60. Health Professionals in Management, by the American Academy of Family Physicians.