heating and cooling research eurima, bruxelles · heating and cooling research eurima, bruxelles....
TRANSCRIPT

Transsolar Sas11 Rue Martel75010 ParisFrance
T +33 1 76 43 12 00F +33 1 76 43 12 01
Heating and Cooling Research Eurima, Bruxelles
Team:
Aurelien Gervasi
Geoffrey Matricon
Stefania Barberio
Updated Version: 09-01-2017

Heating and Cooling Research Eurima, BruxellesPhone: +33 (0)1 76 43 12 00
Transsolar Sas11, rue Martel 75010 Paris
Updated Version15 December 2016 2
Table of Contents
1. Paris Comparison - Energy 5
1.1. Results Summary (area specific) 5
1.2. Results Summary (total) 6
1.3. Energy Demand 7
1.4. Final Energy Consumption 8
1.5. Refurbishment Strategies - Envelope First (boiler) 9
1.6. Refurbishment Strategies - Boiler First 10
1.7. Refurbishment Strategies - Envelope first (Heat pump) 11
1.8. Refurbishment Strategies - Heat Pump first 12
1.9. Boiler Refurbishment Strategies - Sizing comparison 13
1.10. Heat Pump Refurbishment Strategies - Sizing comparison 14
2. Paris Climate - Comfort 15
2.1. Yearly Comfort 15
2.2. Comfort - Active Cooling for summer comfort 16
2.3. Comfort - Passive Cooling for summer comfort 17
3. Climates Comparison 18
3.1. Results Summary (area specific) 18
3.2. Results Summary (total) Annex 1: Detailed Results 19
3.3. Energy Demand and Final Energy Consumption 20
4. ANNEX I: Detailed Results 21
4.1. Base Case: Low Envelope, No Control 22
4.2. Paris - Case 1: Low Envelope, Night Time Reduction, Thermostat on Radiators 23
4.3. Paris - Case 1 bis: Good Envelope, No Control 24
4.4. Paris - Case 1 ter: Low Envelope, Night Time Reduction 25
4.5. Paris - Case 1 ter HP: Low Envelope, Night Time Reduction with Heat Pump 26
4.6. Paris - Case 2: Good Envelope, Night Time Reduction, Thermostat on Radiators 27
4.7. Paris - Case 2 HP: Good Envelope, Night Time Reduction, Thermostat on Radiators, Heat Pump 28
4.8. Paris - Case 2 bis: Good Envelope, Night Time Reduction 29
4.9. Paris - Case 2 ter : Good Envelope, Night Time Reduction, Thermostat on Radiators 30
4.10. Paris - Case 2 ter HP : Good Envelope, Night Time Reduction, Thermostat on Radiators, Heat Pump 31
4.11. Paris - Case 3: Excellent Envelope Performance, Night Time Reduction, Thermostat on Radiators 32
4.12. Naples - Base Case: Low Envelope, No Control 33
4.13. Naples - Case 2: Good Envelope Performance, Night Time Reduction, Thermostat on Radiator 34
4.14. Naples - Case 3: Excellent Envelope Performance, Night Time Reduction, Thermostat on Radiator 35
4.15. Helsinki - Base Case: Low Envelope, No Control 36
4.16. Helsinki - Case 2: Good Envelope Performance, Night Time Reduction, Thermostat on Radiators 37
4.17. Helsinki - Case 3: Excellent Envelope Performance, Night Time Reduction, Thermostat on Radiators 38
5. ANNEX II: Boundary Conditions 39
5.1. Modeling 40
5.2. Geometry 41
5.3. Operation 42
5.4. Schedules - T2 43
5.5. Schedules - T3 44
5.6. Schedules - T4 45
5.7. Schedules - Corridor 46
5.8. Domestic Hot Water Demand 47
5.9. Artificial Ligthing Control 48
5.10. Space Heating and Space Cooling control 49
5.11. Shading and Natural Ventilation Control 50
5.12. Envelope Typologies 1 51
5.13. Envelope Typologies 2 52
5.14. Plant Typologies 1 53
5.15. Plant typologies 2 54
5.16. Plant typologies 3 55
5.17. Plant typologies 4 56
5.18. Plant typologies 5 57
6. ANNEX III: Tribu Energie Report 58

Heating and Cooling Research Eurima, BruxellesPhone: +33 (0)1 76 43 12 00
Transsolar Sas11, rue Martel 75010 Paris
Updated Version15 December 2016 3
INTRODUCTION
In order to better understand how to maximize the energy saving potential throughout a renovation process, and in the context of the Energy Performance of Building Directives (EPBD) revision, one essential question is how to prioritise actions in the renovation cycles.
In order to raise the understanding of the respective contributions of passive (envelope improvement) and active (heating and cooling equipment, controls) technologies, a detailed thermal study has been fulfilled by TRANSSOLAR. This study has been completed by TRIBU ENERGIE which report is in the Annex III of the document with a thorough economic assessment of the main refurbishment strategies, specifically for residential buildings.
This work uses numerical thermal modeling with the TRNSYS software package to model a standard residential building, under three different climates, with different envelope performance, control strategies, and heating and cooling equipment. For each variant, numerous outputs are calculated in order to understand the respective contributions of each refurbishment solution in terms of:
• Energy demand
• Energy consumption (final and primary)
• CO2 emissions
• Thermal comfort
• Life cycle cost (Tribu study)
Main refurbishment strategies, involving successive refurbishment actions, are compared in order to understand which sequence of measures achieves the best overall performance improvement.
METHODOLOGY
The boundary conditions for the present study are detailed in Annex II. The assumptions of the study have been defined so as to give as much as possible a realistic European picture, these are:
Type of building.
We considered the renovation of a multi-family building (MFD) in 3 different European climatic regions (Paris, Helsiniki, Napels ) with the objective to define the potential at the level of energy consumption, global warming potential, economic impacts and comfort. The reason for choosing a MFD is that it represents a typical building type across the EU while capturing different consumer behaviours and demographics.
Level of renovation.
There are three levels of renovation and a base case which represents a building from the current building stock. A first series of calculations case 1 is representing a renovation to a good level but only for the building envelope or for the equipment. In the calculations of case 2 the renovation is completed on the good level with respectively the equipment or the building envelope. All case 2 calculations have though both an improved building envelope and an improved equipment. A non-stepwise renovation to case 3 has also been assessed. Case 3 has been put at the level of NZEB (for a renovated building) .
No on-site renewables have been assessed.
In all the studied cases it would be possible to add some on-site renewables. The share of the total consumption that can be covered by renewables will be depending of the energy demand. The lower the energy demand, the higher the part that could be covered by renewables.
The simulation modeling is done following a two steps approach. First the apartment spaces are modeled in order to calculate the building energy needs (heating, cooling, domestic hot water, electricity). Then, the heating system is modeled dynamically to assess its equipment thermal behavior and its energy consumption.
TRIBU ENERGIE’s cost analysis focuses on three main refurbishment strategies and reuses TRANSSOLAR’s thermal modeling results. The analysis covers energy costs, investment costs and maintenance costs over a 50 years span.
Heating and Cooling Research Eurima, BruxellesPhone: +33 (0)1 76 43 12 00
Transsolar Sas11, rue Martel 75010 Paris
Updated Version15 December 2016 4
SUMMARY
The only way of reducing significantly the operating and the global costs due to building energy consumptions in the medium term, and even more in the long term (more than 20 to 25 years), is to make an envelope renovation. The gain on operating costs due to insulation is about 50%, while it is lower than 20% for system improvements. Improvements only related to thermostats and/or boilers enable to get short returns on investments, but are not very economical in the long term because final energy consumptions, and therefore operating costs, remain high.
The improvements concerning the renovation of the envelope give rise to longer returns on investment, but as soon as the return on investment year is reached, they become to a great extent the best economic solution, because final energy consumptions are much lower than with a single heating system replacement.
For example, with the Paris climate, improving the existing envelope to a level comparable to a new construction would lead to a gas consumption reduction of 66%. In comparison, working only on the controls would bring a 25% reduction, and changing the boiler would involve a 30% gas consumption reduction.
When refurbishing the boiler, implementing a modulating burner helps to easily adapt the boiler to heating demand variations. Using an oversized new boiler with a modulating burner (high efficiency boiler) increases only by 1% the total gas consumption compared to a correctly sized one. This is due to the new modulating burner that is able to vary its instantaneous power in the range of 10% to 100% of its nominal power. In addition, the new boiler presents a nominal efficiency much higher than the elder one. For these reasons, the refurbishment order between the boiler and the envelope does not really impact the final energy consumption once both solutions have been applied.
However, refurbishing the envelope first would translate into a strong peak heating power reduction by 61% (-132 kW), which would limit the size of the next new boiler to be installed. As a consequence, investment costs, maintenance costs, and grey energy costs will be reduced. Also, with a “Boiler First” refurbishment strategy, as the plant equipment is generally oversized and despite being well-insulated, its generation and distribution losses are 45% higher (3.1 kWh/m²/y) than after the “Envelope First” refurbishment strategy.
Moreover, in some countries like France, if the boiler size is small enough (lower than 70kW), the fire safety regulations are reduced for the boiler room, which can translate into further investment and maintenance costs savings.
Installing a heat pump to replace the old boiler achieves the lowest final energy demand, thus the highest overall building’s efficiency, thanks to an efficient seasonal coefficient of performance. But to benefit from all the heat pump potential, the envelope has to be well-insulated. Otherwise, using a heat pump with a unrefurbished envelope requires to keep an existing boiler to handle high temperature regimes with low outside air temperature (cf chapter 1.8).
As thermal comfort is impacted by paramaters such as air and surface temperatures, a poorly insulated fabric can result in occupants having poorer thermal comfort perceptions. As a result they may be more likely to increase thermostat temperature points to counter act this, which will result in increased energy consumption. As a consequence, the energy savings related to improving the control strategies can’t be fully reached if the buidling envelope has not been
improved. Otherwise, the room air temperature has to be kept at a high level to avoid low perceived temperature and building pathologies like condensation and mold. In comparison, with a better insulated envelope, cold wall effects are avoided which increases the felt temperature for the occupant by up to 3°C in Winter.
Refurbishing the envelope also leads to higher summer comfort thanks to better solar gain management. As an example, for the Parisian case, peak cooling power can be reduced by 50% which could also limit the impact on the local urban heat island effect.
When considering a heat wave scenario in Paris, thermal comfort without active cooling systems can only be achieved if the envelope has been well-refurbished. In this case, passive cooling strategies have to be implemented (night time ventilation, elevated air speed via ceiling fans, etc.) to extract internal heat gains and improve the occupant perceived temperature. In comparison, with a non-refurbished envelope, internal felt temperature can rise up to 32°C, which translates into thermal stress.
When comparing the energy results for the three different climates, heating energy demands reach similar levels despite different heating degree day values. This is why working on the combination of envelope and equipment makes sense in the 3 climatic regions in order to achieve an excellent energy performance. No climatic region can achieve this excellent energy performance without a well-thought interaction between envelope refurbishment and equipment refurbishment.
In conclusion, envelope improvements would allow reducing energy consumption and guaranteeing thermal comfort while the systems improvements will not produce an improvement of thermal comfort.
Transsolar 11 Rue Martel
75010 ParisFrance
T +33 1 76 43 12 00F +33 1 76 43 12 01
Tribu Energie 60 rue du faubourg poissonnière
75010 ParisFrance
T +33 1 43 15 00 06lF +33 1 43 15 01 80
With the contribution of:

Heating and Cooling Research Eurima, BruxellesPhone: +33 (0)1 76 43 12 00
Transsolar Sas11, rue Martel 75010 Paris
Updated Version15 December 2016 5
1. Paris Comparison - Energy1.1. Results Summary (area specific)
Primary Energy Factor France (source:Arrêté du 26 octobre 2010)
Evlectricity 2.58
Natural Gas 1.00
CO2 emission factor France (source: Ademe)
Electricity 82 kgCO2eq/kWh
Natural Gas 243 kgCO2eq/kWh
It is important to notice that the category Electricity consumption Auxiliaries EPBD refers only to the consumptions defined in this European standard.
For each of these variants, there are in addition 18.2 kWh/yr/m² not mentioned in this summary, that are brought to the building by internal gains beyond the normative frame (domestic equipment). Those gains are positive to the thermal balance in winter, but are not taken in consideration by the EPBD guidelines. They are nonetheless presented in the variants comparisons below.

Heating and Cooling Research Eurima, BruxellesPhone: +33 (0)1 76 43 12 00
Transsolar Sas11, rue Martel 75010 Paris
Updated Version15 December 2016 6
1. Paris Comparison - Energy1.2. Results Summary (total)
Primary Energy Factor France (source:Arrêté du 26 octobre 2010)
Evlectricity 2.58
Natural Gas 1.00
CO2 emission factor France (source: Ademe)
Electricity 82 kgCO2eq/kWh
Natural Gas 243 kgCO2eq/kWh
It is important to notice that the category Electricity consumption Auxiliaries EPBD refers only to the consumptions defined in this European standard.
For each of these variants, there are in addition 19.2 MWh/yr not mentioned in this summary, that are brought to the building by internal gains beyond the normative frame (domestic equipment). Those gains are positive to the thermal balance in winter, but are not taken in consideration by the EPBD guidelines. They are nonetheless presented in the variants comparisons below.

Heating and Cooling Research Eurima, BruxellesPhone: +33 (0)1 76 43 12 00
Transsolar Sas11, rue Martel 75010 Paris
Updated Version15 December 2016 7
1. Paris Comparison - Energy
LEGEND
Base: Low Envelope Performance, No Control, Old Boiler, Low efficiency split unit. Plant dimensioned on the low envelope demand.
Case 1: Low Envelope Performance, Nighttime Reduction, Thermostat on radiators, Old Boiler, Low efficiency split unit. Plant dimensioned on the low envelope demand.
Case 1bis: Good Envelope Performance, No Control, Old Boiler, low efficiency split unit. Plant dimensioned on the low envelope demand.
Case 1ter: Low Envelope Performance, Nighttime Reduction, New Boiler, High efficiency split unit. Plant dimensioned on the low envelope demand.
Case 2: Good Envelope Performance, Nighttime Reduction, Thermostat on Radiators, New Boiler. High efficiency split unit. Plant dimensioned on good envelope demand.
Case 2bis:Good Envelope Performance, Nighttime Reduction, New Boiler, High efficiency split unit. Plant dimensioned on the good envelope.
Case 2ter:Good Envelope Performance, Nighttime Reduction, Thermostat on Radiators, New Boiler, High efficiency split unit. Plant dimensioned on the low envelope.
Case 3:Excellent Envelope Performance, Nighttime Reduction, Thermostat on Radiators, New Boiler, High efficiency split unit. Plant dimensioned on the excellent envelope.
Comments
Increasing envelope performance from Base performance level to Good performance level reduces heating demand by 76% (-221 kWh/m²/y) while reducing at the same time heating peak loads (-59% heating peak load, 70kW reduction). Thanks to a better protection against solar gains, this improved envelope also reduces cooling energy demand (-44%, -0.9 kWh/m²/h) and peak cooling power (-50%, -11.1 kW).
Night time reduction consists in reducing the heating temperature set point during nighttime in order to save energy when we sleep. It has several consequences on heating demand:
• It reduces heating energy demand by 12% (-35 kWh/m²/y) thanks to the temperature set point decrease (-5°C) during night time.
• But it also increases heating peak loads by +18% (+22 kW) due to additional power needed to increase the room temperature each morning from the night time temperature set point, to the daytime temperature set point (5°C difference). This morning reheat overload has already been mitigated by using a set point ramp progressively increasing the temperature between 6AM and 7AM.
Combined with night time reduction, implementing thermostats on radiators has a positive impact on heating demand:
• Compared to the base case with the same level of envelope, it reduces heating energy demand by 29% (-85 kWh/m²/y),
• Compared to the base case with the same level of envelope, there is still an increase for the total heating peak power (+12%, +14 kW), but it is reduced in comparison with the variant where only the night time reduction has been implemented.
The best studied variant with an Excellent envelope and new control strategies show a heating energy demand reduction of -97% (-283 kWh/m²/y) and a peak heating power reduction of -73% (-88 kW). In this situation, heating is no longer the most important source of energy demand.
The following results compare different envelope, control and system variants for the Parisian climate.
NB: It is important to notice that electrical demand for domestic equipment is limited (18.2 kWh/m².y) which translates an eco-friendly behavior from the building occupants. As a consequence, heating demand is slightly increased. This domestic equipment is not taken into account in the summary tables, because it is not tackled by EPBD directives. It is coherent to show these gains here because they have a positive role in heating demand reduction in winter.
1.3. Energy Demand

Heating and Cooling Research Eurima, BruxellesPhone: +33 (0)1 76 43 12 00
Transsolar Sas11, rue Martel 75010 Paris
Updated Version15 December 2016 8
1. Paris Comparison - Energy
Refurbishing the boiler equipment and increasing its overall efficiency translates into a gas consumption reduction of -30% (-127 kWh/m²/y) for the same poorly insulated envelope. This improvement is due to different factors:
• The new condensing boiler operates at a higher efficiency by limiting the heat losses during heat generation
• Due to the modulating burner, the gas boiler adapts its power according to the demand, which translates into a higher heat generation efficiency
• As the boiler room has been refurbished, the piping distribution has been well insulated, which reduces supply losses
As a well-insulated building (envelope performance = Good) tends to have lower energy demand for space heating, the generation and supply heat losses represent a higher portion of the total gas consumption if the boiler equipment has not been refurbished. As a consequence, improving the boiler equipment in a well-insulated building translates into a gas consumption reduction of -40% (-58 kWh/m²/y).
Using an oversized new boiler with a modulating burner (very high efficiency boiler) increases only by 1% the total gas consumption compared to a correctly sized one. This is due to the new modulating burner capacity of limiting its functioning to 10% of its nominal power. But if the building envelope has been first refurbished to a Good level, the new boiler sizing can be reduced by 61% (-132 kW). This difference can be translated into:
• investment cost savings
• maintenance costs savings
• grey energy savings
Once the envelope has been refurbished, domestic hot water and plant generation and distribution losses are representing a significant part of the gas bill (up to 43% of the total gas consumption with a Good envelope).
Installing a heat pump to replace the old boiler achieves the lowest final energy demand thanks to an efficient seasonal coefficient of performance (2.8). But to benefit from all the heat pump potential, the envelope has to be well-insulated. Otherwise, using a heat pump with a unrefurbished envelope requires to keep an existing boiler to handle high temperature regimes with low outside air temperature (cf chapter 1.8).
Also, as heat pumps are supplied by electricity, the gain in final energy (compared to a new boiler variant) is reduced when looking at the primary energy numbers (cf summary tables).
NB: The boiler has been sized according to standard sizing methods using a “worst case scenario” approach. For instance, no heat gains and the most critical outside air temperature is considered to calculate the peak heating load with a 20% safety coefficient. This explains the difference in the “Base” case between the boiler peak power design sizing, and the peak heating demand calculated via thermal modeling.
Comments
1.4. Final Energy Consumption sized acc. to good envelope performance sized acc. to low envelope performance
NB: It is important to notice that electrical demand for domestic equipment is limited (18.2 kWh/m².y) which translates an eco-friendly behavior from the building occupants. As a consequence, heating demand is slightly increased. This domestic equipment is not taken into account in the summary tables, because it is not tackled by EPBD directives. It is coherent to show these gains here because they have a positive role in heating demand reduction in winter.

Heating and Cooling Research Eurima, BruxellesPhone: +33 (0)1 76 43 12 00
Transsolar Sas11, rue Martel 75010 Paris
Updated Version15 December 2016 9
1. Paris Comparison - Energy
Base Case: Low Envelope Performance, Old Boiler, No Control
STEP 0. BASECase 1bis: Good Envelope Performance, Old Boiler, No Control, Plant dimensioned on the Low
Envelope Demand
STEP 1. ENVELOPE REFURBISHMENT Case 2: Good Envelope Performance, New Boiler, Nighttime Reduction, Thermostat on
Radiators. Plant dimensioned on the Good Envelope Demand
STEP 2. PLANT REFURBISHMENT, CONTROL SYSTEMS
- Stand-by + firing losses: 22.0 kWh/m²/y
- Distribution losses: 15.0 kWh/m²/y
- Peak heating + DHW demand: 120 kW
- Boiler Thermal Peak power: 216 kW
- Stand-by + firing losses: 25.2 kWh/m²/y
- Distribution losses: 15.3 kWh/m²/y
- Peak heating + DHW demand: 50 kW
- Boiler Thermal Peak power: 216 kW
- Stand-by + firing losses: 0.5 kWh/m²/y
- Distribution losses: 6.4 kWh/m²/y
- Peak heating + DHW demand: 64 kW
- Boiler Thermal Peak power: 84 kW
1.5. Refurbishment Strategies - Envelope First (boiler)
The old boiler is oversized compared to the real power demand (+80%), as it is common in existing buildings. The piping is not well-insulated.
As it is equipped with a single-speed burner, it can only function at nominal power. As a consequence, it is functioning by short repeated ON/OFF cycles where the boiler, starts, then heats up the buffer tank, stops when the buffer tank is hot enough, and wait until the buffer storage has delivered its heat to the distribution loops.
This phenomenon induces numerous starts and stops for the boiler, which reduces its life expectancy.
Moreover, each time the boiler stops and starts again, heat is lost while the boiler is cooling, and heat is wasted while the boiler is starting again.
The envelope has been refurbished. As a consequence, the heating peak power and energy demands have been reduced.
Hence, the single-speed burner is functioning less frequently, but always by short ON/OFF cycles.
Stand-by and firing losses have increased (+3.2 kWh/m²/y) as the boiler is functioning less frequently while still losing heat in its environment.
The old boiler has been replaced with a condensing boiler and the boiler equipment has been refurbished and insulated. Nighttime reduction and thermostats on radiators have been implemented.
Distribution losses have been reduced (-8.6 kWh/m²/y, -57%) thanks to the plant equipment (pipes, boiler) thermal insulation.
Stand-by and firing losses have been reduced (-21.5 kWh/m²/y, more than 95% reduction). The new boiler loses less heat in its environment, and as it modulates its power, reduces its firing losses.
The boiler is better sized to the heating and domestic hot water demand. With its speed-modulating burner, it adapts its power to the right demand. As a consequence, the boiler does not function with ON/OFF cycles anymore, which should increase its durability.

Heating and Cooling Research Eurima, BruxellesPhone: +33 (0)1 76 43 12 00
Transsolar Sas11, rue Martel 75010 Paris
Updated Version15 December 2016 10
1. Paris Comparison - Energy
Base Case: Low Envelope Performance, Old Boiler, No Control Case 1ter: Low Envelope Performance, New Boiler, Nighttime Reduction, Plant dimensioned on the Low Envelope Demand
Case 2ter: Good Envelope Performance, New Boiler, Nighttime Reduction, Thermostat on Radiators. Plant dimensioned on the low Envelope Demand
STEP 2. ENVELOPE REFURBISHMENT, CONTROL SYSTEMSTEP 0. BASE STEP 1. PLANT REFURBISHMENT, CONTROL SYSTEM
- Stand-by + firing losses: 22.0 kWh/m²/y
- Distribution losses: 15.0 kWh/m²/y
- Peak heating + DHW demand: 120 kW
- Boiler Thermal Peak power: 216 kW
- Stand-by + firing losses: 1.0 kWh/m²/y
- Distribution losses: 8.5 kWh/m²/y
- Peak heating + DHW demand: 142 kW
- Boiler Thermal Peak power: 216 kW
- Stand-by + firing losses: 1.6 kWh/m²/y
- Distribution losses: 8.4 kWh/m²/y
- Peak heating + DHW demand: 64 kW
- Boiler Peak power: 84 kW
1.6. Refurbishment Strategies - Boiler First
The old boiler is oversized compared to the real power demand (+80%), as it is common in existing buildings. The piping is not well-insulated.
As it is equipped with a single-speed burner, it can only function at nominal power. As a consequence, it is functioning by short repeated ON/OFF cycles where the boiler, starts, then heats up the buffer tank, stops when the buffer tank is hot enough, and wait until the buffer storage has delivered its heat to the distribution loops.
This phenomenon induces numerous starts and stops for the boiler, which reduces its life expectancy.
Moreover, each time the boiler stops and starts again, heat is lost while the boiler is cooling, and heat is wasted while the boiler is starting again.
The old boiler has been replaced with a condensing boiler and the plant equipment has been refurbished and reinsulated. Nighttime reduction has been implemented
As the envelope stays the same, the boiler has the same peak load as before. But with its speed-modulating burner, it adapts its power to the right demand. As a consequence, the boiler does not function as much as before with ON/OFF cycles, which should increase its durability.
Stand-by and firing losses have been greatly reduced (-21 kWh/m²/y, more than 95% reduction). The new boiler loses less heat in its environment, and as it modulates its power, reduces its firing losses.
Distribution losses have also been greatly reduced (-6.5 kWh/m²/y, -43%) thanks to the plant equipment (pipes, boiler) thermal insulation.
The envelope has been refurbished and thermostats have been implemented on radiators, reducing the heating peak power and energy demands.
As a consequence, the new boiler is strongly oversized and the variable-speed burner is functioning less frequently, with shorter cycles.
Stand-by and firing losses have slightly increased (+0.6 kWh/m²/y) as the boiler is functioning less frequently while still losing heat in its environment.
With this “Boiler First” refurbishment strategy, as the plant equipment is generally oversized and despite being well-insulated, its generation and distribution losses are 45% higher (3.1 kWh/m²/y) than after the “Envelope First” refurbishment strategy

Heating and Cooling Research Eurima, BruxellesPhone: +33 (0)1 76 43 12 00
Transsolar Sas11, rue Martel 75010 Paris
Updated Version15 December 2016 11
1. Paris Comparison - Energy
Base Case: Low Envelope Performance, Old Boiler, No Control
STEP 0. BASECase 1bis: Good Envelope Performance, Old Boiler, No Control, Plant dimensioned on the Low
Envelope Demand
STEP 1. ENVELOPE REFURBISHMENT Case 2_HP: Good Envelope Performance, New Heat Pump, Nighttime Reduction, Thermostat
on Radiators. Heat Pump dimensioned on the Good Envelope Demand
STEP 2. HEAT PUMP, CONTROL SYSTEMS
- Stand-by + firing losses: 22.0 kWh/m²/y
- Distribution losses: 15.0 kWh/m²/y
- Peak heating + DHW demand: 120 kW
- Boiler Thermal Peak power: 216 kW
- Stand-by + firing losses: 25.2 kWh/m²/y
- Distribution losses: 15.3 kWh/m²/y
- Peak heating + DHW demand: 50 kW
- Boiler Thermal Peak power: 216 kW
- Distribution losses: 3.3 kWh/m²/y
- Peak heating + DHW demand: 64 kW
- Heat Pump Thermal Peak power: 84 kW
The old boiler is oversized compared to the real power demand (+80%), as it is common in existing buildings. The piping is not well-insulated.
As it is equipped with a single-speed burner, it can only function at nominal power. As a consequence, it is functioning by short repeated ON/OFF cycles where the boiler, starts, then heats up the buffer tank, stops when the buffer tank is hot enough, and wait until the buffer storage has delivered its heat to the distribution loops.
This phenomenon induces numerous starts and stops for the boiler, which reduces its life expectancy.
Moreover, each time the boiler stops and starts again, heat is lost while the boiler is cooling, and heat is wasted while the boiler is starting again.
The envelope has been refurbished. As a consequence, the heating peak power and energy demands have been reduced.
Hence, the single-speed burner is functioning less frequently, but always by short ON/OFF cycles.
Stand-by and firing losses have incvreased (+3.2 kWh/m²/y) as the boiler is functioning less frequently while still losing heat in its environment.
The old boiler has been replaced with two heat pumps and the hydraulics have been refurbished and insulated. Nighttime reduction and thermostats on radiators have been implemented. One heat pump is dedicated to heating, the other one to domestic hot water preparation.
The heat pumps are functionning efficiently, which results in elevated seasonal coefficient of performance (COP).
seasonal COP heating: 2.8
seasonal COP domestic hot water: 2.4
1.7. Refurbishment Strategies - Envelope first (Heat pump)

Heating and Cooling Research Eurima, BruxellesPhone: +33 (0)1 76 43 12 00
Transsolar Sas11, rue Martel 75010 Paris
Updated Version15 December 2016 12
1. Paris Comparison - Energy
Base Case: Low Envelope Performance, Old Boiler, No Control Case 1ter_HP: Low Envelope Performance, Old Boiler, Heat Pump, Nighttime Reduction, Plant dimensioned on the Low Envelope Demand
Case 2ter_HP: Good Envelope Performance, New Boiler, Nighttime Reduction, Thermostat on Radiators. Plant dimensioned on the low Envelope Demand
STEP 2. ENVELOPE REFURBISHMENT, CONTROL SYSTEMSTEP 0. BASE STEP 1. HEAT PUMP, CONTROL SYSTEM
- Stand-by + firing losses: 22.0 kWh/m²/y
- Distribution losses: 15.0 kWh/m²/y
- Peak heating + DHW demand: 120 kW
- Boiler Thermal Peak power: 216 kW
- Stand-by + firing losses: 22.6 kWh/m²/y
- Distribution losses: 6.1 kWh/m²/y
- Peak heating + DHW demand: 142 kW
- Heat Pump Thermal Peak power: 84 kW (sized for T°C outside = 7°C)
- Stand-by + firing losses: 26.5 kWh/m²/y
- Distribution losses: 4.0 kWh/m²/y
- Peak heating + DHW demand: 64 kW
- Heat Pump Thermal Peak power: 84 kW
The old boiler is oversized compared to the real power demand (+80%), as it is common in existing buildings. The piping is not well-insulated.
As it is equipped with a single-speed burner, it can only function at nominal power. As a consequence, it is functioning by short repeated ON/OFF cycles where the boiler, starts, then heats up the buffer tank, stops when the buffer tank is hot enough, and wait until the buffer storage has delivered its heat to the distribution loops.
This phenomenon induces numerous starts and stops for the boiler, which reduces its life expectancy.
Moreover, each time the boiler stops and starts again, heat is lost while the boiler is cooling, and heat is wasted while the boiler is starting again.
A heat pump has been added to cover the heating demand when outside air temperature is above 7°C, otherwise, heating is provided by the old boiler. The old boiler also covers the domestic hot water demand. The heat pump is running around 1000 hours.
This limitation is due to the temperature regime that has to be supplied to the radiators. With the old envelope, a high temperature regime is required in winter (80°C) which is not feasible for the selected heat pump. But in shoulder season, the radiator temperature regime can be reduced (lower than 55°C) and hence supplied by the new heat pump.
As the boiler supplies a major part of the heating demand, the overall efficiency is limited. But as the heat pump only functions when the outside air temperature is higher than 7°C, its seasonal coefficient of performance is higher than usual.
seasonal COP heating: 3.1 (only when T°C outside is above 7°C)
The envelope has been refurbished and thermostats have been implemented on radiators, reducing the heating peak power and energy demands.
As the heating demand has been reduced, the temperature regime in the radiators has been also reduced, which makes it possible to use the heat pump all year long.
As a consequence, the boiler is only used for domestic hot water preparation, while the heat pump covers all the heating demand.
The heat pump is functionning efficiently, which results in an elevated seasonal coefficient of performance (COP), while the old boiler generates important stand by and firing losses due to its low performance.
seasonal COP heating: 2.8
1.8. Refurbishment Strategies - Heat Pump first

Heating and Cooling Research Eurima, BruxellesPhone: +33 (0)1 76 43 12 00
Transsolar Sas11, rue Martel 75010 Paris
Updated Version15 December 2016 13
1. Paris Comparison - Energy
UNREFURBISHED BULDING
STRATEGY 1. Envelope First, Level GOOD, then new BOILER1.9. Boiler Refurbishment Strategies - Sizing comparison
STRATEGY 2. Boiler First, then Envelope, level GOOD
STRATEGY 3. Envelope First, Level EXCELLENT, then new BOILER
Remarks
In all 3 cases, the building envelope and boiler room have been refurbished.
The order in which the refurbishment has been done has an impact on the boiler equipment sizing.
When refurbishing the boiler first, a new boiler has to be installed which has the same peak power as before. As it is equiped with a modulating burner, it can adapt to the new the heating demand profile once the building envelope has been refurbished.
When refurbishing the envelope first, the new boiler size can be reduced, as the heating peak power demand has been reduced. Compared to the “Boiler first strategy”, this translates into:
- investment cost savings
- maintenance costs savings
- grey energy savings
Moreover, in some countries like France, if the boiler size is small enough (lower than 70kW), the fire safety regulations are reduced for the boiler room, which can translate into further investment and maintenance costs savings.
The load duration curves after different refurbishment strategies are gathered on this page.

Heating and Cooling Research Eurima, BruxellesPhone: +33 (0)1 76 43 12 00
Transsolar Sas11, rue Martel 75010 Paris
Updated Version15 December 2016 14
1. Paris Comparison - Energy
UNREFURBISHED BULDING
STRATEGY 4. Envelope First, Level GOOD, then HEAT PUMP
STRATEGY 5. HEAT PUMP first, then Envelope, level GOOD
Remarks
With an unrefurbished envelope, it is not possible to install a heat pump that can cover all heating demand for the following reasons:
- the existing radiators require a high temperature regime (80°C) to cover the high heat losses, which is difficult to supply with a heat pump
- heat pumps are less efficient with low air temperature. An unrefurbished building would require numerous high-power heat pumps to cover all heating demand.
As a consequence, when installing the heat pump first, the old boiler has to be kept to handle the the winter season and the domestic hot water preparation. During this stage, the heat pump is only used when the outside air temperature is high enough (7°C).
In comparison, refurbishing the envelope first, is very interesting when a heat pump is going to be installed. Indeed, reducing first the heating demand via an improved envelope performance makes it possible, in a second step, to install a heat pump that can cover all heating demand. Another heat pump is installed to handle domestic hot water preparation.
In the end, both strategies end up with the same heat pump to cover heating demand. In the “Envelope First” strategy, it is also possible to install a separate heat pump to produce domestic hot water, whereas with the “Heat Pump First” strategy, the old boiler has to be kept as long as the envelope has not been refurbished.
It is important to underline then that this “Heat Pump First” strategy is only working if there is still a fully-fonctionning boiler able to supply heat for domestic hot water and high heating loads. If a boiler is broken in a poorly insulated building, it is really difficult to replace it only by a heat-pump.
1.10. Heat Pump Refurbishment Strategies - Sizing comparison
The load duration curves after different refurbishment strategies are gathered on this page.

Heating and Cooling Research Eurima, BruxellesPhone: +33 (0)1 76 43 12 00
Transsolar Sas11, rue Martel 75010 Paris
Updated Version15 December 2016 15
Thermostat On RadiatorsNo thermostats On Radiators Night Time Reduction, Thermostat On Radiators
Low
Env
elop
eGo
od E
nvel
ope
The first column considers only basic radiators without thermostatic valves. It can be seen that increasing envelope performance from “base” to “good” reduces cold wall radiative effects and increases operative temperature by up to 3°C in winter.
Some lower operative temperature can be observed for outside air temperature between 10°C and 20°C. These points correspond to the period where central heating is shut off (June to August). When the envelope is poorly insulated, it leads to low operative temperature for cool summer nights.
The second column shows the impact of implementing thermostats on radiators. Using thermostats on radiators helps to ensure the 21°C room air temperature set point. As a consequence, implementing this local control can reduce the operative temperature in the room by approx. 3°C compared to the previous variants, as the radiators do not tend to overheat.
For a poorly-insulated wall, this can lead to lower operative temperatures and discomfort due to low surface temperatures. Whereas, for a good-insulated envelope, operative temperature stays in the comfortable range. This illustrates the need to combine good envelope refurbishment with a good control strategy for the emitters in order to ensure high thermal comfort and low energy demand.
Night time reduction decreases operative temperature by 4 to 5 °C during sleep time. In theory, as occupants are sleeping, it does not always translate in discomfort.
But as poorly-insulated buildings suffer from cold wall radiative effects in winter, this 21°C room air temperature leads to a 18°C operative temperature in daytime and less than 15°C operative temperature during sleep time. There is a high chance that this phenomenon creates discomfort and will bring the occupant to increase the room air temperature set point, compensating the energy savings made with the room thermostat.
It is also important to note that these low temperatures may translate into building pathologies like condensation, mould, etc.
For well-insulated building, the operative temperature stays in a comfortable range during night time, as there is no cold-wall phenomenon.
2. Paris Climate - Comfort2.1. Yearly Comfort Operative temperature is frequently associated with the real temperature felt by the human body in indoor environment. It takes into account air temperature and temperature of surrounding surfaces. Each point of the graphs below represents one hour of the year, the point’s abscissa is the ambient temperature at this time of year, its ordinate is the correspondent operative temperature inside. To achieve comfort, the points must be in between red and blue lines.

Heating and Cooling Research Eurima, BruxellesPhone: +33 (0)1 76 43 12 00
Transsolar Sas11, rue Martel 75010 Paris
Updated Version15 December 2016 16
2. Paris Climate
Increasing the envelope performance from a “base” level to a “good” level includes:
• increasing shading and glazing solar control efficiencies,
• reducing outside air infiltrations
• implementing efficient roof insulation
As a consequence, cooling peak loads are reduced by 52% (-11 kW).
With this mild Parisian weather data, there are heat waves period where cooling strategies seem to be required. Hence, the related energy demand for cooling is limited, but without it, comfort issues would appear.
This active cooling demand could have been met partially by passive cooling strategies like nighttime natural ventilation.
This strong sizing reduction can also play a role to limit the urban heat island effect that tends to increase the air temperature downtown in summer. As more and more buildings are equipped with air conditioning devices, more and more heat is rejected in the urban area during night time. It is important to precise that this phenomena has not been taken into account in the calculation. Reducing the size of air conditioning equipment will help to limit this phenomena, while also giving the possibility not to use any of these active systems if passive measures can be implemented.
With efficient solar control strategies such as the one implemented with the good envelope performance, the maximum operative temperature is reduced by 1°C during the day. This difference is mainly due to reduced surface temperature (essentially window and ceiling surfaces), as the newly implemented solar control strategies tend to limit the amount of solar gains entering the occupied space.
During the night, well-insulated buildings tend to release less heat stored in their inertia and get 1°C warmer. It is important to remind here that no natural ventilation during nighttime has been implemented here. This would be an efficient solution to release heat from the building inertia.
2.2. Comfort - Active Cooling for summer comfort
The following charts display the evolution of air and operative temperature during a typical summer week in the current Paris climate, without consideration for heat island effect.
Two variants are presented, one with a Low envelope performance, the other one with a Good envelope performance. Both of them are actively cooled by split units that ensure a maximum 26°C air temperature during day and night.
It is important to note that, in this simulation, the split systems are ON all day long. Shutting them OFF during daytime (when nobody is in the apartment) would reduce the energy demand, but also increase the overall peak demand, as a higher power would be needed to cool down the room at the end of the day, when people are back from work
Low Envelope Performance, Active cooling Good Envelope Performance, Active cooling Load Duration Curves - Cooling Demand

Comparison between Standard Weather and “Heat Wave” Weather Data
Heating and Cooling Research Eurima, BruxellesPhone: +33 (0)1 76 43 12 00
Transsolar Sas11, rue Martel 75010 Paris
Updated Version15 December 2016 17
2. Paris Climate
The following variants have been calculated with a parisian weather data considering a summer heat wave.
No active space cooling has been taken into account for these variants. But nighttime natural ventilation (by window opening) has been considered as a passive cooling strategy.
The new weather data shows high outside air temperatures (>34°C). As the rooms are not equipped with active cooling systems, these outdoor conditions lead to high indoor temperatures.
There is a clear improvement in terms of summer comfort when comparing the low envelope with the good one. Thanks to:
• increased thermal insulation
• better solar control glazing
• and external solar protection (like shutters)
climate heat gains are limited and indoor operative temperature is reaching 29°C maximum. This is a clear example where improving envelope performance leads to higher thermal comfort in summer. Combined with an elevated air speed strategy (ceiling fan, desk fan, etc.) and low clothing factor (shorts and T-shirt), this solution can lead to thermally comfortable spaces.
In comparison, it is very difficult to ensure a good comfort level inside the room with an operative temperature above 32°C, as the low envelope variant is displaying. In this situation, high thermal stress can be expected.
Night time ventilation is very important to unload the thermal energy stored in the building inertia during the day. Thanks to daytime/nighttime temperature amplitude, the room does not tend to progressively overheat during an extended hot summer week.
NB: It is important to underline that Urban Heat Island effect is not completely taken into account with this weather data, which can reduce the passive cooling potential of this strategy.
Low Envelope Performance, No Active Cooling Good Envelope Performance, No Active cooling
2.3. Comfort - Passive Cooling for summer comfort

Heating and Cooling Research Eurima, BruxellesPhone: +33 (0)1 76 43 12 00
Transsolar Sas11, rue Martel 75010 Paris
Updated Version15 December 2016 18
3. Climates Comparison3.1. Results Summary (area specific)
CO2 emission Factor Europe (source: ISO15603:2008)
Electricity 617 kgCO2eq/kWh
Natural Gas 277 kgCO2eq/kWh
Primary Energy Factor Europe (source: ISO15603:2008)
Electricity 3.31
Natural Gas 1.36

Heating and Cooling Research Eurima, BruxellesPhone: +33 (0)1 76 43 12 00
Transsolar Sas11, rue Martel 75010 Paris
Updated Version15 December 2016 19
3. Climates Comparison3.2. Results Summary (total) Annex 1: Detailed Results
CO2 emission Factor Europe (source: ISO15603:2008)
Electricity 617 kgCO2eq/kWh
Natural Gas 277 kgCO2eq/kWh
Primary Energy Factor Europe (source: ISO15603:2008)
Electricity 3.31
Natural Gas 1.36

Heating and Cooling Research Eurima, BruxellesPhone: +33 (0)1 76 43 12 00
Transsolar Sas11, rue Martel 75010 Paris
Updated Version15 December 2016 20
LEGEND
Base: Low Envelope Performance, No Control, Old Boiler, Low efficiency split unit. Plant dimensioned on the low envelope demand.
Case 2: Good Envelope Performance, Nighttime Reduction, Thermostat on Radiators, New Boiler. High efficiency split unit. Plant dimensioned on good envelope demand.
Case 3:Excellent Envelope Performance, Nighttime Reduction, Thermostat on Radiators, New Boiler, High efficiency split unit. Plant dimensioned on the excellent envelope.
Two other climates have also been considered to study whether the previous conclusions were specific to France, or could also be applied to other european areas. As a reminder, the base case variants have been defined according to an estimation of the envelope performance of the local existing building stock. As a consequence, the building envelopes differ between the three climates, as they tend to do in reality.
The Helsinki Base variant presents the lowest energy demand between the 3 different climates. As Finland has been implementing for a longer time energy-efficient regulations for buildings, the envelope performance chosen for its base case is increased compared to France and Italy.
For that same reason, Naples shows a high heating demand, as its envelope is the least performant from the 3 Climates.
In order to better understand the previous remarks, the following table illustrates the correlation between climate, envelope performance and heating demand.
The limited differences between each climate heating demand are due to the different envelope performance which increases when the climate is colder. As an example, the Paris climate is 77% colder than the Naples one (speaking of heating degree days), but also 63% better insulated. As a consequence, the building heating demand in Paris is only 17% higher than in Naples.
It is important to note that in all three climates, the base envelope performance leads to a final heating energy consumption higher than 250 kWhEF/m²/y. Hence, improving the envelope performance makes sense for all three climates.
It could be argued that in Italy, buildings are not heated up to 21°C (air temperature) in winter, which would reduce the heating energy demand for this climate. However, reducing the heating temperature setpoint to, say 19°C (air temperature) for Naples climate only leads to a 20% reduction for the heating demand. Hence, the previous statements stay also true with this hypothesis.
The following results compare different envelope performance variants for 3 representative european climates.
3.3. Energy Demand and Final Energy Consumption
NB: It is important to notice that electrical demand for domestic equipment is limited (18.2 kWh/m².y) which translates an eco-friendly behavior from the building occupants. As a consequence, heating demand is slightly increased. This domestic equipment is not taken into account in the summary tables, because it is not tackled by EPBD directives. It is coherent to show these gains here because they have a positive role in heating demand reduction in winter.

Heating and Cooling Research Eurima, BruxellesPhone: +33 (0)1 76 43 12 00
Transsolar Sas11, rue Martel 75010 Paris
Updated Version15 December 2016 21
4. ANNEX I: Detailed Results

Comfort - Apartment L3_T2 (3rd floor, 2 rooms, SE-SW)
Heating and Cooling Research Eurima, BruxellesPhone: +33 (0)1 76 43 12 00
Transsolar Sas11, rue Martel 75010 Paris
Updated Version15 December 2016 22
Plant Model - Load Curves
Energy Demand - Load Curves
Final Specific Energy Consumption
4. Annex I: Detailed Results
Control: No Control
Envelope Perfomance: Low
Heating: Old Boiler - 1 speed burner
Cooling: Split unit for cooling (low efficiency)
Plant sized following the low envelope demand
4.1. Base Case: Low Envelope, No Control

Comfort - Apartment L3_T2 (3rd floor, 2 rooms, SE-SW)
Heating and Cooling Research Eurima, BruxellesPhone: +33 (0)1 76 43 12 00
Transsolar Sas11, rue Martel 75010 Paris
Updated Version15 December 2016 23
Plant Model - Load Curves
Energy Demand - Load Curves
Final Specific Energy Consumption
4. Annex I: Detailed Results
Control: Nighttime reduction, Thermostat on Radiators
Envelope Perfomance: Low
Heating: Old Boiler - 1 speed burner
Cooling: Split unit for cooling (low efficiency)
Plant sized following the low envelope demand
4.2. Paris - Case 1: Low Envelope, Night Time Reduction, Thermostat on Radiators

Comfort - Apartment L3_T2 (3rd floor, 2 rooms, SE-SW)
Heating and Cooling Research Eurima, BruxellesPhone: +33 (0)1 76 43 12 00
Transsolar Sas11, rue Martel 75010 Paris
Updated Version15 December 2016 24
Plant Model - Load Curves
Energy Demand - Load Curves
Final Specific Energy Consumption
4. Annex I: Detailed Results
Control: No Control
Envelope Perfomance: Good
Heating: Old Boiler - 1 speed burner
Cooling: Split unit for cooling (low efficiency)
Plant sized following the low envelope demand
4.3. Paris - Case 1 bis: Good Envelope, No Control

Comfort - Apartment L3_T2 (3rd floor, 2 rooms, SE-SW)
Heating and Cooling Research Eurima, BruxellesPhone: +33 (0)1 76 43 12 00
Transsolar Sas11, rue Martel 75010 Paris
Updated Version15 December 2016 25
Plant Model - Load Curves
Energy Demand - Load Curves
Final Specific Energy Consumption
4. Annex I: Detailed Results
Control: Night time reduction
Envelope Performance : Low
Heating: New condensing boiler - modulating burner
Cooling: Split unit for cooling (high efficiency)
Plant sized following the low envelope demand
4.4. Paris - Case 1 ter: Low Envelope, Night Time Reduction

Comfort - Apartment L3_T2 (3rd floor, 2 rooms, SE-SW)
Heating and Cooling Research Eurima, BruxellesPhone: +33 (0)1 76 43 12 00
Transsolar Sas11, rue Martel 75010 Paris
Updated Version15 December 2016 26
Plant Model - Load Curves
Energy Demand - Load Curves
Final Specific Energy Consumption
4. Annex I: Detailed Results
Control: Night time reduction
Envelope Performance : Low
Heating: Old boiler (for domestic hot water and outside temperature < 7°C), Heat pump
Cooling: Split unit for cooling (high efficiency)
Heat pump sized for T°C outside = 7°C
4.5. Paris - Case 1 ter HP: Low Envelope, Night Time Reduction with Heat Pump
Comfort - Apartment L3_T2 (3rd floor, 2 rooms, SE-SW)
Heating and Cooling Research Eurima, BruxellesPhone: +33 (0)1 76 43 12 00
Transsolar Sas11, rue Martel 75010 Paris
Updated Version15 December 2016 27
Plant Model - Load Curves
Energy Demand - Load Curves
Final Specific Energy Consumption
4. Annex I: Detailed Results
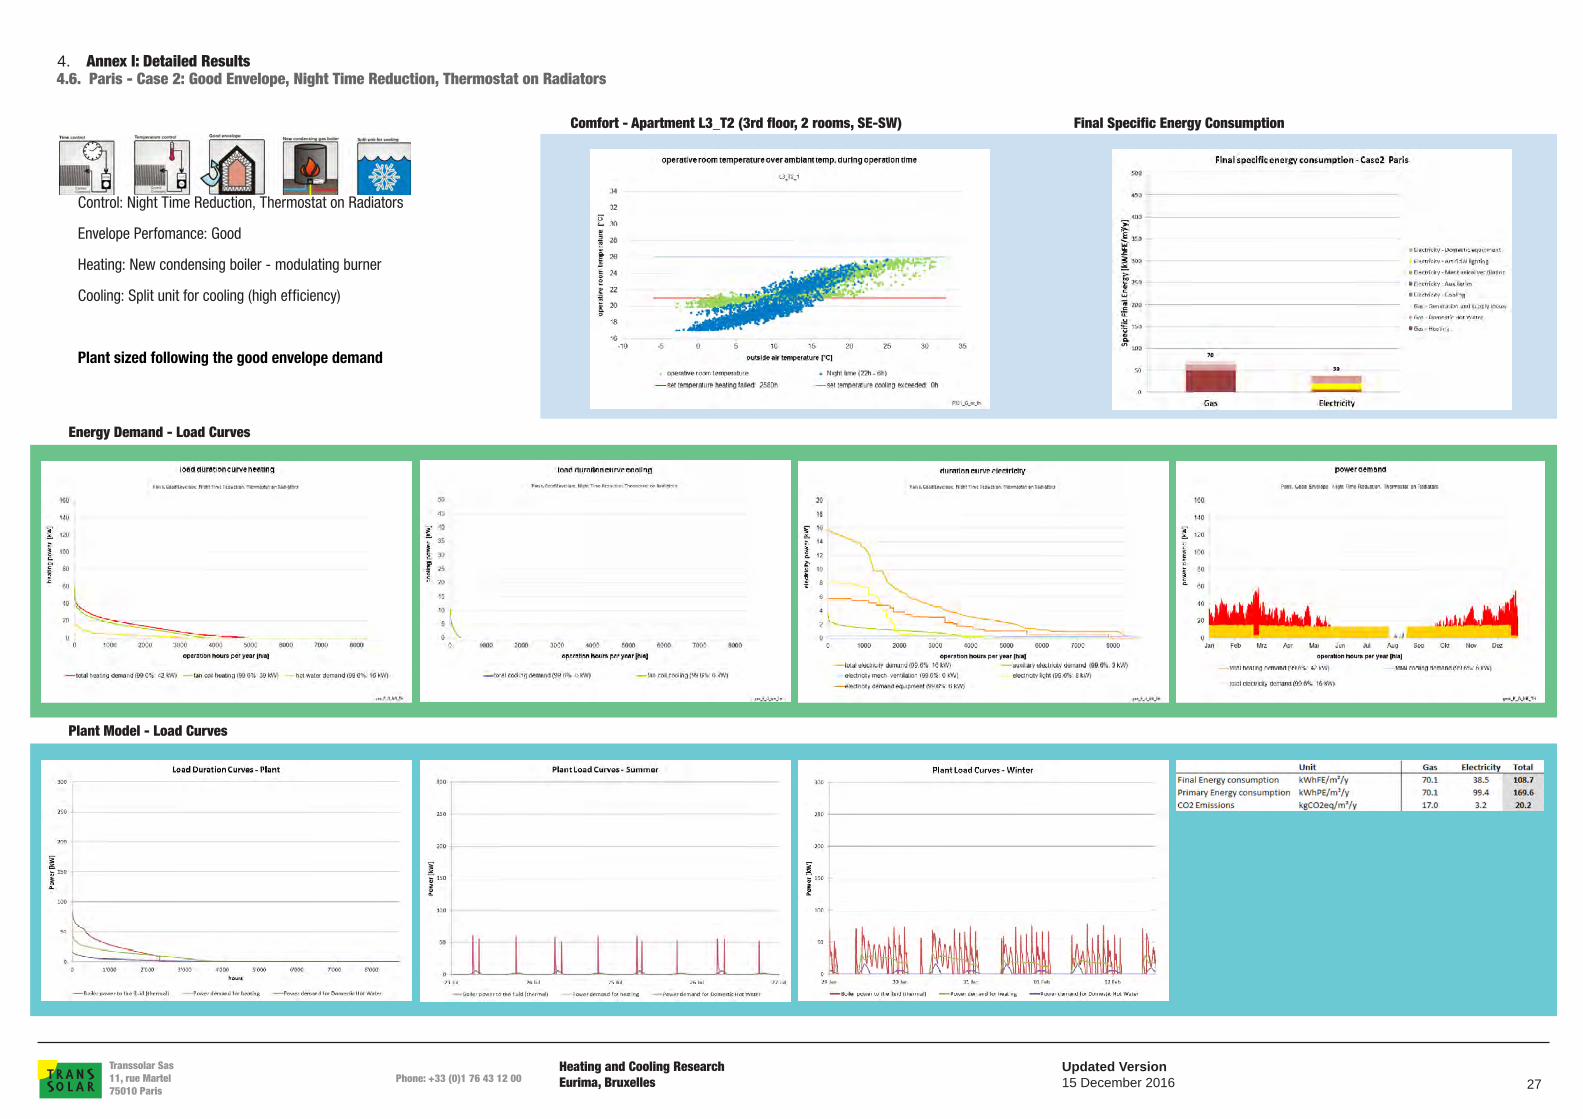
Control: Night Time Reduction, Thermostat on Radiators
Envelope Perfomance: Good
Heating: New condensing boiler - modulating burner
Cooling: Split unit for cooling (high efficiency)
Plant sized following the good envelope demand
4.6. Paris - Case 2: Good Envelope, Night Time Reduction, Thermostat on Radiators

Comfort - Apartment L3_T2 (3rd floor, 2 rooms, SE-SW)
Heating and Cooling Research Eurima, BruxellesPhone: +33 (0)1 76 43 12 00
Transsolar Sas11, rue Martel 75010 Paris
Updated Version15 December 2016 28
Plant Model - Load Curves
Energy Demand - Load Curves
Final Specific Energy Consumption
4. Annex I: Detailed Results
Control: Night Time Reduction, Thermostat on Radiators
Envelope Perfomance: Good
Heating and Domestic Hot Water: 2 separate Heat Pumps
Cooling: Split unit for cooling (high efficiency)
Plant sized following the good envelope demand
4.7. Paris - Case 2 HP: Good Envelope, Night Time Reduction, Thermostat on Radiators, Heat Pump

Comfort - Apartment L3_T2 (3rd floor, 2 rooms, SE-SW)
Heating and Cooling Research Eurima, BruxellesPhone: +33 (0)1 76 43 12 00
Transsolar Sas11, rue Martel 75010 Paris
Updated Version15 December 2016 29
Plant Model - Load Curves
Energy Demand - Load Curves
Final Specific Energy Consumption
4. Annex I: Detailed Results
Control: Night Time Reduction
Envelope Perfomance: Good
Heating: New condensing boiler - modulating burner
Cooling: Split unit for cooling (high efficiency)
Plant sized following the good envelope demand
4.8. Paris - Case 2 bis: Good Envelope, Night Time Reduction

Comfort - Apartment L3_T2 (3rd floor, 2 rooms, SE-SW)
Heating and Cooling Research Eurima, BruxellesPhone: +33 (0)1 76 43 12 00
Transsolar Sas11, rue Martel 75010 Paris
Updated Version15 December 2016 30
Plant Model - Load Curves
Energy Demand - Load Curves
Final Specific Energy Consumption
4. Annex I: Detailed Results
Control: Night Time Reduction, Thermostat on Radiators
Envelope Perfomance: Good
Heating: New condensing boiler - modulating burner
Cooling: Split unit for cooling (high efficiency)
Plant sized following the low envelope demand
4.9. Paris - Case 2 ter : Good Envelope, Night Time Reduction, Thermostat on Radiators

Comfort - Apartment L3_T2 (3rd floor, 2 rooms, SE-SW)
Heating and Cooling Research Eurima, BruxellesPhone: +33 (0)1 76 43 12 00
Transsolar Sas11, rue Martel 75010 Paris
Updated Version15 December 2016 31
Plant Model - Load Curves
Energy Demand - Load Curves
Final Specific Energy Consumption
4. Annex I: Detailed Results
Control: Night Time Reduction, Thermostat on Radiators
Envelope Perfomance: Good
Heating: Heat Pump
Domestic Hot Water: old boiler
Cooling: Split unit for cooling (high efficiency)
4.10. Paris - Case 2 ter HP : Good Envelope, Night Time Reduction, Thermostat on Radiators, Heat Pump

Comfort - Apartment L3_T2 (3rd floor, 2 rooms, SE-SW)
Heating and Cooling Research Eurima, BruxellesPhone: +33 (0)1 76 43 12 00
Transsolar Sas11, rue Martel 75010 Paris
Updated Version15 December 2016 32
Plant Model - Load Curves
Energy Demand - Load Curves
Final Specific Energy Consumption
4. Annex I: Detailed Results
Control: Night Time Reduction, Thermostat on Radiators
Envelope Perfomance: Excellent
Heating: New condensing boiler - modulating burner
Cooling: Split unit for cooling (high efficiency)
Plant sized following the excellent envelope demand
4.11. Paris - Case 3: Excellent Envelope Performance, Night Time Reduction, Thermostat on Radiators

Comfort - Apartment L3_T2 (3rd floor, 2 rooms, SE-SW)
Heating and Cooling Research Eurima, BruxellesPhone: +33 (0)1 76 43 12 00
Transsolar Sas11, rue Martel 75010 Paris
Updated Version15 December 2016 33
Plant Model - Load Curves
Energy Demand - Load Curves
Final Specific Energy Consumption
4. Annex I: Detailed Results
Control: No Control
Envelope Perfomance: Low
Heating: Old Boiler - 1 speed burner
Cooling: Split unit for cooling (low efficiency)
Plant sized following the low envelope demand
4.12. Naples - Base Case: Low Envelope, No Control

Comfort - Apartment L3_T2 (3rd floor, 2 rooms, SE-SW)
Heating and Cooling Research Eurima, BruxellesPhone: +33 (0)1 76 43 12 00
Transsolar Sas11, rue Martel 75010 Paris
Updated Version15 December 2016 34
Plant Model - Load Curves
Energy Demand - Load Curves
Final Specific Energy Consumption
4. Annex I: Detailed Results
Control: Night Time Reduction, Thermostat on Radiators
Envelope Perfomance: Good
Heating: New condensing boiler - modulating burner
Cooling: Split unit for cooling (high efficiency)
Plant sized following the good envelope demand
4.13. Naples - Case 2: Good Envelope Performance, Night Time Reduction, Thermostat on Radiator
Comfort - Apartment L3_T2 (3rd floor, 2 rooms, SE-SW)
Heating and Cooling Research Eurima, BruxellesPhone: +33 (0)1 76 43 12 00
Transsolar Sas11, rue Martel 75010 Paris
Updated Version15 December 2016 35
Plant Model - Load Curves
Energy Demand - Load Curves
Final Specific Energy Consumption
4. Annex I: Detailed Results
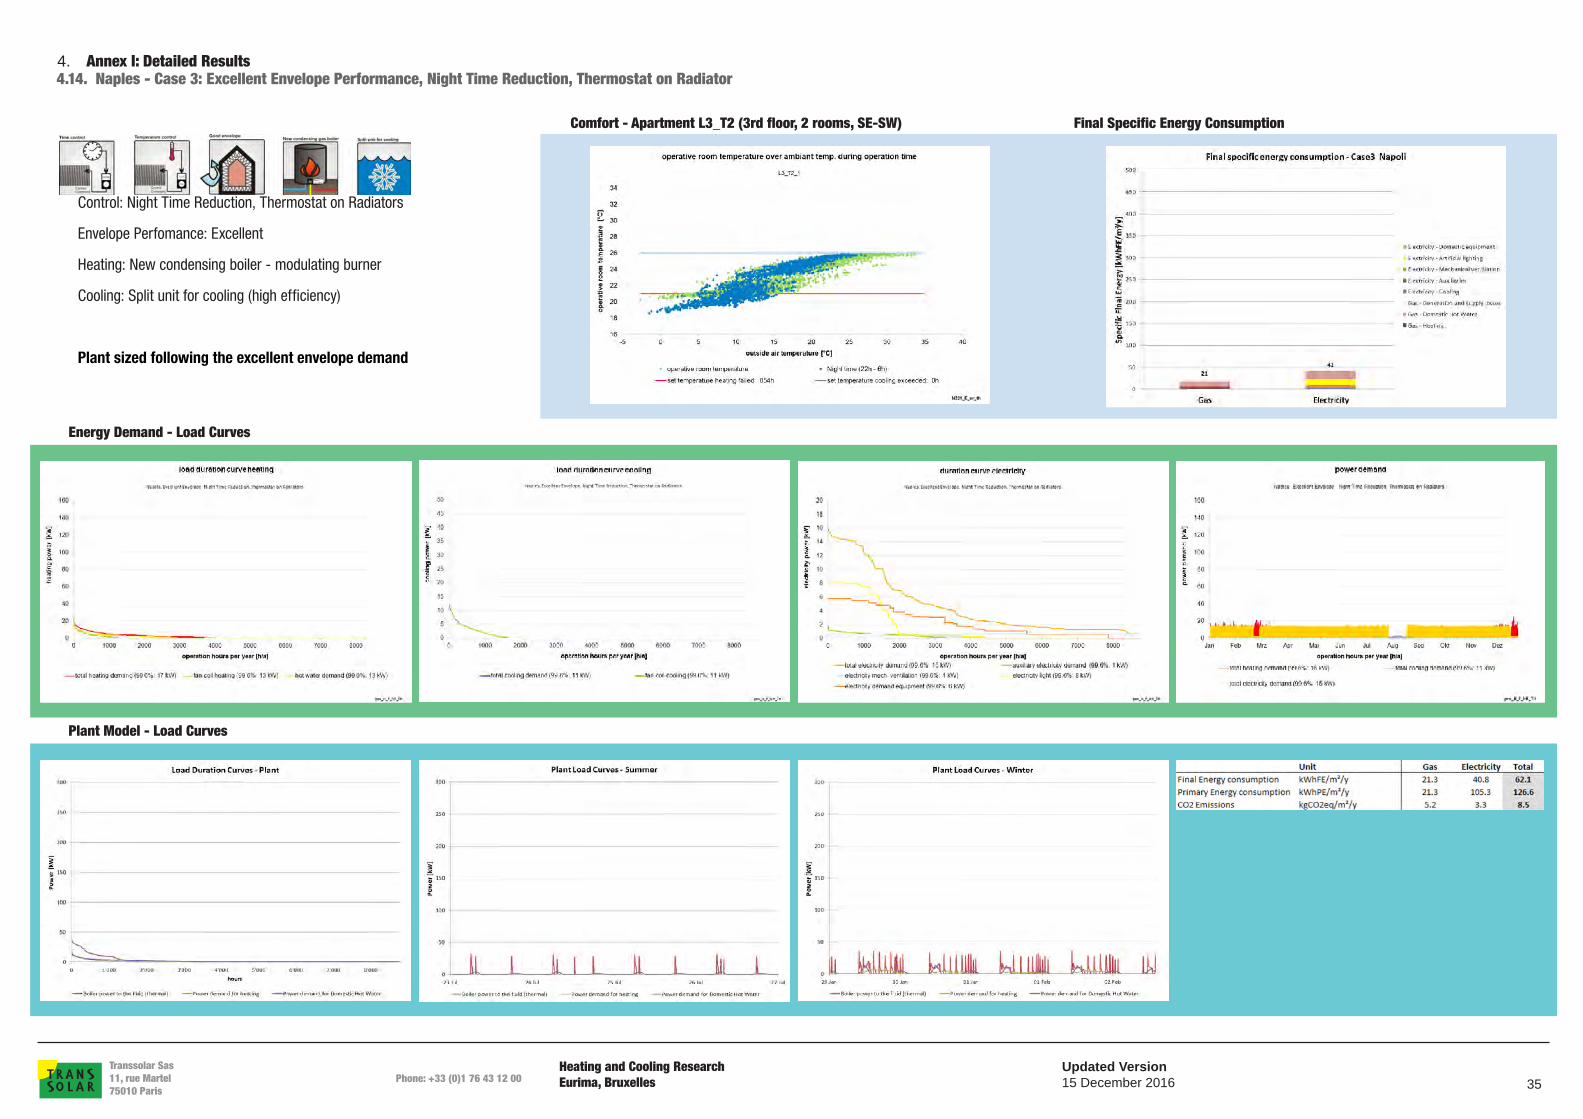
Control: Night Time Reduction, Thermostat on Radiators
Envelope Perfomance: Excellent
Heating: New condensing boiler - modulating burner
Cooling: Split unit for cooling (high efficiency)
Plant sized following the excellent envelope demand
4.14. Naples - Case 3: Excellent Envelope Performance, Night Time Reduction, Thermostat on Radiator

Comfort - Apartment L3_T2 (3rd floor, 2 rooms, SE-SW)
Heating and Cooling Research Eurima, BruxellesPhone: +33 (0)1 76 43 12 00
Transsolar Sas11, rue Martel 75010 Paris
Updated Version15 December 2016 36
Plant Model - Load Curves
Energy Demand - Load Curves
Final Specific Energy Consumption
4. Annex I: Detailed Results
Control: No Control
Envelope Perfomance: Low
Heating: Old Boiler - 1 speed burner
Cooling: Split unit for cooling (low efficiency)
Plant sized following the low envelope demand
4.15. Helsinki - Base Case: Low Envelope, No Control

Comfort - Apartment L3_T2 (3rd floor, 2 rooms, SE-SW)
Heating and Cooling Research Eurima, BruxellesPhone: +33 (0)1 76 43 12 00
Transsolar Sas11, rue Martel 75010 Paris
Updated Version15 December 2016 37
Plant Model - Load Curves
Energy Demand - Load Curves
Final Specific Energy Consumption
4. Annex I: Detailed Results
Control: Night Time Reduction, Thermostat on Radiators
Envelope Perfomance: Good
Heating: New condensing boiler - modulating burner
Cooling: Split unit for cooling (high efficiency)
Plant sized following the good envelope demand
4.16. Helsinki - Case 2: Good Envelope Performance, Night Time Reduction, Thermostat on Radiators

Comfort - Apartment L3_T2 (3rd floor, 2 rooms, SE-SW)
Heating and Cooling Research Eurima, BruxellesPhone: +33 (0)1 76 43 12 00
Transsolar Sas11, rue Martel 75010 Paris
Updated Version15 December 2016 38
Plant Model - Load Curves
Energy Demand - Load Curves
Final Specific Energy Consumption
4. Annex I: Detailed Results
Control: Night Time Reduction, Thermostat on Radiators
Envelope Perfomance: Excellent
Heating: New condensing boiler - modulating burner
Cooling: Split unit for cooling (high efficiency)
Plant sized following the excellent envelope demand
4.17. Helsinki - Case 3: Excellent Envelope Performance, Night Time Reduction, Thermostat on Radiators

Heating and Cooling Research Eurima, BruxellesPhone: +33 (0)1 76 43 12 00
Transsolar Sas11, rue Martel 75010 Paris
Updated Version15 December 2016 39
5. ANNEX II: Boundary Conditions

Heating and Cooling Research Eurima, BruxellesPhone: +33 (0)1 76 43 12 00
Transsolar Sas11, rue Martel 75010 Paris
Updated Version15 December 2016 40
5. ANNEX II - Boundary Conditions5.1. Modeling
This document summarizes the boundary conditions for the thermal modeling to be done with Trnsys during Phase 2 and 3. The building to be modeled is a 3-story residential building The boundary conditions for the building geometry, building operation and domestic hot water demand are the same for all variants.
Weather Data4 different climate have been selected for this study
Climate Weather dataMediterranean IWEC NaplesOceanic IWEC Paris OrlyOceanic - Heat Wave Predicted weather data for Paris, using the Meteonorm v7 software for Paris Montsouris, and taking into account the A2 IPCC scenario for 2020
This weather data is only used to study summer comfort during a typical Parisian Heat wave for different envelope typologies. Continental IWEC Helsinki
ModelingTRNSYS uses legal winter time all year long. As an example, simulations in Paris are all based on GMT+1.
A 2 steps approach is followed to model the building.
Step 1 : A dynamic thermal simulation using TRNSYS is modeling the building as it is defined independently from the plant settings, with ideal heating and cooling demands.Ideal space heating and space cooling demands represent the exact amount of energy needed to reach setpoint temperature in winter and summer in the room.It doesn't take into account any efficiency of the heating and cooling production systems.Heating and cooling demands are processed to get annual heating and cooling load curves over the whole building.
Step 2 : The load curves are used as inputs for a second dynamic simulation which is modeling the plant (energy production, regulation, efficiencies).This second calculation gives as results the final energy consumption, primary energy consumption, and the carbon emissions.

Heating and Cooling Research Eurima, BruxellesPhone: +33 (0)1 76 43 12 00
Transsolar Sas11, rue Martel 75010 Paris
Updated Version15 December 2016 41
5. ANNEX II - Boundary Conditions5.2. Geometry
GEOMETRY
South East and South West Façade North West and North East Facade Top ViewNorth
West East
South
Façade NW NE SE SW TotalFaçade area [m²] 308.4 170.5 308.4 170.5 957.9 Window area [m²] 51.1 25.9 115.0 28.4 220.3 Ratio 17% 15% 37% 17% 23%
Netto Area [m²] T2_1 T2_2 T2_3 T3_1 T4_1 Corr Stairs UnheatedL0 55.67 44.96 52.63 - - 39.78 24.65 96.93 L1 55.67 44.51 - 67.37 102.55 16.78 25.87 - L2 55.67 44.51 - 67.37 102.55 16.78 25.87 - L3 55.67 44.51 - 67.37 102.55 16.78 25.87 - Total 222.68 178.49 52.63 202.10 307.65 90.11 102.26 96.93
Total appartments [m²] 963.55 Total corridor [m²] 90.11 Total unconditionned space [m²] 96.93

Heating and Cooling Research Eurima, BruxellesPhone: +33 (0)1 76 43 12 00
Transsolar Sas11, rue Martel 75010 Paris
Updated Version15 December 2016 42
5. ANNEX II - Boundary Conditions5.3. Operation
OPERATION
Occupation Domestic Equipments Artificial Lighting Ventilation Comfort Domestic Hot Water
Dai
ly s
ched
ule
Hol
iday
Sch
edul
e
Num
ber o
f peo
ple
Pow
er d
ensi
ty
Dai
ly S
ched
ule
Pow
er d
ensi
ty
Illum
min
ance
Set
poin
t
Con
trol
Dai
ly S
ched
ule
Mec
hani
cal V
entil
atio
n A
ircha
nge
Nat
ural
Ven
tilat
ion
thro
ugh
Win
dow
op
enni
ng (s
umm
er
com
fort
)
Tem
pera
ture
Set
poin
t -
Win
ter
Tem
pera
ture
Set
poin
t -
Sum
mer
DH
W O
utle
t Tem
pera
ture
Dai
ly D
HW
vol
ume
per
pers
on
[-] [-] [pers] [W/m²] [-] [W/m²] lux [-] [-] [ACH] [-] [°C] [°C] [°C] [L/p/day]Programstwo-rooms appartment occ_2r_apartment holiday_year 1 5.7 equip_2r_apartment 7.1 300 DLF light_2r_apartment 0.60 yes 21°C 26°C 40 50three-rooms appartment occ_3r_apartment holiday_year 3 5.7 equip_3r_apartment 6.9 300 DLF light_3r_apartment 0.60 yes 21°C 26°C 40 50four-rooms appartment occ_4r_apartment holiday_year 4 5.7 equip_4r_apartment 7.2 300 DLF light_4r_apartment 0.60 yes 21°C 26°C 40 50corridor - - - 0.0 - 5.0 100 SCHED light_corridor - no 19°C - - -stairs & elevators - - - 0.0 - 5.0 150 SCHED light_corridor - no 19°C - - -entrance hall - - - 0.0 - 5.0 100 SCHED light_corridor - no 19°C - - -
- -
VacationsWinter vacations: Last week of FebruarySummer vacations: 3 first weeks of AugustChristmas vacations: Last week of December

Heating and Cooling Research Eurima, BruxellesPhone: +33 (0)1 76 43 12 00
Transsolar Sas11, rue Martel 75010 Paris
Updated Version15 December 2016 43
5. ANNEX II - Boundary Conditions5.4. Schedules - T2
SCENARII - OCCUPATION & DOMESTIC EQUIPMENTS & ARTIFICIAL LIGHTING 2-rooms appartmentYoung working person
All the following schedules are given without Daylight saving time (GMT +1h) Scenario inspired from the French RT 2012 and the Swiss SIA2024. Adapted according to our experience
[%] occ_2r_apartment_week [%] occ_2r_apartment_weekend100 0 0 0 0 0 0 1 1 0 0 0 0 0 0 0 0 0 0 0 1 1 1 1 0 100 0 0 0 0 0 0 1 1 1 1 0 0 1 1 1 0 0 1 1 1 1 1 0 0
90 0 0 0 0 0 0 1 1 0 0 0 0 0 0 0 0 0 0 0 1 1 1 1 0 90 0 0 0 0 0 0 1 1 1 1 0 0 1 1 1 0 0 1 1 1 1 1 0 0
80 0 0 0 0 0 0 1 1 0 0 0 0 0 0 0 0 0 0 0 1 1 1 1 0 80 0 0 0 0 0 0 1 1 1 1 0 0 1 1 1 0 0 1 1 1 1 1 0 0
70 1 1 1 1 1 1 1 1 0 0 0 0 0 0 0 0 0 0 0 1 1 1 1 1 70 1 1 1 1 1 1 1 1 1 1 0 0 1 1 1 0 0 1 1 1 1 1 1 1
60 1 1 1 1 1 1 1 1 0 0 0 0 0 0 0 0 0 0 0 1 1 1 1 1 60 1 1 1 1 1 1 1 1 1 1 0 0 1 1 1 0 0 1 1 1 1 1 1 1
50 1 1 1 1 1 1 1 1 1 0 0 0 0 0 0 0 0 0 1 1 1 1 1 1 50 1 1 1 1 1 1 1 1 1 1 1 1 1 1 1 1 1 1 1 1 1 1 1 1
40 1 1 1 1 1 1 1 1 1 0 0 0 0 0 0 0 0 0 1 1 1 1 1 1 40 1 1 1 1 1 1 1 1 1 1 1 1 1 1 1 1 1 1 1 1 1 1 1 1
30 1 1 1 1 1 1 1 1 1 0 0 0 0 0 0 0 0 0 1 1 1 1 1 1 30 1 1 1 1 1 1 1 1 1 1 1 1 1 1 1 1 1 1 1 1 1 1 1 1
20 1 1 1 1 1 1 1 1 1 0 0 0 0 0 0 0 0 0 1 1 1 1 1 1 20 1 1 1 1 1 1 1 1 1 1 1 1 1 1 1 1 1 1 1 1 1 1 1 1
10 1 1 1 1 1 1 1 1 1 0 0 0 0 0 0 0 0 0 1 1 1 1 1 1 10 1 1 1 1 1 1 1 1 1 1 1 1 1 1 1 1 1 1 1 1 1 1 1 1
1 2 3 4 5 6 7 8 9 10 11 12 13 14 15 16 17 18 19 20 21 22 23 24 1 2 3 4 5 6 7 8 9 10 11 12 13 14 15 16 17 18 19 20 21 22 23 24[%] 70 70 70 70 70 70 100 100 50 0 0 0 0 0 0 0 0 0 50 100 100 100 100 70 [%] 70 70 70 70 70 70 100 100 100 100 50 50 100 100 100 50 50 100 100 100 100 100 70 70
[%] equip_2r_apartment_week [%] equip_2r_apartment_weekend100 0 0 0 0 0 0 1 1 0 0 0 0 0 0 0 0 0 0 0 1 1 1 0 0 100 0 0 0 0 0 0 0 1 0 0 0 0 0 1 0 0 0 0 0 1 0 0 0 0
90 0 0 0 0 0 0 1 1 0 0 0 0 0 0 0 0 0 0 0 1 1 1 0 0 90 0 0 0 0 0 0 0 1 0 0 0 0 0 1 0 0 0 0 0 1 0 0 0 0
80 0 0 0 0 0 0 1 1 0 0 0 0 0 0 0 0 0 0 0 1 1 1 0 0 80 0 0 0 0 0 0 0 1 0 0 0 0 0 1 0 0 0 0 0 1 0 0 0 0
70 0 0 0 0 0 0 1 1 0 0 0 0 0 0 0 0 0 0 0 1 1 1 0 0 70 0 0 0 0 0 0 0 1 1 0 0 0 0 1 1 0 0 0 0 1 1 1 0 0
60 0 0 0 0 0 0 1 1 0 0 0 0 0 0 0 0 0 0 0 1 1 1 0 0 60 0 0 0 0 0 0 0 1 1 0 0 0 0 1 1 0 0 0 0 1 1 1 0 0
50 0 0 0 0 0 0 1 1 1 0 0 0 0 0 0 0 0 0 1 1 1 1 1 0 50 0 0 0 0 0 0 1 1 1 1 1 1 1 1 1 1 1 1 1 1 1 1 0 0
40 0 0 0 0 0 0 1 1 1 0 0 0 0 0 0 0 0 0 1 1 1 1 1 0 40 0 0 0 0 0 0 1 1 1 1 1 1 1 1 1 1 1 1 1 1 1 1 0 0
30 0 0 0 0 0 0 1 1 1 0 0 0 0 0 0 0 0 0 1 1 1 1 1 0 30 0 0 0 0 0 0 1 1 1 1 1 1 1 1 1 1 1 1 1 1 1 1 0 0
20 0 0 0 0 0 0 1 1 1 0 0 0 0 0 0 0 0 0 1 1 1 1 1 0 20 0 0 0 0 0 0 1 1 1 1 1 1 1 1 1 1 1 1 1 1 1 1 0 0
10 1 1 1 1 1 1 1 1 1 1 1 1 1 1 1 1 1 1 1 1 1 1 1 1 10 1 1 1 1 1 1 1 1 1 1 1 1 1 1 1 1 1 1 1 1 1 1 1 1
1 2 3 4 5 6 7 8 9 10 11 12 13 14 15 16 17 18 19 20 21 22 23 24 1 2 3 4 5 6 7 8 9 10 11 12 13 14 15 16 17 18 19 20 21 22 23 24[%] 10 10 10 10 10 10 100 100 50 10 10 10 10 10 10 10 10 10 50 100 100 100 50 10 [%] 10 10 10 10 10 10 50 100 75 50 50 50 50 100 75 50 50 50 50 100 75 75 10 10
[%] light_2r_apartment_week [%] light_2r_apartment_weekend100 0 0 0 0 0 0 1 1 1 0 0 0 0 0 0 0 0 0 1 1 1 1 1 0 100 0 0 0 0 0 0 1 1 1 1 1 1 1 1 1 1 1 1 1 1 1 1 0 0
90 0 0 0 0 0 0 1 1 1 0 0 0 0 0 0 0 0 0 1 1 1 1 1 0 90 0 0 0 0 0 0 1 1 1 1 1 1 1 1 1 1 1 1 1 1 1 1 0 0
80 0 0 0 0 0 0 1 1 1 0 0 0 0 0 0 0 0 0 1 1 1 1 1 0 80 0 0 0 0 0 0 1 1 1 1 1 1 1 1 1 1 1 1 1 1 1 1 0 0
70 0 0 0 0 0 0 1 1 1 0 0 0 0 0 0 0 0 0 1 1 1 1 1 0 70 0 0 0 0 0 0 1 1 1 1 1 1 1 1 1 1 1 1 1 1 1 1 0 0
60 0 0 0 0 0 0 1 1 1 0 0 0 0 0 0 0 0 0 1 1 1 1 1 0 60 0 0 0 0 0 0 1 1 1 1 1 1 1 1 1 1 1 1 1 1 1 1 0 0
50 0 0 0 0 0 0 1 1 1 0 0 0 0 0 0 0 0 0 1 1 1 1 1 0 50 0 0 0 0 0 0 1 1 1 1 1 1 1 1 1 1 1 1 1 1 1 1 0 0
40 0 0 0 0 0 0 1 1 1 0 0 0 0 0 0 0 0 0 1 1 1 1 1 0 40 0 0 0 0 0 0 1 1 1 1 1 1 1 1 1 1 1 1 1 1 1 1 0 0
30 0 0 0 0 0 0 1 1 1 0 0 0 0 0 0 0 0 0 1 1 1 1 1 0 30 0 0 0 0 0 0 1 1 1 1 1 1 1 1 1 1 1 1 1 1 1 1 0 0
20 0 0 0 0 0 0 1 1 1 0 0 0 0 0 0 0 0 0 1 1 1 1 1 0 20 0 0 0 0 0 0 1 1 1 1 1 1 1 1 1 1 1 1 1 1 1 1 0 0
10 0 0 0 0 0 0 1 1 1 0 0 0 0 0 0 0 0 0 1 1 1 1 1 0 10 0 0 0 0 0 0 1 1 1 1 1 1 1 1 1 1 1 1 1 1 1 1 0 0
1 2 3 4 5 6 7 8 9 10 11 12 13 14 15 16 17 18 19 20 21 22 23 24 1 2 3 4 5 6 7 8 9 10 11 12 13 14 15 16 17 18 19 20 21 22 23 24[%] 0 0 0 0 0 0 100 100 100 0 0 0 0 0 0 0 0 0 100 100 100 100 100 0 [%] 0 0 0 0 0 0 100 100 100 100 100 100 100 100 100 100 100 100 100 100 100 100 0 0

Heating and Cooling Research Eurima, BruxellesPhone: +33 (0)1 76 43 12 00
Transsolar Sas11, rue Martel 75010 Paris
Updated Version15 December 2016 44
5. ANNEX II - Boundary Conditions5.5. Schedules - T3
SCENARII - OCCUPATION & DOMESTIC EQUIPMENTS & ARTIFICIAL LIGHTING 3-rooms appartmentRetired couple
All the following schedules are given without Daylight saving time (GMT +1h) Scenario inspired from the French RT 2012 and the Swiss SIA2024. Adapted according to our experience
[%] occ_3r_apartment_week [%] occ_3r_apartment_weekend100 0 0 0 0 0 0 1 1 1 1 0 0 1 1 1 0 0 1 1 1 1 1 0 0 100 0 0 0 0 0 0 1 1 1 1 0 0 1 1 1 0 0 1 1 1 1 1 0 0
90 0 0 0 0 0 0 1 1 1 1 0 0 1 1 1 0 0 1 1 1 1 1 0 0 90 0 0 0 0 0 0 1 1 1 1 0 0 1 1 1 0 0 1 1 1 1 1 0 0
80 0 0 0 0 0 0 1 1 1 1 0 0 1 1 1 0 0 1 1 1 1 1 0 0 80 0 0 0 0 0 0 1 1 1 1 0 0 1 1 1 0 0 1 1 1 1 1 0 0
70 1 1 1 1 1 1 1 1 1 1 0 0 1 1 1 0 0 1 1 1 1 1 1 1 70 1 1 1 1 1 1 1 1 1 1 0 0 1 1 1 0 0 1 1 1 1 1 1 1
60 1 1 1 1 1 1 1 1 1 1 0 0 1 1 1 0 0 1 1 1 1 1 1 1 60 1 1 1 1 1 1 1 1 1 1 0 0 1 1 1 0 0 1 1 1 1 1 1 1
50 1 1 1 1 1 1 1 1 1 1 1 1 1 1 1 1 1 1 1 1 1 1 1 1 50 1 1 1 1 1 1 1 1 1 1 1 1 1 1 1 1 1 1 1 1 1 1 1 1
40 1 1 1 1 1 1 1 1 1 1 1 1 1 1 1 1 1 1 1 1 1 1 1 1 40 1 1 1 1 1 1 1 1 1 1 1 1 1 1 1 1 1 1 1 1 1 1 1 1
30 1 1 1 1 1 1 1 1 1 1 1 1 1 1 1 1 1 1 1 1 1 1 1 1 30 1 1 1 1 1 1 1 1 1 1 1 1 1 1 1 1 1 1 1 1 1 1 1 1
20 1 1 1 1 1 1 1 1 1 1 1 1 1 1 1 1 1 1 1 1 1 1 1 1 20 1 1 1 1 1 1 1 1 1 1 1 1 1 1 1 1 1 1 1 1 1 1 1 1
10 1 1 1 1 1 1 1 1 1 1 1 1 1 1 1 1 1 1 1 1 1 1 1 1 10 1 1 1 1 1 1 1 1 1 1 1 1 1 1 1 1 1 1 1 1 1 1 1 1
1 2 3 4 5 6 7 8 9 10 11 12 13 14 15 16 17 18 19 20 21 22 23 24 1 2 3 4 5 6 7 8 9 10 11 12 13 14 15 16 17 18 19 20 21 22 23 24[%] 70 70 70 70 70 70 100 100 100 100 50 50 100 100 100 50 50 100 100 100 100 100 70 70 [%] 70 70 70 70 70 70 100 100 100 100 50 50 100 100 100 50 50 100 100 100 100 100 70 70
[%] equip_3r_apartment_week [%] equip_3r_apartment_weekend100 0 0 0 0 0 0 0 1 0 0 0 0 0 1 0 0 0 0 0 1 0 0 0 0 100 0 0 0 0 0 0 0 1 0 0 0 0 0 1 0 0 0 0 0 1 0 0 0 0
90 0 0 0 0 0 0 0 1 0 0 0 0 0 1 0 0 0 0 0 1 0 0 0 0 90 0 0 0 0 0 0 0 1 0 0 0 0 0 1 0 0 0 0 0 1 0 0 0 0
80 0 0 0 0 0 0 0 1 0 0 0 0 0 1 0 0 0 0 0 1 0 0 0 0 80 0 0 0 0 0 0 0 1 0 0 0 0 0 1 0 0 0 0 0 1 0 0 0 0
70 0 0 0 0 0 0 0 1 1 0 0 0 0 1 1 0 0 0 0 1 1 1 0 0 70 0 0 0 0 0 0 0 1 1 0 0 0 0 1 1 0 0 0 0 1 1 1 0 0
60 0 0 0 0 0 0 0 1 1 0 0 0 0 1 1 0 0 0 0 1 1 1 0 0 60 0 0 0 0 0 0 0 1 1 0 0 0 0 1 1 0 0 0 0 1 1 1 0 0
50 0 0 0 0 0 0 1 1 1 1 1 1 1 1 1 1 1 1 1 1 1 1 0 0 50 0 0 0 0 0 0 1 1 1 1 1 1 1 1 1 1 1 1 1 1 1 1 0 0
40 0 0 0 0 0 0 1 1 1 1 1 1 1 1 1 1 1 1 1 1 1 1 0 0 40 0 0 0 0 0 0 1 1 1 1 1 1 1 1 1 1 1 1 1 1 1 1 0 0
30 0 0 0 0 0 0 1 1 1 1 1 1 1 1 1 1 1 1 1 1 1 1 0 0 30 0 0 0 0 0 0 1 1 1 1 1 1 1 1 1 1 1 1 1 1 1 1 0 0
20 0 0 0 0 0 0 1 1 1 1 1 1 1 1 1 1 1 1 1 1 1 1 0 0 20 0 0 0 0 0 0 1 1 1 1 1 1 1 1 1 1 1 1 1 1 1 1 0 0
10 1 1 1 1 1 1 1 1 1 1 1 1 1 1 1 1 1 1 1 1 1 1 1 1 10 1 1 1 1 1 1 1 1 1 1 1 1 1 1 1 1 1 1 1 1 1 1 1 1
1 2 3 4 5 6 7 8 9 10 11 12 13 14 15 16 17 18 19 20 21 22 23 24 1 2 3 4 5 6 7 8 9 10 11 12 13 14 15 16 17 18 19 20 21 22 23 24[%] 10 10 10 10 10 10 50 100 75 50 50 50 50 100 75 50 50 50 50 100 75 75 10 10 [%] 10 10 10 10 10 10 50 100 75 50 50 50 50 100 75 50 50 50 50 100 75 75 10 10
[%] light_3r_apartment_week [%] light_3r_apartment_weekend100 0 0 0 0 0 0 1 1 1 1 1 1 1 1 1 1 1 1 1 1 1 1 0 0 100 0 0 0 0 0 0 1 1 1 1 1 1 1 1 1 1 1 1 1 1 1 1 0 0
90 0 0 0 0 0 0 1 1 1 1 1 1 1 1 1 1 1 1 1 1 1 1 0 0 90 0 0 0 0 0 0 1 1 1 1 1 1 1 1 1 1 1 1 1 1 1 1 0 0
80 0 0 0 0 0 0 1 1 1 1 1 1 1 1 1 1 1 1 1 1 1 1 0 0 80 0 0 0 0 0 0 1 1 1 1 1 1 1 1 1 1 1 1 1 1 1 1 0 0
70 0 0 0 0 0 0 1 1 1 1 1 1 1 1 1 1 1 1 1 1 1 1 0 0 70 0 0 0 0 0 0 1 1 1 1 1 1 1 1 1 1 1 1 1 1 1 1 0 0
60 0 0 0 0 0 0 1 1 1 1 1 1 1 1 1 1 1 1 1 1 1 1 0 0 60 0 0 0 0 0 0 1 1 1 1 1 1 1 1 1 1 1 1 1 1 1 1 0 0
50 0 0 0 0 0 0 1 1 1 1 1 1 1 1 1 1 1 1 1 1 1 1 0 0 50 0 0 0 0 0 0 1 1 1 1 1 1 1 1 1 1 1 1 1 1 1 1 0 0
40 0 0 0 0 0 0 1 1 1 1 1 1 1 1 1 1 1 1 1 1 1 1 0 0 40 0 0 0 0 0 0 1 1 1 1 1 1 1 1 1 1 1 1 1 1 1 1 0 0
30 0 0 0 0 0 0 1 1 1 1 1 1 1 1 1 1 1 1 1 1 1 1 0 0 30 0 0 0 0 0 0 1 1 1 1 1 1 1 1 1 1 1 1 1 1 1 1 0 0
20 0 0 0 0 0 0 1 1 1 1 1 1 1 1 1 1 1 1 1 1 1 1 0 0 20 0 0 0 0 0 0 1 1 1 1 1 1 1 1 1 1 1 1 1 1 1 1 0 0
10 0 0 0 0 0 0 1 1 1 1 1 1 1 1 1 1 1 1 1 1 1 1 0 0 10 0 0 0 0 0 0 1 1 1 1 1 1 1 1 1 1 1 1 1 1 1 1 0 0
1 2 3 4 5 6 7 8 9 10 11 12 13 14 15 16 17 18 19 20 21 22 23 24 1 2 3 4 5 6 7 8 9 10 11 12 13 14 15 16 17 18 19 20 21 22 23 24[%] 0 0 0 0 0 0 100 100 100 100 100 100 100 100 100 100 100 100 100 100 100 100 0 0 [%] 0 0 0 0 0 0 100 100 100 100 100 100 100 100 100 100 100 100 100 100 100 100 0 0

Heating and Cooling Research Eurima, BruxellesPhone: +33 (0)1 76 43 12 00
Transsolar Sas11, rue Martel 75010 Paris
Updated Version15 December 2016 45
5. ANNEX II - Boundary Conditions5.6. Schedules - T4
SCENARII - OCCUPATION & DOMESTIC EQUIPMENTS & ARTIFICIAL LIGHTING 4-rooms appartmentFamily apartment
All the following schedules are given without Daylight saving time (GMT +1h) 2 parents, 2 teenagersScenario inspired from the French RT 2012 and the Swiss SIA2024. Adapted according to our experience
[%] occ_4r_apartment_week [%] occ_4r_apartment_weekend100 0 0 0 0 0 0 1 1 0 0 0 0 0 0 0 0 0 0 1 1 1 1 0 0 100 0 0 0 0 0 0 0 0 1 0 0 0 1 1 0 0 0 0 0 1 1 1 0 0
90 0 0 0 0 0 0 1 1 0 0 0 0 0 0 0 0 0 0 1 1 1 1 1 0 90 0 0 0 0 0 0 0 0 1 0 0 0 1 1 0 0 0 0 0 1 1 1 0 0
80 0 0 0 0 0 0 1 1 0 0 0 0 0 0 0 0 0 0 1 1 1 1 1 0 80 0 0 0 0 0 0 0 1 1 1 0 0 1 1 1 0 0 0 1 1 1 1 1 0
70 1 1 1 1 1 1 1 1 0 0 0 0 0 0 0 0 0 1 1 1 1 1 1 1 70 1 1 1 1 1 1 1 1 1 1 0 0 1 1 1 0 0 0 1 1 1 1 1 1
60 1 1 1 1 1 1 1 1 0 0 0 0 0 0 0 0 0 1 1 1 1 1 1 1 60 1 1 1 1 1 1 1 1 1 1 1 1 1 1 1 1 1 1 1 1 1 1 1 1
50 1 1 1 1 1 1 1 1 1 0 0 0 0 0 0 0 1 1 1 1 1 1 1 1 50 1 1 1 1 1 1 1 1 1 1 1 1 1 1 1 1 1 1 1 1 1 1 1 1
40 1 1 1 1 1 1 1 1 1 0 0 0 0 0 0 0 1 1 1 1 1 1 1 1 40 1 1 1 1 1 1 1 1 1 1 1 1 1 1 1 1 1 1 1 1 1 1 1 1
30 1 1 1 1 1 1 1 1 1 0 0 0 0 0 0 0 1 1 1 1 1 1 1 1 30 1 1 1 1 1 1 1 1 1 1 1 1 1 1 1 1 1 1 1 1 1 1 1 1
20 1 1 1 1 1 1 1 1 1 0 0 0 0 0 0 0 1 1 1 1 1 1 1 1 20 1 1 1 1 1 1 1 1 1 1 1 1 1 1 1 1 1 1 1 1 1 1 1 1
10 1 1 1 1 1 1 1 1 1 0 0 0 0 0 0 0 1 1 1 1 1 1 1 1 10 1 1 1 1 1 1 1 1 1 1 1 1 1 1 1 1 1 1 1 1 1 1 1 1
1 2 3 4 5 6 7 8 9 10 11 12 13 14 15 16 17 18 19 20 21 22 23 24 1 2 3 4 5 6 7 8 9 10 11 12 13 14 15 16 17 18 19 20 21 22 23 24[%] 70 70 70 70 70 70 100 100 50 0 0 0 0 0 0 0 50 75 100 100 100 100 90 70 [%] 70 70 70 70 70 70 70 80 100 80 60 60 100 100 80 60 60 60 80 100 100 100 80 70
[%] equip_4r_apartment_week [%] equip_4r_apartment_weekend100 0 0 0 0 0 0 1 1 0 0 0 0 0 0 0 0 0 0 1 1 1 1 0 0 100 0 0 0 0 0 0 0 0 1 0 0 0 1 1 0 0 0 0 0 1 1 1 0 0
90 0 0 0 0 0 0 1 1 0 0 0 0 0 0 0 0 0 0 1 1 1 1 1 0 90 0 0 0 0 0 0 0 0 1 0 0 0 1 1 0 0 0 0 0 1 1 1 0 0
80 0 0 0 0 0 0 1 1 0 0 0 0 0 0 0 0 0 0 1 1 1 1 1 0 80 0 0 0 0 0 0 0 0 1 1 0 0 1 1 1 0 0 0 1 1 1 1 0 0
70 0 0 0 0 0 0 1 1 0 0 0 0 0 0 0 0 0 1 1 1 1 1 1 0 70 0 0 0 0 0 0 0 0 1 1 0 0 1 1 1 0 0 0 1 1 1 1 0 0
60 0 0 0 0 0 0 1 1 0 0 0 0 0 0 0 0 0 1 1 1 1 1 1 0 60 0 0 0 0 0 0 0 0 1 1 1 1 1 1 1 1 1 1 1 1 1 1 0 0
50 0 0 0 0 0 0 1 1 1 0 0 0 0 0 0 0 1 1 1 1 1 1 1 0 50 0 0 0 0 0 0 0 1 1 1 1 1 1 1 1 1 1 1 1 1 1 1 1 0
40 0 0 0 0 0 0 1 1 1 0 0 0 0 0 0 0 1 1 1 1 1 1 1 0 40 0 0 0 0 0 0 0 1 1 1 1 1 1 1 1 1 1 1 1 1 1 1 1 0
30 0 0 0 0 0 0 1 1 1 0 0 0 0 0 0 0 1 1 1 1 1 1 1 0 30 0 0 0 0 0 0 0 1 1 1 1 1 1 1 1 1 1 1 1 1 1 1 1 0
20 0 0 0 0 0 0 1 1 1 0 0 0 0 0 0 0 1 1 1 1 1 1 1 0 20 0 0 0 0 0 0 0 1 1 1 1 1 1 1 1 1 1 1 1 1 1 1 1 0
10 1 1 1 1 1 1 1 1 1 1 1 1 1 1 1 1 1 1 1 1 1 1 1 1 10 1 1 1 1 1 1 1 1 1 1 1 1 1 1 1 1 1 1 1 1 1 1 1 1
1 2 3 4 5 6 7 8 9 10 11 12 13 14 15 16 17 18 19 20 21 22 23 24 1 2 3 4 5 6 7 8 9 10 11 12 13 14 15 16 17 18 19 20 21 22 23 24[%] 10 10 10 10 10 10 100 100 50 10 10 10 10 10 10 10 50 75 100 100 100 100 90 10 [%] 10 10 10 10 10 10 10 50 100 80 60 60 100 100 80 60 60 60 80 100 100 100 50 10
[%] light_4r_apartment_week [%] light_4r_apartment_weekend100 0 0 0 0 0 0 1 1 1 0 0 0 0 0 0 0 1 1 1 1 1 1 1 0 100 0 0 0 0 0 0 0 1 1 1 1 1 1 1 1 1 1 1 1 1 1 1 1 0
90 0 0 0 0 0 0 1 1 1 0 0 0 0 0 0 0 1 1 1 1 1 1 1 0 90 0 0 0 0 0 0 0 1 1 1 1 1 1 1 1 1 1 1 1 1 1 1 1 0
80 0 0 0 0 0 0 1 1 1 0 0 0 0 0 0 0 1 1 1 1 1 1 1 0 80 0 0 0 0 0 0 0 1 1 1 1 1 1 1 1 1 1 1 1 1 1 1 1 0
70 0 0 0 0 0 0 1 1 1 0 0 0 0 0 0 0 1 1 1 1 1 1 1 0 70 0 0 0 0 0 0 0 1 1 1 1 1 1 1 1 1 1 1 1 1 1 1 1 0
60 0 0 0 0 0 0 1 1 1 0 0 0 0 0 0 0 1 1 1 1 1 1 1 0 60 0 0 0 0 0 0 0 1 1 1 1 1 1 1 1 1 1 1 1 1 1 1 1 0
50 0 0 0 0 0 0 1 1 1 0 0 0 0 0 0 0 1 1 1 1 1 1 1 0 50 0 0 0 0 0 0 0 1 1 1 1 1 1 1 1 1 1 1 1 1 1 1 1 0
40 0 0 0 0 0 0 1 1 1 0 0 0 0 0 0 0 1 1 1 1 1 1 1 0 40 0 0 0 0 0 0 0 1 1 1 1 1 1 1 1 1 1 1 1 1 1 1 1 0
30 0 0 0 0 0 0 1 1 1 0 0 0 0 0 0 0 1 1 1 1 1 1 1 0 30 0 0 0 0 0 0 0 1 1 1 1 1 1 1 1 1 1 1 1 1 1 1 1 0
20 0 0 0 0 0 0 1 1 1 0 0 0 0 0 0 0 1 1 1 1 1 1 1 0 20 0 0 0 0 0 0 0 1 1 1 1 1 1 1 1 1 1 1 1 1 1 1 1 0
10 0 0 0 0 0 0 1 1 1 0 0 0 0 0 0 0 1 1 1 1 1 1 1 0 10 0 0 0 0 0 0 0 1 1 1 1 1 1 1 1 1 1 1 1 1 1 1 1 0
1 2 3 4 5 6 7 8 9 10 11 12 13 14 15 16 17 18 19 20 21 22 23 24 1 2 3 4 5 6 7 8 9 10 11 12 13 14 15 16 17 18 19 20 21 22 23 24[%] 0 0 0 0 0 0 100 100 100 0 0 0 0 0 0 0 100 100 100 100 100 100 100 0 [%] 0 0 0 0 0 0 0 100 100 100 100 100 100 100 100 100 100 100 100 100 100 100 100 0

Heating and Cooling Research Eurima, BruxellesPhone: +33 (0)1 76 43 12 00
Transsolar Sas11, rue Martel 75010 Paris
Updated Version15 December 2016 46
5. ANNEX II - Boundary Conditions5.7. Schedules - Corridor
SCENARII - OCCUPATION & DOMESTIC EQUIPMENTS & ARTIFICIAL LIGHTING Corridor_Shared areasHall entrance, stairs, floor corridors
All the following schedules are given without Daylight saving time (GMT +1h) source: Enertech Study, 50 apartments in Bordeaux
[%] light_corridor_week [%] light_corridor_weekend100 0 0 0 0 0 0 0 0 0 0 0 0 0 0 0 0 0 0 0 1 1 0 0 0 100 0 0 0 0 0 0 0 0 0 0 0 0 0 0 0 0 0 0 0 0 0 0 0 0
90 0 0 0 0 0 0 0 0 0 0 0 0 0 0 0 0 0 0 0 1 1 0 0 0 90 0 0 0 0 0 0 0 0 0 0 0 0 0 0 0 0 0 0 0 0 0 0 0 0
80 0 0 0 0 0 0 0 0 0 0 0 0 0 0 0 0 0 0 0 1 1 1 0 0 80 0 0 0 0 0 0 0 0 0 0 0 0 0 0 0 0 0 0 0 0 1 1 0 0
70 0 0 0 0 0 0 0 0 0 0 0 0 0 0 0 0 0 0 0 1 1 1 0 0 70 0 0 0 0 0 0 0 0 0 0 0 0 0 0 0 0 0 0 0 0 1 1 0 0
60 0 0 0 0 0 0 0 0 0 0 0 0 0 0 0 0 0 0 0 1 1 1 1 0 60 0 0 0 0 0 0 0 0 0 0 0 0 0 0 0 0 0 0 0 1 1 1 1 0
50 0 0 0 0 0 0 0 1 1 0 0 0 0 0 0 0 0 0 0 1 1 1 1 0 50 0 0 0 0 0 0 0 1 1 0 0 0 0 0 0 0 0 0 0 1 1 1 1 0
40 0 0 0 0 0 0 0 1 1 0 0 0 0 0 0 0 0 0 1 1 1 1 1 1 40 0 0 0 0 0 0 0 1 1 1 1 1 1 1 1 1 1 1 1 1 1 1 1 1
30 0 0 0 0 0 0 0 1 1 0 0 0 0 0 0 0 0 0 1 1 1 1 1 1 30 0 0 0 0 0 0 0 1 1 1 1 1 1 1 1 1 1 1 1 1 1 1 1 1
20 1 0 0 0 0 0 1 1 1 0 0 0 0 0 0 0 0 1 1 1 1 1 1 1 20 1 0 0 0 0 0 1 1 1 1 1 1 1 1 1 1 1 1 1 1 1 1 1 1
10 1 1 1 1 1 1 1 1 1 1 1 1 1 1 1 1 1 1 1 1 1 1 1 1 10 1 1 1 1 1 1 1 1 1 1 1 1 1 1 1 1 1 1 1 1 1 1 1 1
1 2 3 4 5 6 7 8 9 10 11 12 13 14 15 16 17 18 19 20 21 22 23 24 1 2 3 4 5 6 7 8 9 10 11 12 13 14 15 16 17 18 19 20 21 22 23 24[%] 20 10 10 10 10 10 20 50 50 10 10 10 10 10 10 10 10 20 40 100 100 80 60 40 [%] 20 10 10 10 10 10 20 50 50 40 40 40 40 40 40 40 40 40 40 60 80 80 60 40

Heating and Cooling Research Eurima, BruxellesPhone: +33 (0)1 76 43 12 00
Transsolar Sas11, rue Martel 75010 Paris
Updated Version15 December 2016 47
5. ANNEX II - Boundary Conditions5.8. Domestic Hot Water Demand
Boundary conditions for DHW demand
Daily DHW demand per person 50 L/pers/day (source : Recknagel)Outlet Temperature 40 °C out of tap (hot water and cold water mixed)DHW temperature from tank 57.5°C to 62.5°C Domestic Hot Water is produced at roughly 60°C in the plant. It is then mixed with cold water to 40°C to avoid burning
All the following schedules are given without Daylight saving time (GMT +1h)
[%] Daily scenario - workday [%] Daily scenario - weekend50 0 0 0 0 0 0 0 0 0 0 0 0 0 0 0 0 0 0 0 0 0 0 0 0 50 0 0 0 0 0 0 0 0 0 0 0 0 0 0 0 0 0 0 0 0 0 0 0 0
45 0 0 0 0 0 0 0 0 0 0 0 0 0 0 0 0 0 0 0 0 0 0 0 0 45 0 0 0 0 0 0 0 0 0 0 0 0 0 0 0 0 0 0 0 0 0 0 0 0
40 0 0 0 0 0 0 0 0 0 0 0 0 0 0 0 0 0 0 0 0 0 0 0 0 40 0 0 0 0 0 0 0 0 0 0 0 0 0 0 0 0 0 0 0 0 0 0 0 0
35 0 0 0 0 0 0 0 0 0 0 0 0 0 0 0 0 0 0 0 0 0 0 0 0 35 0 0 0 0 0 0 0 0 0 0 0 0 0 0 0 0 0 0 0 0 0 0 0 0
30 0 0 0 0 0 0 0 1 0 0 0 0 0 0 0 0 0 0 0 0 0 0 0 0 30 0 0 0 0 0 0 0 0 0 0 0 0 0 0 0 0 0 0 0 0 0 0 0 0
25 0 0 0 0 0 0 0 1 0 0 0 0 0 0 0 0 0 0 0 0 0 0 0 0 25 0 0 0 0 0 0 0 0 0 0 0 0 0 0 0 0 0 0 0 0 0 0 0 0
20 0 0 0 0 0 0 0 1 1 0 0 0 0 0 0 0 0 0 0 0 0 0 0 0 20 0 0 0 0 0 0 0 0 1 0 0 0 0 0 0 0 0 0 0 0 0 0 0 0
15 0 0 0 0 0 0 0 1 1 0 0 0 0 0 0 0 0 0 0 0 0 0 0 0 15 0 0 0 0 0 0 0 0 1 0 0 0 0 0 0 0 0 0 0 0 0 0 0 0
10 0 0 0 0 0 0 1 1 1 0 0 0 0 0 0 0 0 0 1 1 1 0 0 0 10 0 0 0 0 0 0 0 1 1 1 0 0 1 0 0 0 0 0 1 1 0 0 0 0
5 0 0 0 0 0 0 1 1 1 0 0 0 0 0 0 0 0 1 1 1 1 1 0 0 5 0 0 0 0 0 0 0 1 1 1 1 1 1 1 0 0 0 1 1 1 1 1 0 0
1 2 3 4 5 6 7 8 9 10 11 12 13 14 15 16 17 18 19 20 21 22 23 24 1 2 3 4 5 6 7 8 9 10 11 12 13 14 15 16 17 18 19 20 21 22 23 24[%] 0 0 0 0 0 0 10 30 20 0 0 0 0 0 0 0 0 5 10 10 10 5 0 0 [%] 0 0 0 0 0 0 0 10 20 10 5 5 10 5 0 0 0 5 10 10 5 5 0 0
[%] Monthly scenario140 0 0 0 0 0 0 0 0 0 0 0 1
130 0 0 0 0 0 0 0 0 0 0 0 1
120 1 1 0 0 0 0 0 0 0 0 0 1
110 1 1 1 0 0 0 0 0 0 0 1 1
100 1 1 1 1 1 0 0 0 0 1 1 1
90 1 1 1 1 1 0 0 0 1 1 1 1
80 1 1 1 1 1 1 0 0 1 1 1 1
70 1 1 1 1 1 1 0 0 1 1 1 1
60 1 1 1 1 1 1 0 1 1 1 1 1
50 1 1 1 1 1 1 1 1 1 1 1 1
40 1 1 1 1 1 1 1 1 1 1 1 1
30 1 1 1 1 1 1 1 1 1 1 1 1
20 1 1 1 1 1 1 1 1 1 1 1 1
10 1 1 1 1 1 1 1 1 1 1 1 1
1 2 3 4 5 6 7 8 9 10 11 12[%] 125 120 110 105 100 80 50 60 90 105 115 140
From Xpair websitehttp://conseils.xpair.com/consulter_savoir_faire/eau-chaude-sanitaire-bbc-rt2012/evaluation-besoins-eau-chaude-sanitaire.htm

Heating and Cooling Research Eurima, BruxellesPhone: +33 (0)1 76 43 12 00
Transsolar Sas11, rue Martel 75010 Paris
Updated Version15 December 2016 48
5. ANNEX II - Boundary Conditions5.9. Artificial Ligthing Control
Artificial Lighting control
For the apartmentsArtificial lighting is controlled according to the artificial lighting schedule and according to internal illumance estimated via a mean daylight factor for each apartment. The apartment mean daylight factor will be calculated with a Daylight factor calculation. With this solution, we only use artificial lighting if the schedule is superior than 0, and if natural daylight is not enough to reach the illuminance setpoint
Estimated daylight illuminance = Mean Daylight Factor x Horizontal illuminance on outside groundHorizontal illuminance on outside ground calculated from Solar irradiation on horizontal ground from weather data file.
Artificial lighting is ON if artificial lighting schedule is higher than 1 and estimated daylight illuminance is lower than the set point.
AND
To prevent from turning on or off all the lights in the apartment, a ratio is used to model only a part of them. Area ratio = (Living room + Bedroom) / Whole apartment = [0.7, 0.85] .This ratio modulates the total installed lighting power.
For the corridorsAs the corridors are controled according to occupancy sensors, As most of the corridor area is inside the building, it does not make sense to implement a daylight control here.Thus, we considered occupancy sensors that cut off the light when no movement is detected. To translate that into the model, we simply considered an artifical lighting profile which tries to take into account this phenomena.We used the results from the Enertech study to estimate a similar profile.
Source: Campagne de mesure éclairage : 50 logements dans un immeuble à Bordeaux et parties communes, Enertech, 2005
100% 0 0 0 0 0 0 1 1 1 0 0 0 0 0 0 0 0 0 1 1 1 1 1 0
90% 0 0 0 0 0 0 1 1 1 0 0 0 0 0 0 0 0 0 1 1 1 1 1 0
80% 0 0 0 0 0 0 1 1 1 0 0 0 0 0 0 0 0 0 1 1 1 1 1 0
70% 0 0 0 0 0 0 1 1 1 0 0 0 0 0 0 0 0 0 1 1 1 1 1 0
60% 0 0 0 0 0 0 1 1 1 0 0 0 0 0 0 0 0 0 1 1 1 1 1 0
50% 0 0 0 0 0 0 1 1 1 0 0 0 0 0 0 0 0 0 1 1 1 1 1 0
40% 0 0 0 0 0 0 1 1 1 0 0 0 0 0 0 0 0 0 1 1 1 1 1 0
30% 0 0 0 0 0 0 1 1 1 0 0 0 0 0 0 0 0 0 1 1 1 1 1 0
20% 0 0 0 0 0 0 1 1 1 0 0 0 0 0 0 0 0 0 1 1 1 1 1 0
10% 0 0 0 0 0 0 1 1 1 0 0 0 0 0 0 0 0 0 1 1 1 1 1 0
1 2 3 4 5 6 7 8 9 10 11 12 13 14 15 16 17 18 19 20 21 22 23 24light_apartment_week 0% 0% 0% 0% 0% 0% 100% 100% 100% 0% 0% 0% 0% 0% 0% 0% 0% 0% 100% 100% 100% 100% 100% 0%
100% 0 0 0 0 0 0 1 1 1 1 1 1 1 1 1 1 1 1 1 1 1 1 0 0
90% 0 0 0 0 0 0 1 1 1 1 1 1 1 1 1 1 1 1 1 1 1 1 0 0
80% 0 0 0 0 0 0 1 1 1 1 1 1 1 1 1 1 1 1 1 1 1 1 0 0
70% 0 0 0 0 0 0 1 1 1 1 1 1 1 1 1 1 1 1 1 1 1 1 0 0
60% 0 0 0 0 0 0 1 1 1 1 1 1 1 1 1 1 1 1 1 1 1 1 0 0
50% 0 0 0 0 0 0 1 1 1 1 1 1 1 1 1 1 1 1 1 1 1 1 0 0
40% 0 0 0 0 0 0 1 1 1 1 1 1 1 1 1 1 1 1 1 1 1 1 0 0
30% 0 0 0 0 0 0 1 1 1 1 1 1 1 1 1 1 1 1 1 1 1 1 0 0
20% 0 0 0 0 0 0 1 1 1 1 1 1 1 1 1 1 1 1 1 1 1 1 0 0
10% 0 0 0 0 0 0 1 1 1 1 1 1 1 1 1 1 1 1 1 1 1 1 0 0
1 2 3 4 5 6 7 8 9 10 11 12 13 14 15 16 17 18 19 20 21 22 23 24light_apartment_weekend 0% 0% 0% 0% 0% 0% 100% 100% 100% 100% 100% 100% 100% 100% 100% 100% 100% 100% 100% 100% 100% 100% 0% 0%

Heating and Cooling Research Eurima, BruxellesPhone: +33 (0)1 76 43 12 00
Transsolar Sas11, rue Martel 75010 Paris
Updated Version15 December 2016 49
5. ANNEX II - Boundary Conditions
Setpoint ControlControl over Air Temperature
Control 0 Radiators: No controlNo thermostatic valve on radiators are implemented. As a consequence, the appartment tends to overheat as there is no control on the emitters.This phenomena is translated into TRNSYS as an increase of 2.5°C on the air temperature heating setpoint.As a results, the heating temperature setptoint is set to 23.5°C.
Split Unit for cooling: ThermostatThe cooling device is aiming at 26°C air temperature to which is substracted a margin error of 0.5°C from the thermostat measurement process.As a results, the cooling temperature setptoint is set to 25.5°C during the entire cooling season.
Control 1 Radiators: Night Time reductionNo thermostatic valve on radiators are implemented. As a consequence, the appartment tends to overheat as there is no control on the emitters.This phenomena is translated into TRNSYS as an increase of 2.5°C on the air temperature heating setpoint.Night time setpoint reduction is implemented, which is translated into a 5°C reduction during night time.As a results, the heating temperature setptoint is set to 18.5°C between 22:00 and 06:00, and to 23.5°C otherwise.
Split Unit for cooling: ThermostatThe cooling device is aiming at 26°C air temperature to which is substracted a margin error of 0.5°C from the thermostat measurement process.As a results, the cooling temperature setptoint is set to 25.5°C during the entire cooling season.
Control 2 Radiators: Thermostatic valeThermostatic valve on radiators are implemented. As a consequence, the air temperature inside the appartment is close to the temperature set point.This phenomena is translated into TRNSYS as an increase of 0.5°C on the air temperature heating setpoint, to include a margin error on the thermostat sensor.As a results, the heating temperature setptoint is set to 21.5°C.
Split Unit for cooling: ThermostatThe cooling device is aiming at 26°C air temperature to which is substracted a margin error of 0.5°C from the thermostat measurement process.As a results, the cooling temperature setptoint is set to 25.5°C during the entire cooling season.
Control 3 Radiators: Night Time reduction + Thermostatic valveThermostatic valve on radiators are implemented. As a consequence, the air temperature inside the appartment is close to the temperature set point.This phenomena is translated into TRNSYS as an increase of 0.5°C on the air temperature heating setpoint, to include a margin error on the thermostat sensor.Night time setpoint reduction is implemented, which is translated into a 5°C reduction during night time.As a results, the heating temperature setptoint is set to 16.5°C between 22:00 and 06:00, and to 21.5°C otherwise.
Split Unit for cooling: ThermostatThe cooling device is aiming at 26°C air temperature to which is substracted a margin error of 0.5°C from the thermostat measurement process.As a results, the cooling temperature setptoint is set to 25.5°C during the entire cooling season.
5.10. Space Heating and Space Cooling control

Heating and Cooling Research Eurima, BruxellesPhone: +33 (0)1 76 43 12 00
Transsolar Sas11, rue Martel 75010 Paris
Updated Version15 December 2016 50
5. ANNEX II - Boundary Conditions5.11. Shading and Natural Ventilation Control
Shading Control
Paris & HelsinkiShadings are closed during summer months only (Signal 3), if occupancy is higher than 0 (Signal 2), and if solar irradiation on façade is higher than 150 W/m² (Signal 1)
And And
NapoliDuring summer months, shading are closed during the day (Signal 3). During Winter and Shoulder Season, they ca be closed if occupancy is higher than 0 (Signal) and solar irradiation on façade is higher than 150 W/m² (Signal 1)
AndOr
Natural Ventilation ControlAir change rate 5 vol/h (standard value based on internal Transsolar measurements for one-sided window ventilation)
Paris, Helsinki & NapoliDuring occupation (Signal 2), natural ventilation is on if outdoor temperature is lower than 23°C (Signal 1) and room temperature is higher than 23°C (hysteresis, Signal 3)
And And
ON
OFF
ON
OFF
ON
OFF
ON
OFF
ON
OFF
ON
OFF
ON
OFF

Heating and Cooling Research Eurima, BruxellesPhone: +33 (0)1 76 43 12 00
Transsolar Sas11, rue Martel 75010 Paris
Updated Version15 December 2016 51
5. ANNEX II - Boundary Conditions5.12. Envelope Typologies 1
ENVELOPEDefinition of PerfomanceEXCELLENT
GOOD
MEDIUM
LOW
Components Perfomance Unit Value Value Value Parameters Unit EXCELLENT U (W/m²K) 0.29 0.20 0.12GOOD U (W/m²K) 0.38 0.26 0.20 LOW U (W/m²K) 2.75 1.52 0.93
EXCELLENT U (W/m²K) 0.15 0.14 0.10Albedo / reflexion coefficient 0.30 0.30 0.30
GOOD U (W/m²K) 0.36 0.20 0.14Albedo / reflexion coefficient 0.30 0.30 0.30
LOW U (W/m²K) 4.41 2.35 0.90Albedo / reflexion coefficient 0.30 0.30 0.30
EXCELLENT U (W/m²K) 0.36 0.18 0.14GOOD U (W/m²K) 0.40 0.32 0.26 LOW U (W/m²K) 3.37 2.02 0.90
W/m²K
it represents the most stringent Regulations envisioning the perfomance that the envelope would have in 2020. it has been based and adjusted considering the values suggested by the "Passivhaus standard" and modified considering the recent Regulation for Spain and Finland and the products available on the market.it represents the actual Legislation available in Europe and consequently the values the new buildings need to comply with. It has been rated considering the latest German Regulation "ENEV 2016" , the French Regulation RT 2012, the Italian Regulation "DECRETO 26 giugno 2015" and the Finland one.it represents the existing building stock. The values have been based and adjusted considering the Regulation in France RT2000 and RT existant and our knowledge related to the building stock of the years 2000 -2010it represents the old building stock before the introduction of the Regulation for the energy efficiency of the building. It has been based and adjusted considering different studies developed by the IEA (International Energy Agency) and our knowledge.
There are no considerations about the construction systems here (only thermal performances). As an example, internal or external insulation are not defined here (but are defined in the economic assessment)This assumption is correct because thermal mass is brought to the building by the floors and the
WALL
Glossary
Description
U roof W/m²Kthe amount of heat flowing in one second through a 1 m² of area of a building component subject to a temperature difference of 1K. It is calculated considering the Internal and External Heat Transert Resistance with the heat flowing upwards.
ROOF
U wall W/m²Kthe amount of heat flowing in one second through a 1 m² of area of a building component subject to a temperature difference of 1K. It is calculated considering the Internal and External Heat Transert Resistance with the heat flowing horizontally.
CLIMATEWarm
(Naples)Temperate
(Paris)Cold
(Helsinki)
FLOORthe amount of heat flowing in one second through a 1 m² of area of a building component subject to a temperature difference of 1K. It is calculated considering the Internal and External Heat Transert Resistance with the heat flowing downards.
U floor

Heating and Cooling Research Eurima, BruxellesPhone: +33 (0)1 76 43 12 00
Transsolar Sas11, rue Martel 75010 Paris
Updated Version15 December 2016 52
5. ANNEX II - Boundary Conditions5.13. Envelope Typologies 2
Components Perfomance Unit Value Value Value Parameters Unit EXCELLENT Ug (W/m²K) 0.99 0.81 0.61
Uw (W/m²K) 1.3 1.10 0.9g tot (glazing + moveable solar protection)
0.07 0.09 0.09
gvalue (only glazing) 0.26 0.3 0.5visual transmittance VT 0.43 0.42 0.7
GOOD Ug (W/m²K) 1.27 1.07 1.08Uw (W/m²K) 1.8 1.5 1.3g tot (glazing + moveable solar protection)
0.15 0.15 0.15
gvalue (only glazing) 0.33 0.53 0.65visual transmittance VT 0.41 0.7 0.77
LOW Ug (W/m²K) 5.62 5.62 2.58Uw (W/m²K) 5.8 5.8 2.7g tot (glazing + moveable solar protection)
0.3 0.5 0.5
gvalue (only glazing) 0.89 0.89 0.64visual transmittance VT 0.87 0.87 0.65
EXCELLENT n50 (ach) 0.6 0.6 0.6GOOD n50 (ach) 1.5 1.5 1.5 LOW n50 (ach) 6 6 6
EXCELLENT delta U (W/m²K) 0.05 0.05 0.05GOOD delta U (W/m²K) 0.15 0.1 0.1 LOW delta U (W/m²K) >0.2 >0.2 >0.2
EXCELLENT efficiency 80% 84% 88%electric power consumption (Wh/m³) 0.37 0.45 0.45
GOOD efficiency 0% 0% 80%electric power consumption (Wh/m³) 0.20 0.20 0.45
LOW efficiency 0% 0% 0%electric power consumption (Wh/m³) 0.25 0.25 0.25
Ug W/m²Kthe amount of heat flowing in one second through a 1 m² of area of a transparent component subject to a temperature difference of 1K. It is fonction of the emissivity of the coatings, distance between panes and type of filling.
g tot (glazing and solar protection)
Uw W/m²Kthe amount of heat flowing in one second trhough a 1 m² of window component. It combines the thermal trasmittance of the glazing and the frame as well as the linear thermal transmittance from the glass edge.
CLIMATEWarm
(Naples)Temperate
(Paris)Cold
(Helsinki)
Albedo Reflexion Coefficient
%the ratio of the reflected radiation to incident one. It can be measured in a scale from zero for no reflection (all radiation is absorbed by a black surface) to 1 for perfect reflection (all radiation is reflected by a white surface)
Glossary
Description
AIR TIGHTNESS
THERMAL BRIDGE CORR.
VENTILATION
WINDOWS
Air tightness
Thermal Bridge Correction
visual transmittance
Electric Power Consumption
Efficiencyit represents the process of exchanging the energy contained in the exhausted air using it to pre treat the incoming outdoor air. It represents the percentage of heat that could be recovered.
it represents the total amount of visible light passing through the transparent component.%
Wh/m²
% it represents the total amount of energy transmittance reduced by the reduction factor of the solar screening.
%
n50 (ach)
it represents the Air - Leakage through 1 m² of envelope per hour. It is measured at 50 Pascals diffrential pressure.
W/m²K
it represents the value that will be added to the U of building component in order to take into account the correction of the thermal bridge. The thermal bridge represents a higher heat flow through the envelope due to a discontinuity of the insulation.It considers a deterioration of the envelope of respectively 15% and 30% or even
it represents the average power consumption of the device including regulation

Heating and Cooling Research Eurima, BruxellesPhone: +33 (0)1 76 43 12 00
Transsolar Sas11, rue Martel 75010 Paris
Updated Version15 December 2016 53
5. ANNEX II - Boundary Conditions5.14. Plant Typologies 1
PLANT MODELING
Summary
Heating CoolingProduction Distribution Production & DistributionLow Efficiency Gas Boiler 80°C/60°C temperature regime Decentralized Low Efficiency Split unitHigh Efficiency Gas Boiler 50°C/30°C temperature regime Decentralized High Efficiency Split unit
NB : for the Helsinki climate, no cooling system will be implemented.
Gas Boiler - Low Efficiency Gas BoilerBurner 1 stage burnerRated efficiency (80°C/60°C) 90%Efficiency 30% Load -Standby losses 1.50%Ambient losses 2%Primary loop T°C control constant temperature 90°CSecondary loop T°C control heating curve according to outside temperature
DistributionSecondary loop No thermal losses to prevent from lowering the performance of controls
Secondary loop is located in the heated volume so all the heat losses could be considered as internal gains.Primary loop 3 cm insulation (lambda = 0.04W/mK) for pipes
Diameters depending on massflow rates, dimensionned via nomograms from GILPRI tubesFlow speed : 0.8m/s
A tank storage is implemented between boiler and primary loop.This buffer tank helps to reduce the ON/OFF boiler cycling and solve some TRNSYS convergence issues related to these cycles.
Cooling with decentralized Split Units - Base variant
Decentralized Low Efficiency Split unitEER 1.9SEER 2.7

Heating and Cooling Research Eurima, BruxellesPhone: +33 (0)1 76 43 12 00
Transsolar Sas11, rue Martel 75010 Paris
Updated Version15 December 2016 54
5. ANNEX II - Boundary Conditions5.15. Plant typologies 2
Gas Boiler - High Efficiency Gas Condensation BoilerBurner Moduling 10%-100% BurnerRated efficiency (80°C/60°C) 97.5%Efficiency 30% Load 108.5%Standby losses 0.10%Ambient losses 1.0%Primary loop temperature controlconstant temperature 85°CSecondary loop temperature controlheating curve according to outside temperature
DistributionSecondary loop No thermal losses to prevent from lowering the performance of controls
Secondary loop is located in the heated volume so all the heat losses could be considered as internal gains.Primary loop 3 cm insulation (lambda = 0.04W/mK) for pipes
Diameters depending on massflow rates, dimensionned via nomograms from GILPRI tubesFlow speed : 0.8m/s
No convergence issues, the boiler burner is adapting itself to network load.Condensing boiler is modeled as a classic boiler with an efficiency calculated as a function of return water temperature and load.Efficiency can then be higher than 100%, when calculated with HHV.
Cooling with decentralized Split Units - Improved
Decentralized High Efficiency Split unitEER 3.5SEER 5.7

Heating and Cooling Research Eurima, BruxellesPhone: +33 (0)1 76 43 12 00
Transsolar Sas11, rue Martel 75010 Paris
Updated Version15 December 2016 55
5. ANNEX II - Boundary Conditions5.16. Plant typologies 3
Air to Water Heat Pump + Old Boiler for DHW and temperatures below 7°C
Air to Water Heat PumpHeat Pump COP 2.99 (45°C/40°C regime with 7°C outside air temperature)Bivalent temperature 7 °CGas Boiler - Low Efficiency Gas BoilerBurner 1 stage burnerRated efficiency (80°C/60°C) 90%Efficiency 30% Load -Standby losses 1.50%Ambient losses 2%Primary loop T°C control constant temperature 90°CSecondary loop T°C control heating curve according to outside temperature
Primary loop temperature control heating curve according to outside temperatureSecondary loop temperature control heating curve according to outside temperature
Cooling with decentralized Split Units - Improved
Decentralized High Efficiency Split unitEER 3.5SEER 5.7

Heating and Cooling Research Eurima, BruxellesPhone: +33 (0)1 76 43 12 00
Transsolar Sas11, rue Martel 75010 Paris
Updated Version15 December 2016 56
5. ANNEX II - Boundary Conditions5.17. Plant typologies 4
Air to Water Heat Pump + Old Boiler for DHW only
Air to Water Heat PumpHeat Pump COP 2.99 (45°C/40°C regime with 7°C outside air temperature)Bivalent temperature No bivalenceGas Boiler - Low Efficiency Gas BoilerBurner 1 stage burnerRated efficiency (80°C/60°C) 90%Efficiency 30% Load -Standby losses 1.50%Ambient losses 2%Primary loop T°C control constant temperature 90°CSecondary loop T°C control heating curve according to outside temperature
Primary loop temperature control heating curve according to outside temperatureSecondary loop temperature control heating curve according to outside temperature
Cooling with decentralized Split Units - Improved
Decentralized High Efficiency Split unitEER 3.5SEER 5.7

Heating and Cooling Research Eurima, BruxellesPhone: +33 (0)1 76 43 12 00
Transsolar Sas11, rue Martel 75010 Paris
Updated Version15 December 2016 57
5. ANNEX II - Boundary Conditions5.18. Plant typologies 5
Air to Water Heat Pump + Heat Pump Storage Water Heater with additional electrical resistance for DHW
Air to Water Heat PumpHeat Pump COP 4 (35°C/30°C regime with 7°C outside air temperature)Heat Pump COP DHW 2.5 (7°C/55°C regime with 7°C outside air temperature)
Primary loop temperature control heating curve according to outside temperatureSecondary loop temperature control heating curve according to outside temperature
Cooling with decentralized Split Units - Improved
Decentralized High Efficiency Split unitEER 3.5SEER 5.7

Heating and Cooling Research Eurima, BruxellesPhone: +33 (0)1 76 43 12 00
Transsolar Sas11, rue Martel 75010 Paris
Updated Version15 December 2016 58
6. ANNEX III: Tribu Energie Report
Siège social : 60 rue du Faubourg Poissonnière - 75010 Paris – Tel : 01 43 15 00 06 - courriel : [email protected] Agence de Rennes : 12 quai Duguay Trouin - 35000 Rennes – Tel : 09 52 80 87 43 – courriel : [email protected]
Agence de Lyon : 102 rue Masséna - 69006 Lyon – Tel : 04 78 52 68 66 – courriel : [email protected] Fax : 01 45 23 32 40 / web : www.tribu-energie.fr
s as au capital de 100 000 € ape 7112B rcs paris b 440 306 173
1
Membre des réseaux Membre fondateur de Qualification :
Eurima Study report
Project director Nathalie Tchang Date 2017-01-02
Project manager - Report reference ET16-105 Version 6
Project engineer Nicolas Desmars Phase - Diffusion EURIMA
Heating and Cooling Research Economic study
Eurima economic study – 2017-01-02 2
Report monitoring
File name File date Version number
Modifications
TE-160729-ND-16-105-Eurima economic study 29 July 2016 1 /
TE-160823-NDNT-16-105-Eurima economic study 23 August 2016 2
Integration of Finland and Italy cases
Wording and page setting
modifications
TE-161010-NDNT-16-105-Eurima economic study 10 October 2016 3
Deletion of the internal wall insulation case (1bis)
No investment in split
units in case 2 bis
Integration of heat pump cases
Results per m²
TE-161013-NDNT-16-105-Eurima economic study 13 October 2016 4
Investment in split units in case 1 ter
Wording and page setting
modifications
TE-161026-NDNT-16-105-Eurima economic study 26 October 2016 5
Modification of the electrical final energy consumptions (taken
from the latest version of the Transsolar study)
Wording modifications
TE-170102-NDNT-16-105-Eurima economic study 2 January 2017 6 Wording modifications

Heating and Cooling Research Eurima, BruxellesPhone: +33 (0)1 76 43 12 00
Transsolar Sas11, rue Martel 75010 Paris
Updated Version15 December 2016 59
Eurima economic study – 2017-01-02 3
Table of contents
1 Introduction ......................................................................................................................................................... 4
1.1 Background and content of the study ......................................................................................................... 4
1.2 Methodology ................................................................................................................................................ 5
2 Detailed Results – France (Paris) .......................................................................................................................... 6
2.1 “Boiler only” replacement scenario ............................................................................................................. 7
2.2 Global plant refurbishment scenario ......................................................................................................... 10
3 Overview: climate comparison .......................................................................................................................... 13
3.1 With a 2%/year energy price increase ....................................................................................................... 13
3.2 With a 4%/year energy price increase ....................................................................................................... 14
4 Conclusions: key messages ................................................................................................................................ 15
5 Annex: economic hypothesis and references .................................................................................................... 16
5.1 Energy costs ............................................................................................................................................... 16
5.2 Maintenance costs ..................................................................................................................................... 16
5.3 Improvement costs .................................................................................................................................... 17
Eurima economic study – 2017-01-02 4
1 Introduction 1.1 Background and content of the study
The Energy Performance of Building Directives (EPBD) revision causes an increased competition between active and passive technologies. In order to raise the understanding of the respective contribution of both technologies, a detailed thermal study has been fulfilled by Transsolar. The aim of this economic study is to complete Transsolar’s study in order to figure out the economic impacts of different improvement potentials of the renovation of a building. The analysis covers energy costs, investment costs and maintenance costs over a 50 years span. The costs engendered by different levels of energy efficiency improvements have been calculated for different cases in three European countries.
The following improvement cases have been studied:
Base case (economic)
Low envelope Night time reduction Old boiler - 1 speed burner Plant sized following the low envelope demand Split unit for cooling (low efficiency)
Case 1
Low envelope Night time reduction, thermostat on radiators Old boiler - 1 speed burner Plant sized following the low envelope demand Split unit for cooling (low efficiency)
Case 1 bis (economic)
Good envelope Night time reduction Old boiler - 1 speed burner Plant sized following the low envelope demand Split unit for cooling (low efficiency)
Case 1 ter (economic)
Low envelope Night time reduction New condensing boiler - modulating burner Plant sized following the low envelope demand Split unit for cooling (high efficiency)
Case 1 ter HP (economic)
Low envelope Night time reduction Old boiler - 1 speed burner Heat pump Split unit for cooling (high efficiency)
Case 2
Good envelope Night time reduction, thermostat on radiators New condensing boiler - modulating burner Plant sized following the good envelope demand Split unit for cooling (low efficiency)
Case 2 HP
Good envelope Night time reduction, thermostat on radiators Heat pumps (heating and domestic hot water) Split unit for cooling (low efficiency)
Case 2 bis
Good envelope Night time reduction New condensing boiler - modulating burner Plant sized following the good envelope demand Split unit for cooling (low efficiency)
Case 2 ter
Good envelope Night time reduction, thermostat on radiators New condensing boiler - modulating burner Plant sized following the low envelope demand Split unit for cooling (high efficiency)

Heating and Cooling Research Eurima, BruxellesPhone: +33 (0)1 76 43 12 00
Transsolar Sas11, rue Martel 75010 Paris
Updated Version15 December 2016 60
Eurima economic study – 2017-01-02 5
Case 2 ter HP
Good envelope Night time reduction, thermostat on radiators New condensing boiler - modulating burner Heat pump Split unit for cooling (high efficiency)
Case 3
Excellent envelope Night time reduction, thermostat on radiators New condensing boiler - modulating burner Plant sized following the excellent envelope demand Split unit for cooling (high efficiency)
Two scenarios have been studied, in order to take into account two different possibilities for the cases which include the “New condensing boiler – modulating burner” or “heat pump” improvement:
only the replacement of the boiler (or heat pump) ; replacement of the boiler (or heat pump) and global plant refurbishment (replacement and insulation of the
pipes, replacement of the heating and hot water pumps and valves).
The following countries/climates have been studied:
France (Paris) – detailed study ; Finland (Helsinki) ; Italy (Napoli).
1.2 Methodology
The climates and cases detailed above are based on the technical results and hypothesis of the Transsolar study:
This economic study has selected the most representative cases. Transsolar has given us results for this specific case that does not appear in the technical report: night time reduction is “ON” for all the cases of the economic study (because a low envelope building with no night time reduction isn’t realistic).
The final energy consumptions taken to calculate the annual energy costs come from the Transsolar study. The improvement works and maintenance costs are based on average prices in France and have been adapted for the other European countries by using official European statistics. The sources of the hypothesis taken for the determining of the costs for each country (energy, maintenance, improvement works) are detailed in the Annex of this report.
Eurima economic study – 2017-01-02 6
2 Detailed Results – France (Paris)
The Transsolar study includes several cases with the replacement of the old boiler by a new condensing boiler (and/or a heat pump). This replacement is in reality often combined with a global plant refurbishment (replacement and insulation of the pipes, replacement of the heating and hot water pumps and valves).
This is why in order to be more realistic, two scenarios have been studied:
“Boiler only” replacement scenario ; Global plant refurbishment scenario.
On the graphs, the influence of the lifespan of the new systems (cases 1 to 3) has been taken into account. The new systems are replaced every 23 years (average new system lifespan). This can be viewed on the following graphs.

Heating and Cooling Research Eurima, BruxellesPhone: +33 (0)1 76 43 12 00
Transsolar Sas11, rue Martel 75010 Paris
Updated Version15 December 2016 61
Eurima economic study – 2017-01-02 7
2.1 “Boiler only” replacement scenario
Final energy consumption (kWhFE/m²/y) Improvement cost
(€/m² including taxes) Annual operating cost
(€/m² including taxes/y) Percentage gain on operating costs (%)
Return on investment with a 2%/y energy price
increase (y)
Return on investment with a 4%/y energy price
increase (y)
Annual energy cost - year 1 - (€/m² including
taxes/y)
Annual maintenance cost - year 1 - (€/m² including
taxes/y)
Maintenance cost percentage on total
operating costs - year 1 - (%) Gas Electricity
Base case (technical)
Low envelope No control Old boiler - 1 speed burner Plant sized following the low envelope demand Split unit for cooling (low efficiency)
419 36 - 27 - - - 26 1 4%
Base case (economic)
Low envelope Night time reduction Old boiler - 1 speed burner Plant sized following the low envelope demand Split unit for cooling (low efficiency)
375 33 - 26 - - - 25 1 4%
Case 1
Low envelope Night time reduction, thermostat on radiators Old boiler - 1 speed burner Plant sized following the low envelope demand Split unit for cooling (low efficiency)
313 31 3 23 13% 1 1 21 1 5%
Case 1 bis (economic)
Good envelope Night time reduction Old boiler - 1 speed burner Plant sized following the low envelope demand Split unit for cooling (low efficiency)
139 23 328 12 52% 21 18 11 1 11%
Case 1 ter (economic)
Low envelope Night time reduction New condensing boiler - modulating burner Plant sized following the low envelope demand Split unit for cooling (high efficiency)
292 33 61 22 15% 13 12 21 1 5%
Case 1 ter HP
(economic)
Low envelope Night time reduction Old boiler - 1 speed burner Heat pump Split unit for cooling (high efficiency)
221 68 101 25 5% More than 50 43 23 2 7%
Case 2
Good envelope Night time reduction, thermostat on radiators New condensing boiler - modulating burner Plant sized following the good envelope demand Split unit for cooling (low efficiency)
70 20 385 8 68% 19 17 7 1 17%
Case 2 HP
Good envelope Night time reduction, thermostat on radiators Heat pumps (heating and domestic hot water) Split unit for cooling (low efficiency)
0 45 443 10 61% 27 19 7 3 26%
Case 2 bis
Good envelope Night time reduction New condensing boiler - modulating burner Plant sized following the good envelope demand Split unit for cooling (low efficiency)
86 21 339 9 67% 17 15 8 1 7%
Case 2 ter
Good envelope Night time reduction, thermostat on radiators New condensing boiler - modulating burner Plant sized following the low envelope demand Split unit for cooling (high efficiency)
71 20 392 9 67% 19 16 7 1 17%
Case 2 ter HP
Good envelope Night time reduction, thermostat on radiators New condensing boiler - modulating burner Heat pump Split unit for cooling (high efficiency)
38 40 450 11 58% 28 20 9 2 21%
Case 3
Excellent envelope Night time reduction, thermostat on radiators New condensing boiler - modulating burner Plant sized following the excellent envelope demand Split unit for cooling (high efficiency)
26 21 432 6 76% 17 16 5 1 23%
Cases 1 and 1 ter only include the replacement of components of the heating system. The investment costs for these cases are low. However, the reduction of the final energy consumption and therefore of the operating costs is limited (13% and 15%). Consequently, these improvement works are economically attractive in the short term (the return on investment is under 13 years), but less interesting on the long term (because of the low gain on operating costs). Case 1 bis only includes the improvement of the envelope. The investment cost for this case is high, but the reduction of the final energy consumption and therefore of the operating costs is also high (52%). As a result, these improvement works are economically attractive as a medium and long term investment (the return on investment goes from 18 to 21 years) due to the high gain on operating costs. Cases 2, 2 bis and 2 ter include both envelope and system improvements. As for case 1 bis, the investment cost for these cases is high, but the reduction of the final energy consumption and therefore of the operating costs is also high (67% and 68%). As a result, these improvement works are economically attractive as medium and long term investments (the return on investment goes from 15 to 19 years) due to the high gain on operating costs. Case 3 is similar to cases 2, 2 bis, and 2 ter but even more attractive in the long term. The improvement costs are the highest among all the cases, but the gain on operating costs is the best within these cases. Heat pump cases (1 ter HP, 2 HP and 2 ter HP) are not economically attractive (compared to similar cases with the new condensing boiler) because heat pump investment costs are higher than new boiler ones, and because of the high electricity and maintenance prices.

Heating and Cooling Research Eurima, BruxellesPhone: +33 (0)1 76 43 12 00
Transsolar Sas11, rue Martel 75010 Paris
Updated Version15 December 2016 62
Eurima economic study – 2017-01-02 8
0
500
1000
1500
2000
2500
1 2 3 4 5 6 7 8 9 10 11 12 13 14 15 16 17 18 19 20 21 22 23 24 25 26 27 28 29 30 31 32 33 34 35 36 37 38 39 40 41 42 43 44 45 46 47 48 49 50
Ove
rall
cost
(€/m
² inc
ludi
ng ta
xes)
Year
France (Paris) - Overall cost (improvement + annual operating) on a 50 year period for each case - 2%/year energy price increase
Base case(economic)
Case 1
Case 1 bis(economic)
Case 1 ter(economic)
Case 1 ter HP(economic)
Case 2
Case 2 bis
Case 2 HP
Case 2 ter
Case 2 ter HP
Case 3
Theses curves show the overall cost for each case considering a 2% energy cost increase per year (low estimation). These overall cost curves reveal three different main trends depending on the case. The first trend is the base case, which is the case with the highest slope (it has high operative costs: 26 €/m²/y because no improvement works have been done). It is the worst economic case in the medium and long term. The second group of curves contains cases 1 and 1 ter, that only include the replacement of components of the heating system. These cases are very similar and their slope is high (they have high operative costs: 22 to 23 €/m²/y because the gain on final energy consumptions due to the improvements is low). These cases are attractive in the short term (less than 20 year), but become unattractive in the long term (more than 25/30 years). The third group of curves contains cases 1 bis, 2, 2bis, 2 ter and 3. Their common trait is that they all include the improvement of the building envelope. Their slope is low (they have low operative costs: 6 to 12 €/m²/y because the gain on final energy consumptions due to the improvements – in particular the envelope insulation - is high). These cases are expensive in the short term (less than 15/20 years) because of the high investment costs, but become attractive in the medium term (20/25 years) and very attractive in the long term (more than 25 years). The only way of reducing significantly the operating and the global costs in the medium and long term is to make envelope insulation improvements. Adding performant heating and cooling systems enables to be even more economically attractive only if the building has a good or excellent envelope insulation. Heat pump cases (1 ter HP, 2 HP and 2 ter HP) are not economically attractive (compared to similar cases with the new condensing boiler) because heat pump investment costs are higher than new boiler ones, and because of the high electricity and maintenance prices.
New system replacement
New system replacement
*annual energy / maintenance cost (year 1 - €/m² including charges)

Heating and Cooling Research Eurima, BruxellesPhone: +33 (0)1 76 43 12 00
Transsolar Sas11, rue Martel 75010 Paris
Updated Version15 December 2016 63
Eurima economic study – 2017-01-02 9
0
500
1000
1500
2000
2500
3000
3500
4000
4500
1 2 3 4 5 6 7 8 9 10 11 12 13 14 15 16 17 18 19 20 21 22 23 24 25 26 27 28 29 30 31 32 33 34 35 36 37 38 39 40 41 42 43 44 45 46 47 48 49 50
Ove
rall
cost
(€/m
² inc
ludi
ng ta
xes)
Year
France (Paris) - Overall cost (improvement + annual operating) on a 50 year period for each case - 4%/year energy price increase
Base case(economic)
Case 1
Case 1 bis(economic)
Case 1 ter(economic)
Case 1 ter HP(economic)
Case 2
Case 2 bis
Case 2 HP
Case 2 ter
Case 2 ter HP
Case 3
Theses curves show the overall cost for each case considering a 4% energy cost increase per year (high estimation). Compared with the previous “2% energy cost increase” graph, the main difference is the wider gap of the overall cost (which is noticeable especially in the long term) between the most energy efficient cases (1 bis, 2, 2 HP, 2 bis, 2 ter, 2 ter HP, 3) and the less energy efficient cases (base, 1, 1 ter, 1 ter HP). The returns on investment are also shorter than with a 2% energy cost increase. In this graph, base case and case 1 ter HP are clearly the worst economic cases in the long term: base case because of its high energy consumptions, case 1 ter HP because of its high investment costs combined with quite high energy consumptions. Case 2 HP and case 2 ter HP become economically similar to case 1 bis in the long term, because the advantage of having lower energy consumptions in a high increase of energy prices scenario counterbalances the high investment cost of the heat pumps. Case 3 clearly is the best economic case in the long term due to its low energy consumptions.
New system replacement
New system replacement
*annual energy / maintenance cost (year 1 - €/m² including charges) these costs (year 1) are the same than for the 2% energy cost increase graph

Heating and Cooling Research Eurima, BruxellesPhone: +33 (0)1 76 43 12 00
Transsolar Sas11, rue Martel 75010 Paris
Updated Version15 December 2016 64
Eurima economic study – 2017-01-02 10
2.2 Global plant refurbishment scenario
Final energy consumption (kWhFE/m²/y)
Improvement cost (€/m² including taxes)
Annual operating cost (€/m² including taxes/y)
Percentage gain on operating costs (%)
Return on investment with a 2%/y energy price
increase (y)
Return on investment with a 4%/y energy price
increase (y)
Annual energy cost - year 1 - (€/m² including
taxes/y)
Annual maintenance cost - year 1 - (€/m² including
taxes/y)
Maintenance cost percentage on total
operating costs - year 1 - (%) Gas Electricity
Base case (technical)
Low envelope No control Old boiler - 1 speed burner Plant sized following the low envelope demand Split unit for cooling (low efficiency)
419 36 - 27 - - - 26 1 4%
Base case (economic)
Low envelope Night time reduction Old boiler - 1 speed burner Plant sized following the low envelope demand Split unit for cooling (low efficiency)
375 33 - 26 - - - 25 1 4%
Case 1
Low envelope Night time reduction, thermostat on radiators Old boiler - 1 speed burner Plant sized following the low envelope demand Split unit for cooling (low efficiency)
313 31 3 23 13% 1 1 21 1 5%
Case 1 bis (economic)
Good envelope Night time reduction Old boiler - 1 speed burner Plant sized following the low envelope demand Split unit for cooling (low efficiency)
139 23 328 12 52% 20 17 11 1 11%
Case 1 ter (economic)
Low envelope Night time reduction New condensing boiler - modulating burner Plant sized following the low envelope demand Split unit for cooling (high efficiency)
292 33 68 22 15% 14 12 21 1 5%
Case 1 ter HP
(economic)
Low envelope Night time reduction Old boiler - 1 speed burner Heat pump Split unit for cooling (high efficiency)
221 68 108 25 5% More than 50 44 23 2 7%
Case 2
Good envelope Night time reduction, thermostat on radiators New condensing boiler - modulating burner Plant sized following the good envelope demand Split unit for cooling (low efficiency)
70 20 392 8 68% 19 17 7 1 17%
Case 2 HP
Good envelope Night time reduction, thermostat on radiators Heat pumps (heating and domestic hot water) Split unit for cooling (low efficiency)
0 45 450 10 61% 27 19 7 3 26%
Case 2 bis
Good envelope Night time reduction New condensing boiler - modulating burner Plant sized following the good envelope demand Split unit for cooling (low efficiency)
86 21 346 9 67% 17 15 8 1 7%
Case 2 ter
Good envelope Night time reduction, thermostat on radiators New condensing boiler - modulating burner Plant sized following the low envelope demand Split unit for cooling (high efficiency)
71 20 399 9 67% 19 17 7 1 17%
Case 2 ter HP
Good envelope Night time reduction, thermostat on radiators New condensing boiler - modulating burner Heat pump Split unit for cooling (high efficiency)
38 40 464 11 58% 29 20 9 2 21%
Case 3
Excellent envelope Night time reduction, thermostat on radiators New condensing boiler - modulating burner Plant sized following the excellent envelope demand Split unit for cooling (high efficiency)
26 21 440 6 76% 19 16 5 1 23%
This “global plant refurbishment scenario” table is similar to the “boiler only replacement scenario” table (page 7). The improvement cost of the cases that include the replacement of the old boiler is perceptibly higher, but this has no significant impact on the global trend of the results.

Heating and Cooling Research Eurima, BruxellesPhone: +33 (0)1 76 43 12 00
Transsolar Sas11, rue Martel 75010 Paris
Updated Version15 December 2016 65
Eurima economic study – 2017-01-02 11
0
500
1000
1500
2000
2500
1 2 3 4 5 6 7 8 9 10 11 12 13 14 15 16 17 18 19 20 21 22 23 24 25 26 27 28 29 30 31 32 33 34 35 36 37 38 39 40 41 42 43 44 45 46 47 48 49 50
Ove
rall
cost
(€/m
² inc
ludi
ng ta
xes)
Year
France (Paris) - Overall cost (improvement + annual operating) on a 50 year period for each case - 2%/year energy price increase
Base case(economic)
Case 1
Case 1 bis(economic)
Case 1 ter(economic)
Case 1 ter HP(economic)
Case 2
Case 2 bis
Case 2 HP
Case 2 ter
Case 2 ter HP
Case 3
New system replacement
New system replacement
*annual energy / maintenance cost (year 1 - €/m² including charges)
This “global plant refurbishment scenario” graph is similar to the “boiler only replacement scenario” graph (page 8). The plant refurbishment investment cost has no significant impact on the global trend and the overall costs results.
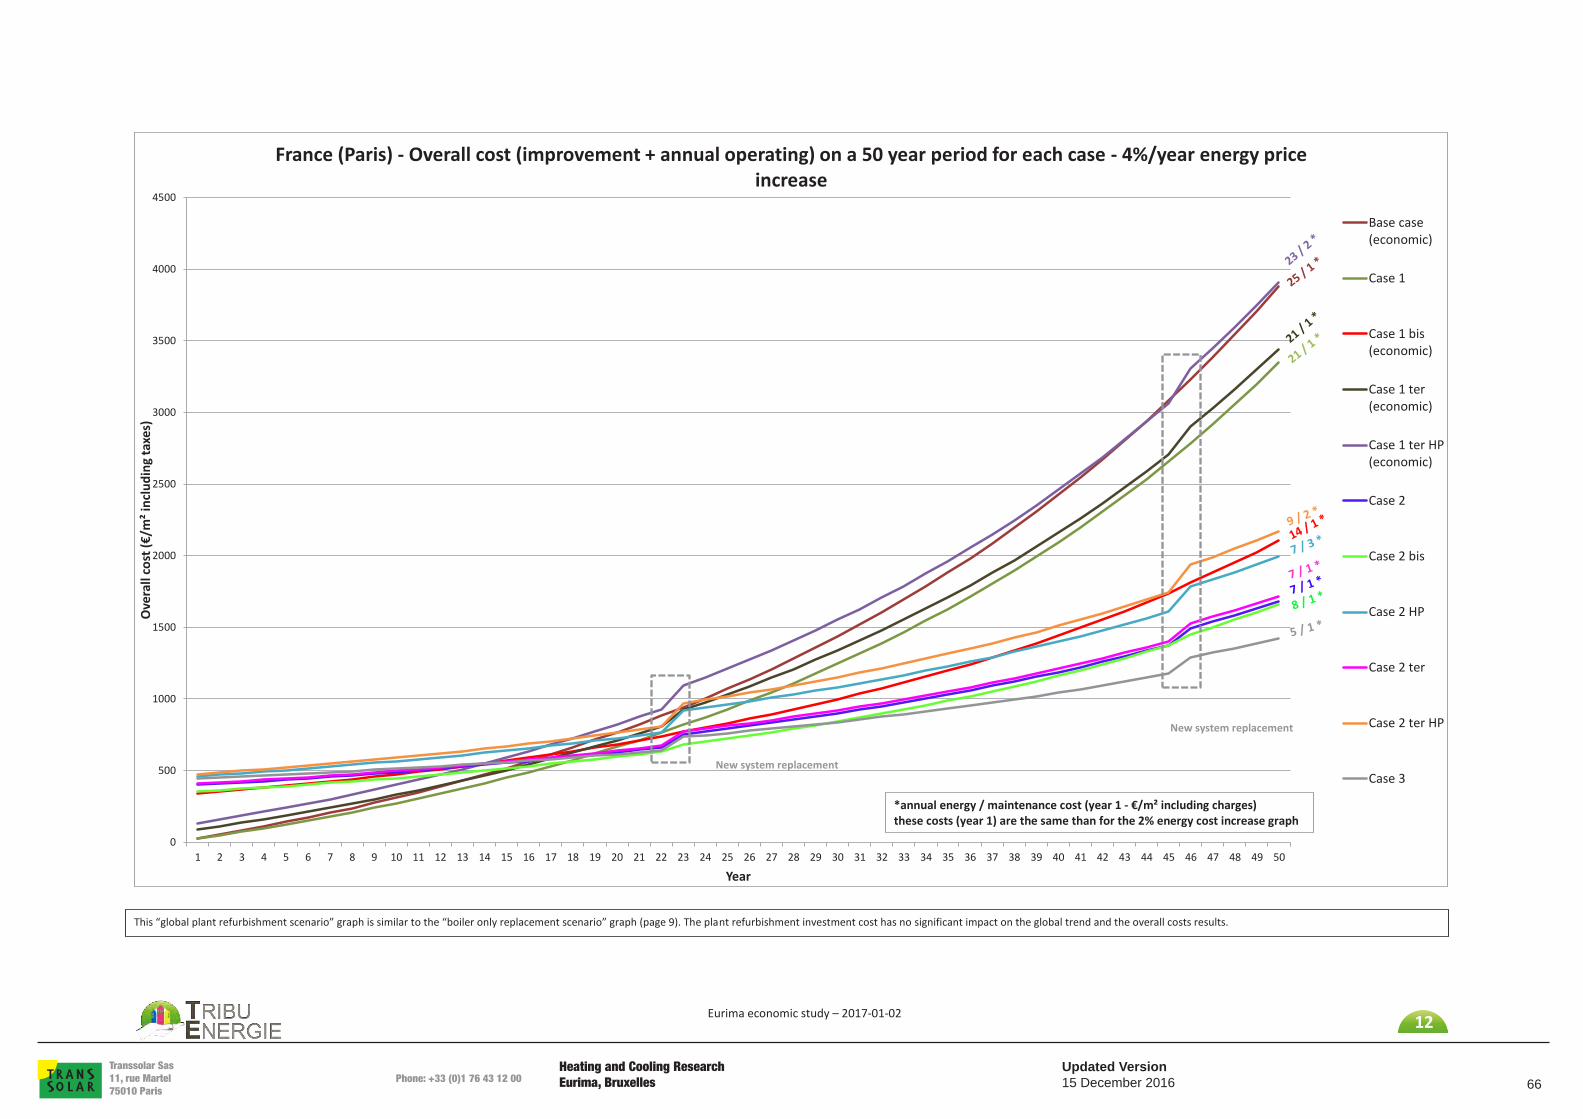
Heating and Cooling Research Eurima, BruxellesPhone: +33 (0)1 76 43 12 00
Transsolar Sas11, rue Martel 75010 Paris
Updated Version15 December 2016 66
Eurima economic study – 2017-01-02 12
0
500
1000
1500
2000
2500
3000
3500
4000
4500
1 2 3 4 5 6 7 8 9 10 11 12 13 14 15 16 17 18 19 20 21 22 23 24 25 26 27 28 29 30 31 32 33 34 35 36 37 38 39 40 41 42 43 44 45 46 47 48 49 50
Ove
rall
cost
(€/m
² inc
ludi
ng ta
xes)
Year
France (Paris) - Overall cost (improvement + annual operating) on a 50 year period for each case - 4%/year energy price increase
Base case(economic)
Case 1
Case 1 bis(economic)
Case 1 ter(economic)
Case 1 ter HP(economic)
Case 2
Case 2 bis
Case 2 HP
Case 2 ter
Case 2 ter HP
Case 3New system replacement
New system replacement
This “global plant refurbishment scenario” graph is similar to the “boiler only replacement scenario” graph (page 9). The plant refurbishment investment cost has no significant impact on the global trend and the overall costs results.
*annual energy / maintenance cost (year 1 - €/m² including charges) these costs (year 1) are the same than for the 2% energy cost increase graph

Heating and Cooling Research Eurima, BruxellesPhone: +33 (0)1 76 43 12 00
Transsolar Sas11, rue Martel 75010 Paris
Updated Version15 December 2016 67
Eurima economic study – 2017-01-02 13
3 Overview: climate comparison The climate comparison is studied with the “Boiler only” replacement scenario.
3.1 With a 2%/year energy price increase
0
500000
1000000
1500000
2000000
2500000
1 2 3 4 5 6 7 8 9 10 11 12 13 14 15 16 17 18 19 20 21 22 23 24 25 26 27 28 29 30 31 32 33 34 35 36 37 38 39 40 41 42 43 44 45 46 47 48 49 50
Ove
rall
cost
(€ in
clud
ing
taxe
s)
Year
Climate comparison - Overall cost (improvement + annual operating) on a 50 year period for base case, case 2 and case 3 - 2%/year energy price increase
France - Basecase(economic)France - Case 2
France - Case 3
Finland - Basecase(economic)Finland - Case 2
Finland - Case 3
Italy - Base case(economic)
Italy - Case 2
Italy - Case 3
Theses curves show the overall cost for three cases of the three countries considering a 2% energy cost increase per year (low estimation). The trend of the base case is close between France, Italy and Finland. The overall cost for Finland is slightly higher than for France. In fact, the lower final energy consumptions in Finland than in France do not completely counterbalance the low energy prices in France. In spite of final energy consumptions similar to Finland’s ones, the Italian case curve shows a higher overall cost than both of the other countries because of the high Italian electrical energy costs in particular. Cases 2 and 3 highlight the differences of investment costs between the studied countries. The low Italian investment cost enables its overall cost to be lower than the other countries, but the gap between France and Italy curves decreases with time due to the lower energy prices in France than in Italy. Finland always has the highest overall cost especially because the investment costs are globally higher in this country than in the other ones.
New system replacement
New system replacement
*annual energy / maintenance cost (year 1 - €/m² including charges)

Heating and Cooling Research Eurima, BruxellesPhone: +33 (0)1 76 43 12 00
Transsolar Sas11, rue Martel 75010 Paris
Updated Version15 December 2016 68
Eurima economic study – 2017-01-02 14
3.2 With a 4%/year energy price increase
0
500000
1000000
1500000
2000000
2500000
3000000
3500000
4000000
4500000
1 2 3 4 5 6 7 8 9 10 11 12 13 14 15 16 17 18 19 20 21 22 23 24 25 26 27 28 29 30 31 32 33 34 35 36 37 38 39 40 41 42 43 44 45 46 47 48 49 50
Ove
rall
cost
(€ in
clud
ing
taxe
s)
Year
Climate comparison - Overall cost (improvement + annual operating) on a 50 year period for base case, case 2 and case 3 - 4%/year energy price increase
France - Basecase(economic)
France - Case 2
France - Case 3
Finland - Basecase(economic)
Finland - Case 2
Finland - Case 3
Italy - Basecase(economic)
Italy - Case 2
Italy - Case 3
Theses curves show the overall cost for three cases of the three countries considering a 4% energy cost increase per year (high estimation). Compared with the previous “2% energy cost increase” graph, a noticeable difference is the wider gap of the overall cost (which is noticeable especially in the long term) between the most energy efficient cases (2 and 3) and the less energy efficient cases (base). A high estimation of the energy cost increase also favours the countries with the lowest energy prices. This is why in the long term, France global costs become lower than the global cost of Italy. The Italian electricity cost (0.2428 €/kWh) is much higher than in France (0.1675 €/kWh) and in Finland (0.153 €/kWh). For Italy, 29% of the energy consumptions are electrical for case 2, and 51% for case 3. This can explain why the Italian overall cost for cases 2 and 3 is higher in the long term compared with France than in the previous “2% energy increase” graph.
New system replacement
New system replacement
*annual energy / maintenance cost (year 1 - €/m² including charges) these costs (year 1) are the same than for the 2% energy cost increase graph
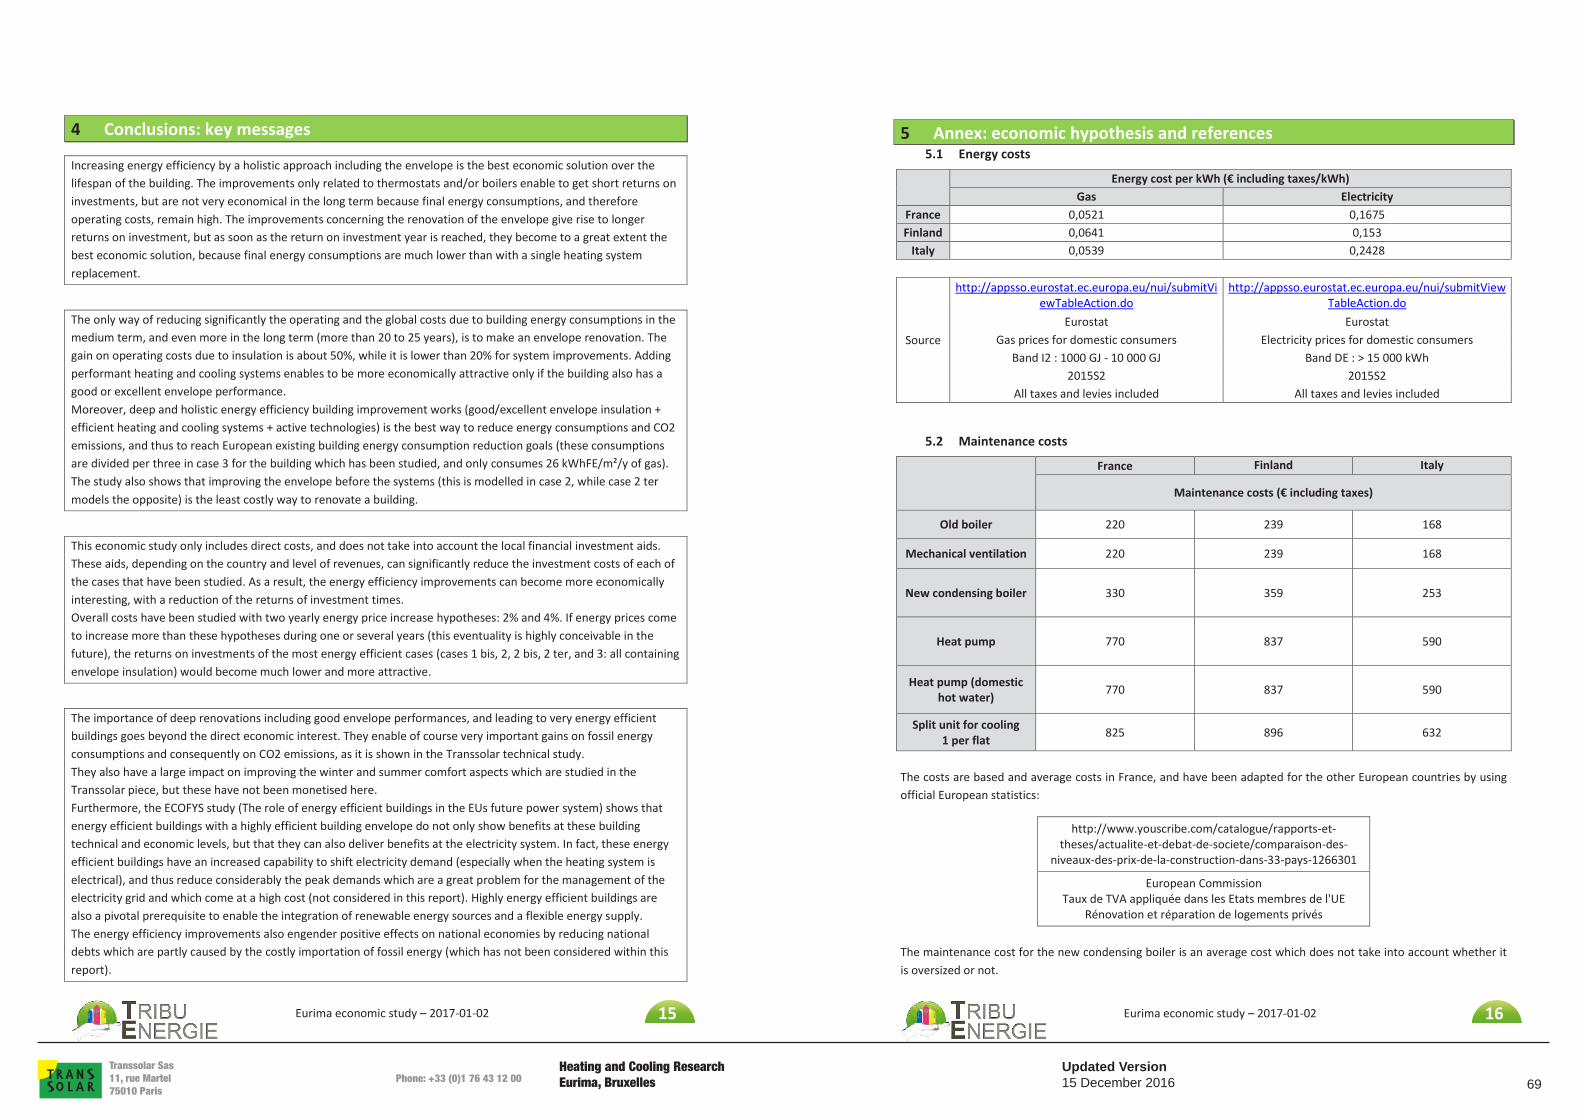
Heating and Cooling Research Eurima, BruxellesPhone: +33 (0)1 76 43 12 00
Transsolar Sas11, rue Martel 75010 Paris
Updated Version15 December 2016 69
Eurima economic study – 2017-01-02 15
4 Conclusions: key messages
Increasing energy efficiency by a holistic approach including the envelope is the best economic solution over the lifespan of the building. The improvements only related to thermostats and/or boilers enable to get short returns on investments, but are not very economical in the long term because final energy consumptions, and therefore operating costs, remain high. The improvements concerning the renovation of the envelope give rise to longer returns on investment, but as soon as the return on investment year is reached, they become to a great extent the best economic solution, because final energy consumptions are much lower than with a single heating system replacement.
The only way of reducing significantly the operating and the global costs due to building energy consumptions in the medium term, and even more in the long term (more than 20 to 25 years), is to make an envelope renovation. The gain on operating costs due to insulation is about 50%, while it is lower than 20% for system improvements. Adding performant heating and cooling systems enables to be more economically attractive only if the building also has a good or excellent envelope performance. Moreover, deep and holistic energy efficiency building improvement works (good/excellent envelope insulation + efficient heating and cooling systems + active technologies) is the best way to reduce energy consumptions and CO2 emissions, and thus to reach European existing building energy consumption reduction goals (these consumptions are divided per three in case 3 for the building which has been studied, and only consumes 26 kWhFE/m²/y of gas). The study also shows that improving the envelope before the systems (this is modelled in case 2, while case 2 ter models the opposite) is the least costly way to renovate a building.
This economic study only includes direct costs, and does not take into account the local financial investment aids. These aids, depending on the country and level of revenues, can significantly reduce the investment costs of each of the cases that have been studied. As a result, the energy efficiency improvements can become more economically interesting, with a reduction of the returns of investment times. Overall costs have been studied with two yearly energy price increase hypotheses: 2% and 4%. If energy prices come to increase more than these hypotheses during one or several years (this eventuality is highly conceivable in the future), the returns on investments of the most energy efficient cases (cases 1 bis, 2, 2 bis, 2 ter, and 3: all containing envelope insulation) would become much lower and more attractive.
The importance of deep renovations including good envelope performances, and leading to very energy efficient buildings goes beyond the direct economic interest. They enable of course very important gains on fossil energy consumptions and consequently on CO2 emissions, as it is shown in the Transsolar technical study. They also have a large impact on improving the winter and summer comfort aspects which are studied in the Transsolar piece, but these have not been monetised here. Furthermore, the ECOFYS study (The role of energy efficient buildings in the EUs future power system) shows that energy efficient buildings with a highly efficient building envelope do not only show benefits at these building technical and economic levels, but that they can also deliver benefits at the electricity system. In fact, these energy efficient buildings have an increased capability to shift electricity demand (especially when the heating system is electrical), and thus reduce considerably the peak demands which are a great problem for the management of the electricity grid and which come at a high cost (not considered in this report). Highly energy efficient buildings are also a pivotal prerequisite to enable the integration of renewable energy sources and a flexible energy supply. The energy efficiency improvements also engender positive effects on national economies by reducing national debts which are partly caused by the costly importation of fossil energy (which has not been considered within this report).
Eurima economic study – 2017-01-02 16
5 Annex: economic hypothesis and references 5.1 Energy costs
Energy cost per kWh (€ including taxes/kWh)
Gas Electricity France 0,0521 0,1675 Finland 0,0641 0,153
Italy 0,0539 0,2428
Source
http://appsso.eurostat.ec.europa.eu/nui/submitViewTableAction.do
http://appsso.eurostat.ec.europa.eu/nui/submitViewTableAction.do
Eurostat Eurostat Gas prices for domestic consumers Electricity prices for domestic consumers
Band I2 : 1000 GJ - 10 000 GJ Band DE : > 15 000 kWh 2015S2 2015S2
All taxes and levies included All taxes and levies included
5.2 Maintenance costs
France Finland Italy
Maintenance costs (€ including taxes)
Old boiler 220 239 168
Mechanical ventilation 220 239 168
New condensing boiler 330 359 253
Heat pump 770 837 590
Heat pump (domestic hot water) 770 837 590
Split unit for cooling 1 per flat 825 896 632
The costs are based and average costs in France, and have been adapted for the other European countries by using official European statistics:
http://www.youscribe.com/catalogue/rapports-et-theses/actualite-et-debat-de-societe/comparaison-des-
niveaux-des-prix-de-la-construction-dans-33-pays-1266301
European Commission Taux de TVA appliquée dans les Etats membres de l'UE
Rénovation et réparation de logements privés The maintenance cost for the new condensing boiler is an average cost which does not take into account whether it is oversized or not.

Heating and Cooling Research Eurima, BruxellesPhone: +33 (0)1 76 43 12 00
Transsolar Sas11, rue Martel 75010 Paris
Updated Version15 December 2016 70
Eurima economic study – 2017-01-02 17
5.3 Improvement costs
France Finland Italy
“Boiler only” scenario
Global plant improvement
scenario
“Boiler only” scenario
Global plant improvement
scenario
“Boiler only” scenario
Global plant improvement
scenario Improvement costs (€
including taxes) Improvement costs (€
including taxes) Improvement costs (€
including taxes) Thermostat on radiators 3135 3407 2401 Good envelope (internal
wall insulation) 271376 294891 207810
Good envelope (external wall
insulation) 315719 343077 241767
Excellent envelope (external wall
insulation) 363458 394951 278323
New condensing boiler - modulating burner
Plant sized following the low envelope
demand
17314 24354 18814 26464 13258 18649
New condensing boiler - modulating burner
Plant sized following the good envelope
demand
10450 17490 11355 19006 8002 13393
New condensing boiler - modulating burner
Plant sized following the excellent envelope
demand
8866 15906 9634 17284 6789 12180
Heat pump 55880 62920 60722 68372 42791 48182
Heat pump (domestic hot water) 10560 10560 11475 11475 8086 8086
Split unit for cooling (high efficiency)
1 per flat 41250 44824 31588
The costs are based and average costs in France, and have been adapted for the other European countries by using official European statistics:
http://www.youscribe.com/catalogue/rapports-et-theses/actualite-et-debat-de-societe/comparaison-des-
niveaux-des-prix-de-la-construction-dans-33-pays-1266301
European Commission Taux de TVA appliquée dans les Etats membres de l'UE
Rénovation et réparation de logements privés