heineken n.v. full year results 2005 presentation
TRANSCRIPT
8/6/2019 Heineken N.v. Full Year Results 2005 Presentation
http://slidepdf.com/reader/full/heineken-nv-full-year-results-2005-presentation 1/42
Heineken N.V.
Full Year Results 2005Presentation

8/6/2019 Heineken N.v. Full Year Results 2005 Presentation
http://slidepdf.com/reader/full/heineken-nv-full-year-results-2005-presentation 2/42
FullFull Year Results 200 Year Results 20055Press/Analyst PresentationPress/Analyst Presentation
22 February 2006

8/6/2019 Heineken N.v. Full Year Results 2005 Presentation
http://slidepdf.com/reader/full/heineken-nv-full-year-results-2005-presentation 3/42
Jean-François van Boxmeer, Chairman Executive Board Jean-François van Boxmeer, Chairman Executive Board
Full Year Results 2005Full Year Results 2005

8/6/2019 Heineken N.v. Full Year Results 2005 Presentation
http://slidepdf.com/reader/full/heineken-nv-full-year-results-2005-presentation 4/42
4
Highlights
Or ganic growth in all key business metr ics in 2005:
± Net profit +7.3%, at the top end of our 2005FY profit outlook
± Revenues +2.2%, driven by price, mix and volume improvements
± EBIT +2.9%, driven by top-line growth and costs reductions
± Strong free cash flow generation, cash conversion 120%
New management structure in place as per 1 October 2005
Focus 2006:
Heineken® to further strengthen its position in the premium segment
Leverage aggressively our innovations
US A: launch Premium Light®, grow core Heineken®
Russia: Strong market position achieved, accelerating integration
Targeting ¼200m cost reduction by 2008

8/6/2019 Heineken N.v. Full Year Results 2005 Presentation
http://slidepdf.com/reader/full/heineken-nv-full-year-results-2005-presentation 5/42
5
Consistent growth in the world¶s most prof itable segment
19.2
17.4
16.715.614.3
13.412.5
11.710.9
9.8
20.1
18.5
0
5
10
15
20
1994 1995 1996 1997 1998 1999 2000 2001 2002 2003 2004 2005
20 million hl

8/6/2019 Heineken N.v. Full Year Results 2005 Presentation
http://slidepdf.com/reader/full/heineken-nv-full-year-results-2005-presentation 6/42
6
Our core strategic asset: the Heineken ®
brand
2005 was an excellent year for Heineken ®
Exceeded 20 million hectolitres in the premium segment for the first time
Premium volume +4.5% in 2005 versus +4.1% in 2004
Good growth in all regions
Strengthened position in highly profitable West European region
+ 2. %
+ .5%
+ .2%
stable
+ .2% + .2%
0
2
5
West Euro e Central Euro e USA est of A er icas Afr ica Asia Pacif ic
200
2005
Hl mn + .5%

8/6/2019 Heineken N.v. Full Year Results 2005 Presentation
http://slidepdf.com/reader/full/heineken-nv-full-year-results-2005-presentation 7/42
7
0.0 5.0 10.0 15.0 20.0
Beck's
Brahma
Tubor g
Foster's
tella rtois
mstel
Budweiser
Corona
Carlsber g
Heineken
Heineken is clear leader in the most prof itable market segment
Based on sales volume sold outside the home market ± 2004 FY
8/6/2019 Heineken N.v. Full Year Results 2005 Presentation
http://slidepdf.com/reader/full/heineken-nv-full-year-results-2005-presentation 8/42
8
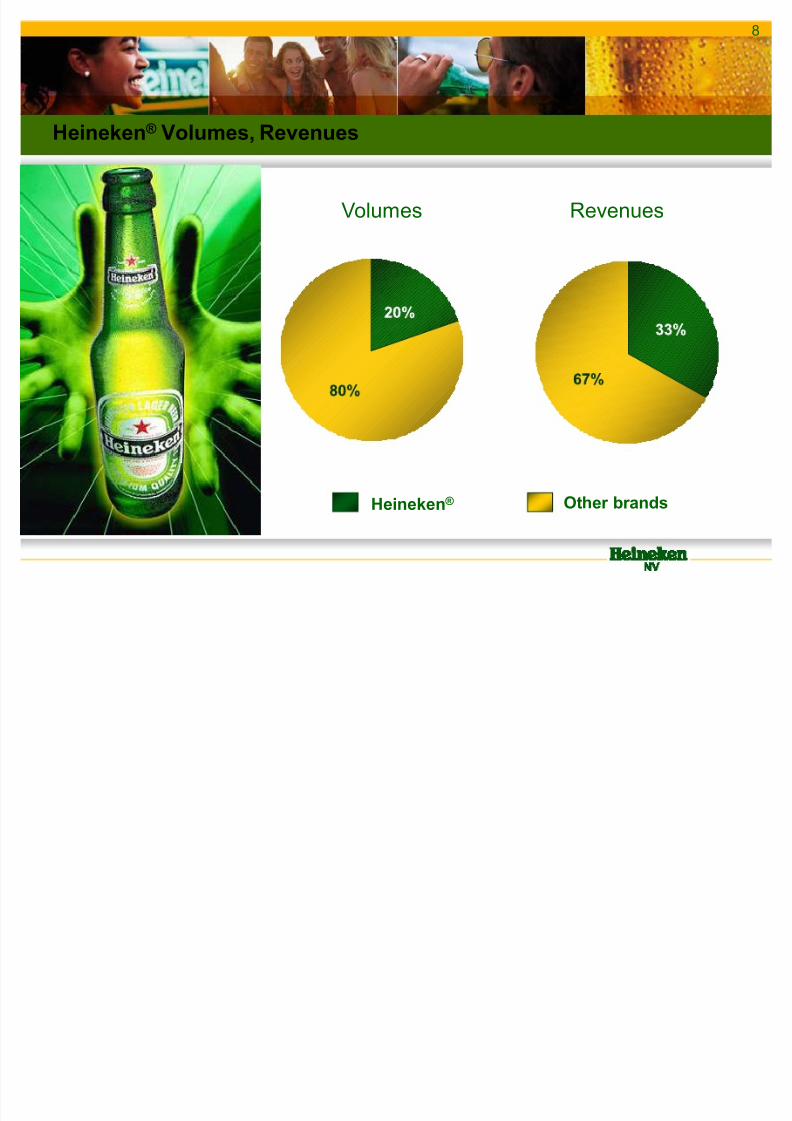
Heineken ®
Volumes, Revenues
Volumes Revenues
Heineken ® Other brands

8/6/2019 Heineken N.v. Full Year Results 2005 Presentation
http://slidepdf.com/reader/full/heineken-nv-full-year-results-2005-presentation 9/42
9
Source: Plato, > 20% participations * pro-forma, on a full year basis
Our leading market positions and local brands (domestic sales)
Number 1 or 2
Number 3
France #2
6.2m hlPelforth
Desperados
Austria #1
4.6m hl
Gösser, Edelweiss
Puntigamer, Zipfer
Russia #3
12m hl*Ochota, Botcharev
PIT, Stepan Razin
Netherlands #1
5.8m hl Amstel, Heineken,
Brand
Nigeria #16.2m hl
Star, Gulder
Poland #2
10.1m hlZywiec, Krowelski,
Warka, Specjal
Spain #1
10.8m hlCruzcampo,
Amstel, Buckler
Italy #1
5.6m hlBirra Moretti, Dreher,
Ichnusa
Indonesia #1
1.3m hl
Bir Bintang
Chile #1
4.2m hl
Cristal, Escudo
Greece #1
3.1m hl
Amstel, Alfa
8/6/2019 Heineken N.v. Full Year Results 2005 Presentation
http://slidepdf.com/reader/full/heineken-nv-full-year-results-2005-presentation 10/42
10
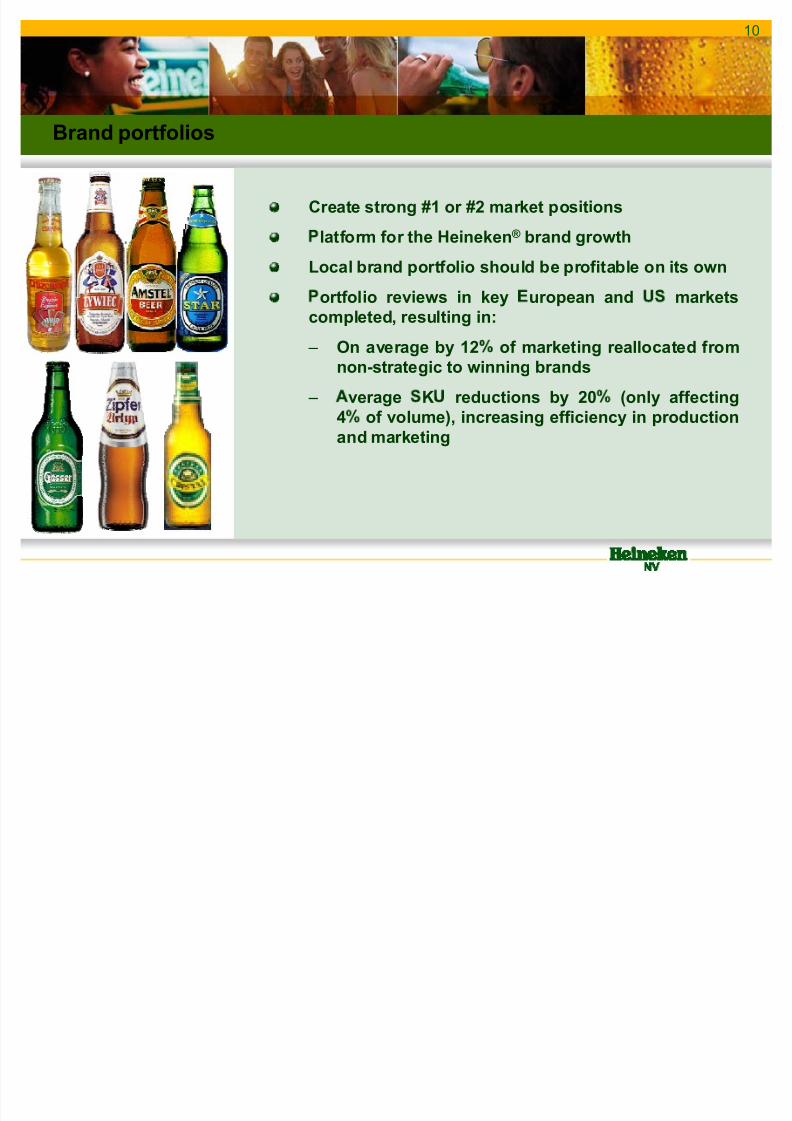
Brand portfolios
Create strong #1 or #2 market positions
latform for the Heineken ® brand growth
Local brand portfolio should be prof itable on its own
ortfolio reviews in key uropean and marketscompleted, resulting in:
± On average by 12 of marketing reallocated fromnon-strategic to winning brands
± verage K reductions by 20 (only affecting
4 of volume), increasing eff iciency in productionand marketing
8/6/2019 Heineken N.v. Full Year Results 2005 Presentation
http://slidepdf.com/reader/full/heineken-nv-full-year-results-2005-presentation 11/42
11
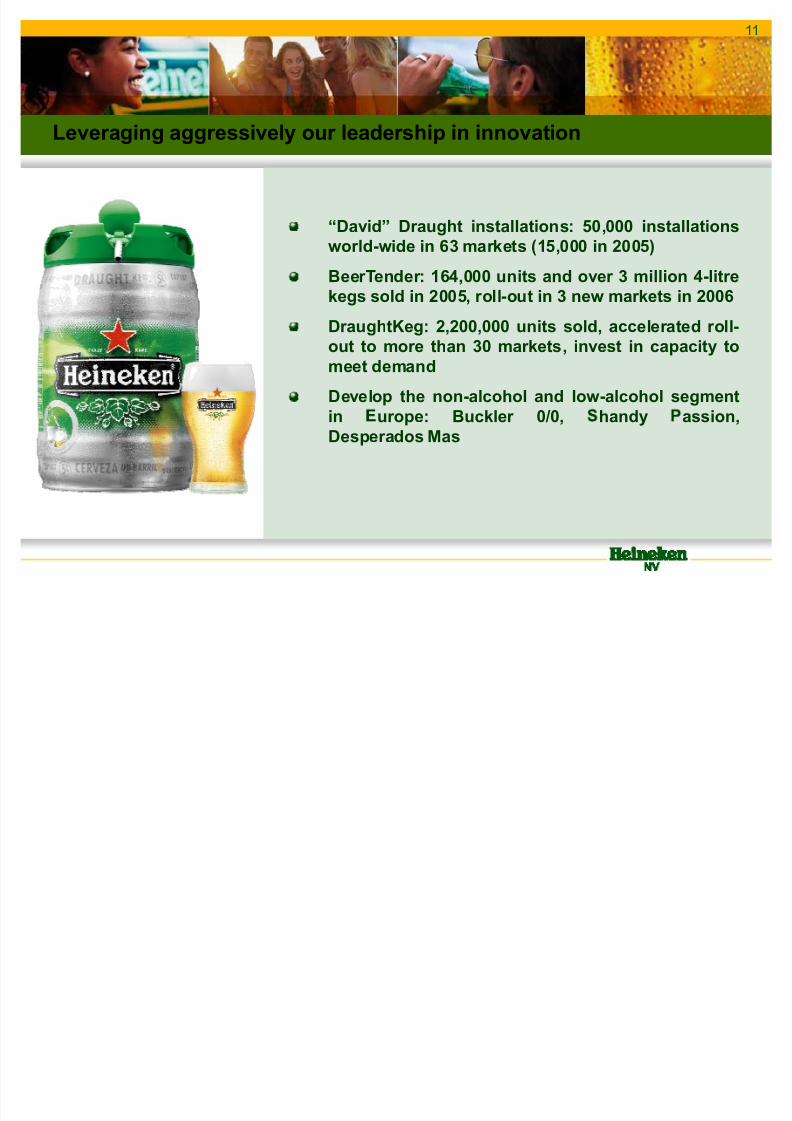
Leveraging aggressively our leadership in innovation
³David´ Draught installations: 50,000 installationsworld-wide in 63 markets (15,000 in 2005)
BeerTender: 164,000 units and over 3 million 4-litrekegs sold in 2005, roll-out in 3 new markets in 2006
DraughtKeg: 2,200,000 units sold, accelerated roll-out to more than 30 markets, invest in capacity tomeet demand
Develop the non-alcohol and low-alcohol segment
in urope: Buckler 0/0, handy assion,Desperados Mas

8/6/2019 Heineken N.v. Full Year Results 2005 Presentation
http://slidepdf.com/reader/full/heineken-nv-full-year-results-2005-presentation 12/42
12
Heineken Volumes 2005
On-trade Off-trade
ales-0.3
Depletions1.2
hipmentsstable
Independentdistr ibutors
Heineken BreweryNetherlands
Heinekenarehouses
Beer market ±0.2 *
Depletions of Heineken 1.2
± Heineken ® 1.9
± mstel Light ® - 3.1
Heineken ® had a better H2 2005
mstel Light ® recover ing in Q4 2005
F M Mexican brands performed strongly at
2.2m hl ( 7.4 ). Including Femsa, Heineken isnow the 4th lar gest beer supplier in
Heineken remium Light ® successfully testmarketed
*Source Beverage Marketing

8/6/2019 Heineken N.v. Full Year Results 2005 Presentation
http://slidepdf.com/reader/full/heineken-nv-full-year-results-2005-presentation 13/42
13
National roll-out of Heineken remium Light ®
Light beer 50 of beer consumption
Heineken remium Light in test markets has proven
its strong potential
Favourable results of test markets dr iven by coreHeineken ® brand strong reputation and perfect tasteprof ile of Heineken remium Light ®
National rollout from Mar ch 2006 onwards
xpected volume in 2006: 400,000 hlubstantial incremental marketing budget (¼42m)
8/6/2019 Heineken N.v. Full Year Results 2005 Presentation
http://slidepdf.com/reader/full/heineken-nv-full-year-results-2005-presentation 14/42
14
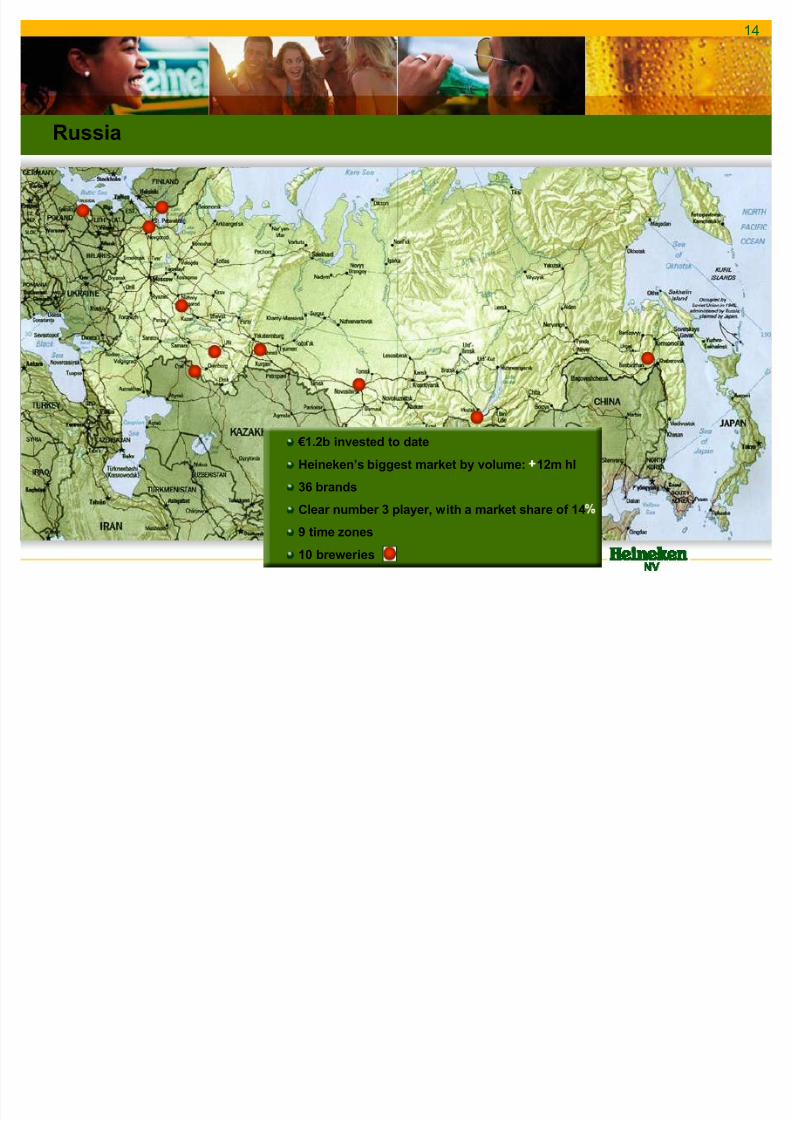
Russia
¼1.2b invested to date
Heineken¶s biggest market by volume: 12m hl
36 brands
Clear number 3 player, with a market share of 14
9 time zones
10 brewer ies

8/6/2019 Heineken N.v. Full Year Results 2005 Presentation
http://slidepdf.com/reader/full/heineken-nv-full-year-results-2005-presentation 15/42
15
Russia: r ior ities
Building winning brand portfolio
± r ior itise brands
± New licensed brands (Guinness, Zlaty Bazant,Gösser, mstel, Bitbur ger)
Reinfor ce distr ibution network combining:
± ropr ietary
± Independent
Integrate or ganisation
Optimise allocation of production and packaging

8/6/2019 Heineken N.v. Full Year Results 2005 Presentation
http://slidepdf.com/reader/full/heineken-nv-full-year-results-2005-presentation 16/42
16
RussiaCommer cial

8/6/2019 Heineken N.v. Full Year Results 2005 Presentation
http://slidepdf.com/reader/full/heineken-nv-full-year-results-2005-presentation 17/42
17
Strong track record in cost control
successful and consistent track record in controlling costs
Supply chain savings absorbed inflation: production costs ¼32/hl in 2005 compared with ¼36/hl in 1993
32 brewer ies closed or divested since 1993, of which 25 inurope
Reduced water consumption per hectolitre of beer over thelast 5 years by 14 to 5.3 hl
Reduced ener gy per hectolitre of beer by 10 to 113 Mj
T M* in 65 of 108 brewer ies in 2005, 80 in 2006
*TPM = Total Productive Management program, aiming at minimising cost of production

8/6/2019 Heineken N.v. Full Year Results 2005 Presentation
http://slidepdf.com/reader/full/heineken-nv-full-year-results-2005-presentation 18/42
18
Lower ing the cost base by ¼200 million
Tar get to reduce f ixed cost (excluding marketing) by ¼200min absolute terms in 2008 compared to 2005 of which ¼65mfrom existing programmes:
± In all regions and at Head Off ice
± In the supply chain, the commer cial or ganisation(incl. wholesale) and support functions
± Global benchmarking study in the support functionsis currently being conducted
± Better procurement and slashing general costs
± Level of FT reduction and restructur ing costs notyet known

8/6/2019 Heineken N.v. Full Year Results 2005 Presentation
http://slidepdf.com/reader/full/heineken-nv-full-year-results-2005-presentation 19/42
19
Prof it outlook for 2006*
Heineken does not expect or ganic growth in Net Prof it for 2006 to exceed mid-singledigits:
± Heineken ® brand growth and implementation of the outcome of brand
portfolio and innovations will dr ive volume and mix improvements
± ¼200m cost reductions tar geted by 2008, main effects in 2007/08
± Higher oil pr ice will affect cost of ener gy, transportation and packaging
mater ials, only part of which can be passed on to the consumer
± The introduction of Heineken Premium Light ® in SA will have in 2006 anegative impact on BIT of ¼25m
± Integration costs and the implementation of the brand portfolio strategy willput temporary pressure on results in Russia
* The full text of the full-year profit outlook for 2006 can be found in Heineken 2005 results press release

8/6/2019 Heineken N.v. Full Year Results 2005 Presentation
http://slidepdf.com/reader/full/heineken-nv-full-year-results-2005-presentation 20/42
R ené Hooft Graafland, Member of the Executive Board and CFO R ené Hooft Graafland, Member of the Executive Board and CFO
Financial Review 2005Financial Review 2005

8/6/2019 Heineken N.v. Full Year Results 2005 Presentation
http://slidepdf.com/reader/full/heineken-nv-full-year-results-2005-presentation 21/42
21
Key f igures 2005 (million of hl/¼ million)
* Includes exceptional items before tax in 2005: -¼102m ( in 2004 there was no exception item at BIT level)and amortisation of brands (in 2005: ¼7m, in 2004: ¼8m).
** Includes exceptional items after tax in 2005: -¼72m ( in 2004: ¼153m) and amortisation of brands (in 2005: ¼7m, in 2004: ¼8m).
BIT*
Net Prof it beia
BIT beia
Net Prof it**
1,283
319
1,392
1,369
334
1,377
-6.3
4.6
1.1
840 803
18.5761 642
Increase2005 2004 Or ganic growth
2.9
7.3
Revenues 10,796 10,062 7.3 2.2
Group beer volume 118.6 112.6 5.3 1.8

8/6/2019 Heineken N.v. Full Year Results 2005 Presentation
http://slidepdf.com/reader/full/heineken-nv-full-year-results-2005-presentation 22/42
22
Revenues (¼ million)
10,796
10,062
4.5
consolidation
2.0Pr ice/mix
0. 2volumes
9000
9400
9800
10200
10600
11000
2004 FY 2005 FY
0.6currencies
2.2Or ganic growth

8/6/2019 Heineken N.v. Full Year Results 2005 Presentation
http://slidepdf.com/reader/full/heineken-nv-full-year-results-2005-presentation 23/42
23
1,3921,377
-3.5%
currencies
1.7%
consolidation
2.9% organic
growth
900
1000
1100
1200
1300
1400
1500
EBIT (beia) (¼ million)
2004 FY 2005 FY

8/6/2019 Heineken N.v. Full Year Results 2005 Presentation
http://slidepdf.com/reader/full/heineken-nv-full-year-results-2005-presentation 24/42
24
Increased market investments in 2005
Incremental investments in marketing and innovation, in-linewith the ¼100m as announced in February 2005
Marketing and selling costs up 60 basis points to 12.5 of Revenues
Packaging costs increased by 4.1 due to higher volumesand changes in packaging mix, of which ¼30m is related tonew marketing and innovation programmes
Depreciation increased by 6.5 , of which +1.8 or ganically,
partly as a result of investments in new draught beer installations, coolers and f illing lines for DraughtKegs andBeerTender kegs

8/6/2019 Heineken N.v. Full Year Results 2005 Presentation
http://slidepdf.com/reader/full/heineken-nv-full-year-results-2005-presentation 25/42
25
803840
0.7
consolidation
-3.4
currencies7.3
or ganic growth
600650
700
750
800
850
900
NetP
rof it (beia) (¼ million)
2004 FY 2005 FY

8/6/2019 Heineken N.v. Full Year Results 2005 Presentation
http://slidepdf.com/reader/full/heineken-nv-full-year-results-2005-presentation 26/42
26
Strong Free
Cash Flow Generation
103 97
120
0
200
400
600
800
1000
1200
2003 2004 2005
0
20
40
60
80
100
120
140
Free perating Cash Flow
et pro it beia be ore min nterests
Cash con ersion rate
Excellent cash con ersion rate and good C management
2003 data are Dutch Gaap
22 8
16 8
11 6
0
5
10
15
20
25
2003 2004 2005
NWC Days ¼ million

8/6/2019 Heineken N.v. Full Year Results 2005 Presentation
http://slidepdf.com/reader/full/heineken-nv-full-year-results-2005-presentation 27/42
27
Western Europe
Underlying EBIT (beia) of the operating companies improved
Heineken® in premium segment: +3.5%
Spain: Strong market: all brands up, Heineken® +7%
France:Heineken® +5%, gaining share in the premium segment
¼50m cost reduction programme Western Europe: ¼24m savingsachieved in 2005
Cost saving programme in the Netherlands completed: costs
reduced by ¼35m
Head count reduced by more than 1,000 FTEs
Volumes
EBIT (beia)
41
005 004 change
Beer volumes (m hl) 3 . 3 .5 -0.9
Revenues (¼m) 4, 13 4,660 1.1
EBIT (beia) (¼m) 560 565 -0.9

8/6/2019 Heineken N.v. Full Year Results 2005 Presentation
http://slidepdf.com/reader/full/heineken-nv-full-year-results-2005-presentation 28/42
28
Central and Eastern Europe
Central Europe shows robust growth
EBIT (beia) increased due to:
± Mix improvement resulting from brand portfolio reviews
± Significant cost savings, mainly in purchasing
Synergy realisation at BB AG on track: ¼55m of ¼80m realised
Heineken® in premium segment +6.2%
Poland: Higher EBIT driven by better price/sale mix and tight costcontrol
Romania and Hungary: Good progress in turn-around, profits up
Volumes
EBIT (beia)
22
2005 2004 change
Beer volumes (m hl) 45.5 42.6 6.
Revenues (¼m) 2,796 2,526 10.7
EBIT (beia) (¼m) 05 264 15.5

8/6/2019 Heineken N.v. Full Year Results 2005 Presentation
http://slidepdf.com/reader/full/heineken-nv-full-year-results-2005-presentation 29/42
29
TheA
mer icas
Heineken® in premium segment +1.5%
EBIT lower mainly due to forex impact (-¼67m)
US A:
± Depletions up 1.2%, below growth rate of import segment
±New management Heineken U
S A in place
± Clear labels and new advertising introduced
± Performance improved in H2 2005
Chile and Argentina: Volumes +8%, EBIT substantially up,
Heineken® grew by 22%
Volumes
13
EBIT (beia)
18
2005 2004 change
Beer volumes (m hl) 15.1 14.5 3.9
Revenues (¼m) 1,733 1,516 14.3
EBIT (beia) (¼m) 256 291 -12.0

8/6/2019 Heineken N.v. Full Year Results 2005 Presentation
http://slidepdf.com/reader/full/heineken-nv-full-year-results-2005-presentation 30/42
30
Afr ica and Middle East
EBIT improved slightly as good performance in Nigeria was offset
by cost pressure in Egypt
Heineken® in premium segment +8.2%
Nigeria: EBIT up significantly:
± Portfolio review and strong pricing
± Efficiency improvements flowing through
Egypt:
± Positive volume development, but increase in costs
Cost reductions in Middle East is priority for 2006
Volumes
13
EBIT (beia)
1
2005 200 change
Beer volumes (m hl) 15.0 13.5 11.5
Revenues (¼m) 1,052 889 18.3
EBIT (beia) (¼m) 198 187 5.9

8/6/2019 Heineken N.v. Full Year Results 2005 Presentation
http://slidepdf.com/reader/full/heineken-nv-full-year-results-2005-presentation 31/42
31
Asia
Pacif ic
Heineken® premium brand: +12.3%
EBIT slightly up despite additional marketing investments
China:
± Robust volume growth in Shanghai and Hainan
± Price pressure continues
Rest of Asia:
± Profits up in all markets
± Strong Heineken® growth in Vietnam (+20%), Taiwan(+20%)
Investments in breweries in Mongolia and Sri Lanka
Volumes
9
EBIT (beia)
5
2005 2004 change
Beer volumes (m hl) 10.8 9.5 13.4
Revenues (¼m) 502 471 6.6
EBIT (beia) (¼m) 73 70 4.3
8/6/2019 Heineken N.v. Full Year Results 2005 Presentation
http://slidepdf.com/reader/full/heineken-nv-full-year-results-2005-presentation 32/42
32
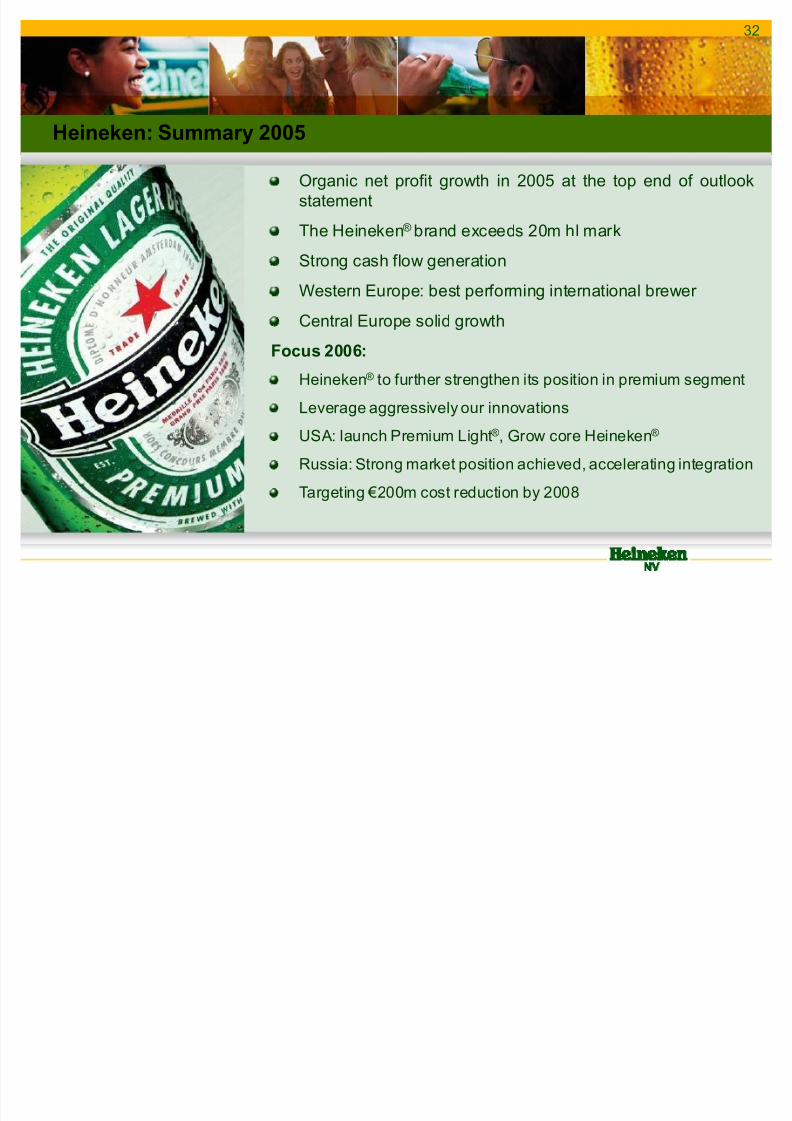
Organic net profit growth in 2005 at the top end of outlook
statement
The Heineken® brand exceeds 20m hl mark
Strong cash flow generation
Western Europe: best performing international brewer
Central Europe solid growth
Focus 2006:
Heineken® to further strengthen its position in premium segment
Leverage aggressively our innovations
US A: launch Premium Light®, Grow core Heineken®
Russia: Strong market position achieved, accelerating integration
Targeting ¼200m cost reduction by 2008
Heineken:S
ummary 2005

8/6/2019 Heineken N.v. Full Year Results 2005 Presentation
http://slidepdf.com/reader/full/heineken-nv-full-year-results-2005-presentation 33/42
33
Commer cial

8/6/2019 Heineken N.v. Full Year Results 2005 Presentation
http://slidepdf.com/reader/full/heineken-nv-full-year-results-2005-presentation 34/42
QuestionspleaseQuestionsplease
8/6/2019 Heineken N.v. Full Year Results 2005 Presentation
http://slidepdf.com/reader/full/heineken-nv-full-year-results-2005-presentation 35/42

8/6/2019 Heineken N.v. Full Year Results 2005 Presentation
http://slidepdf.com/reader/full/heineken-nv-full-year-results-2005-presentation 36/42
AppendixAppendix
37
8/6/2019 Heineken N.v. Full Year Results 2005 Presentation
http://slidepdf.com/reader/full/heineken-nv-full-year-results-2005-presentation 37/42
37
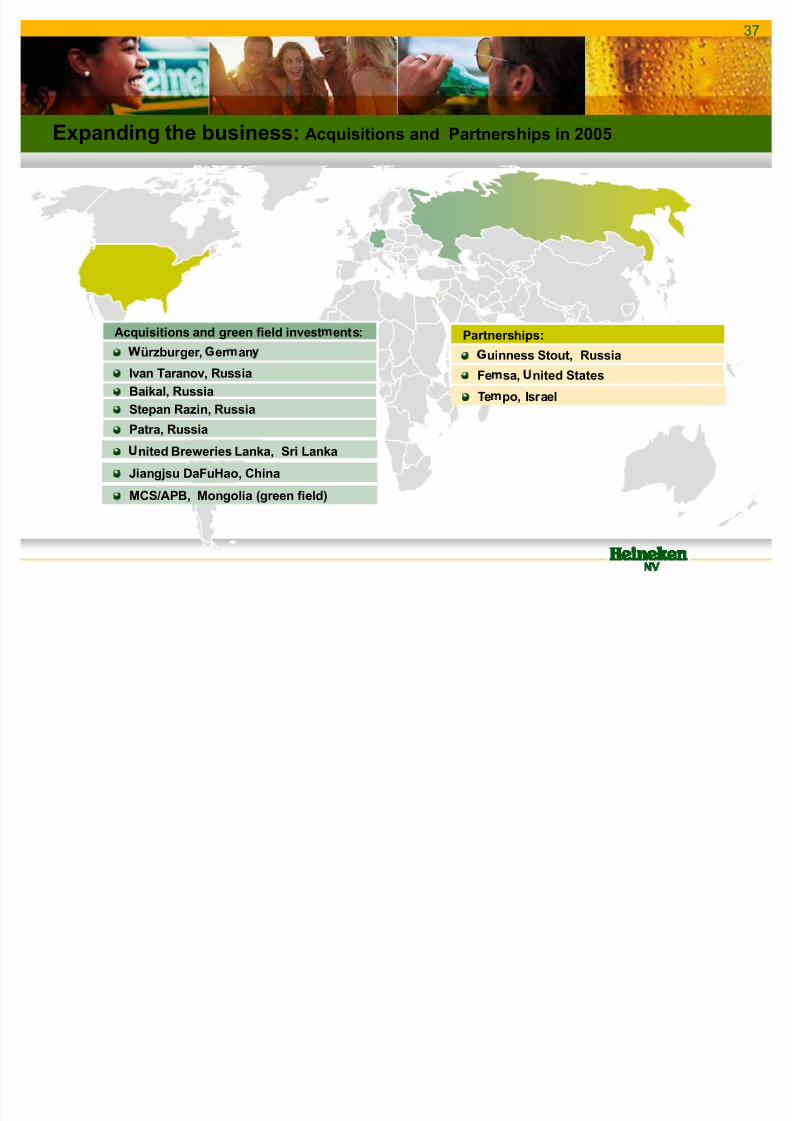
Expanding the business:Acquisitions and Partnerships in 2005
Patra, Russia
Stepan Razin, Russia
Baikal, Russia
Ivan Taranov, Russia
ürzbur ger, er an
Acquisitions and green f ield invest ents:
Fe sa, nited States
uinness Stout, Russia
Partnerships:
Te po, Israel
nited Brewer ies Lanka, Sr i Lanka
Jiang jsu DaFuHao, China
MCS /APB, Mongolia (green f ield)
38

8/6/2019 Heineken N.v. Full Year Results 2005 Presentation
http://slidepdf.com/reader/full/heineken-nv-full-year-results-2005-presentation 38/42
38
Information on
core beer markets 2005
* includes export** Includes pro-rata volumes of companies acquired and consolidated for the f irst time
Country Volumes in hl millions*
Spain 10.8
Poland 10.2
Germany 8.7
United States (incl. Femsa) 8.7
France 6.8
Russia** 7.2
Nigeria 6.2
Netherlands 5.8
Italy 5.7
Austria 4.6
Chile 4.2
Greece 3.2
39
8/6/2019 Heineken N.v. Full Year Results 2005 Presentation
http://slidepdf.com/reader/full/heineken-nv-full-year-results-2005-presentation 39/42
39
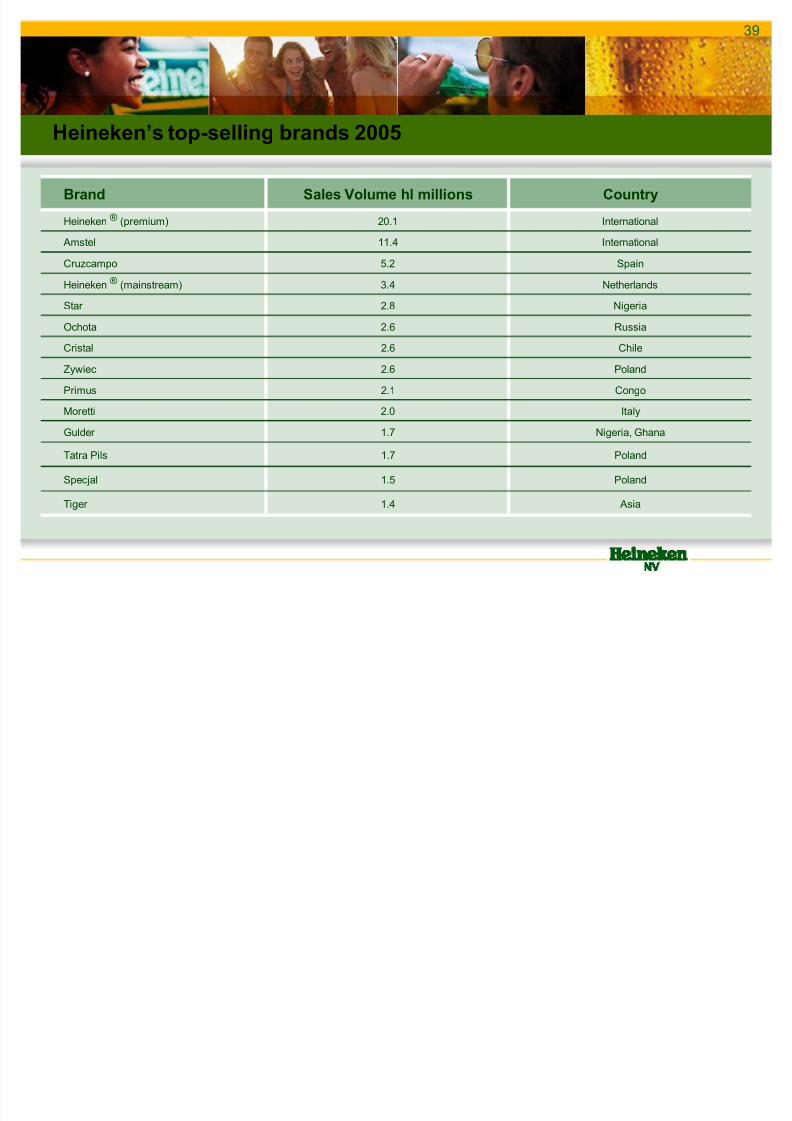
Heineken¶s top-selling brands 2005
Brand Sales Volume hl millions Country
Heineken ® (premium) 20.1 International
Amstel 11.4 International
Cruzcampo 5.2 Spain
Heineken ® (mainstream) 3.4 Netherlands
Star 2.8 Nigeria
Ochota 2.6 Russia
Cristal 2.6 Chile
Zywiec 2.6 Poland
Primus 2.1 Congo
Moretti 2.0 Italy
Gulder 1.7 Nigeria,Ghana
Tatra Pils 1.7 Poland
Specjal 1.5 Poland
Tiger 1.4 Asia
40

8/6/2019 Heineken N.v. Full Year Results 2005 Presentation
http://slidepdf.com/reader/full/heineken-nv-full-year-results-2005-presentation 40/42
40
Balance Sheet 2005 (¼ billion)
Current Assets
Fixed Assets
20040.7
2.5
7.6
0.6
2.7
8.5
Assets
11.810.8
Net debt position 2005 : ¼2,647m (2004 : ¼2,857m)
2005
Equity and Liabilities
10.8
2004
2.5
1.0
3.6
3.7
11.8
2005
3.0
1.0
3.3
4.5
Cash
Other liabilities
Provisions andPers. benef its
Gross f in.debt
Total Equity
41

8/6/2019 Heineken N.v. Full Year Results 2005 Presentation
http://slidepdf.com/reader/full/heineken-nv-full-year-results-2005-presentation 41/42
41
US Dollar Hedging
ImpactImpact ¼ million
PositionPositionUSD million
2004A
2005A
2006F
772
767
772
767
652
1.13
1.26
NetInflow
HedgedPart**
HedgedRate***
2004A
2005A
2006F*
- 124
- 67
-1
- 79
- 39
-1
EBIT NetProf it
* Assuming $ spot rate at 31 December 2006 corresponds with the hedging rate** Hedging at 21 February 2006*** Including the costs of hedging
733
1.232007F 767 90
1.27
2007F* +23 +16

8/6/2019 Heineken N.v. Full Year Results 2005 Presentation
http://slidepdf.com/reader/full/heineken-nv-full-year-results-2005-presentation 42/42