annual report 2011 2011 ann - home | heineken holding n.v
TRANSCRIPT

2011Annual Report 2011
AnnHEINEKEN HOLDING N.V. ANNUAL REPORT 2011
Established in Amsterdam
Heineken H
olding N.V.

2011HEINEKEN HOLDING N.V. ANNUAL REPORT 2011
Established in Amsterdam

Heineken Holding N.V., which holds 50.005% of the issued share capital of Heineken N.V., heads the HEINEKEN group. The object of Heineken Holding N.V. pursuant to its Articles of Association is to manage and supervise the management of the HEINEKEN group and to provide services for Heineken N.V. It seeks to promote the continuity, independence and stability of the HEINEKEN group, thereby enabling Heineken N.V. to grow in a controlled and steady manner and to pursue its long-term policy in the interest of all stakeholders. Heineken Holding N.V. does not engage in operational activities itself. These have been assigned within the HEINEKEN group to Heineken N.V. and its subsidiaries and associated companies. Heineken Holding N.V.’s income consists almost exclusively of dividends received on its interest in Heineken N.V. Every Heineken N.V. share held by Heineken Holding N.V. is matched by one share issued by Heineken Holding N.V. The dividend payable on the two shares is identical. Heineken Holding N.V. ordinary shares are listed on Euronext Amsterdam.
An abbreviated version of this report is available in the Dutch language. Een verkorte versie van dit rapport is beschikbaar in de Nederlandse taal.
Both the English and Dutch versions can be downloaded from www.theHEINEKENcompany.com Zowel de Engelse als de Nederlandse versie kunnen worden gedownload vanaf de website www.theHEINEKENcompany.com
PROFILE
Shareholder information
Board of Directors
Policy principlesActivitiesReview of 2011Heineken N.V. performance in 2011 and outlookFinancial statements and appropriation of profitCorporate governanceBoard of DirectorsGeneral Meeting of ShareholdersFurther information pursuant to the Article 10 Takeover Directive Decree
Balance sheet of Heineken Holding N.V.Income statement of Heineken Holding N.V.Notes to the balance sheet as at 31 December 2011 and the income statement for 2011 of Heineken Holding N.V.Consolidated income statementConsolidated statement of comprehensive incomeConsolidated statement of financial positionConsolidated statement of cash flows Consolidated statement of changes in equityNotes to the consolidated financial statements
Rights of holders of priority sharesProvisions of the Articles of Association concerning appropriation of profitRemuneration of the Board of DirectorsShares held by the Board of DirectorsProposed appropriation of profitStatement of the Board of DirectorsIndependent Auditor’s Report
4
8
99
10101111131417
202223
282930323436
129129
129129129130131
page
REPORT OF THE BOARD OF DIRECTORS
FINANCIAL STATEMENTS 2011
OTHER INFORMATION
CONTENTS

H E I N E K E N H O L D I N G N .V. A N N U A L R E P O R T 2 0 11
4
50
45
40
35
30
25
20
15
10
5
0
2002
2003
2004
2005
2006
2007
2008
2009
2010
2011
Netherlands
United Kingdom/Ireland
Rest of Europe
North America
Rest of the world
Domestic and foreign retail
Undisclosed
2010
5.8
14.1
9.8
47.0
1.3
1.5
20.5
100.0
2011
3.4
13.5
8.6
43.6
3.1
1.5
26.3
100.0
2011
2010
31.6
2
Average trade in 2011: 197,768 shares per day
Source: Capital PrecisionBased on best estimate January 2012
share price range year-end price
Heineken Holding N.V. share pricein eurosEuronext Amsterdamafter restatement for share split
Nationality Heineken Holding N.V. shareholdersin % Based on 99.3 million shares in free float (excluding the holding of L’ Arche Green N.V. and FEMSA in Heineken Holding N.V.)
SHAREHOLDER INFORMATION
H E I N E K E N H O L D I N G N.V. A N N U A L R E P O R T 2 0 11
5
HEINEKEN HOLDING N.V.
Heineken Holding N.V. ordinary shares are traded on Euronext Amsterdam. In 2011, the average daily trading volume of Heineken Holding N.V. shares was 197,768 shares. Heineken Holding N.V. is not a ‘structuurvennootschap’ within the meaning of the Dutch Civil Code.
Market capitalisationShares in issue as at 31 December 2011:288,030,168 ordinary shares of €1.60 nominal value 250 priority shares of €2 nominal value.At a year-end price of €31.62 on 30 December 2011, the market capitalisation of Heineken Holding N.V. as at the balance sheet date was €9.1 billion.
Year-end price €31.62 30 December 2011Highest closing price €38.00 19 May 2011Lowest closing price €27.71 13 September 2011
Substantial shareholdingsPursuant to the Financial Markets Supervision Act (Wet op het financieel toezicht) and the Decree on Disclosure of Major Holdings and Capital Interests in Securities-Issuing Institutions (Besluit melding zeggenschap en kapitaalbelang in uitgevende instellingen), the Authority for the Financial Markets (AFM) has been notified about the following substantial shareholdings regarding Heineken Holding N.V.:• 1 November 2006: Mrs C.L. de Carvalho-Heineken
(52.01%, including a 50.005% shareholding by L’Arche Holding S.A.);*
• 29 September 2009: Davis Investments LLC (6.46% in the ordinary share capital, only 5.84% of the voting rights on these shares);
• 30 April 2010: Voting Trust (FEMSA), through its affiliate CB Equity LLP (14.94%).
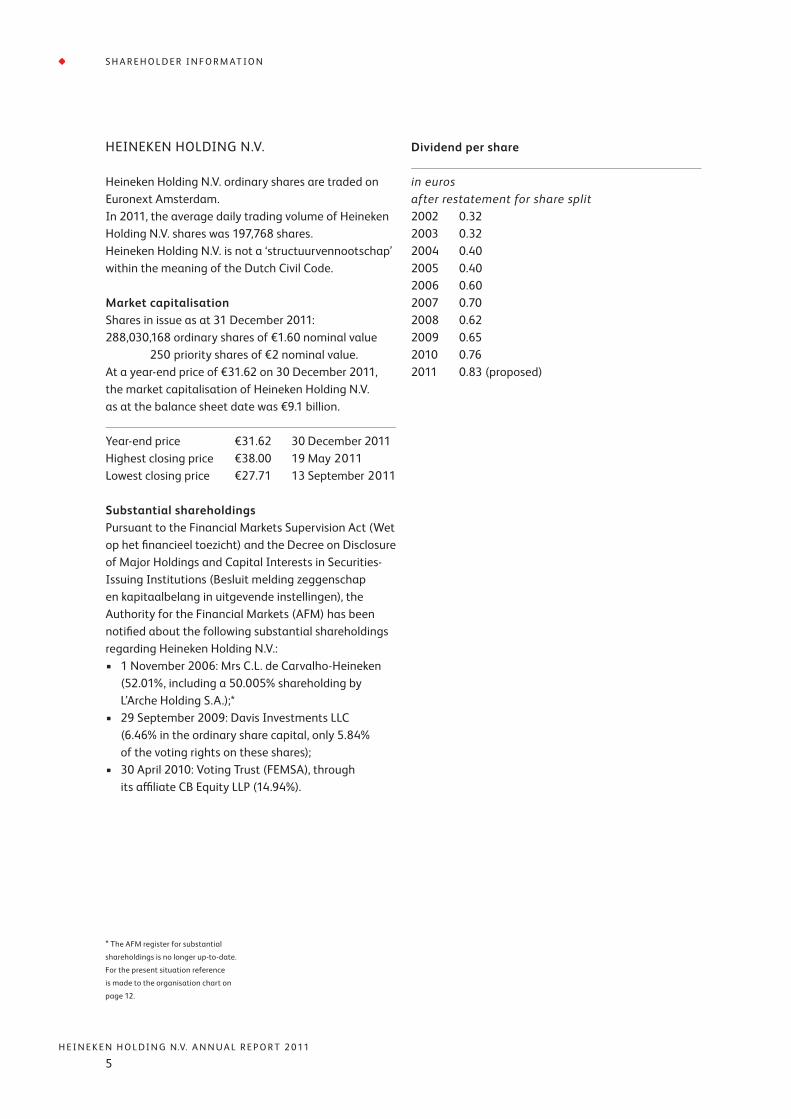
Dividend per share
in euros after restatement for share split2002 0.322003 0.322004 0.402005 0.402006 0.602007 0.702008 0.622009 0.652010 0.76 2011 0.83 (proposed)
* The AFM register for substantial
shareholdings is no longer up-to-date.
For the present situation reference
is made to the organisation chart on
page 12.
S H A R E H O L D E R I N F O R M AT I O N

H E I N E K E N H O L D I N G N .V. A N N U A L R E P O R T 2 0 11
6
HEINEKEN N.V.
The shares of Heineken N.V. are traded on Euronext Amsterdam, where the company is included in the AEX Index. Options on Heineken N.V. shares are listed on Euronext.Liffe Amsterdam.In 2011, the average daily trading volume of Heineken N.V. shares was 1,073,506 shares.Heineken N.V. is not a ‘structuurvennootschap’ within the meaning of the Dutch Civil Code.
Market capitalisationShares in issue as at 31 December 2011:576,002,613 shares of €1.60 nominal value.At a year-end price of €35.77 on 30 December 2011, the market capitalisation of Heineken N.V. as at the balance sheet date was €20.6 billion.
Year-end price €35.77 30 December 2011Highest closing price €43.13 19 May 2011Lowest closing price €32.05 4 October 2011
S H A R E H O L D E R I N F O R M AT I O N
50
45
40
35
30
25
20
15
10
5
0
2002
2003
2004
2005
2006
2007
2008
2009
2010
2011
Netherlands
United Kingdom/Ireland
Rest of Europe
North America
Rest of the world
Domestic and foreign retail
Undisclosed
2010
4.1
16.5
24.4
30.7
3.1
5.5
15.7
100.0
2011
3.8
15.9
22.2
34.0
3.9
5.5
14.7
100.0
2011
2010
35.7
7
Average trade in 2011:
1,073,506 shares per day
Source: Capital Precision
Based on best estimate January 2012
share price range year-end price
Heineken N.V. share pricein eurosEuronext Amsterdamafter restatement for share split
Nationality Heineken N.V. shareholdersin % Based on 234.8 million shares in free float (excluding the holding of Heineken Holding N.V.and FEMSA in Heineken N.V.)

H E I N E K E N H O L D I N G N.V. A N N U A L R E P O R T 2 0 11
7
Substantial shareholdingsPursuant to the Financial Markets Supervision Act (Wet op het financieel toezicht) and the Decree on Disclosure of Major Holdings and Capital Interests in Securities-Issuing Institutions (Besluit melding zeggenschap en kapitaalbelang in uitgevende instellingen), the Authority for the Financial Markets (AFM) has been notified about the following substantial shareholdings regarding Heineken N.V.:• 1 November 2006: Mrs C.L. de Carvalho-Heineken
(indirectly 50.005% through L’Arche Holding S.A.; the direct 50.005% shareholder is Heineken Holding N.V.);1
• 2 February 2010: Massachusetts Financial Services Company (a direct capital interest of 2.12% and a voting interest of 5% of which 2.94% is held directly and 2.06% is held indirectly);
• 30 April 2010: Voting Trust (FEMSA) (indirectly 10.14%; the direct shareholder is CB Equity LLP).1
BondsOn 4 November 2003, Heineken N.V. issued two bonds for a total of €1.1 billion, of which a bond with a face value of €600 million with a maturity date of 4 November 2013 is still outstanding. In September 2008, HEINEKEN established a Euro Medium Term Note (EMTN) Programme which was subsequently updated in September 2009 and September 2010. The programme allows HEINEKEN from time to time to issue Notes. Currently, approximately €1.9 billion of Notes is outstanding under the programme. The programme can be used for issuance up to one year after its latest update. The EMTN Programme and all Heineken N.V. bonds are listed on the Luxembourg Stock Exchange.
Financial calendar in 2012 for both Heineken Holding N.V. and Heineken N.V.
Announcement of 2011 results 15 FebruaryPublication of annual report 2 MarchTrading update first quarter 2012 18 April Annual General Meetingof Shareholders, Amsterdam 2 19 AprilQuotation ex-final dividend 23 AprilFinal dividend 2011 payable 2 MayAnnouncement of half-year results 2012 22 AugustQuotation ex-interim dividend 24 AugustInterim dividend 2012 payable 4 SeptemberTrading update third quarter 2012 24 October
Contacting Heineken Holding N.V. and Heineken N.V.Further information on Heineken Holding N.V. is available by telephone +31 20 622 11 52 or fax +31 20 625 22 13. Information is also available from the Investor Relations department, telephone +31 20 523 95 90 or by e-mail: [email protected] information on Heineken N.V. is available from the Global Corporate Relations and/or Investor Relations department, telephone +31 20 523 95 90 or by e-mail: [email protected] website www.theHEINEKENcompany.com also carries further information about both Heineken Holding N.V. and Heineken N.V.
S H A R E H O L D E R I N F O R M AT I O N
Bonds Issue Total face Interest rate Maturity ISIN code
date value* (%)
Heineken N.V.
Bond 2013 4 November 2003 €600 million 5.0 4 November 2013 XS0179266753
EMTN 2014 6 April 2009 €1 billion 7.125 7 April 2014 XS0421464719
EMTN 2015 10 March 2009 £400 million 7.25 10 March 2015 XS0416081296
EMTN 2016 8 October 2010 €400 million 4.625 10 October 2016 XS0456567055
* The difference versus the amount
displayed in the consolidated statement
of financial position is due
to the amortisation of issue costs.
1 The AFM register for substantial
shareholdings is no longer up-to-date.
For the present situation reference
is made to the organisation chart on
page 12.
2 Shareholders Heineken Holding N.V.
are entitled to attend the meetings
of shareholders in Heineken N.V.,
to put questions at those meetings
and to participate in the discussions.

H E I N E K E N H O L D I N G N .V. A N N U A L R E P O R T 2 0 11
8
Mr M. Das (1948)ChairmanDutch nationalityMember of the Board of Directors since 1994Lawyer
Mrs C.L. de Carvalho-Heineken (1954)Delegate MemberDutch nationalityMember of the Board of Directors since 1988
Mr J.A. Fernández Carbajal (1954)Mexican nationalityMember of the Board of Directors since 2010Chairman and CEO Fomento Económico Mexicano, S.A.B. de C.V. (FEMSA)
Mrs C.M. Kwist (1967)Dutch nationalityMember of the Board of Directors since 2011Brand management, marketing and communications consultant
Mr K. Vuursteen (1941)Dutch nationalityMember of the Board of Directors since 2002Former chairman of the Executive Board of Heineken N.V.
BOARD OF DIRECTORS
H E I N E K E N H O L D I N G N.V. A N N U A L R E P O R T 2 0 11
9
POLICY PRINCIPLES
Heineken Holding N.V. has played an important role in the HEINEKEN group for sixty years. The company seeks to promote the continuity, independence and stability of the HEINEKEN group. This creates the conditions which enable Heineken N.V. to pursue its long-term policy in the interest of the shareholders, the staff and other stakeholders. The company’s policy has been successful. Thanks in part to its unique and stable structure, the HEINEKEN group now has the widest international presence of all the world’s brewing groups and the Heineken brand is one of the best-known international premium lagers.
ACTIVITIES
The Board of Directors met with the Preparatory Committee of the Supervisory Board of Heineken N.V. on seven occasions in 2011. The Board of Directors also met separately on two occasions to discuss, among other things, the Report of the Board of Directors and the financial statements for 2010 and the first half of 2011. Other matters considered during the year included acquisition proposals, opportunities and priorities. The acquisitions of the Sona brewery group in Nigeria, the Bedele and Harar breweries in Ethiopia and the Galaxy pub estate in the UK were discussed. The outcome of the strategic review, including the revised strategic planning cycle and its translation to operations and performance monitoring, was presented to the Board. Important developments affecting the business in various countries were discussed, such as the political situation in North Africa, its impact on the business in the countries concerned and the risks to which Heineken staff were exposed, the trends in raw material prices and the discussions with the UK pension funds. The outcome of the risk review was considered. Other items on the agenda included renewal of the credit facilities and cost control, such as the establishment of Shared Service Centres. A recurrent element in all meetings is a discussion of the results: volumes, revenues and gross profits are reviewed by region and country and a member of the Executive Board of Heineken N.V. outlines conditions in those markets, paying special attention in all cases to the development of the Heineken brand. Dividend proposals are considered at two meetings each year.
REPORT OF THE BOARD OF DIRECTORS
50
45
40
35
30
25
20
15
10
5
0
2002
2003
2004
2005
2006
2007
2008
2009
2010
2011
Heineken Holding N.V. close
Heineken N.V. close
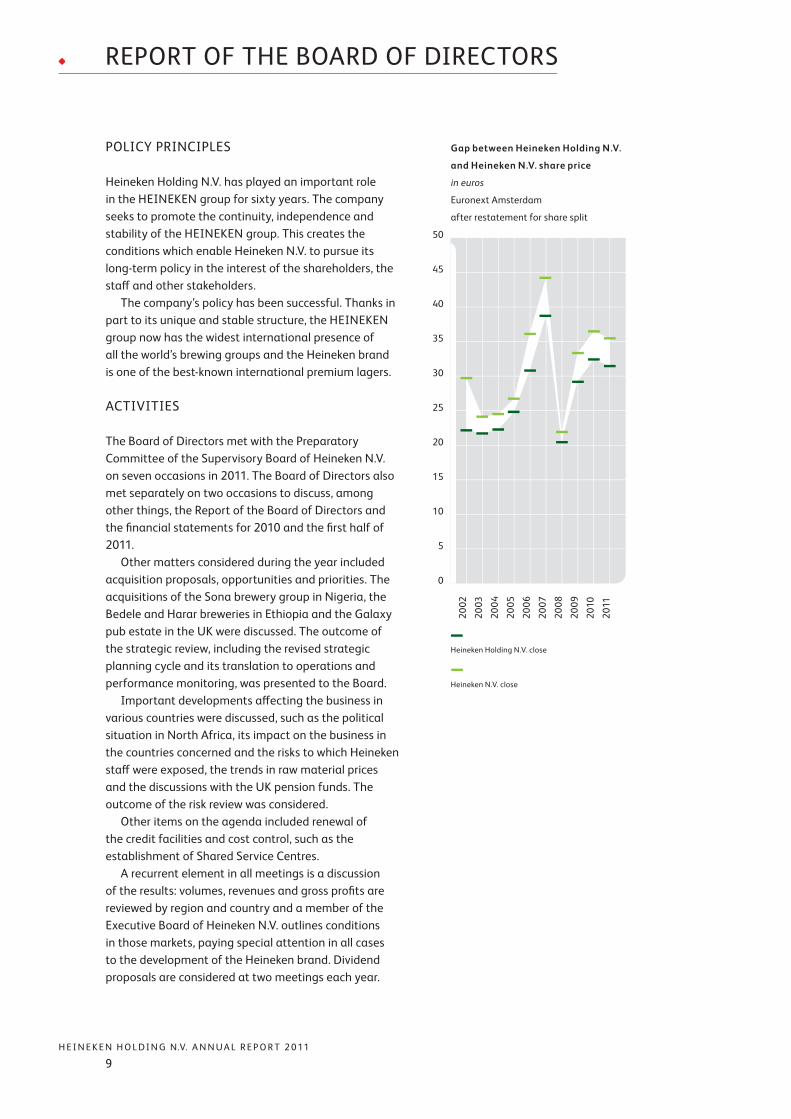
Gap between Heineken Holding N.V.
and Heineken N.V. share price
in euros
Euronext Amsterdam
after restatement for share split

H E I N E K E N H O L D I N G N .V. A N N U A L R E P O R T 2 0 11
10
At one of the meetings of the Board of Directors to consider the directors’ report and the financial statements, the external auditors give a comprehensive report on their activities. The composition of the Supervisory Board and the Executive Board of Heineken N.V. and management development are also recurring items on the agenda. There were informal discussions during the year regarding current business matters on which the opinion of the Board of Directors had been sought. Mrs C.L. de Carvalho-Heineken, delegate member of the Board of Directors, travelled to Sao Paulo in Brazil at the beginning of the year to visit the Heineken sales office. In Asia, she visited the brewery in Vietnam and the sales offices in Taiwan and Hong Kong and opened the brewery in Guanghzhou in China. At the end of the year she visited the brewery in New Zealand. Further information regarding developments during the 2011 financial year affecting Heineken N.V. and its related companies and the material risks faced by those companies is given in Heineken N.V.’s annual report.
REVIEW OF 2011
Share priceThe share price moved up in the first half of the year and in the second half of the year it lost this gain. The gap between the Heineken N.V. and Heineken Holding N.V. share prices moved between 10% and 16%, ending the year at 11.6%. Price movements are shown in the graph on page 9. More information regarding the shares can be found on page 5 of this report.
Interest in Heineken N.V.The nominal value of our company’s interest in Heineken N.V. as at 31 December 2011 was €461 million (31 December 2010: €461 million). The nominal value of the ordinary shares issued by our company as at the same date was also €461 million. As at 31 December 2011, our company’s interest in Heineken N.V. represented 50.005% of the issued capital (being 50.115% of the outstanding capital) of Heineken N.V.
ResultsWith regard to the company’s balance sheet and income statement, the Board of Directors has the following comments.
The Board of Directors has elected to avail itself of the option given by Section 362, subsection 8, of Book 2 of the Dutch Civil Code of using the same accounting policies for the valuation of assets and liabilities and determination of results in the company financial statements as those used for the preparation of the consolidated financial statements of Heineken Holding N.V. Since the interest in Heineken N.V. is measured using the equity method, the equity attributable to the equity holders of Heineken Holding N.V., amounting to €4,804 million, shown in the consolidated statement of financial position, is equal to the shareholders’ equity shown in the company balance sheet less the priority shares. Our company’s 50.115% share in Heineken N.V.’s 2011 profit of €1,430 million is recognised as income of €717 million in the 2011 company income statement. This share in Heineken N.V.’s profit consists of both distributed and retained earnings for 2011.
HEINEKEN N.V. PERFORMANCE IN 2011 AND OUTLOOK
Heineken N.V. posted a net profit of €1,430 million in 2011, driven by organic revenue growth of 3.6%. Higher marketing spend supported the growth in group beer volume and global market share, led primarily by three regions: Central and Eastern Europe, Asia Pacific and Africa and the Middle East. The Total Cost Management programme delivered pre-tax savings of €614 million over its three-year duration. A second cost-saving programme was launched covering 2012-2014. Cost synergies resulted from the acquisition of FEMSA. Substantial free operating cash flow was generated, despite the accelerated share purchase programme in connection with the FEMSA and other acquisitions. In 2012, HEINEKEN expects to benefit from continued positive growth momentum in higher growth economies and from revenue enhancing initiatives in developed markets. In addition, revenue development will continue to be supported by an ongoing shift towards higher growth economies in Africa, Latin America and Asia. The Heineken® brand is expected to continue its strong performance in the international premium segment. The ‘Open Your World’ campaign will be activated around the world. HEINEKEN will also invest in the expansion of its other global brands – Desperados, Strongbow Gold and Amstel – with
R E P O R T O F T H E B O A R D O F D I R E C T O R S

H E I N E K E N H O L D I N G N.V. A N N U A L R E P O R T 2 0 11
11
further planned introductions in new markets in 2012. In addition, Sol, HEINEKEN’s Mexican global priority brand, will be launched internationally from 2012. HEINEKEN expects marketing and selling (beia) expense as a percentage of revenue to remain broadly in line with 2011 (12.8%). HEINEKEN anticipates an approximate 6% increase in input costs per hectolitre, primarily reflecting higher pricing for malted barley. HEINEKEN expects to mitigate this impact through the implementation of planned revenue growth initiatives, as well as ongoing efficiency programmes. Following the successful completion of TCM in 2011, HEINEKEN is introducing a new €500 million cost saving programme (TCM2) that will run from 2012 to 2014 across Supply Chain, Commerce, Wholesale and other functions. TCM2 is focused on driving operational cost efficiencies, and on leveraging HEINEKEN’s increasing global scale, primarily enabled through the Global Business Services (GBS) organisation formed in 2010. The initial scope of GBS will require an upfront investment of approximately €200 million through to the end of 2014, of which €32 million has already been incurred in 2011. These will be reported as part of operating costs. HEINEKEN has made strong progress on the realisation of its targeted €150 million cost synergies related to the acquired beer operations of FEMSA and expects to achieve this during 2012. HEINEKEN expects a further organic decline in the number of employees in 2012. HEINEKEN expects a slight increase in the effective tax rate (beia) in 2012 (2011: 26.8%) and forecasts a slightly higher average interest rate of around 5.5% (2011: 5.2%), primarily reflecting a movement in the currency mix of its debt. Alongside ongoing business capability investments to leverage its global scale, HEINEKEN continues to focus on capital investment in higher growth markets. HEINEKEN plans to increase capital expenditure on property, plant and equipment to approximately €1.25 billion (2011: €800 million) reflecting investment in additional capacity and the renewal and expansion of its returnable bottle fleet in higher growth markets. As a consequence, HEINEKEN expects a cash conversion ratio below 100%. More information is provided in Heineken N.V.’s annual report.
FINANCIAL STATEMENTS AND APPROPRIATION OF PROFIT
The Board of Directors will submit the financial statements for 2011 to the General Meeting of Shareholders. These financial statements, on pages 20 to 128 of this report, have been audited by KPMG Accountants N.V., whose report can be found on page 131. Heineken N.V. proposes to distribute a dividend for 2011 of €0.83 per share of €1.60 nominal value, of which €0.30 per share of €1.60 nominal value has already been paid as interim dividend. With the approval of the meeting of priority share-holders, the Board of Directors has resolved to vote at the General Meeting of Shareholders of Heineken N.V. in favour of Heineken N.V.’s dividend proposal. On that basis, the dividend payable to our company for 2011 totals €239.1 million in cash, of which €86.4 million has already been received by way of interim dividend. The final dividend due will therefore be €152.7 million. In accordance with the provisions of Article 10, paragraph 9, of the Articles of Association, an interim dividend of €0.30 per share of €1.60 nominal value was distributed to holders of ordinary shares on 6 September 2011. Pursuant to the provisions of Article 10 of the Articles of Association, a final dividend of €0.53 per share of €1.60 nominal value currently in issue will be payable to holders of ordinary shares from 2 May 2012. Like the holders of Heineken N.V. shares, holders of ordinary shares will therefore receive a total dividend for 2011 of €0.83 per share of €1.60 nominal value. A total of €239.1 million will be distributed to holders of ordinary shares and a total of €20 (4% of the nominal value of €2 per share) will be distributed as dividend to holders of priority shares. The Annual General Meeting of Shareholders ap point ed the external auditor, KPMG Accountants N.V., in 2008 for a four-year period (financial statements 2008–2011). A performance evaluation review was conducted in 2011. A proposal to reappoint KPMG Accountants N.V. for a further four-year period (financial statements 2012–2015) will be submitted to the Annual General Meeting of Shareholders on 19 April 2012.
CORPORATE GOVERNANCE
On 10 December 2008, a revised Dutch Corporate Governance Code was published (the ‘Code’), referred to in Section 391, subsection 5, of Book 2 of the Dutch Civil Code, superseding the Dutch Corporate Governance
R E P O R T O F T H E B O A R D O F D I R E C T O R S

H E I N E K E N H O L D I N G N .V. A N N U A L R E P O R T 2 0 11
12
by the Hoyer family. The Heineken family also owns a direct 0.03% stake in Heineken Holding N.V. A full description of rights conferred by the priority shares is given in the paragraph headed ‘Further Information pursuant to the Article 10 Takeover Directive Decree’ and the ‘Other Information’ section (page 129) of this annual report. Standing at the head of the HEINEKEN group, Heineken Holding N.V. is not an ordinary holding company. Since its formation in 1952, Heineken Holding N.V.’s main object pursuant to its Articles of Association has been to manage and supervise the management of the HEINEKEN group and to provide services for Heineken N.V., in accordance with the policy principles outlined above. Within the HEINEKEN group, the primary duties of Heineken N.V.’s Executive Board are to initiate and implement corporate strategy and to manage Heineken N.V. and its related enterprise. It is supervised in the performance of its duties by Heineken N.V.’s Supervisory Board.
Heineken Holding N.V.’s governance structure and risk management and control systemHeineken Holding N.V. is managed by its Board of Directors, whose activities are directed towards implementing the policy principles outlined above. Because Heineken N.V. manages the HEINEKEN group companies, Heineken Holding N.V., unlike Heineken N.V., does not have a Supervisory Board or an internal risk management and control system. Heineken Holding N.V. does not engage in any operational activities and employs no staff. The risk management and control system for the business is described in the Heineken N.V. annual report, page 34 and further. Note 32 to the consolidated financial statements of Heineken Holding N.V. itemises the specific financial risks and explains the control systems relating to those risks. Pursuant to Article 10, paragraph 6, of the Articles of Association of Heineken Holding N.V., holders of Heineken Holding N.V. ordinary shares receive the same dividend as holders of Heineken N.V. shares. Within Heineken Holding N.V., there are established rules governing the disclosure of holdings of and transactions in Heineken Holding N.V. and Heineken N.V. shares and other securities that are applicable to the Board of Directors and, where required, other persons directly associated with the company.
Code of 9 December 2003. The Code is available at www.commissiecorporategovernance.nl. While Heineken Holding N.V. endorses the principles of the Code, the structure of the HEINEKEN group, and in particular the relationship between Heineken Holding N.V. and Heineken N.V., prevents Heineken Holding N.V. from applying a number of the Code’s principles and best-practice provisions. At the General Meeting of Shareholders on 20 April 2005, this departure from the Dutch Corporate Governance Code of 9 December 2003 was put to the vote and approved. The departure from the Code (as revised) was discussed at the General Meeting of Shareholders on 22 April 2010.
Structure of the HEINEKEN groupHeineken Holding N.V. has a 50.005% interest in the issued share capital (being 50.115% of the outstanding share capital) of Heineken N.V. Both companies are listed on Euronext Amsterdam. L’Arche Green N.V., a company owned by the Heineken family and the Hoyer family, holds a 51.083% interest in Heineken Holding N.V. The Heineken family holds 88.55% of L’Arche Green N.V. and the remaining 11.45% is held
R E P O R T O F T H E B O A R D O F D I R E C T O R S
Board of Directors
Supervisory Board
Executive Board
Regional Management
Operating Companies
Group Departments
L’Arche Green N.V.
HeinekenHolding N.V.
Public
Public
Heineken N.V. Public
FEMSA
Legal entities Public shareholders Management
51.083% 33.982%
50.005%
14.935%
12.532%
37.463%

H E I N E K E N H O L D I N G N.V. A N N U A L R E P O R T 2 0 11
13
R E P O R T O F T H E B O A R D O F D I R E C T O R S
Compliance with the CodeHeineken Holding N.V. intends to preserve its existing governance structure and does therefore not apply those principles and best-practice provisions which are inconsistent with this structure. For the reasons stated above, Heineken Holding N.V. does not engage in any operational activities, employs no staff, has no internal risk management and control system and has no Supervisory Board. Pursuant to its Articles of Association, Heineken Holding N.V. distributes the dividend it receives from Heineken N.V. in full to its shareholders. Heineken Holding N.V. does not apply principles and best-practice provisions which presume that the actual situation is different. Heineken Holding N.V. will apply best-practice provision II.1.1, which limits the period of appointment and reappointment of a member of the Board of Directors to a maximum of four years. The Annual Meeting of Shareholders on 21 April 2011 appointed Mrs C.M. Kwist as a member of the Board of Directors and reappointed Mrs C.L. de Carvalho-Heineken as delegate member, both for a period of four years. The other members were appointed in previous years for an indefinite period and a rotation schedule has been drawn up under which they will retire or be pro posed for reappointment for a maximum period of four years. This rotation schedule is subject to revision from time to time. The first proposal to reappoint was put to the General Meeting of Share-holders on 21 April 2011. It was proposed that an age limit of 70 years applies in principle, but that an exception of this age limit is possible in individual cases. The same limit and possibility of exception applies to the Supervisory Board of Heineken N.V. In the context of the Code, Heineken Holding N.V. has declared that its Board of Directors is comparable with a Supervisory Board and that, therefore, certain rules pertaining to Boards of Directors are not applied but certain rules pertaining to Supervisory Boards are applied. Heineken Holding N.V. does not apply best-practice provision II.1.8, which limits the number of supervisory directorships of listed companies which may be held by a member of the Board of Directors to a maximum of two and does not permit a member of the Board of Directors to be the chairman of the Supervisory Board of a listed company. The Board of Directors considers this best-practice provision to be inconsistent with the nature of its activities.
Heineken Holding N.V. complies with the other principles and best-practice provisions of the Code.
BOARD OF DIRECTORS
The Board of Directors consists of five members: Chairman Mr M. Das, delegate member Mrs C.L. de Carvalho-Heineken and members Mr J.A. Fernández Carbajal, Mrs C.M. Kwist and Mr K. Vuursteen. The members of the Board of Directors are appointed by the General Meeting of Shareholders from a non-binding list of candidates drawn up by the meeting of priority shareholders. The General Meeting may appoint one of the members as delegate member, who shall be charged in particular with the day-to-day management and the implementation of the Board of Directors’ resolutions. In accordance with the current rotation schedule, Mr K. Vuursteen will stand down at the Annual General Meeting of Shareholders on 19 April 2012. Since members of the Board of Directors may still be eligible for reappointment after reaching the age of 70, the meeting of holders of priority shares has, pursuant to the provisions of Article 7, paragraph 2, of the Articles of Association of the company, drawn up a non-binding nomination of Mr K. Vuursteen for reappointment as a member of the Board of Directors with effect from 19 April 2012, for a period of two years (i.e. until the end of the Annual General Meeting of Shareholders held in 2014). Mr K. Vuursteen was first appointed in 2002. He is a former chairman of the Executive Board of Heineken N.V. The meeting of holders of priority shares proposes to reappoint Mr K. Vuursteen in view of the way he has fulfilled his role as a member of the Board of Directors. The General Meeting of Shareholders can dismiss members of the Board of Directors by an absolute majority of the votes cast which represents at least one-third of the issued capital.
Remuneration policyRemuneration of the members of the Board of Directors was enabled by an amendment to the company’s Articles of Association in 2001. The policy on the remuneration of members of the Board of Directors was approved by the General Meeting of Shareholders in 2005. Under this policy, the members of the Board of Directors receive the same

H E I N E K E N H O L D I N G N .V. A N N U A L R E P O R T 2 0 11
14
R E P O R T O F T H E B O A R D O F D I R E C T O R S
remuneration as the members of the Supervisory Board of Heineken N.V. For 2012, this means €90,000 a year for the chairman and €60,000 a year for the other members of the Board of Directors. More information on how this policy was applied in practice in 2011 can be found in the notes to the consolidated financial statements (see note 35).
GENERAL MEETING OF SHAREHOLDERS
The Annual General Meeting of Shareholders shall be held each year within six months of the end of the financial year, the agenda for which shall, inter alia, include: (i) consideration of the annual report, (ii) consideration and adoption of the financial statements, (iii) discharge of the members of the Board of Directors in respect of their management and (iv) announcement of the appropriation of profit and dividend. General Meetings of Shareholders shall be held in Amsterdam.
Notice of meeting Pursuant to the prevailing provisions of the law, the Board of Directors shall give at least forty-two (42) days’ notice of General Meetings of Shareholders (excluding the date of the meeting, but including the date of the notice of meeting). The Board of Directors is obliged to convene a General Meeting of Shareholders at the request of shareholders who together own at least 25% of the issued share capital. Such meeting shall be held within eight weeks of receipt of the request and shall consider the matters specified by those requesting the meeting.
Right of shareholders to place items on agenda An item that one or more holders of shares which alone or together (i) represent at least one per cent (1%) of the issued capital or (ii) have a value of at least 50 million euros have requested to be placed on the agenda shall be included in the notice of meeting or announced in a similar manner, provided the Board of Directors receives the request in writing, which request is to be furnished with reasons or accompanied by a proposal for a resolution, not later than the 60th day before the date of the General Meeting of Shareholders. If shareholders have requested that an item be placed on the agenda, they shall explain this to the meeting and answer any questions thereon.
Best-practice provision IV.4.4 of the Code states: ‘A shareholder shall exercise the right of placing an item on the agenda only after consultation with the management board. If one or more shareholders intend to request that an item be put on the agenda that may result in a change in the company’s strategy, for example through the dismissal of one or more board members, the management board shall be given the opportunity to stipulate a reasonable period in which to respond (the response period). This shall also apply to an intention as referred to above to seek the authorisation of a court of law to call a General Meeting pursuant Section 2:110 of the Dutch Civil Code. The shareholder shall respect the response period stipulated by the management board within the meaning of best-practice provision II.1.9.’ If the Board of Directors stipulates a response period, that period shall not exceed 180 days from the date on which the Board of Directors is informed by one or more shareholders of their intention to place an item on the agenda to the date of the General Meeting at which the item is to be considered. The Board of Directors shall use the response period for further deliberation and constructive consultation. A response period shall be stipulated only once for any given General Meeting of Shareholders and shall not apply to an item in respect of which a response period has previously been stipulated.
Record date For each General Meeting of Shareholders, a record date for the exercise of the voting rights and attendance at the meeting shall apply. This record date is the 28th day prior to the date of the meeting. The record date shall be included in the notice of meeting, as well as the manner in which those entitled to attend and/or vote at the meeting can be registered and the manner in which they may exercise their rights. Only persons that are shareholders on the record date may attend and vote at the General Meeting of Shareholders.
Attendance by proxy or electronic communication All shareholders are entitled, either in person or represented by a proxy appointed in writing, to attend the General Meeting of Shareholders, to address the meeting and to exercise their voting rights. If shareholders wish to exercise their rights through a proxy appointed in writing, the instrument appoint-ing the proxy must be received by the company no later
H E I N E K E N H O L D I N G N.V. A N N U A L R E P O R T 2 0 11
15
R E P O R T O F T H E B O A R D O F D I R E C T O R S
Shareholders, it shall be cosigned by the chairman of the meeting. Shareholders shall be provided on request with copies of the minutes of the General Meeting of Shareholders not later than three months after the end of the meeting.
Resolutions to be adopted by the General Meeting of ShareholdersThe General Meeting of Shareholders has authority to adopt resolutions concerning among others the following matters: (i) issue of shares by the company or rights attaching to shares (and authorisation of the Board of Directors to resolve that the company issue shares or rights attaching to shares), (ii) authorisation of the Board of Directors to resolve that the company acquire its own shares, (iii) cancellation of shares and reduction of share capital, but only after a motion of the meeting of priority shareholders, (iv) appointment of members of the Board of Directors from a non-binding list of candidates drawn up by the meeting of priority shareholders, (v) appointment of one of the members of the Board of Directors as delegate member, (vi) the remuneration policy for the Board of Directors, (vii) suspension and dismissal of members of the Board of Directors, (viii) adoption of the financial statements, (ix) discharge of the members of the Board of Directors in respect of their management, (x) the profit reservation and distribution policy, (xi) a substantial change in the corporate governance structure, (xii) appointment of the external auditor, (xiii) amendment of the Articles of Association and (xiv) winding-up of the company. Board of Directors’ resolutions on any material change in the nature or identity of the company or enterprise shall be subject to the approval of the meeting of priority shareholders and the General Meeting of Shareholders, in any event including resolutions relating to (a) transfer of all or virtually all of the company’s enterprise to a third party, (b) entry into or termination of lasting cooperation between the company or a subsidiary and another legal entity or partnership or as general partner in a limited partnership or general partnership where such cooperation or termination thereof has material significance for the company and (c) acquisition or disposal by the company or a subsidiary of an interest in the capital of another company amounting to one-third or more of the company’s assets as disclosed in its consolidated statement of financial position and notes thereto according to its most recently adopted financial statements.
than the date stated for that purpose in the notice of meeting. The Board of Directors may determine that the powers set out in the previous sentence may also be exercised by means of electronic communication. The Board of Directors may impose certain conditions on the use of electronic communications, which will in that case be stated in the notice of meeting.
Attendance registerAll persons present at a General Meeting of Shareholders entitled to vote or otherwise entitled to attend, or their representatives shall sign the attendance register, stating the number of shares and votes represented.
Chairman of the General Meeting of ShareholdersAll General Meetings of Shareholders shall be presided over by the chairman of the Board of Directors or, in his absence, by one of the members of the Board of Directors present at the meeting, to be appointed by the latter in consultation. If none of the members of the Board of Directors is present, the meeting shall appoint its own chairman.
VotingAdoption of resolutions at all General Meetings of Shareholders shall require an absolute majority of the votes cast, except where a larger majority is required by law or the Articles of Association. Each share confers the entitlement to cast one vote. Blank votes shall be deemed not to have been cast. When convening a General Meeting of Shareholders, the Board of Directors may determine that votes cast electronically in advance of the meeting are to be equated to votes cast in the course of the meeting. Such votes may not be cast prior to the record date. A shareholder who has voted electronically in advance of a General Meeting of Shareholders shall still be entitled to attend and address the meeting, either in person or represented by a proxy appointed in writing. Once cast, a vote cannot be retracted.
MinutesMinutes shall be kept of the proceedings of General Meetings of Shareholders by a secretary appointed by the chairman. The minutes shall be adopted by the chairman and the secretary and shall be signed by them in evidence thereof. If a notarial record is made of the proceedings of a General Meeting of

H E I N E K E N H O L D I N G N .V. A N N U A L R E P O R T 2 0 11
16
On the other hand, the proposal introduces a formal one-tier board structure. The Board of Directors already functions as a one-tier board, with one delegate member also having an executive role and the other members being non-executive. The proposal envisages bringing the formal board structure into line with the existing de facto structure. Among other things, the Act on Management and Supervision will also impose a mandatory maximum limit on the number of supervisory positions a person can hold in Dutch ‘large entities’. An executive director of a Dutch ‘large entity’ may hold no more than two such positions, neither of which may be that of chairman. Holders of a supervisory position in a Dutch ‘large entity’ may hold a maximum of five such positions, with a chairmanship counting twice. Since Heineken Holding N.V. will be deemed to be a ‘large entity’, all members of the Board of Directors will be subject to the lower maximum and will thus be permitted to hold only two supervisory positions in other Dutch ‘large entities’, neither of which may be a chairmanship. Converting the Board of Directors into a formal one-tier board means that managerial and supervisory duties can be further allocated among its individual members. Those members then holding only supervisory positions will be subject to the higher maximum number of supervisory positions. This will avoid placing Heineken Holding N.V. at a serious disadvantage in recruiting and retaining qualified members of the Board of Directors. If the proposal to amend the Articles of Association is approved, the meeting of holders of priority shares proposes the following titles for the incumbent board members:C.L. de Carvalho-Heineken executive directorM. Das non-executive director (chairman)J.A. Fernández Carbajal non-executive directorC.M. Kwist non-executive directorK. Vuursteen non-executive director
The proposal also includes authorisation to execute the notarial deed of amendment of the Articles of Association. The amendments to the Articles of Association will come into force upon execution of this notarial deed. The full text containing the proposed amendments can be obtained at the company’s offices and shall also be available on the website www.theHEINEKENcompany.com.
Provision of informationThe Board of Directors shall provide the General Meeting of Shareholders with all the information it may require, unless there are compelling reasons to withhold it in the company’s interest. If the Board of Directors withholds information on the grounds of the company’s interest, it shall give its reasons for doing so.
Priority sharesThe company has issued 250 priority shares, 50% of which are held by Stichting Administratiekantoor Priores, the other 50% being held by Stichting Beheer Prioriteitsaandelen Heineken Holding N.V. A full description of rights conferred by the priority shares is given in the paragraph headed ‘Further Information pursuant to the Article 10 Takeover Directive Decree’ and the ‘Other Information’ section (page 129) of this annual report.
Proposal to amend the Articles of AssociationThe company has prepared a proposal to amend its Articles of Association. The proposal will be included in the agenda for the upcoming Annual General Meeting of Shareholders of the company on 19 April 2012. The proposal contains two substantial changes. On the one hand, it relates mainly to the new conflict of interest provisions of the Act on Manage-ment and Supervision (Wet Bestuur en Toezicht), which is expected to come into force on 1 July 2012 and amendments to the Giro Securities Transactions Act (Wet Giraal Effectenverkeer) which came into force on 1 July 2011. It is, inter alia, proposed to amend the form of the shares held as giro securities from bearer (currently represented by one global share certificate) into registered shares. This will imply that Euroclear Nederland will be registered in Heineken Holding N.V.’s shareholders register. Under the Giro Securities Transactions Act, the account holders at securities intermediaries (intermediairs), such as banks and investment firms, will remain the actual shareholders (deelgenoten). The current registered shares (which are held outside the giro system and are registered in Heineken Holding N.V.’s shareholders register) will continue to exist in this form. These shares can (but do not have to) be exchanged for registered giro securities. Under the Giro Securities Transactions Act it is, subject to certain very specific exemptions, not possible to exchange giro securities (whether registered or bearer) for registered shares held outside the giro system.
R E P O R T O F T H E B O A R D O F D I R E C T O R S

H E I N E K E N H O L D I N G N.V. A N N U A L R E P O R T 2 0 11
17
Pursuant to the Financial Markets Supervision Act (Wet op het financieel toezicht) and the Decree on Disclosure of Major Holdings and Capital Interests in Securities-Issuing Institutions (Besluit melding zeggenschap en kapitaalbelang in uitgevende instellingen), the Authority for the Financial Markets (AFM) has been notified of the following substantial shareholdings in Heineken Holding N.V.:• 1 November 2006: Mrs C.L. de Carvalho-Heineken
(52.01%, including a 50.005% shareholding by L’Arche Holding S.A.);*
• 29 September 2009: Davis Investments LLC (6.46% in the ordinary share capital, only 5.84% of the voting rights on these shares);
• 30 April 2010: Voting Trust (FEMSA), through its affiliate CB Equity LLP (14.94%).
There are no restrictions on the voting rights on ordinary shares. Heineken Holding N.V. has no staff share plan or options plan. Heineken Holding N.V. is not aware of any agreement with a shareholder which might give rise to the restriction of voting rights. Persons who hold shares on a predetermined record date may attend and exercise their voting rights at general meetings of shareholders. The record date for the General Meeting of Shareholders on 19 April 2012 has been set 28 days before the General Meeting of Shareholders, i.e. on 22 March 2012. The members of the Board of Directors are appointed by the General Meeting of Shareholders from a non-binding list of candidates drawn up by the meeting of priority shareholders. Members of the Board of Directors may be suspended or dismissed by the General Meeting of Shareholders at any time by a resolution adopted by an absolute majority of the votes cast which represents at least one-third of the issued capital. The Articles of Association may be amended by a resolution adopted on a motion of the meeting of priority shareholders by a General Meeting of Share-holders at which at least half of the issued capital is represented. A resolution to amend the Articles of Association must in all cases be stated in the notice of meeting and a copy of the resolution must be deposited simultaneously at the company’s offices for
FURTHER INFORMATION PURSUANT TO THE ARTICLE 10 TAKEOVER DIRECTIVE DECREE
Heineken Holding N.V.’s issued and outstanding capital (the ‘Capital’) consists of 288,030,168 ordinary shares (representing 99.99% of the Capital) with a nominal value of €1.60 and 250 priority shares (representing 0.01% of the Capital) with a nominal value of €2. The priority shares are registered. The meeting of holders of priority shares has the right to draw up a non-binding list of candidates for each appointment to the Board of Directors by the General Meeting of Shareholders. The approval of the meeting of the holders of priority shares is required for resolutions of the Board of Directors relating to the exercise of voting rights on shares in public limited liability companies and other legal entities and the direction in which such votes are to be cast. Pursuant to Section 107a of Book 2 of the Dutch Civil Code and the Articles of Association of the company, the approval of both the meeting of the holders of priority shares and the General Meeting of Shareholders is required for resolutions of the Board of Directors relating to any material change in the nature or identity of the company or the enterprise, in any event including and subject to the statutory limits, resolutions relating to the transfer of all or virtually all of the company’s enterprise to a third party, entry into or termination of lasting cooperation between the company or a subsidiary and another legal entity and acquisition or disposal by the company or a subsidiary of a substantial interest in the capital of another company. Shares are issued pursuant to a resolution of the General Meeting of Shareholders, without prejudice to its right to delegate that authority. Such a resolution requires that prior or simultaneous approval be given by resolution of the meeting of holders of shares of the same class as that to which the issue relates, except in the case of stock dividends, bonus shares or rights issues which the company is required to distribute pursuant to Article 10 of the Articles of Association. Fully paid ordinary shares in its own capital may only be acquired by the company for no consideration or if (a) the shareholders’ equity minus the purchase price is not less than the sum of the paid-in and called capital and the reserves prescribed by law and (b) the nominal amount of own shares to be acquired does not exceed half of the issued capital.
R E P O R T O F T H E B O A R D O F D I R E C T O R S
* The AFM register for substantial
shareholdings is no longer up-to-date.
For the present situation reference
is made to the organisation chart
on page 12.

2011H E I N E K E N H O L D I N G N .V. A N N U A L R E P O R T 2 0 11
18
inspection. If the required capital is not represented at the meeting, a second General Meeting of Shareholders must be held within four weeks of that meeting, at which a resolution to amend the Articles of Association may be adopted irrespective of the capital represented. The Annual General Meeting of Shareholders on 21 April 2011 extended, for the statutory maximum period of 18 months, commencing on 21 April 2011, the authorisation which it had granted to the Board of Directors on 22 April 2010 to acquire own shares subject to the following conditions and with due observance of the law and the Articles of Association:a the maximum number of shares which may be
acquired is 10% of the issued share capital of the company;
b transactions must be executed at a price between the nominal value of the shares and 110% of the opening price quoted for the shares in the Official Price List (Officiële Prijscourant) of Euronext Amsterdam on the date of the transaction or, in the absence of such a price, the latest price quoted therein;
c transactions may be executed on the stock exchange or otherwise.
The Annual General Meeting of Shareholders on 21 April 2011 also extended, for a period of 18 months, commencing on 21 April 2011, the authorisation which it had granted to the Board of Directors on 22 April 2010 to issue shares or grant rights to subscribe for shares, with due observance of the law and the Articles of Association. The authorisation is limited to 10% of the issued share capital of the company on the date of issue.
The Annual General Meeting of Shareholders on 21 April 2011 also extended, for a period of 18 months, commencing on 21 April 2011, the authorisation which it had granted to the Board of Directors on 22 April 2010 to restrict or exclude shareholders’ pre-emptive rights in relation to the issue of shares or the granting of rights to subscribe for shares, with due observance of the law and the Articles of Association. There are no agreements under which Heineken Holding N.V. is liable to make any payment to members of the Board of Directors or employees on termination of employment following a public offer for all the shares.
Amsterdam, 14 February 2012
Board of DirectorsMr M. DasMrs C.L. de Carvalho-HeinekenMr J.A. Fernández CarbajalMrs C.M. KwistMr K. Vuursteen
R E P O R T O F T H E B O A R D O F D I R E C T O R S

2011FINANCIAL STATEMENTS 2011

H E I N E K E N H O L D I N G N .V. A N N U A L R E P O R T 2 0 11
20
BALANCE SHEET OF HEINEKEN HOLDING N.V.
31 December 2011 31 December 2010*Assets
4,804 4,553
Financial fixed assets
Participating interest in Heineken N.V. note I
– –
Current assets
Cash note II
4,804 4,553
* Comparatives have been adjusted
due to the accounting policy change
(see notes to the balance sheet and
the income statement).
before appropriation of profitin millions of euros

F I N A N C I A L S TAT E M E N T S 2 0 11
21
B A L A N C E S H E E T O F H E I N E K E N H O L D I N G N .V.
31 December 2011 31 December 2010*Equity and liabilities
– –
Shareholders’ equity
Issued capital:
Priority shares
Ordinary shares 461 461
461 461
Share premium 1,257 1,257
Translation reserve (288) (46)
Hedging reserve (34) (13)
Fair value reserve 80 45
Other legal reserves 514 450
Retained earnings 2,097 1,673
Profit for the year 717 726
note III 4,804 4,553
– –
Current liabilities
Other payables
4,804 4,553

H E I N E K E N H O L D I N G N .V. A N N U A L R E P O R T 2 0 11
22
INCOME STATEMENT OF HEINEKEN HOLDING N.V.
in millions of euros
2011 2010*Share in result of participating interest
in Heineken N.V. after income tax note IV 717 726
Other revenues and expenses after
income tax note V – –
Profit 717 726
* Comparatives have been adjusted
due to the accounting policy change
(see notes to the balance sheet and
the income statement).

F I N A N C I A L S TAT E M E N T S 2 0 11
23
NOTES TO THE BALANCE SHEET AS AT 31 DECEMBER 2011 AND THE INCOME STATEMENT FOR 2011 OF HEINEKEN HOLDING N.V.
Reporting entityHeineken Holding N.V. (the ‘Company’) is a company domiciled in the Netherlands.
Basis of preparation The Company financial statements have been prepared in accordance with the provisions of Part 9 of Book 2 of the Dutch Civil Code. The Company uses the option of Section 362, subsection 8, of Book 2 of the Dutch Civil Code to prepare the Company financial statements on the basis of the same accounting principles as those applied for the consolidated financial statements. These consolidated financial statements are prepared in accordance with International Financial Reporting Standards (IFRS) as endorsed by the European Union (EU) and also comply with the financial reporting requirements included in Part 9 of Book 2 of the Dutch Civil Code. Only IFRSs adopted by the EU have been applied in preparation of the consolidated financial statements. For a further description of these principles see the notes to the consolidated financial statements. Heineken Holding N.V. presents a condensed income statement, using the exemption of Article 402 of Book 2 of the Dutch Civil Code. The amounts disclosed in the notes to the balance sheet and income statement are in millions of euros, unless otherwise indicated. The financial statements have been prepared by the Board of Directors of the Company and authorised for issue on 14 February 2012 and will be submitted for adoption to the Annual General Meeting of Shareholders on 19 April 2012.
Change in accounting policyOn 1 January 2011 Heineken Holding N.V. changed its accounting policy with respect to the recognition of actuarial gains and losses arising from defined benefit plans. For further explanation, see note 2e to the consolidated financial statements.
Significant accounting policies
Financial fixed assetsParticipating interests, over which significant influence is exercised, are measured on basis of the equity method.
Shareholders’ equityThe translation reserve and other legal reserves are previously formed under and still recognised in accordance with the Dutch Civil Code.
Profit of participating interestsThe share in the result of participating interests consists of the share of the Company in the result of these participating interests.
note I PARTICIPATING INTEREST IN HEINEKEN N.V.
The interest of Heineken Holding N.V. in Heineken N.V. is 50.005% of the issued capital (being 50.115% (2010: 50.147%) of the outstanding capital following the purchase of own shares by Heineken N.V.). The nominal value of the Heineken N.V. shares held by the Company amounted to €461 million as at 31 December 2011 (€461 million as at 31 December 2010).

H E I N E K E N H O L D I N G N .V. A N N U A L R E P O R T 2 0 11
24
N O T E S T O T H E B A L A N C E S H E E T A S AT 31 D E C E M B E R 2 0 11 A N D T H E I N C O M E S TAT E M E N T F O R 2 0 11
O F H E I N E K E N H O L D I N G N .V.
note II CASH
This item relates to the balances as at balance sheet date on a current account and a deposit account relating to the priority shares.
Balance as at 1 January 2010 2,682
Policy change (199)
Restated balance as at 1 January 2010 2,483
50.147% of the profit of Heineken N.V. 726
Dividend payments received by Heineken Holding N.V. (173)
Declaration ASDI dividends (3)
Shares issued 1,326
Movements in translation reserve 180
Movements cash flow hedges 49
Movements fair value adjustments (5)
Actuarial gains and losses 45
Purchase own shares by Heineken N.V. ASDI (10)
Own shares granted by Heineken N.V.
(including dilution effect) 4
Share-based payments by Heineken N.V. 8
Purchase mandate Heineken N.V. shares (48)
Movement because of changes in consolidation (29)
Balance as at 31 December 2010 4,553
Balance as at 1 January 2011 4,553
50.115% of the profit of Heineken N.V. 717
Dividend payments received by Heineken Holding N.V. (230)
Declaration ASDI dividends (8)
Shares issued –
Movements in translation reserve (242)
Movements cash flow hedges (21)
Movements fair value adjustments 35
Actuarial gains and losses (46)
Purchase own shares by Heineken N.V. ASDI (11)
Own shares granted by Heineken N.V.
(including dilution effect) (3)
Share-based payments by Heineken N.V. 6
Purchase mandate Heineken N.V. shares 48
Movement because of changes in consolidation 6
Balance as at 31 December 2011 4,804
Valuation of the participating interest in Heineken N.V. is based on 50.115% of the shareholders’ equity published by Heineken N.V. in its financial statements. The market capitalisation of the participating interest in Heineken N.V. as at 31 December 2011 amounted to €10.3 billion (31 December 2010: €10.6 billion).

F I N A N C I A L S TAT E M E N T S 2 0 11
25
N O T E S T O T H E B A L A N C E S H E E T A S AT 31 D E C E M B E R 2 0 11 A N D T H E I N C O M E S TAT E M E N T F O R 2 0 11
O F H E I N E K E N H O L D I N G N .V.
Issued Share Translation Hedging Fair value Other legal Retained Profit for Total
capital premium reserve reserve reserve reserves earnings the year equity 1
Balance as at 1 January 2010 392 – (226) (62) 50 338 1,680 510 2,682
Policy change – – – – – – (199) – (199)
Restated balance as at
1 January 2010 392 – (226) (62) 50 338 1,481 510 2,483
Other comprehensive income 2 – – 180 49 (5) – 45 – 269
Profit for the year – – – – – 159 (159) 726 726
Total comprehensive income – – 180 49 (5) 159 (114) 726 995
Transfer of profit to retained earnings – – – – – – 510 (510) –
Transfer between reserves – – – – – (47) 47 – –
Dividends to shareholders – – – – – – (173) – (173)
Declaration ASDI dividends – – – – – – (3) – (3)
Shares issued 69 1,257 – – – – – – 1,326
Purchase own shares by Heineken N.V.
ASDI – – – – – – (10) – (10)
Own shares granted by Heineken N.V. – – – – – – 4 – 4
Share-based payments by Heineken N.V. – – – – – – 8 – 8
Purchase mandate Heineken N.V. shares – – – – – – (48) – (48)
Changes in consolidation – – – – – – (29) – (29)
Balance as at 31 December 2010 461 1,257 (46) (13) 45 450 1,673 726 4,553
Balance as at 1 January 2011 461 1,257 (46) (13) 45 450 1,673 726 4,553
Other comprehensive income 2 – – (242) (21) 35 – (46) – (274)
Profit for the year – – – – – 127 (127) 717 717
Total comprehensive income – – (242) (21) 35 127 (173) 717 443
Transfer of profit to retained earnings – – – – – – 726 (726) –
Transfer between reserves – – – – – (63) 63 – –
Dividends to shareholders – – – – – – (230) – (230)
Declaration ASDI dividends – – – – – – (8) – (8)
Shares issued – – – – – – – – –
Purchase own shares by Heineken N.V.
ASDI – – – – – – (11) – (11)
Own shares granted by Heineken N.V. – – – – – – (3) – (3)
Share-based payments by Heineken N.V. – – – – – – 6 – 6
Purchase mandate Heineken N.V. shares – – – – – – 48 – 48
Changes in consolidation – – – – – – 6 – 6
Balance as at 31 December 2011 461 1,257 (288) (34) 80 514 2,097 717 4,804
1 Total equity attributable to equity
holders of Heineken Holding N.V.2 Net income recognised directly
in equity is explained in the
consolidated statement of
comprehensive income.
For further explanation reference is made to note 22 to the consolidated financial statements.
note III SHAREHOLDERS’ EQUITY
H E I N E K E N H O L D I N G N .V. A N N U A L R E P O R T 2 0 11
2626
N O T E S T O T H E B A L A N C E S H E E T A S AT 31 D E C E M B E R 2 0 11 A N D T H E I N C O M E S TAT E M E N T F O R 2 0 11
O F H E I N E K E N H O L D I N G N .V.
note IV SHARE IN RESULT OF PARTICIPATING INTEREST IN HEINEKEN N.V. AFTER INCOME TAX
Included here is the share in the profit of Heineken N.V. for 2011, being 50.115% of €1,430 million (2010: 50.147% of €1,447 million).
note V OTHER REVENUES AND EXPENSES AFTER INCOME TAX
Expenses made to manage and provide services to Heineken N.V. amounting to €587 thousand (2010: €7.4 million) are reimbursed by Heineken N.V. to Heineken Holding N.V. in accordance with the management agreement. The decrease in comparison to 2010 was caused by the acquisition of FEMSA and related services performed by Heineken Holding N.V. in 2010. The remuneration of the Board of Directors is disclosed in note 35 to the consolidated financial statements.
F I N A N C I A L S TAT E M E N T S 2 0 11
27
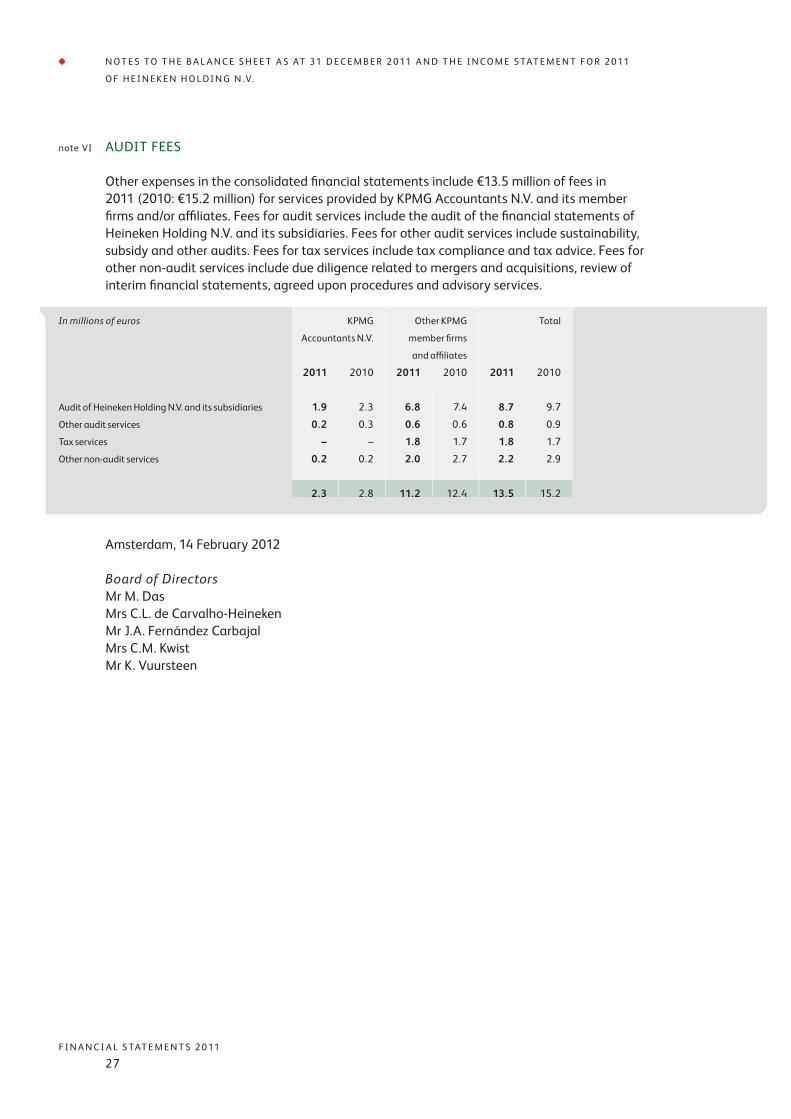
note VI AUDIT FEES
Other expenses in the consolidated financial statements include €13.5 million of fees in 2011 (2010: €15.2 million) for services provided by KPMG Accountants N.V. and its member firms and/or affiliates. Fees for audit services include the audit of the financial statements of Heineken Holding N.V. and its subsidiaries. Fees for other audit services include sustainability, subsidy and other audits. Fees for tax services include tax compliance and tax advice. Fees for other non-audit services include due diligence related to mergers and acquisitions, review of interim financial statements, agreed upon procedures and advisory services.
Amsterdam, 14 February 2012
Board of DirectorsMr M. DasMrs C.L. de Carvalho-HeinekenMr J.A. Fernández CarbajalMrs C.M. KwistMr K. Vuursteen
In millions of euros KPMG
Accountants N.V.
Other KPMG
member firms
and affiliates
Total
2011 2010 2011 2010 2011 2010
Audit of Heineken Holding N.V. and its subsidiaries 1.9 2.3 6.8 7.4 8.7 9.7
Other audit services 0.2 0.3 0.6 0.6 0.8 0.9
Tax services – – 1.8 1.7 1.8 1.7
Other non-audit services 0.2 0.2 2.0 2.7 2.2 2.9
2.3 2.8 11.2 12.4 13.5 15.2
N O T E S T O T H E B A L A N C E S H E E T A S AT 31 D E C E M B E R 2 0 11 A N D T H E I N C O M E S TAT E M E N T F O R 2 0 11
O F H E I N E K E N H O L D I N G N .V.

H E I N E K E N H O L D I N G N .V. A N N U A L R E P O R T 2 0 11
28
in millions of euros
2011 2010*Revenue note 5 17,123 16,133
Other income note 8 64 239
Raw materials, consumables and services note 9 (10,966) (10,291)
Personnel expenses note 10 (2,838) (2,665)
Amortisation, depreciation and impairments note 11 (1,168) (1,118)
Total expenses (14,972) (14,074)
Results from operating activities 2,215 2,298
Interest income note 12 70 100
Interest expenses note 12 (494) (590)
Other net finance income/(expenses) note 12 (6) (19)
Net finance expenses (430) (509)
Share of profit of associates and joint
ventures and impairments thereof
(net of income tax) note 16 240 193
Profit before income tax 2,025 1,982
Income tax expenses note 13 (465) (403)
Profit 1,560 1,579
Attributable to:
Equity holders of Heineken Holding N.V.
(net profit) 717 726
Non-controlling interests in Heineken N.V. 713 721
Non-controlling interests in Heineken N.V.
group companies 130 132
Profit 1,560 1,579
Weighted average number of ordinary
shares – basic 288,030,168 273,690,728note 23
Weighted average number of ordinary
shares – diluted 288,030,168 273,690,728note 23
Basic earnings per ordinary share (€) note 23 2.49 2.65
Diluted earnings per ordinary share (€) note 23 2.49 2.65
* Comparatives have been adjusted
due to the accounting policy change
in employee benefits (see note 2e).
CONSOLIDATED INCOME STATEMENT

F I N A N C I A L S TAT E M E N T S 2 0 11
29
2011 2010*Profit 1,560 1,579
Other comprehensive income:
Foreign currency translation differences for
foreign operations note 24 (493) 390
Effective portion of change in fair value of
cash flow hedges note 24 (21) 43
Effective portion of cash flow hedges
transferred to profit or loss note 24 (11) 45
Ineffective portion of cash flow hedges note 24 – 9
Net change in fair value available-for-sale
investments note 24 71 11
Net change in fair value available-for-sale
investments transferred to profit or loss (1) (17)note 24
Actuarial gains and losses note 24/28 (93) 99
Share of other comprehensive income of
associates/joint ventures (5) (29)note 24
Other comprehensive income, net of tax note 24 (553) 551
Total comprehensive income 1,007 2,130
Attributable to:
Equity holders of Heineken Holding N.V. 443 995
Non-controlling interests in Heineken N.V. 441 988
Non-controlling interests in Heineken N.V.
group companies 123 147
Total comprehensive income 1,007 2,130
* Comparatives have been adjusted
due to the accounting policy change
in employee benefits (see note 2e).
in millions of euros
CONSOLIDATED STATEMENT OF COMPREHENSIVE INCOME

H E I N E K E N H O L D I N G N .V. A N N U A L R E P O R T 2 0 11
30
31 December 2011 31 December 2010*Assets
Non-current assets
Property, plant & equipment note 14 7,860 7,687
Intangible assets note 15 10,835 10,890
Investments in associates and joint ventures note 16 1,764 1,673
Other investments and receivables note 17 1,129 1,103
Advances to customers note 32 357 449
Deferred tax assets note 18 474 542
22,419 22,344
Current assets
Inventories note 19 1,352 1,206
Other investments note 17 14 17
Trade and other receivables note 20 2,260 2,273
Prepayments and accrued income 170 206
Cash and cash equivalents note 21 813 610
Assets classified as held for sale note 7 99 6
4,708 4,318
27,127 26,662
* Comparatives have been adjusted
due to the accounting policy change
in employee benefits (see note 2e).
in millions of euros
CONSOLIDATED STATEMENT OF FINANCIAL POSITION
F I N A N C I A L S TAT E M E N T S 2 0 11
31
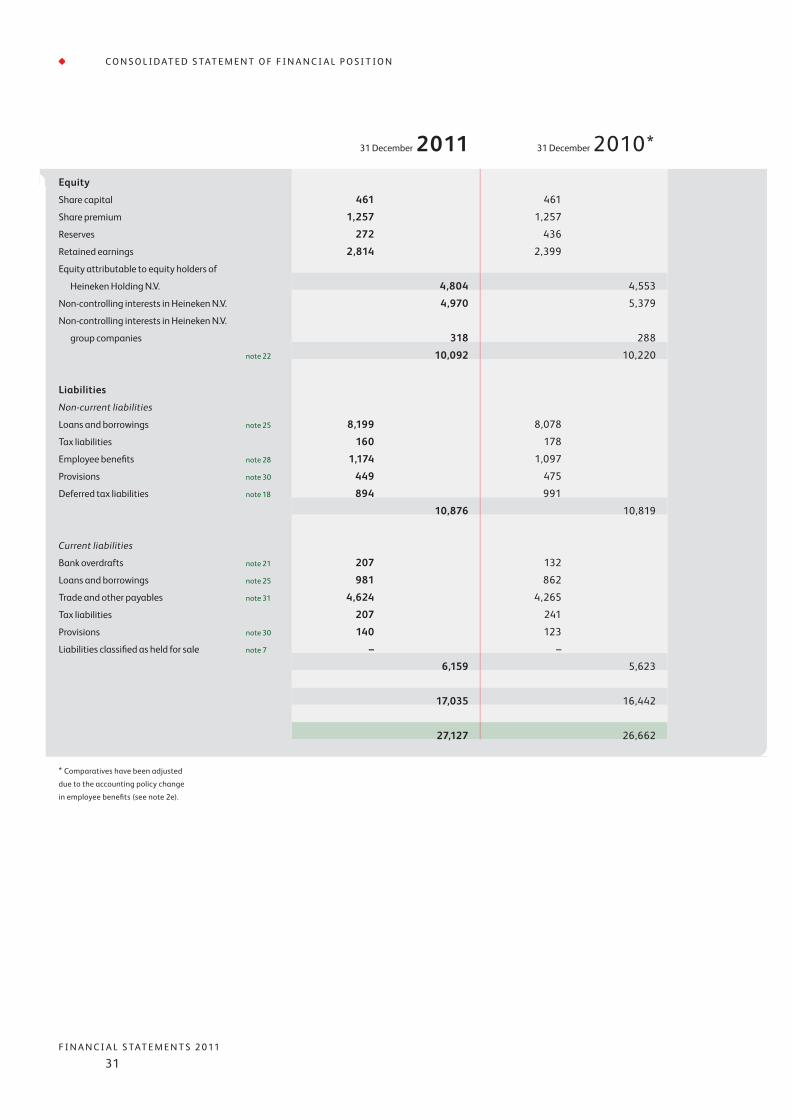
C O N S O L I D AT E D S TAT E M E N T O F F I N A N C I A L P O S I T I O N
31 December 2011 31 December 2010*Equity
Share capital 461 461
Share premium 1,257 1,257
Reserves 272 436
Retained earnings 2,814 2,399
Equity attributable to equity holders of
Heineken Holding N.V. 4,804 4,553
Non-controlling interests in Heineken N.V. 4,970 5,379
Non-controlling interests in Heineken N.V.
group companies 318 288
note 22 10,092 10,220
Liabilities
Non-current liabilities
Loans and borrowings note 25 8,199 8,078
Tax liabilities 160 178
Employee benefits note 28 1,174 1,097
Provisions note 30 449 475
Deferred tax liabilities note 18 894 991
10,876 10,819
Current liabilities
Bank overdrafts note 21 207 132
Loans and borrowings note 25 981 862
Trade and other payables note 31 4,624 4,265
Tax liabilities 207 241
Provisions note 30 140 123
Liabilities classified as held for sale note 7 – –
6,159 5,623
17,035 16,442
27,127 26,662
* Comparatives have been adjusted
due to the accounting policy change
in employee benefits (see note 2e).

H E I N E K E N H O L D I N G N .V. A N N U A L R E P O R T 2 0 11
32
2011 2010*Operating activities
Profit 1,560 1,579
Adjustments for:
Amortisation, depreciation and impairments note 11 1,168 1,118
Net interest expenses note 12 424 490
Gain on sale of property, plant & equipment,
intangible assets and subsidiaries,
joint ventures and associates note 8 (64) (239)
Investment income and share of profit
and impairments of associates and
joint ventures and dividend income
on available-for-sale investments and
investments held for trading (252) (200)
Income tax expenses note 13 465 403
Other non-cash items 244 163
Cash flow from operations before changes
in working capital and provisions 3,545 3,314
Change in inventories (145) 95
Change in trade and other receivables (21) 515
Change in trade and other payables 417 (156)
Total change in working capital 251 454
Change in provisions and employee benefits (76) (220)
Cash flow from operations 3,720 3,548
Interest paid (485) (554)
Interest received 65 15
Dividend received 137 91
Income taxes paid (526) (443)
Cash flow related to interest, dividend
and income tax (809) (891)
Cash flow from operating activities 2,911 2,657
* Comparatives have been adjusted
due to the accounting policy change
in employee benefits (see note 2e).
in millions of euros
CONSOLIDATED STATEMENT OF CASH FLOWS
F I N A N C I A L S TAT E M E N T S 2 0 11
33
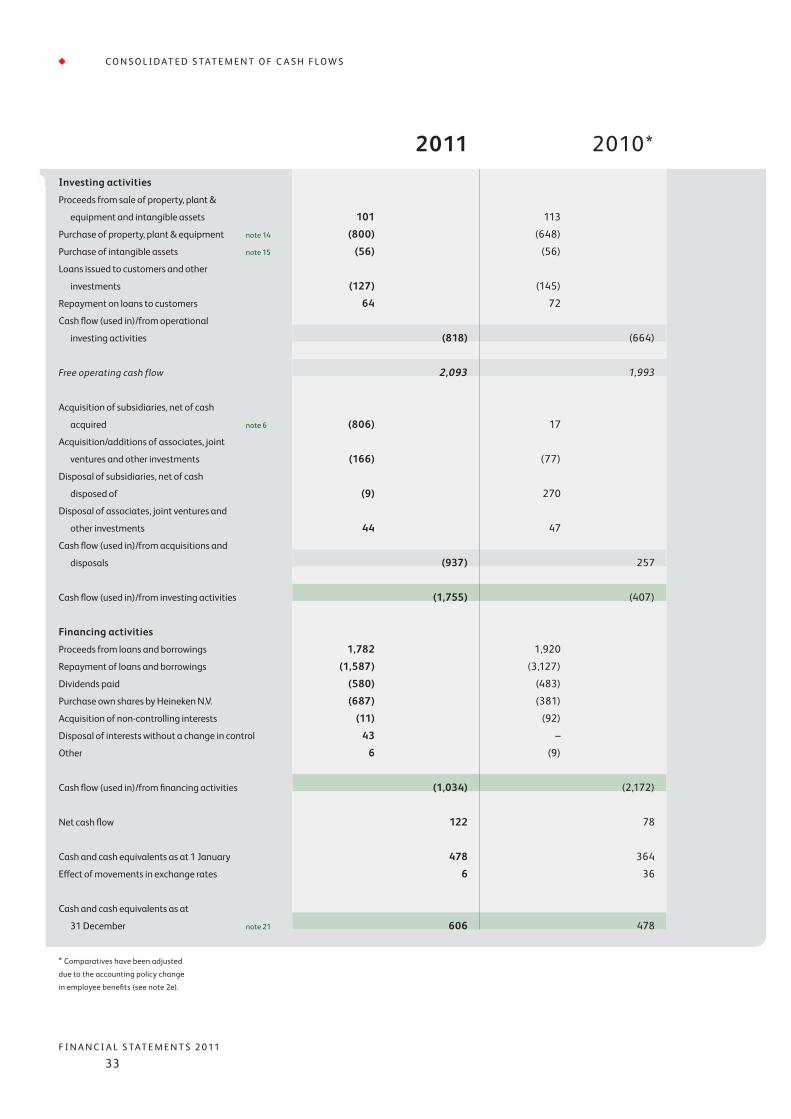
C O N S O L I D AT E D S TAT E M E N T O F C A S H F L O W S
2011 2010*Investing activities
Proceeds from sale of property, plant &
equipment and intangible assets
101
113
Purchase of property, plant & equipment note 14 (800) (648)
Purchase of intangible assets note 15 (56) (56)
Loans issued to customers and other
investments
(127)
(145)
Repayment on loans to customers 64 72
Cash flow (used in)/from operational
investing activities (818) (664)
Free operating cash flow 2,093 1,993
Acquisition of subsidiaries, net of cash
acquired
note 6
(806) 17
Acquisition/additions of associates, joint
ventures and other investments
(166) (77)
Disposal of subsidiaries, net of cash
disposed of (9)
270
Disposal of associates, joint ventures and
other investments
44
47
Cash flow (used in)/from acquisitions and
disposals (937) 257
Cash flow (used in)/from investing activities (1,755) (407)
Financing activities
Proceeds from loans and borrowings 1,782 1,920
Repayment of loans and borrowings (1,587) (3,127)
Dividends paid (580) (483)
Purchase own shares by Heineken N.V. (687) (381)
Acquisition of non-controlling interests (11) (92)
Disposal of interests without a change in control 43 –
Other 6 (9)
Cash flow (used in)/from financing activities (1,034) (2,172)
Net cash flow 122 78
Cash and cash equivalents as at 1 January 478 364
Effect of movements in exchange rates 6 36
Cash and cash equivalents as at
31 December note 21 606 478
* Comparatives have been adjusted
due to the accounting policy change
in employee benefits (see note 2e).

H E I N E K E N H O L D I N G N .V. A N N U A L R E P O R T 2 0 11
34
Share Share Translation Hedging Fair value Other legal Retained Equity1 Non-controlling Non-controlling Total
capital premium reserve reserve reserve reserves earnings interests interests equity2
in Heineken N.V. in Heineken N.V.
group companies
Balance as at 1 January 2010 392 – (226) (62) 50 338 2,190 2,682 2,669 296 5,647
Policy changes (see note 2e) – – – – – – (199) (199) (198) – (397)
Restated balance as at 1 January 2010 392 – (226) (62) 50 338 1,991 2,483 2,471 296 5,250
Other comprehensive income note 24 – – 180 49 (5) 38 7 269 267 15 551
Profit – – – – – 121 605 726 721 132 1,579
Total comprehensive income – – 180 49 (5) 159 612 995 988 147 2,130
Transfer to retained earnings – – – – – (47) 47 – – – –
Dividends to shareholders – – – – – – (173) (173) (172) (138) (483)
Declaration ASDI dividends – – – – – – (3) (3) (3) – (6)
Shares issued 69 1,257 – – – – – 1,326 2,539 – 3,865
Purchase own shares by Heineken N.V. ASDI – – – – – – (10) (10) (371) – (381)
Own shares granted by Heineken N.V. – – – – – – 4 4 (4) – –
Share-based payments by Heineken N.V. – – – – – – 8 8 7 – 15
Purchase mandate Heineken N.V. shares – – – – – – (48) (48) (48) – (96)
Acquisition of non-controlling interests in Heineken N.V.
group companies without a change in control – – – – – – (29) (29) (28) (35) (92)
Acquisition of non-controlling interests in Heineken N.V.
group companies with a change in control – – – – – – – – – 20 20
Changes in consolidation – – – – – – – – – (2) (2)
Balance as at 31 December 2010 461 1,257 (46) (13) 45 450 2,399 4,553 5,379 288 10,220
Balance as at 1 January 2011 461 1,257 (46) (13) 45 450 2,399 4,553 5,379 288 10,220
Other comprehensive income 3 note 24 – – (242) (21) 35 127 (173) (274) (272) (7) (553)
Profit – – – – – – 717 717 713 130 1,560
Total comprehensive income – – (242) (21) 35 127 544 443 441 123 1,007
Transfer to retained earnings – – – – – (63) 63 – – – –
Dividends to shareholders – – – – – – (230) (230) (230) (97) (557)
Declaration ASDI dividends – – – – – – (8) (8) (6) – (14)
Purchase own shares by Heineken N.V. ASDI – – – – – – (11) (11) (676) (1) (688)
Own shares granted by Heineken N.V. – – – – – – (3) (3) 3 – –
Share-based payments by Heineken N.V. – – – – – – 6 6 5 – 11
Purchase mandate Heineken N.V. shares – – – – – – 48 48 48 – 96
Acquisition of non-controlling interests in Heineken N.V.
group companies without a change in control – – – – – – (11) (11) (10) (1) (22)
Disposal of interests without a change in control – – – – – – 17 17 16 6 39
Balance as at 31 December 2011 461 1,257 (288) (34) 80 514 2,814 4,804 4,970 318 10,092
1 Equity attributable to equity
holders of Heineken Holding N.V.2 Comparatives have been adjusted
due to the accounting policy change
in employee benefits (see note 2e).3 See note 22 for hyperinflation
impact.
in millions of euros
CONSOLIDATED STATEMENT OF CHANGES IN EQUITY

F I N A N C I A L S TAT E M E N T S 2 0 11
35
C O N S O L I D AT E D S TAT E M E N T O F C H A N G E S I N E Q U I T Y
Share Share Translation Hedging Fair value Other legal Retained Equity1 Non-controlling Non-controlling Total
capital premium reserve reserve reserve reserves earnings interests interests equity2
in Heineken N.V. in Heineken N.V.
group companies
Balance as at 1 January 2010 392 – (226) (62) 50 338 2,190 2,682 2,669 296 5,647
Policy changes (see note 2e) – – – – – – (199) (199) (198) – (397)
Restated balance as at 1 January 2010 392 – (226) (62) 50 338 1,991 2,483 2,471 296 5,250
Other comprehensive income note 24 – – 180 49 (5) 38 7 269 267 15 551
Profit – – – – – 121 605 726 721 132 1,579
Total comprehensive income – – 180 49 (5) 159 612 995 988 147 2,130
Transfer to retained earnings – – – – – (47) 47 – – – –
Dividends to shareholders – – – – – – (173) (173) (172) (138) (483)
Declaration ASDI dividends – – – – – – (3) (3) (3) – (6)
Shares issued 69 1,257 – – – – – 1,326 2,539 – 3,865
Purchase own shares by Heineken N.V. ASDI – – – – – – (10) (10) (371) – (381)
Own shares granted by Heineken N.V. – – – – – – 4 4 (4) – –
Share-based payments by Heineken N.V. – – – – – – 8 8 7 – 15
Purchase mandate Heineken N.V. shares – – – – – – (48) (48) (48) – (96)
Acquisition of non-controlling interests in Heineken N.V.
group companies without a change in control – – – – – – (29) (29) (28) (35) (92)
Acquisition of non-controlling interests in Heineken N.V.
group companies with a change in control – – – – – – – – – 20 20
Changes in consolidation – – – – – – – – – (2) (2)
Balance as at 31 December 2010 461 1,257 (46) (13) 45 450 2,399 4,553 5,379 288 10,220
Balance as at 1 January 2011 461 1,257 (46) (13) 45 450 2,399 4,553 5,379 288 10,220
Other comprehensive income 3 note 24 – – (242) (21) 35 127 (173) (274) (272) (7) (553)
Profit – – – – – – 717 717 713 130 1,560
Total comprehensive income – – (242) (21) 35 127 544 443 441 123 1,007
Transfer to retained earnings – – – – – (63) 63 – – – –
Dividends to shareholders – – – – – – (230) (230) (230) (97) (557)
Declaration ASDI dividends – – – – – – (8) (8) (6) – (14)
Purchase own shares by Heineken N.V. ASDI – – – – – – (11) (11) (676) (1) (688)
Own shares granted by Heineken N.V. – – – – – – (3) (3) 3 – –
Share-based payments by Heineken N.V. – – – – – – 6 6 5 – 11
Purchase mandate Heineken N.V. shares – – – – – – 48 48 48 – 96
Acquisition of non-controlling interests in Heineken N.V.
group companies without a change in control – – – – – – (11) (11) (10) (1) (22)
Disposal of interests without a change in control – – – – – – 17 17 16 6 39
Balance as at 31 December 2011 461 1,257 (288) (34) 80 514 2,814 4,804 4,970 318 10,092
H E I N E K E N H O L D I N G N .V. A N N U A L R E P O R T 2 0 11
36
note 1 REPORTING ENTITY
Heineken Holding N.V. (the ‘Company’) is a company domiciled in the Netherlands. The address of the Company’s registered office is Tweede Weteringplantsoen 5, Amsterdam. The consolidated financial statements of the Company as at and for the year ended 31 December 2011 comprise Heineken Holding N.V., Heineken N.V., its subsidiaries (together referred to as ‘HEINEKEN’ or the ‘Group’ and individually as ‘HEINEKEN’ entities) and HEINEKEN’s interest in jointly controlled entities and associates. A summary of the main subsidiaries, jointly controlled entities and associates is included in note 36 and 16 respectively. HEINEKEN is primarily involved in the brewing and selling of beer.
note 2 BASIS OF PREPARATION
(a) Statement of complianceThe consolidated financial statements have been prepared in accordance with International Financial Reporting Standards (IFRS) as endorsed by the European Union (EU) and also comply with the financial reporting requirements included in Part 9 of Book 2 of the Dutch Civil Code. All standards and interpretations issued by the International Accounting Standards Board (IASB) and the International Financial Reporting Interpretations Committee (IFRIC) effective year-end 2011 have been adopted by the EU, except that the EU carved out certain hedge accounting provisions of IAS 39. HEINEKEN does not utilise this carve-out permitted by the EU, as it is not applicable. Consequently, the accounting policies applied by HEINEKEN also comply fully with IFRS as issued by the IASB. The Company presents a condensed income statement, using the facility of Article 402 of Book 2 of the Dutch Civil Code. The consolidated financial statements have been prepared by the Board of Directors of the Company and authorised for issue on 14 February 2012 and will be submitted for adoption to the Annual General Meeting of Shareholders on 19 April 2012.
(b) Basis of measurementThe consolidated financial statements have been prepared on the historical cost basis except for the following:• Available-for-sale investments• Derivative financial instruments• Liabilities for equity-settled share-based payment arrangements• Long-term interest-bearing liabilities on which fair value hedge accounting is applied• The defined benefit assets• The financial statements of subsidiaries whose functional currency is the currency of a hyperinflationary economy are stated in terms of the measuring unit current at the end of the reporting period.
The methods used to measure fair values are discussed further in note 4.
(c) Functional and presentation currencyThese consolidated financial statements are presented in euros, which is the Company’s functional currency. All financial information presented in euros has been rounded to the nearest million unless stated otherwise.
NOTES TO THE CONSOLIDATED FINANCIAL STATEMENTS

F I N A N C I A L S TAT E M E N T S 2 0 11
37
(d) Use of estimates and judgementsThe preparation of consolidated financial statements in conformity with IFRSs requires management to make judgements, estimates and assumptions that affect the application of accounting policies and the reported amounts of assets and liabilities, income and expenses. Actual results may differ from these estimates. Estimates and underlying assumptions are reviewed on an ongoing basis. Revisions to accounting estimates are recognised in the period in which the estimates are revised and in any future periods affected. In particular, information about assumptions and estimation uncertainties and critical judgements in applying accounting policies that have the most significant effect on the amounts recognised in the consolidated financial statements are described in the following notes:• Note 6 Acquisitions and disposals of subsidiaries and non-controlling interests• Note 15 Intangible assets• Note 16 Investments in associates and joint ventures• Note 17 Other investments and receivables• Note 18 Deferred tax assets and liabilities• Note 28 Employee benefits• Note 29 Share-based payments – Long-Term Variable award (LTV)• Note 30 Provisions • Note 32 Financial risk management and financial instruments• Note 34 Contingencies.
(e) Changes in accounting policies
Accounting for employee benefitsOn 1 January 2011 HEINEKEN changed its accounting policy with respect to the recognition of actuarial gains and losses arising from defined benefit plans. After the policy change, HEINEKEN recognises all actuarial gains and losses arising immediately in other comprehensive income (OCI). In prior years, HEINEKEN applied the corridor method. To the extent that any cumulative unrecognised actuarial gain or loss exceeds 10% of the greater of the present value of the defined benefit obligation and the fair value of plan assets, that portion was recognised in profit or loss over the expected average remaining working lives of the employees participating in the plan. Otherwise, the actuarial gain or loss was not recognised. As such, this change means that deferral of actuarial gains and losses within the corridor are no longer applied. HEINEKEN believes this accounting policy change provides more relevant information as all amounts will be recognised on balance, which is consistent with industry practice and in accordance with the amended reporting standard of Employee Benefits as issued by the International Accounting Standards Board on 16 June 2011. The change in accounting policy was recognised retrospectively in accordance with IAS 8 ‘Accounting Policies, Changes in Accounting Estimates and Errors’, and comparatives have been restated. This results in a €15 million and €11 million positive impact on ‘Results from operating activities’ and ‘Net profit’ for the year ended 31 December 2010, respectively. The adjustment results in a €296 million decline in ‘Total Equity’ for the full year 2010 on Group level. No statement of financial position as at 1 January 2010 has been included. The information included below provides insight in all balance sheet items affected by this change in policy.
N O T E S T O T H E C O N S O L I D AT E D F I N A N C I A L S TAT E M E N T S

H E I N E K E N H O L D I N G N .V. A N N U A L R E P O R T 2 0 11
38
N O T E S T O T H E C O N S O L I D AT E D F I N A N C I A L S TAT E M E N T S
The following table summarises the transitional adjustments on implementation of the new accounting policy for the full year 2010:
Employee Deferred Retained benefit tax earnings/ obligation assets profit or loss
Balance as reported as at 1 January 2010 634 561 4,408Effect of policy change on 1 January 2010 retained earnings 548 151 (397) Restated balance as at 1 January 2010 1,182 712 4,011
Balance as reported as at 31 December 2010 687 429 5,125Effect of policy change during 2010 on retained earnings 410 113 (307) P&L impact for the period 2010 – – 11Restated balance as at 31 December 2010 1,097 542 4,829 The 2010 amounts as included in the notes to these consolidated financial statements as at and for the year ended 31 December 2010 have been restated as a result of this policy change.
note 3 SIGNIFICANT ACCOUNTING POLICIES
GeneralThe accounting policies set out below have been applied consistently to all periods presented in these consolidated financial statements and have been applied consistently by HEINEKEN entities.
(a) Basis of consolidation
(i) Business combinationsBusiness combinations are accounted for using the acquisition method as at the acquisition date, which is the date on which control is transferred to the Group. Control is the power to govern the financial and operating policies of an entity so as to obtain benefits from its activities. In assessing control, the Group takes into consideration potential voting rights that currently are exercisable. The Group measures goodwill as at the acquisition date as the fair value of the consideration transferred plus the fair value of any previously-held equity interest in the acquiree and the recognised amount of any non-controlling interests in the acquiree, less the net recognised amount (generally fair value) of the identifiable assets acquired and liabilities assumed. When the excess is negative, a bargain purchase gain is recognised immediately in profit or loss. The consideration transferred does not include amounts related to the settlement of pre-existing relationships. Such amounts are generally recognised in profit or loss. Costs related to the acquisition, other than those associated with the issue of debt or equity securities, that the Group incurs in connection with a business combination are expensed as incurred. Any contingent consideration payable is recognised at fair value as at the acquisition date. If the contingent consideration is classified as equity, it is not remeasured and settlement is accounted for within equity. Otherwise, subsequent changes to the fair value of the contingent considerations are recognised in profit or loss.

F I N A N C I A L S TAT E M E N T S 2 0 11
39
N O T E S T O T H E C O N S O L I D AT E D F I N A N C I A L S TAT E M E N T S
(ii) Acquisitions of non-controlling interestsAcquisitions of non-controlling interests are accounted for as transactions with owners in their capacity as owners and therefore no goodwill is recognised as a result. Adjustments to non-controlling interests arising from transactions that do not involve the loss of control are based on a proportionate amount of the net assets of the subsidiary.
(iii) SubsidiariesSubsidiaries are entities controlled by HEINEKEN. Control exists when HEINEKEN has the power, directly or indirectly, to govern the financial and operating policies of an entity so as to obtain benefits from its activities. In assessing control, potential voting rights that currently are exercisable or convertible are taken into account. The financial statements of subsidiaries are included in the consolidated financial statements from the date that control commences until the date that control ceases. Accounting policies of subsidiaries have been changed where necessary to ensure consistency with the policies adopted by HEINEKEN. Losses applicable to the non-controlling interests in a subsidiary are allocated to the non-controlling interests even if doing so causes the non-controlling interests to have a deficit balance.
(iv) Special Purpose Entities (SPEs)An SPE is consolidated if, based on an evaluation of the substance of its relationship with HEINEKEN and the SPE’s risks and rewards, HEINEKEN concludes that it controls the SPE. SPEs controlled by HEINEKEN were established under terms that impose strict limitations on the decision-making powers of the SPE’s management and that result in HEINEKEN receiving the majority of the benefits related to the SPE’s operations and net assets, being exposed to the majority of risks incident to the SPE’s activities, and retaining the majority of the residual or ownership risks related to the SPEs or their assets.
(v) Loss of controlUpon the loss of control, HEINEKEN derecognises the assets and liabilities of the subsidiary, any non-controlling interests and the other components of equity-related to the subsidiary. Any surplus or deficit arising on the loss of control is recognised in profit or loss. If HEINEKEN retains any interest in the previous subsidiary, then such interest is measured at fair value on the date that control is lost. Subsequently it is accounted for as an equity-accounted investee or as an available-for-sale financial asset depending on the level of influence retained.
(vi) Investments in associates and joint venturesInvestments in associates are those entities in which HEINEKEN has significant influence, but not control, over the financial and operating policies. Significant influence is presumed to exist when the Group holds between 20% and 50% of the voting power of another entity. Joint ventures are those entities over whose activities HEINEKEN has joint control, established by contractual agreement and requiring unanimous consent for strategic financial and operating decisions. Investments in associates and joint ventures are accounted for using the equity method (equity-accounted investees) and are recognised initially at cost. The cost of the investment includes transaction costs. The consolidated financial statements include HEINEKEN’s share of the profit or loss and other comprehensive income, after adjustments to align the accounting policies with those of HEINEKEN, from the date that significant influence or joint control commences until the date that significant influence or joint control ceases.

H E I N E K E N H O L D I N G N .V. A N N U A L R E P O R T 2 0 11
40
N O T E S T O T H E C O N S O L I D AT E D F I N A N C I A L S TAT E M E N T S
When HEINEKEN’s share of losses exceeds the carrying amount of the associate, including any long-term investments, the carrying amount is reduced to nil and recognition of further losses is discontinued except to the extent that HEINEKEN has an obligation or has made a payment on behalf of the associate or joint venture.
(vii) Transactions eliminated on consolidationIntra-HEINEKEN balances and transactions, and any unrealised gains and losses or income and expenses arising from intra-HEINEKEN transactions, are eliminated in preparing the consolidated financial statements. Unrealised gains arising from transactions with equity-accounted associates and JVs are eliminated against the investment to the extent of HEINEKEN’s interest in the investee. Unrealised losses are eliminated in the same way as unrealised gains, but only to the extent that there is no evidence of impairment.
(b) Foreign currency
(i) Foreign currency transactionsTransactions in foreign currencies are translated to the respective functional currencies of HEINEKEN entities at the exchange rates on the dates of the transactions. Monetary assets and liabilities denominated in foreign currencies on the reporting date are retranslated to the functional currency at the exchange rate on that date. The foreign currency gain or loss arising on monetary items is the difference between amortised cost in the functional currency at the beginning of the period, adjusted for effective interest and payments during the period, and the amortised cost in foreign currency translated at the exchange rate at the end of the reporting period. Non-monetary assets and liabilities denominated in foreign currencies that are measured at fair value are retranslated to the functional currency at the exchange rate on the date that the fair value was determined. Non-monetary items in a foreign currency that are measured in terms of historical cost are translated using the exchange rate on the date of the transaction. Foreign currency differences arising on retranslation are recognised in profit or loss, except for differences arising on the retranslation of available-for-sale (equity) investments and foreign currency differences arising on the retranslation of a financial liability designated as a hedge of a net investment, which are recognised in other comprehensive income. Non-monetary assets and liabilities denominated in foreign currencies that are measured at cost remain translated into the functional currency at historical exchange rates.
(ii) Foreign operationsThe assets and liabilities of foreign operations, including goodwill and fair value adjustments arising on acquisition, are translated to euros at exchange rates on the reporting date. The income and expenses of foreign operations, excluding foreign operations in hyperinflationary economies, are translated to euros at exchange rates approximating the exchange rates ruling on the dates of the transactions. Group entities, with a functional currency being the currency of a hyperinflationary economy, first restate their financial statements in accordance with IAS 29, Financial Reporting in Hyperinflationary Economies (see ‘Reporting in hyperinflationary economies’ below). The related income, costs and balance sheet amounts are translated at the foreign exchange rate ruling on the balance sheet date. Foreign currency differences are recognised in other comprehensive income and are presented within equity in the translation reserve. However, if the operation is a non-wholly-owned subsidiary, then the relevant proportionate share of the translation difference is allocated to the non-controlling interests. When a foreign operation is disposed of such that

F I N A N C I A L S TAT E M E N T S 2 0 11
41
N O T E S T O T H E C O N S O L I D AT E D F I N A N C I A L S TAT E M E N T S
control, significant influence or joint control is lost, the cumulative amount in the translation reserve related to that foreign operation is reclassified to profit or loss as part of the gain or loss on disposal. When HEINEKEN disposes of only part of its interest in a subsidiary that includes a foreign operation while retaining control, the relevant proportion of the cumulative amount is reattributed to non-controlling interests. When HEINEKEN disposes of only part of its investment in an associate or joint venture that includes a foreign operation while retaining significant influence or joint control, the relevant proportion of the cumulative amount is reclassified to profit or loss. Foreign exchange gains and losses arising from a monetary item receivable from or payable to a foreign operation, the settlement of which is neither planned nor likely in the foreseeable future, are considered to form part of a net investment in a foreign operation and are recognised in other comprehensive income, and are presented within equity in the translation reserve. The following exchange rates were used while preparing these consolidated financial statements (for the most important countries in which HEINEKEN has operations):
In euros Year-end Average
2011 2010 2011 2010
BRL 0.4139 0.4509 0.4298 0.4289 GBP 1.1972 1.1618 1.1522 1.1657 MXN 0.0554 0.0604 0.0578 0.0598 NGN 0.0049 0.0050 0.0047 0.0051 PLN 0.2243 0.2516 0.2427 0.2503 RUB 0.0239 0.0245 0.0245 0.0248 USD 0.7729 0.7484 0.7184 0.7543 (iii) Reporting in hyperinflationary economies
When the economy of a country in which HEINEKEN operates is deemed hyperinflationary and the functional currency of a Group entity is the currency of that hyperinflationary economy, the financial statements of such Group entities are adjusted so that they are stated in terms of the measuring unit current at the end of the reporting period. This involves restatement of income and expenses to reflect changes in the general price index from the start of the reporting period and, restatement of non-monetary items in the balance sheet, such as property, plant and equipment to reflect current purchasing power as at the period end using a general price index from the date when they were first recognised. Comparative amounts are not adjusted. Any differences arising were recorded in equity on adoption.
(iv) Hedge of net investments in foreign operationsForeign currency differences arising on the retranslation of a financial liability designated as a hedge of a net investment in a foreign operation are recognised in other comprehensive income to the extent that the hedge is effective and regardless of whether the net investment is held directly or through an intermediate parent. These differences are presented within equity in the translation reserve. To the extent that the hedge is ineffective, such differences are recognised in profit or loss. When the hedged part of a net investment is disposed of, the relevant amount in the translation reserve is transferred to profit or loss as part of the profit or loss on disposal.
H E I N E K E N H O L D I N G N .V. A N N U A L R E P O R T 2 0 11
42
N O T E S T O T H E C O N S O L I D AT E D F I N A N C I A L S TAT E M E N T S
(c) Non-derivative financial instruments
(i) GeneralNon-derivative financial instruments comprise investments in equity and debt securities, trade and other receivables, cash and cash equivalents, loans and borrowings, and trade and other payables. Non-derivative financial instruments are recognised initially at fair value plus, for instruments not at fair value through profit or loss, any directly attributable transaction costs. Subsequent to initial recognition non-derivative financial instruments are measured as described hereafter. If HEINEKEN has a legal right to offset financial assets with financial liabilities and if HEINEKEN intends either to settle on a net basis or to realise the asset and settle the liability simultaneously then financial assets and liabilities are presented in the statement of financial position as a net amount. Cash and cash equivalents comprise cash balances and call deposits. Bank overdrafts that form an integral part of HEINEKEN’s cash management are included as a component of cash and cash equivalents for the purpose of the statement of cash flows. Accounting policies for interest income, interest expenses and other net finance income and expenses are discussed in note 3r.
(ii) Held-to-maturity investmentsIf HEINEKEN has the positive intent and ability to hold debt securities to maturity, they are classified as held-to-maturity. Debt securities are loans and long-term receivables and are measured at amortised cost using the effective interest method, less any impairment losses. Investments held-to-maturity are recognised or derecognised on the day they are transferred to or by HEINEKEN.
(iii) Available-for-sale investmentsHEINEKEN’s investments in equity securities and certain debt securities are classified as available-for-sale. Subsequent to initial recognition, they are measured at fair value and changes therein – other than impairment losses (see 3i(i)), and foreign currency differences on available-for-sale monetary items (see 3b(i)) – are recognised in other comprehensive income and presented within equity in the fair value reserve. When these investments are derecognised, the relevant cumulative gain or loss in the fair value reserve is transferred to profit or loss. Where these investments are interest-bearing, interest calculated using the effective interest method is recognised in the profit or loss. Available-for-sale investments are recognised or derecognised by HEINEKEN on the date it commits to purchase or sell the investments.
(iv) Investments at fair value through profit or lossAn investment is classified at fair value through profit or loss if it is classified as held for trading or is designated as such upon initial recognition. Investments are designated at fair value through profit or loss if HEINEKEN manages such investments and makes purchase and sale decisions based on their fair value in accordance with HEINEKEN’s documented risk management or investment strategy. Upon initial recognition, attributable transaction costs are recognised in profit or loss as incurred. Investments at fair value through profit or loss are measured at fair value, with changes therein recognised in profit or loss as part of the other net finance income/(expenses). Investments at fair value through profit and loss are recognised or derecognised by HEINEKEN on the date it commits to purchase or sell the investments.

F I N A N C I A L S TAT E M E N T S 2 0 11
43
N O T E S T O T H E C O N S O L I D AT E D F I N A N C I A L S TAT E M E N T S
(v) OtherOther non-derivative financial instruments are measured at amortised cost using the effective interest method, less any impairment losses. Included in non-derivative financial instruments are advances to customers. Subsequently, the advances are amortised over the term of the contract as a reduction of revenue.
(d) Derivative financial instruments (including hedge accounting)
(i) GeneralHEINEKEN uses derivatives in the ordinary course of business in order to manage market risks. Generally HEINEKEN seeks to apply hedge accounting in order to minimise the effects of foreign currency, interest rate or commodity price fluctuations in profit or loss. Derivatives that can be used are interest rate swaps, forward rate agreements, caps and floors, commodity swaps, spot and forward exchange contracts and options. Transactions are entered into with a limited number of counterparties with strong credit ratings. Foreign currency, interest rate and commodity hedging operations are governed by internal policies and rules approved and monitored by the Executive Board of Heineken N.V. Derivative financial instruments are recognised initially at fair value, with attributable transaction costs recognised in profit or loss as incurred. Derivatives for which hedge accounting is not applied are accounted for as instruments at fair value through profit or loss. When derivatives qualify for hedge accounting, subsequent measurement is at fair value, and changes therein accounted for as described in 3b(iv), 3d(ii) and 3d(iii).
(ii) Cash flow hedgesChanges in the fair value of the derivative hedging instrument designated as a cash flow hedge are recognised in other comprehensive income and presented in the hedging reserve within equity to the extent that the hedge is effective. To the extent that the hedge is ineffective, changes in fair value are recognised in profit or loss. If the hedging instrument no longer meets the criteria for hedge accounting, expires or is sold, terminated or exercised, then hedge accounting is discontinued and the cumulative unrealised gain or loss previously recognised in other comprehensive income and presented in the hedging reserve in equity, is recognised in profit or loss immediately, or when a hedging instrument is terminated, but the hedged transaction still is expected to occur, the cumulative gain or loss at that point remains in other comprehensive income and is recognised in accordance with the above-mentioned policy when the transaction occurs. When the hedged item is a non-financial asset, the amount recognised in other comprehensive income is transferred to the carrying amount of the asset when it is recognised. In other cases the amount recognised in other comprehensive income is transferred to the same line of profit or loss in the same period that the hedged item affects profit or loss.
(iii) Fair value hedgesChanges in the fair value of a derivative hedging instrument designated as a fair value hedge are recognised in profit or loss. The hedged item also is stated at fair value in respect of the risk being hedged; the gain or loss attributable to the hedged risk is recognised in profit or loss and adjusts the carrying amount of the hedged item. If the hedge no longer meets the criteria for hedge accounting, the adjustment to the carrying amount of a hedged item for which the effective interest method is used is amortised to profit or loss over the period to maturity.

H E I N E K E N H O L D I N G N .V. A N N U A L R E P O R T 2 0 11
44
N O T E S T O T H E C O N S O L I D AT E D F I N A N C I A L S TAT E M E N T S
(iv) Separable embedded derivativesEmbedded derivatives are separated from the host contract and accounted for separately if the economic characteristics and risks of the host contract and the embedded derivative are not closely related, a separate instrument with the same terms as the embedded derivative would meet the definition of a derivative, and the combined instrument is not measured at fair value through profit or loss. Changes in the fair value of separable embedded derivatives are recognised immediately in profit or loss.
(e) Share capital
(i) Ordinary sharesOrdinary shares are classified as equity. Incremental costs directly attributable to the issue of ordinary shares are recognised as a deduction from equity, net of any tax effects.
(ii) Repurchase of share capital (treasury shares)When share capital recognised as equity is repurchased, the amount of the consideration paid, which includes directly attributable costs, is net of any tax effects recognised as a deduction from equity. Repurchased shares are classified as treasury shares and are presented in the reserve for own shares. When treasury shares are sold or reissued subsequently, the amount received is recognised as an increase inequity, and the resulting surplus or deficit on the transaction is transferred to or from retained earnings.
(iii) DividendsDividends are recognised as a liability in the period in which they are declared.
(f) Property, Plant and Equipment (P, P & E)
(i) Owned assetsItems of P, P & E are measured at cost less government grants received (refer 3q), accumulated depreciation (refer (iv)) and accumulated impairment losses (refer 3i(ii)). Cost comprises the initial purchase price increased with expenditures that are directly attributable to the acquisition of the asset (like transports and non-recoverable taxes). The cost of self-constructed assets includes the cost of materials and direct labour and any other costs directly attributable to bringing the asset to a working condition for its intended use (like an appropriate proportion of production overheads), and the costs of dismantling and removing the items and restoring the site on which they are located. Borrowing costs related to the acquisition or construction of qualifying assets are capitalised as part of the cost of that asset. Cost also may include transfers from equity of any gain or loss on qualifying cash flow hedges of foreign currency purchases of P, P & E. Spare parts that are acquired as part of an equipment purchase and only to be used in connection with this specific equipment are capitalised and amortised as part of the equipment. For example, purchased software that is integral to the functionality of the related equipment is capitalised as part of that equipment. In all other cases spare parts are carried as inventory and recognised in profit and loss as consumed. Where an item of P, P & E comprises major components having different useful lives, they are accounted for as separate items (major components) of P, P & E. Returnable bottles and kegs in circulation are recorded within P, P & E and a corresponding liability is recorded in respect of the obligation to repay the customers’ deposits. Deposits paid by customers for returnable items are reflected in the consolidated statement of financial position within current liabilities.
F I N A N C I A L S TAT E M E N T S 2 0 11
45
N O T E S T O T H E C O N S O L I D AT E D F I N A N C I A L S TAT E M E N T S
(ii) Leased assetsLeases in terms of which HEINEKEN assumes substantially all the risks and rewards of ownership are classified as finance leases. Upon initial recognition P, P & E acquired by way of finance lease is measured at an amount equal to the lower of its fair value and the present value of the minimum lease payments at inception of the lease. Lease payments are apportioned between the outstanding liability and finance charges so as to achieve a constant periodic rate of interest on the remaining balance of the liability. Other leases are operating leases and are not recognised in HEINEKEN’s statement of financial position. Payments made under operating leases are charged to profit or loss on a straight-line basis over the term of the lease. When an operating lease is terminated before the lease period has expired, any payment required to be made to the lessor by way of penalty is recognised as an expense in the period in which termination takes place.
(iii) Subsequent expenditureThe cost of replacing a part of an item of P, P & E is recognised in the carrying amount of the item or recognised as a separate asset, as appropriate, if it is probable that the future economic benefits embodied within the part will flow to HEINEKEN and its cost can be measured reliably. The carrying amount of the replaced part is derecognised. The costs of the day-to-day servicing of P, P & E are recognised in profit or loss when incurred.
(iv) DepreciationDepreciation is calculated over the depreciable amount, which is the cost of an asset, or other amount substituted for cost, less its residual value. Land is not depreciated as it is deemed to have an infinite life. Depreciation on other P, P & E is charged to profit or loss on a straight-line basis over the estimated useful lives of items of P, P & E, and major components that are accounted for separately, since this most closely reflects the expected pattern of consumption of the future economic benefits embodied in the asset. Assets under construction are not depreciated. Leased assets are depreciated over the shorter of the lease term and their useful lives unless it is reasonable certain that HEINEKEN will obtain ownership by the end of the lease term. The estimated useful lives for the current and comparative years are as follows:• Buildings 30-40 years• Plant and equipment 10-30 years• Other fixed assets 3-10 years
Where parts of an item of P, P & E have different useful lives, they are accounted for as separate items of P, P & E. The depreciation methods, residual value as well as the useful lives are reassessed, and adjusted if appropriate, at each financial year-end.
(v) Gains and losses on saleNet gains on sale of items of P, P & E are presented in profit or loss as other income. Net losses on sale are included in depreciation. Net gains and losses are recognised in profit or loss when the significant risks and rewards of ownership have been transferred to the buyer, recovery of the consideration is probable, the associated costs can be estimated reliably, and there is no continuing management involvement with the P, P & E.

H E I N E K E N H O L D I N G N .V. A N N U A L R E P O R T 2 0 11
46
N O T E S T O T H E C O N S O L I D AT E D F I N A N C I A L S TAT E M E N T S
(g) Intangible assets
(i) GoodwillGoodwill arises on the acquisition of subsidiaries, associates and joint ventures and represents the excess of the cost of the acquisition over HEINEKEN’s interest in net fair value of the net identifiable assets, liabilities and contingent liabilities of the acquiree. Goodwill on acquisitions of subsidiaries is included in ‘intangible assets’. Goodwill arising on the acquisition of associates and joint ventures is included in the carrying amount of the associate, respectively the joint ventures. In respect of acquisitions prior to 1 October 2003, goodwill is included on the basis of deemed cost, being the amount recorded under previous GAAP. Goodwill on acquisitions purchased before 1 January 2003 has been deducted from equity. Goodwill arising on the acquisition of a non-controlling interest in a subsidiary represents the excess of the cost of the additional investment over the carrying amount of the interest in the net assets acquired on the date of exchange. Goodwill is measured at cost less accumulated impairment losses (refer 3i(ii)). Goodwill is allocated to individual or groups of cash-generating units (CGUs) for the purpose of impairment testing and is tested annually for impairment. Negative goodwill is recognised directly in profit or loss as other income.
(ii) BrandsBrands acquired, separately or as part of a business combination, are capitalised if they meet the definition of an intangible asset and the recognition criteria are satisfied. Brands acquired as part of a business combination are valued at fair value based on the royalty relief method. Brands acquired separately are measured at cost. Strategic brands are well-known international/local brands with a strong market position and an established brand name. Strategic brands are amortised on an individual basis over the estimated useful life of the brand. Other brands are amortised on a portfolio basis per country.
(iii) Customer-related and contract-based intangiblesCustomer-related and contract-based intangibles are capitalised if they meet the definition of an intangible asset and the recognition criteria are satisfied. If the amounts are not material these are included in the brand valuation. The relationship between brands and customer-related intangibles is carefully considered so that brands and customer-related intangibles are not both recognised on the basis of the same cash flows. Customer-related and contract-based intangibles acquired as part of a business combination are valued at fair value. Customer-related and contract-based intangibles acquired separately are measured at cost. Customer-related and contract-based intangibles are amortised over the remaining useful life of the customer relationships or the period of the contractual arrangements.
(iv) Software, research and development and other intangible assetsPurchased software is measured at cost less accumulated amortisation (refer (vi)) and impairment losses (refer 3i(ii)). Expenditure on internally developed software is capitalised when the expenditure qualifies as development activities, otherwise it is recognised in profit or loss when incurred. Expenditure on research activities, undertaken with the prospect of gaining new technical knowledge and understanding, is recognised in profit or loss when incurred. Development activities involve a plan or design for the production of new or substantially improved products, software and processes. Development expenditure is capitalised only

F I N A N C I A L S TAT E M E N T S 2 0 11
47
N O T E S T O T H E C O N S O L I D AT E D F I N A N C I A L S TAT E M E N T S
if development costs can be measured reliably, the product or process is technically and commercially feasible, future economic benefits are probable, and HEINEKEN intends to and has sufficient resources to complete development and to use or sell the asset. The expenditure capitalised includes the cost of materials, direct labour and overhead costs that are directly attributable to preparing the asset for its intended use, and capitalised borrowing costs. Other development expenditure is recognised in profit or loss when incurred. Capitalised development expenditure is measured at cost less accumulated amortisation (refer (vi)) and accumulated impairment losses (refer 3i(ii)). Other intangible assets that are acquired by HEINEKEN and have finite useful lives, are measured at cost less accumulated amortisation (refer (vi)) and impairment losses (refer 3i(ii)). Expenditure on internally generated goodwill and brands is recognised in profit or loss when incurred.
(v) Subsequent expenditureSubsequent expenditure is capitalised only when it increases the future economic benefits embodied in the specific asset to which it relates. All other expenditure is expensed when incurred.
(vi) AmortisationAmortisation is calculated over the cost of the asset, or other amount substituted for cost, less its residual value. Intangible assets with a finite life are amortised on a straight-line basis over their estimated useful lives, other than goodwill, from the date they are available for use, since this most closely reflects the expected pattern of consumption of the future economic benefits embodied in the asset. The estimated useful lives are as follows:• Strategic brands 40-50 years• Other brands 15-25 years• Customer-related and contract-based intangibles 5-20 years• Software 3-7 years• Capitalised development costs 3 years
Amortisation methods, useful lives and residual values are reviewed on each reporting date and adjusted if appropriate.
(vii) Gains and losses on saleNet gains on sale of intangible assets are presented in profit or loss as other income. Net losses on sale are included in amortisation. Net gains and losses are recognised in profit or loss when the significant risks and rewards of ownership have been transferred to the buyer, recovery of the consideration is probable, the associated costs can be estimated reliably, and there is no continuing management involvement with the intangible assets.
(h) Inventories
(i) GeneralInventories are measured at the lower of cost and net realisable value. The cost of inventories is based on the weighted average cost formula, and includes expenditure incurred in acquiring the inventories, production or conversion costs and other costs incurred in bringing them to their existing location and condition. Net realisable value is the estimated selling price in the ordinary course of business, less the estimated costs of completion and selling expenses.
H E I N E K E N H O L D I N G N .V. A N N U A L R E P O R T 2 0 11
48
N O T E S T O T H E C O N S O L I D AT E D F I N A N C I A L S TAT E M E N T S
(ii) Finished products and work in progressFinished products and work in progress are measured at manufacturing cost based on weighted averages and takes into account the production stage reached. Costs include an appropriate share of direct production overheads based on normal operating capacity.
(iii) Other inventories and spare partsThe cost of other inventories is based on weighted averages. Spare parts are valued at the lower of cost and net realisable value. Value reductions and usage of parts are charged to profit or loss. Spare parts that are acquired as part of an equipment purchase and only to be used in connection with this specific equipment are initially capitalised and amortised as part of the equipment.
(i) Impairment
(i) Financial assetsA financial asset is assessed on each reporting date to determine whether there is any objective evidence that it is impaired. A financial asset is considered to be impaired if objective evidence indicates that one or more events have had a negative effect on the estimated future cash flows of that asset that can be estimated reliably. An impairment loss in respect of a financial asset measured at amortised cost is calculated as the difference between its carrying amount, and the present value of the estimated future cash flows discounted at the original effective interest rate. An impairment loss in respect of an available-for-sale financial asset is calculated by reference to its current fair value. Individually significant financial assets are tested for impairment on an individual basis. The remaining financial assets are assessed collectively in groups that share similar credit risk characteristics. All impairment losses are recognised in profit or loss. Any cumulative loss in respect of an available-for-sale financial asset recognised previously in other comprehensive income and presented in the fair value reserve in equity is transferred to profit or loss. An impairment loss is reversed if the reversal can be related objectively to an event occurring after the impairment loss was recognised. For financial assets measured at amortised cost and available-for-sale financial assets that are debt securities, the reversal is recognised in profit or loss. For available-for-sale financial assets that are equity securities, the reversal is recognised in other comprehensive income.
(ii) Non-financial assetsThe carrying amounts of HEINEKEN’s non-financial assets, other than inventories (refer 3h) and deferred tax assets (refer 3s), are reviewed on each reporting date to determine whether there is any indication of impairment. If any such indication exists then the asset’s recoverable amount is estimated. For goodwill and intangible assets that are not yet available for use, the recoverable amount is estimated each year at the same time. The recoverable amount of an asset or CGU is the higher of an asset’s fair value less costs to sell and value in use. In assessing value in use, the estimated future cash flows are discounted to their present value using a pre-tax discount rate that reflects current market assessments of the time value of money and the risks specific to the asset or CGU. For the purpose of impairment testing, assets that cannot be tested individually are grouped together into the smallest group of assets that generates cash inflows from continuing use that are largely independent of the cash inflows of other assets or groups of assets (the ‘CGU’). For the purpose of impairment testing, goodwill acquired in a business combination, is allocated to each of the acquirer’s CGUs, or groups of CGUs, that is expected to benefit from
F I N A N C I A L S TAT E M E N T S 2 0 11
49
N O T E S T O T H E C O N S O L I D AT E D F I N A N C I A L S TAT E M E N T S
the synergies of the combination. Each unit or group of units to which the goodwill is allocated represents the lowest level within the entity at which the goodwill is monitored for internal management purposes. Goodwill is monitored on regional, sub regional or country level depending on the characteristics of the acquisition, the synergies to be achieved and the level of integration. An impairment loss is recognised if the carrying amount of an asset or its CGU exceeds its recoverable amount. A CGU is the smallest identifiable asset group that generates cash flows that largely are independent from other assets and groups. Impairment losses are recognised in profit or loss. Impairment losses recognised in respect of CGU are allocated first to reduce the carrying amount of any goodwill allocated to the units and then to reduce the carrying amounts of the other assets in the unit (group of units) on a pro rata basis. An impairment loss in respect of goodwill is not reversed. In respect of other assets, impairment losses recognised in prior periods are assessed on each reporting date for any indications that the loss has decreased or no longer exists. An impairment loss is reversed if there has been a change in the estimates used to determine the recoverable amount. An impairment loss is reversed only to the extent that the asset’s carrying amount does not exceed the carrying amount that would have been determined, net of depreciation or amortisation, if no impairment loss had been recognised. Goodwill that forms part of the carrying amount of an investment in an associate and joint venture is not recognised separately, and therefore is not tested for impairment separately. Instead, the entire amount of the investment in an associate and joint venture is tested for impairment as a single asset when there is objective evidence that the investment in an associate may be impaired.
( j) Non-current assets held for saleNon-current assets, or disposal groups comprising assets and liabilities, that are expected to be recovered primarily through sale rather than through continuing use, are classified as held for sale. Immediately before classification as held for sale, the assets, or components of a disposal group, are measured at the lower of their carrying amount and fair value less cost to sell. Any impairment loss on a disposal group is first allocated to goodwill, and then to remaining assets and liabilities on a pro rata basis, except that no loss is allocated to inventories, financial assets, deferred tax assets and employee benefit assets, which continue to be measured in accordance with HEINEKEN’s accounting policies. Impairment losses on initial classification as held for sale and subsequent gains or losses on remeasurement are recognised in profit or loss. Gains are not recognised in excess of any cumulative impairment loss. Intangible assets and P, P & E once classified as held for sale are not amortised or depreciated. In addition, equity accounting of equity-accounted investees ceases once classified as held for sale or distribution.
(k) Employee benefits
(i) Defined contribution plansA defined contribution plan is a post-employment benefit plan (pension plan) under which the Group pays fixed contributions into a separate entity. The Group has no legal or constructive obligations to pay further contributions if the fund does not hold sufficient assets to pay all employees the benefits relating to employee service in the current and prior periods. Obligations for contributions to defined contribution pension plans are recognised as an employee benefit expense in profit or loss in the periods during which services are rendered by employees. Prepaid contributions are recognised as an asset to the extent that a cash refund
H E I N E K E N H O L D I N G N .V. A N N U A L R E P O R T 2 0 11
50
N O T E S T O T H E C O N S O L I D AT E D F I N A N C I A L S TAT E M E N T S
or a reduction in future payments is available. Contributions to a defined contribution plan that are due more than 12 months after the end of the period in which the employee renders the service are discounted to their present value.
(ii) Defined benefit plansA defined benefit plan is a post-employment benefit plan (pension plan) that is not a defined contribution plan. Typically defined benefit plans define an amount of pension benefit that an employee will receive on retirement, usually dependent on one or more factors such as age, years of service and compensation. HEINEKEN’s net obligation in respect of defined benefit pension plans is calculated separately for each plan by estimating the amount of future benefit that employees have earned in return for their service in the current and prior periods; that benefit is discounted to determine its present value. Any unrecognised past service costs and the fair value of any plan assets are deducted. The discount rate is the yield as at balance sheet date on AA-rated bonds that have maturity dates approximating the terms of HEINEKEN’s obligations and that are denominated in the same currency in which the benefits are expected to be paid. The calculations are performed annually by qualified actuaries using the projected unit credit method. When the calculation results in a benefit to HEINEKEN, the recognised asset is limited to the net total of any unrecognised past service costs and the present value of economic benefits available in the form of any future refunds from the plan or reductions in future contributions to the plan. In order to calculate the present value of economic benefits, consideration is given to any minimum funding requirements that apply to any plan in the Group. An economic benefit is available to the Group if it is realisable during the life of the plan, or on settlement of the plan liabilities. When the benefits of a plan are improved, the portion of the increased benefit relating to past service by employees is recognised as an expense in profit or loss on a straight-line basis over the average period until the benefits become vested. To the extent that the benefits vest immediately, the expense is recognised immediately in profit or loss. HEINEKEN recognises all actuarial gains and losses arising from defined benefit plans immediately in other comprehensive income and all expenses related to defined benefit plans in personnel expenses in profit or loss.
(iii) Other long-term employee benefitsHEINEKEN’s net obligation in respect of long-term employee benefits, other than pension plans, is the amount of future benefit that employees have earned in return for their service in the current and prior periods; that benefit is discounted to determine its present value, and the fair value of any related assets is deducted. The discount rate is the yield as at balance sheet date on high-quality credit-rated bonds that have maturity dates approximating the terms of HEINEKEN’s obligations. The obligation is calculated using the projected unit credit method. Any actuarial gains and losses are recognised in other comprehensive income in the period in which they arise.
(iv) Termination benefitsTermination benefits are payable when employment is terminated by the Group before the normal retirement date, or whenever an employee accepts voluntary redundancy in exchange for these benefits. Termination benefits are recognised as an expense when HEINEKEN is demonstrably committed to either terminating the employment of current employees according to a detailed formal plan without possibility of withdrawal, or providing termination benefits as a result of an offer made to encourage voluntary redundancy. Termination benefits for

F I N A N C I A L S TAT E M E N T S 2 0 11
51
N O T E S T O T H E C O N S O L I D AT E D F I N A N C I A L S TAT E M E N T S
voluntary redundancies are recognised if HEINEKEN has made an offer encouraging voluntary redundancy, it is probable that the offer will be accepted, and the number of acceptances can be estimated reliably. Benefits falling due more than 12 months after the balance sheet date are discounted to their present value.
(v) Share-based payment plan (LTV)As from 1 January 2005 HEINEKEN established a share plan for the Executive Board of Heineken N.V. and as from 1 January 2006 also a share plan for senior management was established (see note 29). The grant date fair value of the share rights granted is recognised as personnel expenses with a corresponding increase in equity (equity-settled), over the period that the employees become unconditionally entitled to the share rights. The costs of the share plan for both the Executive Board and senior management members are spread evenly over the performance period. On each balance sheet date, HEINEKEN revises its estimates of the number of share rights that are expected to vest, for the 100% internal performance conditions of the share plan 2010-2012 and the share plan 2011-2013 of the senior management members and the Executive Board and for the 75% internal performance conditions of the share plan 2008-2010 and 2009-2011 of the senior management members. It recognises the impact of the revision of original estimates – only applicable for internal performance conditions, if any, in profit or loss, with a corresponding adjustment to equity. The fair value for the share plan 2009-2011 is measured on grant date using the Monte Carlo model taking into account the terms and conditions of the plan.
(vi) Matching share entitlementAs from 21 April 2011 HEINEKEN established a matching share entitlement for the Executive Board of Heineken N.V. The grant date fair value of the matching shares is recognised as personnel expenses in the income statement as it is deemed an equity-settled incentive.
(vii) Short-term employee benefitsShort-term employee benefit obligations are measured on an undiscounted basis and are expensed as the related service is provided. A liability is recognised for the amount expected to be paid under short-term benefits if the Group has a present legal or constructive obligation to pay this amount as a result of past service provided by the employee and the obligation can be estimated reliably.
(l) Provisions
(i) GeneralA provision is recognised if, as a result of a past event, HEINEKEN has a present legal or constructive obligation that can be estimated reliably, and it is probable that an outflow of economic benefits will be required to settle the obligation. Provisions are measured at the present value of the expenditures to be expected to be required to settle the obligation using a pre-tax rate that reflects current market assessments of the time value of money and the risks specific to the obligation. The increase in the provision due to passage of time is recognised as part of the net finance expenses.

H E I N E K E N H O L D I N G N .V. A N N U A L R E P O R T 2 0 11
52
(ii) RestructuringA provision for restructuring is recognised when HEINEKEN has approved a detailed and formal restructuring plan, and the restructuring has either commenced or has been announced publicly. Future operating losses are not provided for. The provision includes the benefit commitments in connection with early retirement and redundancy schemes.
(iii) Onerous contractsA provision for onerous contracts is recognised when the expected benefits to be derived by HEINEKEN from a contract are lower than the unavoidable cost of meeting its obligations under the contract. The provision is measured at the present value of the lower of the expected cost of terminating the contract and the expected net cost of continuing with the contract. Before a provision is established, HEINEKEN recognises any impairment loss on the assets associated with that contract.
(iv) Other The other provisions, not being provisions for restructuring or onerous contracts, consist mainly of surety and guarantees, litigation and claims and environmental provisions.
(m) Loans and borrowingsLoans and borrowings are recognised initially at fair value, net of transaction costs incurred. Loans and borrowings are subsequently stated at amortised cost; any difference between the proceeds (net of transaction costs) and the redemption value is recognised in profit or loss over the period of the borrowings using the effective interest method. Loans and borrowings included in a fair value hedge are stated at fair value in respect of the risk being hedged. Loans and borrowings for which the Group has an unconditional right to defer settlement of the liability for at least 12 months after the balance sheet date, are classified as non-current liabilities.
(n) Revenue
(i) Products soldRevenue from the sale of products in the ordinary course of business is measured at the fair value of the consideration received or receivable, net of sales tax, excise duties, returns, customer discounts and other sales-related discounts. Revenue from the sale of products is recognised in profit or loss when the amount of revenue can be measured reliably, the significant risks and rewards of ownership have been transferred to the buyer, recovery of the consideration is probable, the associated costs and possible return of products can be estimated reliably, and there is no continuing management involvement with the products. If it is probable that discounts will be granted and the amount can be measured reliably, then the discount is recognised as a reduction of revenue as the sales are recognised.
(ii) Other revenueOther revenues are proceeds from royalties, rental income, pub management services and technical services to third parties, net of sales tax. Royalties are recognised in profit or loss on an accrual basis in accordance with the substance of the relevant agreement. Rental income, pub management services and technical services are recognised in profit or loss when the services have been delivered.
N O T E S T O T H E C O N S O L I D AT E D F I N A N C I A L S TAT E M E N T S

F I N A N C I A L S TAT E M E N T S 2 0 11
53
(o) Other incomeOther income are gains from sale of P, P & E, intangible assets and (interests in) subsidiaries, joint ventures and associates, net of sales tax. They are recognised in profit or loss when ownership has been transferred to the buyer.
(p) Expenses
(i) Operating lease paymentsPayments made under operating leases are recognised in profit or loss on a straight-line basis over the term of the lease. Lease incentives received are recognised in profit or loss as an integral part of the total lease expense, over the term of the lease.
(ii) Finance lease paymentsMinimum lease payments under finance leases are apportioned between the finance expense and the reduction of the outstanding liability. The finance expense is allocated to each period during the lease term so as to produce a constant periodic rate of interest on the remaining balance of the liability. Contingent lease payments are accounted for by revising the minimum lease payments over the remaining term of the lease when the lease adjustment is confirmed.
(q) Government grantsGovernment grants are recognised at their fair value when it is reasonably assured that HEINEKEN will comply with the conditions attaching to them and the grants will be received. Government grants relating to P, P & E are deducted from the carrying amount of the asset. Government grants relating to costs are deferred and recognised in profit or loss over the period necessary to match them with the costs that they are intended to compensate.
(r) Interest income, interest expenses and other net finance income and expensesInterest income and expenses are recognised as they accrue in profit or loss, using the effective interest method unless collectability is in doubt. Borrowing costs that are not directly attributable to the acquisition, construction or production of a qualifying asset are recognised in profit or loss using the effective interest method. Other net finance income and expenses comprises dividend income, gains and losses on the disposal of available-for-sale investments, changes in the fair value of investments designated at fair value through profit or loss and held for trading investments, changes in fair value of hedging instruments that are recognised in profit or loss, unwinding of the discount on provisions and impairment losses recognised on investments. Dividend income is recognised in profit or loss on the date that HEINEKEN’s right to receive payment is established, which in the case of quoted securities is the ex-dividend date. Foreign currency gains and losses are reported on a net basis in the other net finance income and expenses.
(s) Income taxIncome tax comprises current and deferred tax. Current tax and deferred tax are recognised in profit or loss except to the extent that it relates to a business combination, or items recognised directly in equity or in other comprehensive income. Current tax is the expected income tax payable or receivable in respect of taxable profit or loss for the year, using tax rates enacted or substantially enacted on the balance sheet date, and any adjustment to income tax payable in respect of profits of previous years. Current tax payable also includes any tax liability arising from the declaration of dividends.
N O T E S T O T H E C O N S O L I D AT E D F I N A N C I A L S TAT E M E N T S

H E I N E K E N H O L D I N G N .V. A N N U A L R E P O R T 2 0 11
54
Deferred tax is recognised in respect of temporary differences between the carrying amounts of assets and liabilities for financial reporting purposes and their tax bases. Deferred tax assets and liabilities are not recognised for the following temporary differences: (i) the initial recognition of goodwill, (ii) the initial recognition of assets or liabilities in a transaction that is not a business combination and that affects neither accounting nor taxable profit or loss, (iii) differences relating to investments in subsidiaries, joint ventures and associates resulting from translation of foreign operations and (iv) differences relating to investments in subsidiaries and joint ventures to the extent that HEINEKEN is able to control the timing of the reversal of the temporary difference and they will probably not reverse in the foreseeable future. Deferred tax is determined using tax rates (and laws) that have been enacted or substantially enacted by the balance sheet date and are expected to apply when the related deferred tax asset is realised or the deferred tax liability is settled. Deferred tax assets and liabilities are offset if there is a legally enforceable right to offset current tax liabilities and assets, and they relate to income taxes levied by the same tax authority on the same taxable entity, or on different taxable entities which intend either to settle current tax liabilities and assets on a net basis, or to realise the assets and settle the liabilities simultaneously. In determining the amount of current and deferred tax HEINEKEN takes into account the impact of uncertain tax positions and whether additional taxes and interest may be due. HEINEKEN believes that its accruals for tax liabilities are adequate for all open tax years based on its assessment of many factors, including interpretations of tax law and prior experience. This assessment relies on estimates and assumptions and may involve a series of judgements about future events. New information may become available that causes HEINEKEN to change its judgement regarding the adequacy of existing tax liabilities; such changes to tax liabilities will impact tax expense in the period that such a determination is made. A deferred tax asset is recognised for unused tax losses, tax credits and deductible temporary differences, to the extent that it is probable that future taxable profits will be available against which they can be utilised. Deferred tax assets are reviewed on each balance sheet date and are reduced to the extent that it is no longer probable that the related tax benefit will be realised.
(t) Discontinued operationsA discontinued operation is a component of the Group’s business that represents a separate major line of business or geographical area of operations that has been disposed of or is held for sale or distribution, or is a subsidiary acquired exclusively with a view to resale. Classification as a discontinued operation occurs upon disposal or when the operation meets the criteria to be classified as held for sale, if earlier. When an operation is classified as a discontinued operation, the comparative statement of comprehensive income is re-presented as if the operation had been discontinued from the start of the comparative year.
(u) Earnings per shareThe Company presents basic and diluted earnings per share (EPS) data for its ordinary shares. Basic EPS is calculated by dividing the profit or loss attributable to ordinary shareholders of the Company by the weighted average number of ordinary shares outstanding during the period including the weighted average of outstanding ASDI, adjusted for the weighted average of own shares purchased in the year. Diluted EPS is determined by adjusting the profit or loss attributable to ordinary shareholders and the weighted average number of ordinary shares outstanding including weighted average of outstanding ASDI, adjusted for the weighted average of own shares purchased in the year, for the effects of all dilutive potential ordinary shares, which comprise share rights granted to employees.
N O T E S T O T H E C O N S O L I D AT E D F I N A N C I A L S TAT E M E N T S

F I N A N C I A L S TAT E M E N T S 2 0 11
55
(v) Cash flow statementThe cash flow statement is prepared using the indirect method. Changes in balance sheet items that have not resulted in cash flows such as translation differences, fair value changes, equity-settled share-based payments and other non-cash items, have been eliminated for the purpose of preparing this statement. Assets and liabilities acquired as part of a business combination are included in investing activities (net of cash acquired). Dividends paid to ordinary shareholders are included in financing activities. Dividends received are classified as operating activities. Interest paid is also included in operating activities.
(w) Operating segmentsOperating segments are reported in a manner consistent with the internal reporting provided to the Executive Board of Heineken N.V., who is considered to be chief operating decision maker. An operating segment is a component of HEINEKEN that engages in business activities from which it may earn revenues and incur expenses, including revenues and expenses that relate to transactions with any of HEINEKEN’s other components. All operating segments’ operating results are reviewed regularly by the Executive Board to make decisions about resources to be allocated to the segment and to assess its performance, and for which discrete financial information is available. Inter-segment transfers or transactions are entered into under the normal commercial terms and conditions that would also be available to unrelated third parties. Segment results, assets and liabilities that are reported to the Executive Board of Heineken N.V. include items directly attributable to a segment as well as those that can be allocated on a reasonable basis. Unallocated result items comprise net finance expenses and income tax expenses. Unallocated assets comprise current other investments and cash call deposits. Segment capital expenditure is the total cost incurred during the period to acquire P, P & E, and intangible assets other than goodwill.
(x) Emission rightsEmission rights are related to the emission of CO2, which relates to the production of energy. These rights are freely tradable. Bought emission rights and liabilities due to production of CO2 are measured at cost, including any directly attributable expenditure. Emission rights received for free are also recorded at cost, i.e. with a zero value.
(y) Recently issued IFRS
(i) Standards effective in 2011 and reflected in these consolidated financial statements • IAS 19 Pensions and IFRIC 14 (amendments effective 1 January 2011) – The limit on a Defined
Benefit Assets, Minimum Funding Requirements and their Interaction. These amendments remove unintended consequences arising from the treatment of prepayments where there is a minimum funding requirement. These amendments result in prepayments of contributions in certain circumstances being recognised as an asset rather than an expense.
• IFRS 7 Financial Instruments: Disclosure (amendments effective 1 January 2011). The amendments add an explicit statement that qualitative disclosure should be made to better enable users to evaluate an entity’s exposure to risk arising from financial instruments. These amendments are reflected in disclosure note 32 Financial Instruments.
Other standards and interpretations effective from 1 January 2011 did not have a significant impact on HEINEKEN.
N O T E S T O T H E C O N S O L I D AT E D F I N A N C I A L S TAT E M E N T S
H E I N E K E N H O L D I N G N .V. A N N U A L R E P O R T 2 0 11
56
(ii) New relevant standards and interpretations not yet adoptedThe following new standards and interpretations to existing standards relevant to HEINEKEN are not yet effective for the year ended 31 December 2011, and have not been applied in preparing these consolidated financial statements. None of these is expected to have a significant effect on the consolidated financial statements, except for IAS 19 Employee benefits and IFRS 9 Financial Instruments, which becomes mandatory for the Group’s 2013 consolidated financial statements. HEINEKEN is in the process of evaluating the impact of the applicability of the new standards. HEINEKEN does not plan to early adopt these standards and the extent of the impact has not been determined• IAS 1 Presentation of Financial Statements was amended in June 2011 for Presentation of
Items of Other Comprehensive Income with an effective date of 1 July 2012. • IAS 12 Deferred Tax: Recovery of Underlying Assets. The amendments introduce an exception
to the general measurement requirements of IAS 12 Income Taxes in respect of investment properties measured at fair value. The measurement of deferred tax assets and liabilities, in this limited circumstance, is based on a rebuttable presumption that the carrying amount of the investment property will be recovered entirely through sale. The presumption can be rebutted only if the investment property is depreciable and held within a business model whose objective is to consume substantially all of the asset’s economic benefits over the life of the asset.
• IAS 19 Employee Benefits was amended. The standard is effective for annual periods beginning on or after 1 January 2013, but has not yet been endorsed by the EU. HEINEKEN is in the process of evaluating the impact of the applicability of the new standard.
• IAS 27 Separate financial statements contains accounting and disclosure requirements for investments in subsidiaries, joint ventures and associates when an entity prepares separate financial statements. The standard requires an entity preparing separate financial statements to account for those investments at cost or in accordance with IFRS 9 Financial Instruments. The standard is effective for annual periods beginning on or after 1 January 2013.
• IAS 28 Investments in Associates and Joint Ventures prescribes the accounting for investments in associates and sets out the requirements for the application of the equity method when accounting for investments in associates and joint ventures. The standard is effective for annual periods beginning on or after 1 January 2013. This amendment is in line with the new IFRS 11, which no longer gives entities the choice in accounting treatment for joint ventures, only the equity method is allowed. HEINEKEN already applied the equity method since 2008.
• IFRS 7 Disclosures – Transfers of Financial Assets. The amendments introduce new disclosure requirements about transfers of financial assets, including disclosures for:• financial assets that are not derecognised in their entirety; and• financial assets that are derecognised in their entirety but for which the entity retains
continuing involvement. • IFRS 9 Financial Instruments is part of the IASB’s wider project to replace IAS 39 ‘Financial
Instruments: Recognition and Measurement’. IFRS 9 retains but simplifies the mixed measurement model and establishes two primary measurement categories for financial assets, amortised cost and fair value. The basis of classification depends on the entity’s business model and the contractual cash flow characteristics of the financial asset. The standard is effective for annual periods beginning on or after 1 January 2015, but has not yet been endorsed by the EU. HEINEKEN is in the process of evaluating the impact of the applicability of the new standard.
• IFRS 10 Consolidated Financial Statements establishes principles for the presentation and preparation of consolidated financial statements when an entity controls one or more other entities. This IFRS supersedes IAS 27 Consolidated and separate financial statements and SIC-12 Consolidation – Special purpose entities and is effective for annual periods beginning on or after 1 January 2013.
N O T E S T O T H E C O N S O L I D AT E D F I N A N C I A L S TAT E M E N T S

F I N A N C I A L S TAT E M E N T S 2 0 11
57
• IFRS 11 Joint arrangements establish principles for financial reporting by parties to a joint arrangement. This IFRS supersedes IAS 31 Interest in Joint Ventures and SIC-13 Jointly Controlled Entities – Non-monetary contributions by ventures and is effective for annual periods beginning on or after 1 January 2013. Under IFRS 11 the structure of the arrangement is no longer the only determinant for the accounting treatment and entities do no longer have a choice in accounting treatment. HEINEKEN is in the process of evaluating the impact of the applicability of the new standard.
• IFRS 12 Disclosure of interests in other entities applies to entities that have an interest in a subsidiary, a joint arrangement, an associate or an unconsolidated structured entity. The IFRS is effective for annual periods beginning on or after 1 January 2013. This IFRS integrates and make consistent the disclosure requirements for all entities mentioned above.
• IFRS 13 Fair value measurement defines fair value; sets out in a single IFRS a framework for measuring fair value; and requires disclosures about fair value measurements. The IFRS is to be applied for annual periods beginning on or after 1 January 2013. The IFRS explains how to measure fair value for financial reporting. It does not require fair value measurements in addition to those already required or permitted by other IFRSs and is not intended to establish valuation standards or affect valuation practices outside financial reporting.
note 4 DETERMINATION OF FAIR VALUES
(i) GeneralA number of HEINEKEN’s accounting policies and disclosures require the determination of fair value, for both financial and non-financial assets and liabilities. Fair values have been determined for measurement and/or disclosure purposes based on the following methods. When applicable, further information about the assumptions made in determining fair values or for the purpose of impairment testing is disclosed in the notes specific to that asset or liability.
(ii) Property, plant and equipmentThe fair value of P, P & E recognised as a result of a business combination is based on the quoted market prices for similar items when available and replacement cost when appropriate.
(iii) Intangible assetsThe fair value of brands acquired in a business combination is based on the ‘relief of royalty’ method. The fair value of customer relationships acquired in a business combination is determined using the multi-period excess earnings method, whereby the subject asset is valued after deducting a fair return on all other assets that are part of creating the related cash flows. The fair value of other intangible assets is based on the discounted cash flows expected to be derived from the use and eventual sale of the assets.
(iv) InventoriesThe fair value of inventories acquired in a business combination is determined based on its estimated selling price in the ordinary course of business less the estimated costs of completion and sale, and a reasonable profit margin based on the effort required to complete and sell the inventories.
N O T E S T O T H E C O N S O L I D AT E D F I N A N C I A L S TAT E M E N T S

H E I N E K E N H O L D I N G N .V. A N N U A L R E P O R T 2 0 11
58
N O T E S T O T H E C O N S O L I D AT E D F I N A N C I A L S TAT E M E N T S
(v) Investments in equity and debt securitiesThe fair value of financial assets at fair value through profit or loss, held-to-maturity investments and available-for-sale financial assets is determined by reference to their quoted closing bid price on the reporting date, or if unquoted, determined using an appropriate valuation technique. The fair value of held-to-maturity investments is determined for disclosure purposes only. In case the quoted price does not exist on the date of exchange or in case the quoted price exists on the date of exchange but was not used as the cost, the investments are valued indirectly based on discounted cash flow models.
(vi) Trade and other receivablesThe fair value of trade and other receivables is estimated at the present value of future cash flows, discounted at the market rate of interest on the reporting date. This fair value is determined for disclosure purposes or when acquired in a business combination.
(vii) Derivative financial instrumentsThe fair value of derivative financial instruments is based on their listed market price, if available. If a listed market price is not available, then fair value is in general estimated by discounting the difference between the cash flows based on contractual price and the cash flows based on current price for the residual maturity of the contract using a risk-free interest rate (based on inter-bank interest rates). Fair values reflect the credit risk of the instrument and include adjustments to take account of the credit risk of the Group entity and counterparty when appropriate.
(viii) Non-derivative financial instrumentsFair value, which is determined for disclosure purposes or when fair value hedge accounting is applied, is calculated based on the present value of future principal and interest cash flows, discounted at the market rate of interest on the reporting date. For finance leases the market rate of interest is determined by reference to similar lease agreements. Fair values reflect the credit risk of the instrument and include adjustments to take account of the credit risk of the Group entity and counterparty when appropriate.
note 5 OPERATING SEGMENTS
HEINEKEN distinguishes the following six reportable segments:• Western Europe• Central and Eastern Europe• The Americas• Africa and the Middle East• Asia Pacific• Heineken N.V. Head Office and Other/eliminations
The first five reportable segments as stated above are the Group’s business regions. These business regions are each managed separately by a Regional President. The Regional President is directly accountable for the functioning of the segment’s assets, liabilities and results of the region and reports regularly to the Executive Board of Heineken N.V. (the chief operating decision maker) to discuss operating activities, regional forecasts and regional results. The Heineken N.V. Head Office operating segment falls directly under the responsibility of the Executive Board of Heineken N.V. For each of the six reportable segments, the Executive Board of Heineken N.V. reviews internal management reports on a monthly basis.

F I N A N C I A L S TAT E M E N T S 2 0 11
59
N O T E S T O T H E C O N S O L I D AT E D F I N A N C I A L S TAT E M E N T S
Information regarding the results of each reportable segment is included in the table on the next page. Performance is measured based on EBIT (beia), as included in the internal management reports that are reviewed by the Executive Board of Heineken N.V. EBIT (beia) is defined as earnings before interest and taxes and net finance expenses, before exceptional items and amortisation of brands and customer relationships. Exceptional items are defined as items of income and expense of such size, nature or incidence, that in view of management their disclosure is relevant to explain the performance of HEINEKEN for the period. EBIT and EBIT (beia) are not financial measures calculated in accordance with IFRS. EBIT (beia) is used to measure performance as management believes that this measurement is the most relevant in evaluating the results of these regions. HEINEKEN has multiple distribution models to deliver goods to end customers. There is no reliance on major clients. Deliveries to end consumers are done in some countries via own wholesalers or own pubs, in other markets directly and in some others via third parties. As such, distribution models are country specific and on consolidated level diverse. In addition, these various distribution models are not centrally managed or monitored. Consequently, the Executive Board of Heineken N.V. is not allocating resources and assessing the performance based on business type information and therefore no segment information is provided on business type. Inter-segment pricing is determined on an arm’s-length basis. As net finance expenses and income tax expenses are monitored on a consolidated level (and not on an individual regional basis) and regional presidents are not accountable for that, net finance expenses and income tax expenses are not provided per reportable segment. Starting 1st of January 2011 Empaque (HEINEKEN’s Mexican packaging business) was transferred from the America’s region to Heineken N.V. Head Office as this managerial resides under Global Supply Chain situated in Heineken N.V. Head Office. Also, in 2011 HEINEKEN reallocated certain management costs from regions to Heineken N.V. Head Office reflecting a change in HEINEKEN’s operating framework from regional to global reporting lines for certain roles within global functions. As a consequence the comparative figures have been restated.

H E I N E K E N H O L D I N G N .V. A N N U A L R E P O R T 2 0 11
60
N O T E S T O T H E C O N S O L I D AT E D F I N A N C I A L S TAT E M E N T S
Information about reportable segments Western Europe Central and
Eastern Europe
The Americas Africa and the
Middle East
Asia Pacific Heineken N.V.
Head Office & Other/
eliminations
Consolidated
2011 20103 2011 20103 2011 20103 2011 20103 2011 20103 2011 20103 2011 20103
Revenue
Third party revenue 1 7,158 7,284 3,209 3,130 4,002 3,284 2,223 1,982 216 206 315 247 17,123 16,133
Interregional revenue 594 610 20 13 27 12 – 6 – – (641) (641) – –
Total revenue 7,752 7,894 3,229 3,143 4,029 3,296 2,223 1,988 216 206 (326) (394) 17,123 16,133
Other income 48 71 7 8 1 – 3 – 5 158 – 2 64 239
Results from operating activities 820 786 318 345 493 429 533 531 64 203 (13) 4 2,215 2,298
Net finance expenses (430) (509)
Share of profit of associates and joint ventures
and impairments thereof
3
3
17
21
77
75
35
28
112
79
(4)
(13)
240
193
Income tax expenses (465) (403)
Profit 1,560 1,579
Attributable to:
Equity holders of Heineken Holding N.V. (net profit) 717 726
Non-controlling interests in Heineken N.V. 713 721
Non-controlling interests in Heineken N.V. group companies 130 132
1,560 1,579
EBIT reconciliation
EBIT 823 789 335 366 570 504 568 559 176 282 (17) (9) 2,455 2,491
eia 2 139 136 11 12 85 96 2 1 – (158) 5 45 242 132
EBIT (beia) note 27 962 925 346 378 655 600 570 560 176 124 (12) 36 2,697 2,623
1 Includes other revenue of €463
million in 2011 and €439 million in
2010.2 Note that these are both non-GAAP
measures and therefore unaudited.3 Comparatives have been adjusted
due to the transfer of Empaque
causing the move of an amount of
€54 million of EBIT from The
Americas region to Heineken N.V.
Head Office; the centralisation of the
Regional Head Offices resulting in a
shift of €43 million EBIT from
regions to Heineken N.V. Head Office;
the policy change in employee
benefits, causing an increase of €15
million in EBIT (€11 million in region
Western Europe and €4 million in
The Americas region).
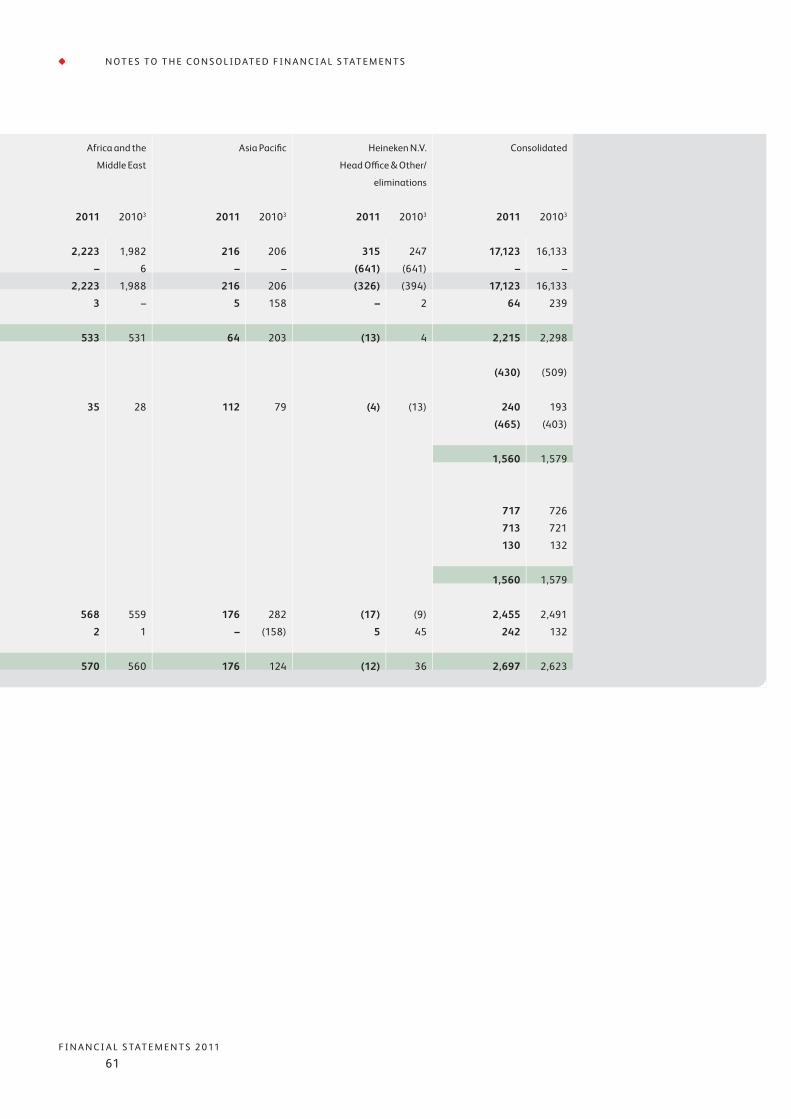
F I N A N C I A L S TAT E M E N T S 2 0 11
61
N O T E S T O T H E C O N S O L I D AT E D F I N A N C I A L S TAT E M E N T S
Information about reportable segments Western Europe Central and
Eastern Europe
The Americas Africa and the
Middle East
Asia Pacific Heineken N.V.
Head Office & Other/
eliminations
Consolidated
2011 20103 2011 20103 2011 20103 2011 20103 2011 20103 2011 20103 2011 20103
Revenue
Third party revenue 1 7,158 7,284 3,209 3,130 4,002 3,284 2,223 1,982 216 206 315 247 17,123 16,133
Interregional revenue 594 610 20 13 27 12 – 6 – – (641) (641) – –
Total revenue 7,752 7,894 3,229 3,143 4,029 3,296 2,223 1,988 216 206 (326) (394) 17,123 16,133
Other income 48 71 7 8 1 – 3 – 5 158 – 2 64 239
Results from operating activities 820 786 318 345 493 429 533 531 64 203 (13) 4 2,215 2,298
Net finance expenses (430) (509)
Share of profit of associates and joint ventures
and impairments thereof
3
3
17
21
77
75
35
28
112
79
(4)
(13)
240
193
Income tax expenses (465) (403)
Profit 1,560 1,579
Attributable to:
Equity holders of Heineken Holding N.V. (net profit) 717 726
Non-controlling interests in Heineken N.V. 713 721
Non-controlling interests in Heineken N.V. group companies 130 132
1,560 1,579
EBIT reconciliation
EBIT 823 789 335 366 570 504 568 559 176 282 (17) (9) 2,455 2,491
eia 2 139 136 11 12 85 96 2 1 – (158) 5 45 242 132
EBIT (beia) note 27 962 925 346 378 655 600 570 560 176 124 (12) 36 2,697 2,623
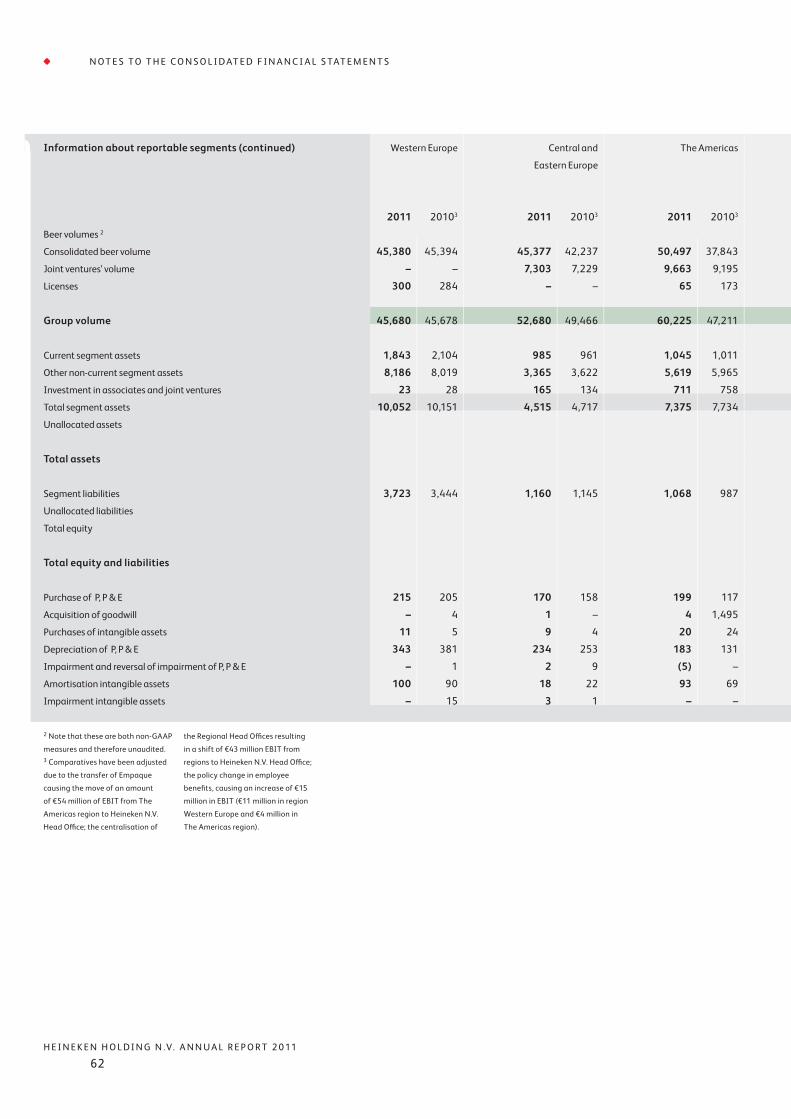
H E I N E K E N H O L D I N G N .V. A N N U A L R E P O R T 2 0 11
62
N O T E S T O T H E C O N S O L I D AT E D F I N A N C I A L S TAT E M E N T S
Information about reportable segments (continued) Western Europe Central and
Eastern Europe
The Americas Africa and the
Middle East
Asia Pacific Heineken N.V.
Head Office & Other/
Consolidated
eliminations
2011 20103 2011 20103 2011 20103 2011 20103 2011 20103 2011 20103 2011 20103
Beer volumes 2
Consolidated beer volume 45,380 45,394 45,377 42,237 50,497 37,843 22,029 19,070 1,309 1,328 – – 164,592 145,872
Joint ventures’ volume – – 7,303 7,229 9,663 9,195 5,706 5,399 24,410 22,181 – – 47,082 44,004
Licenses 300 284 – – 65 173 1,093 1,204 769 806 – – 2,227 2,467
Group volume 45,680 45,678 52,680 49,466 60,225 47,211 28,828 25,673 26,488 24,315 – – 213,901 192,343
Current segment assets 1,843 2,104 985 961 1,045 1,011 854 639 91 74 (124) (536) 4,694 4,253
Other non-current segment assets 8,186 8,019 3,365 3,622 5,619 5,965 1,867 1,272 2 12 1,143 1.242 20,182 20,132
Investment in associates and joint ventures 23 28 165 134 711 758 272 262 536 507 57 (16) 1,764 1,673
Total segment assets 10,052 10,151 4,515 4,717 7,375 7,734 2,993 2,173 629 593 1,076 690 26,640 26,058
Unallocated assets 487 604
Total assets 27,127 26,662
Segment liabilities 3,723 3,444 1,160 1,145 1,068 987 653 532 36 33 508 625 7,148 6,766
Unallocated liabilities 9,887 9,676
Total equity 10,092 10,220
Total equity and liabilities 27,127 26,662
Purchase of P, P & E 215 205 170 158 199 117 202 163 – 1 14 4 800 648
Acquisition of goodwill – 4 1 – 4 1,495 282 1 – – – 248 287 1,748
Purchases of intangible assets 11 5 9 4 20 24 – 9 – – 16 14 56 56
Depreciation of P, P & E 343 381 234 253 183 131 140 100 – 1 36 27 936 893
Impairment and reversal of impairment of P, P & E – 1 2 9 (5) – 3 2 – – – 2 – 14
Amortisation intangible assets 100 90 18 22 93 69 6 4 – – 12 7 229 192
Impairment intangible assets – 15 3 1 – – – – – – – – 3 16
2 Note that these are both non-GAAP
measures and therefore unaudited.3 Comparatives have been adjusted
due to the transfer of Empaque
causing the move of an amount
of €54 million of EBIT from The
Americas region to Heineken N.V.
Head Office; the centralisation of
the Regional Head Offices resulting
in a shift of €43 million EBIT from
regions to Heineken N.V. Head Office;
the policy change in employee
benefits, causing an increase of €15
million in EBIT (€11 million in region
Western Europe and €4 million in
The Americas region).

F I N A N C I A L S TAT E M E N T S 2 0 11
63
N O T E S T O T H E C O N S O L I D AT E D F I N A N C I A L S TAT E M E N T S
Information about reportable segments (continued) Western Europe Central and
Eastern Europe
The Americas Africa and the
Middle East
Asia Pacific Heineken N.V.
Head Office & Other/
Consolidated
eliminations
2011 20103 2011 20103 2011 20103 2011 20103 2011 20103 2011 20103 2011 20103
Beer volumes 2
Consolidated beer volume 45,380 45,394 45,377 42,237 50,497 37,843 22,029 19,070 1,309 1,328 – – 164,592 145,872
Joint ventures’ volume – – 7,303 7,229 9,663 9,195 5,706 5,399 24,410 22,181 – – 47,082 44,004
Licenses 300 284 – – 65 173 1,093 1,204 769 806 – – 2,227 2,467
Group volume 45,680 45,678 52,680 49,466 60,225 47,211 28,828 25,673 26,488 24,315 – – 213,901 192,343
Current segment assets 1,843 2,104 985 961 1,045 1,011 854 639 91 74 (124) (536) 4,694 4,253
Other non-current segment assets 8,186 8,019 3,365 3,622 5,619 5,965 1,867 1,272 2 12 1,143 1.242 20,182 20,132
Investment in associates and joint ventures 23 28 165 134 711 758 272 262 536 507 57 (16) 1,764 1,673
Total segment assets 10,052 10,151 4,515 4,717 7,375 7,734 2,993 2,173 629 593 1,076 690 26,640 26,058
Unallocated assets 487 604
Total assets 27,127 26,662
Segment liabilities 3,723 3,444 1,160 1,145 1,068 987 653 532 36 33 508 625 7,148 6,766
Unallocated liabilities 9,887 9,676
Total equity 10,092 10,220
Total equity and liabilities 27,127 26,662
Purchase of P, P & E 215 205 170 158 199 117 202 163 – 1 14 4 800 648
Acquisition of goodwill – 4 1 – 4 1,495 282 1 – – – 248 287 1,748
Purchases of intangible assets 11 5 9 4 20 24 – 9 – – 16 14 56 56
Depreciation of P, P & E 343 381 234 253 183 131 140 100 – 1 36 27 936 893
Impairment and reversal of impairment of P, P & E – 1 2 9 (5) – 3 2 – – – 2 – 14
Amortisation intangible assets 100 90 18 22 93 69 6 4 – – 12 7 229 192
Impairment intangible assets – 15 3 1 – – – – – – – – 3 16
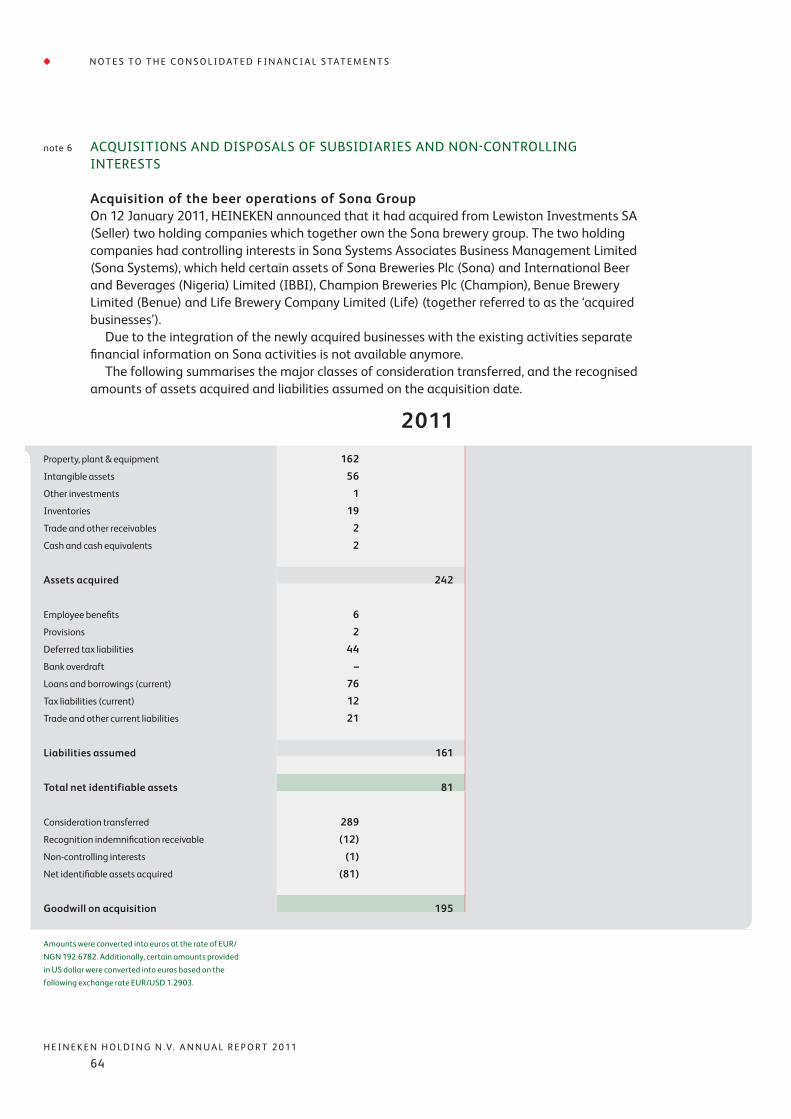
H E I N E K E N H O L D I N G N .V. A N N U A L R E P O R T 2 0 11
64
N O T E S T O T H E C O N S O L I D AT E D F I N A N C I A L S TAT E M E N T S
note 6 ACQUISITIONS AND DISPOSALS OF SUBSIDIARIES AND NON-CONTROLLING INTERESTS
Acquisition of the beer operations of Sona GroupOn 12 January 2011, HEINEKEN announced that it had acquired from Lewiston Investments SA (Seller) two holding companies which together own the Sona brewery group. The two holding companies had controlling interests in Sona Systems Associates Business Management Limited (Sona Systems), which held certain assets of Sona Breweries Plc (Sona) and International Beer and Beverages (Nigeria) Limited (IBBI), Champion Breweries Plc (Champion), Benue Brewery Limited (Benue) and Life Brewery Company Limited (Life) (together referred to as the ‘acquired businesses’). Due to the integration of the newly acquired businesses with the existing activities separate financial information on Sona activities is not available anymore. The following summarises the major classes of consideration transferred, and the recognised amounts of assets acquired and liabilities assumed on the acquisition date.
2011Property, plant & equipment 162
Intangible assets 56
Other investments 1
Inventories 19
Trade and other receivables 2
Cash and cash equivalents 2
Assets acquired 242
Employee benefits 6
Provisions 2
Deferred tax liabilities 44
Bank overdraft –
Loans and borrowings (current) 76
Tax liabilities (current) 12
Trade and other current liabilities 21
Liabilities assumed 161
Total net identifiable assets 81
Consideration transferred 289
Recognition indemnification receivable (12)
Non-controlling interests (1)
Net identifiable assets acquired (81)
Goodwill on acquisition 195
Amounts were converted into euros at the rate of EUR/NGN 192.6782. Additionally, certain amounts provided in US dollar were converted into euros based on the following exchange rate EUR/USD 1.2903.
F I N A N C I A L S TAT E M E N T S 2 0 11
65
N O T E S T O T H E C O N S O L I D AT E D F I N A N C I A L S TAT E M E N T S
The purchase price accounting for the acquired businesses is prepared on a final basis. The outcome indicates goodwill of €195 million. The derived goodwill includes synergies mainly related to the available production capacity. Goodwill has been allocated to Nigeria in the Africa and Middle East region and is held in NGN. The rationale for the allocation is that the acquisition provides access to the Nigerian market: access to additional capacity, consolidate market share within a fast-growing market and improved profitability through synergy. The entire amount of goodwill is not expected to be tax deductible. Between HEINEKEN and the Seller certain indemnifications were agreed on, that primarily relate to tax and legal matters existing on the date of acquisition. The assessment of these contingencies indicates an indemnification receivable of €12 million that is considered an included element of the business combination. The purchase price for the acquired businesses was based on an estimate of the net debt and working capital position of the acquired businesses as at 11 January 2011 (the date of the completion of the acquisition). HEINEKEN and the Seller have determined the exact net debt and working capital position of the acquired businesses as at 11 January 2011 by reference to agreed accounting principles and there will be no adjustment to the final purchase price. Non-controlling interests are recognised based on their proportional interest in the net identifiable assets acquired of Champion, Benue and Life for a total of €1 million. In this year acquisition-related costs of €1 million have been recognised in the income statement.

H E I N E K E N H O L D I N G N .V. A N N U A L R E P O R T 2 0 11
66
Acquisition of two breweries in EthiopiaOn 11 August 2011, HEINEKEN announced that it had acquired from the government of the Federal Democratic Republic of Ethiopia (Seller) two breweries named Bedele and Harar (together referred to as the ‘acquired business’). The acquired businesses contributed revenue of €13 million and results from operating activities of €1.5 million (EBIT) for the five-month period from 4 August 2011 to 31 December 2011. For the financial statements of HEINEKEN the additional 8 months would not have been material. The following summarises the major classes of consideration transferred, and the recognised amounts of assets acquired and liabilities assumed on the acquisition date.
N O T E S T O T H E C O N S O L I D AT E D F I N A N C I A L S TAT E M E N T S
2011Property, plant & equipment 27
Intangible assets 8
Inventories 8
Trade and other receivables 3
Cash and cash equivalents 1
Assets acquired 47
Deferred tax liabilities 8
Trade and other current liabilities 12
Liabilities assumed 20
Total net identifiable assets 27
Consideration transferred 115
Net identifiable assets acquired (27)
Goodwill on acquisition 88
Amounts were converted into euros at the rate of EUR/ETB 24.492 and EUR/USD 1.426 for the statement of financial position.
The purchase price accounting for the acquired business is prepared on a provisional basis. The outcome indicates goodwill of a€88 million. The derived goodwill includes synergies mainly related to market access and the available production capacity. Goodwill has been allocated to Ethiopia in the Africa and Middle East region and is held in ETB. The rationale for the allocation is that the acquisition provides access to the Ethiopian market: access to additional capacity, consolidate market share within a fast-growing market and improved profitability through synergy. The entire amount of goodwill is not expected to be tax deductible. Acquisition-related costs of €2.5 million have been recognised in the income statement for the period ended 31 December 2011.

F I N A N C I A L S TAT E M E N T S 2 0 11
67
N O T E S T O T H E C O N S O L I D AT E D F I N A N C I A L S TAT E M E N T S
2011Property, plant & equipment 441
Cash and cash equivalents –
Assets acquired 441
Liabilities assumed –
Total net identifiable assets 441
Consideration transferred 480
Settlement of pre-existing relationship (39)
Net identifiable assets acquired (441)
Goodwill on acquisition –
Amounts were converted into euros at the rate of EUR/GBP 0.859 for the statement of financial position.
Acquisition of pubs in the UKOn 2 December 2011, HEINEKEN announced that it had acquired from The Royal Bank of Scotland (RBS) (Seller) the Galaxy Pub Estate (Galaxy) in the UK (referred to as the ‘acquired business’). The following summarises the major classes of consideration transferred, and the recognised amounts of assets and assumed liabilities on the acquisition date. Management agreements that were in place were settled upon acquisition.
The purchase price accounting for the acquired business is prepared on a provisional basis. The outcome indicates no goodwill as the fair value of the assets acquired approximates the consideration transferred. The rationale for the acquisition is to further drive volume growth and to strengthen the leading position in the UK beer and cider market. The acquisition creates a strong platform from which HEINEKEN is building leadership in the high value UK on-trade channel and will mainly impact net result. The early amortisation and termination of associated contracts under the acquisition gave rise to a one-off, pre-tax expense of €36 million. Acquisition-related cost of €3 million have been recognised in the income statement for the period ended 31 December 2011.
Provisional accounting FEMSA acquisition in 2010The FEMSA acquisition accounting has been concluded during the first half year of 2011. A final adjustment was made to provisional accounting for the FEMSA acquisition. Total impact resulted in an increase of goodwill of €4 million, the comparatives have not been restated. The adjustment resulted from the filing of a tax return in March 2011, which was €6 million lower, a negative impact of €12 million due to a legal provision and recognition of certain employee benefits for €10 million. In 2010 FEMSA results were included from 1 May 2010 onwards (8 months) and have been fully consolidated in 2011 (12 months).

H E I N E K E N H O L D I N G N .V. A N N U A L R E P O R T 2 0 11
68
2011 2010 Assets classified as held for sale
– –Current assets
Non-current assets 99 6
99 6
note 7 ASSETS (OR DISPOSAL GROUPS) CLASSIFIED AS HELD FOR SALE
Other assets classified as held for sale represent land and buildings following the commitment of HEINEKEN to a plan to sell certain land and buildings in the UK and its associate in Kazakhstan. Efforts to sell these assets have commenced and are expected to be completed during 2012.
Disposals
Disposal of interest without losing controlOn 12 May 2010 HEINEKEN acquired an additional interest in Commonwealth Brewery Limited (CBL) and Burns House Limited (BHL) situated in the Bahamas, increasing its ownership to 100% in both entities. This acquisition was subject to government approval that 25% of the combined entities would be disposed of. During the period which ended 31 December 2011, HEINEKEN disposed of 25% of its 100% interest in CBL (which had acquired 100% of BHL prior to this), for an amount of €43 million through an initial public offering (IPO) in the Bahamas. As a result, its ownership decreased to 75%. After the disposal of this non-controlling interest, HEINEKEN maintains a controlling interest in CBL. There is no impact on net result, the impact is recognised in equity.
N O T E S T O T H E C O N S O L I D AT E D F I N A N C I A L S TAT E M E N T S
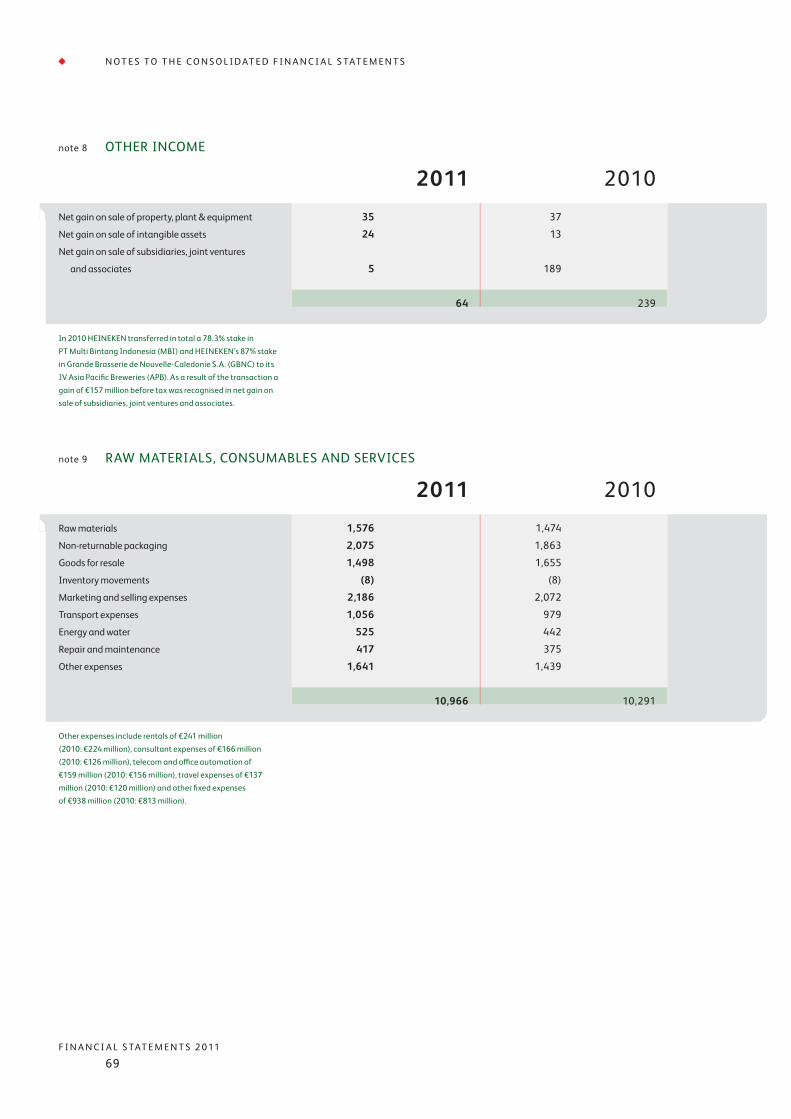
F I N A N C I A L S TAT E M E N T S 2 0 11
69
N O T E S T O T H E C O N S O L I D AT E D F I N A N C I A L S TAT E M E N T S
2011 2010Net gain on sale of property, plant & equipment 35 37
Net gain on sale of intangible assets 24 13
Net gain on sale of subsidiaries, joint ventures
and associates 5
189
64 239
In 2010 HEINEKEN transferred in total a 78.3% stake in PT Multi Bintang Indonesia (MBI) and HEINEKEN’s 87% stake in Grande Brasserie de Nouvelle-Caledonie S.A. (GBNC) to its JV Asia Pacific Breweries (APB). As a result of the transaction a gain of €157 million before tax was recognised in net gain on sale of subsidiaries, joint ventures and associates.
note 8 OTHER INCOME
note 9 RAW MATERIALS, CONSUMABLES AND SERVICES
2011 2010Raw materials 1,576 1,474
Non-returnable packaging 2,075 1,863
Goods for resale 1,498 1,655
Inventory movements (8) (8)
Marketing and selling expenses 2,186 2,072
Transport expenses 1,056 979
Energy and water 525 442
Repair and maintenance 417 375
Other expenses 1,641 1,439
10,966 10,291
Other expenses include rentals of €241 million (2010: €224 million), consultant expenses of €166 million (2010: €126 million), telecom and office automation of €159 million (2010: €156 million), travel expenses of €137 million (2010: €120 million) and other fixed expenses of €938 million (2010: €813 million).

H E I N E K E N H O L D I N G N .V. A N N U A L R E P O R T 2 0 11
70
N O T E S T O T H E C O N S O L I D AT E D F I N A N C I A L S TAT E M E N T S
note 10 PERSONNEL EXPENSES
2011 2010Wages and salaries 1,891 1,787
Compulsory social security contributions 333 317
Contributions to defined contribution plans 24 16
Expenses related to defined benefit plans note 28 56 89
Increase in other long-term employee
benefits 11 9
Equity-settled share-based payment plan note 29 11 15
Other personnel expenses 512 432
2,838 2,665
Restructuring costs in Spain for an amount of €53 million are included in other personnel expenses.
2011 2010The Netherlands 4,032 3,861
Other Western Europe 14,707 15,751
Central and Eastern Europe 17,424 18,043
The Americas 16,414 17,164
Africa and the Middle East 11,396 10,607
Asia Pacific 279 304
64,252 65,730
The average number of full-time equivalent (FTE) employees during the year was:

F I N A N C I A L S TAT E M E N T S 2 0 11
71
N O T E S T O T H E C O N S O L I D AT E D F I N A N C I A L S TAT E M E N T S
note 12 NET FINANCE INCOME AND EXPENSES
2011 2010Recognised in profit or loss
Interest income 70 100
Interest expenses (494) (590)
Dividend income on available-for-sale
investments 2 1
Dividend income on investments held for
trading 11 7
Net gain/(loss) on disposal of available-for-
sale investments 1 –
Net change in fair value of derivatives 96 (75)
Net foreign exchange gain/(loss) (107) 61
Impairment losses on available-for-sale
investments –
(3)
Unwinding discount on provisions (7) (7)
Other net financial income/(expenses) (2) (3)
Other net finance income/(expenses) (6) (19)
(430) (509)
note 11 AMORTISATION, DEPRECIATION AND IMPAIRMENTS
2011 2010Property, plant & equipment note 14 936 907
Intangible assets note 15 232 208
Impairment on available-for-sale assets – 3
1,168 1,118

H E I N E K E N H O L D I N G N .V. A N N U A L R E P O R T 2 0 11
72
N O T E S T O T H E C O N S O L I D AT E D F I N A N C I A L S TAT E M E N T S
2011 2010*Recognised in other comprehensive income
Foreign currency translation differences for
foreign operations (493) 390
Effective portion of changes in fair value of
cash flow hedges (21) 43
Effective portion of cash flow hedges
transferred to profit or loss (11) 45
Ineffective portion of cash flow hedges
transferred to profit or loss – 9
Net change in fair value of available-for-sale
investments 71 11
Net change in fair value available-for-sale
investments transferred to profit or loss (1) (17)
Actuarial (gains) and losses (93) 99
Share of other comprehensive income of
associates/joint ventures (29)(5)
(553) 551
Recognised in:
Fair value reserve 69 (10)
Hedging reserve (42) 97
Translation reserve (482) 358
Other (98) 106
(553) 551
The negative impact of foreign currency translation differences for foreign operations in other comprehensive income is mainly due to the impact of devaluation of the Mexican peso on the net assets and goodwill measured in Mexican peso of total €295 million. Remaining impact is related to the depreciation of the Polish zloty, the Chilean peso, Nigerian naira and Belarusian ruble, partly offset by the revaluation of the US dollar and the British pound.
* Comparatives have been adjusted
due to the accounting policy change
in employee benefits (see note 2e).

F I N A N C I A L S TAT E M E N T S 2 0 11
73
N O T E S T O T H E C O N S O L I D AT E D F I N A N C I A L S TAT E M E N T S
2011 2010*Recognised in profit or loss
Current tax expense
Current year 502 502
Under/(over) provided in prior years (26) 52
476 554
Deferred tax expense
Origination and reversal of temporary
differences 17 (19)
Previously unrecognised deductible
temporary differences (9) (2)
Changes in tax rate 1 3
Utilisation/(benefit) of tax losses recognised (19) (39)
Under/(over) provided in prior years (1) (94)
(11) (151)
465 403
note 13 INCOME TAX EXPENSE
2011 2010*Reconciliation of the effective tax rate
Profit before income tax 2,025 1,982
Share of net profit of associates and joint
ventures and impairments thereof (240) (193)
Profit before income tax excluding share of
profit of associates and joint ventures
(inclusive impairments thereof) 1,785 1,789
* Comparatives have been adjusted
due to the accounting policy change
in employee benefits (see note 2e).

H E I N E K E N H O L D I N G N .V. A N N U A L R E P O R T 2 0 11
74
N O T E S T O T H E C O N S O L I D AT E D F I N A N C I A L S TAT E M E N T S
% 2011 % 2010*Income tax using the Company’s domestic
tax rate 25 446 25.5 456
Effect of tax rates in foreign jurisdictions 3.5 62 1.9 34
Effect of non-deductible expenses 3.2 58 4 72
Effect of tax incentives and exempt income (6) (107) (8.2) (146)
Recognition of previously unrecognised
temporary differences (0.5) (9) (0.1) (2)
Utilisation or recognition of previously
unrecognised tax losses (0.3) (5) (1.2) (21)
Unrecognised current year tax losses 1 18 0.8 15
Effect of changes in tax rate 0.1 1 0.2 3
Withholding taxes 1.5 26 1.4 25
Under/(over) provided in prior years (1.5) (27) (2.3) (42)
Other reconciling items 0.1 2 0.5 9
26.1 465 22.5 403
The reported tax rate is 26.1% (2010: 22.5%) and includes the effect of the release of tax provisions after having reached agreement with the tax authorities, mainly explaining the under/over provided amount as part of the current tax expense. The reported 2010 tax rate included the tax-exempt transfer of PT Multi Bintang Indonesia (MBI) and Grande Brasserie de Nouvelle-Caledonie S.A. (GBNC).
2011 2010*Income tax recognised in other
comprehensive income
Changes in fair value – (5)
Changes in hedging reserve 13 (38)
Changes in translation reserve 11 –
Other 16 (38)
note 24 40 (81)
* Comparatives have been adjusted
due to the accounting policy change
in employee benefits (see note 2e).

F I N A N C I A L S TAT E M E N T S 2 0 11
75
N O T E S T O T H E C O N S O L I D AT E D F I N A N C I A L S TAT E M E N T S
Cost property, plant & equipment Land and
buildings
Plant and
equipment
Other
fixed assets
Under
construction
Total
Balance as at 1 January 2010 3,460 5,337 3,518 315 12,630
Changes in consolidation 745 635 253 72 1,705
Purchases 38 82 249 279 648
Transfer of completed projects under
construction 106 142 104 (352) –
Transfer to/(from) assets classified as
held for sale 26 34 39 2 101
Disposals (49) (130) (285) (1) (465)
Effect of movements in exchange rates 71 107 61 15 254
Balance as at 31 December 2010 4,397 6,207 3,939 330 14,873
Balance as at 1 January 2011 4,397 6,207 3,939 330 14,873
Changes in consolidation note 6 505 89 (31) 3 566
Purchases 55 99 320 326 800
Transfer of completed projects under
construction 82 90 150 (322) –
Transfer to/(from) assets classified as
held for sale (65) – – – (65)
Disposals (35) (92) (255) (6) (388)
Effect of hyperinflation 2 11 2 2 17
Effect of movements in exchange rates (71) (127) (73) (1) (272)
Balance as at 31 December 2011 4,870 6,277 4,052 332 15,531
note 14 PROPERTY, PLANT AND EQUIPMENT

H E I N E K E N H O L D I N G N .V. A N N U A L R E P O R T 2 0 11
76
N O T E S T O T H E C O N S O L I D AT E D F I N A N C I A L S TAT E M E N T S
Depreciation and impairment losses
property, plant & equipment
Land and
buildings
Plant and
equipment
Other
fixed assets
Under
construction
Total
Balance as at 1 January 2010 (1,405) (2,875) (2,333) – (6,613)
Changes in consolidation 12 31 35 – 78
Depreciation charge for the year note 11 (117) (342) (434) – (893)
Impairment losses note 11 (15) (19) (6) – (40)
Reversal impairment losses note 11 4 21 1 – 26
Transfer (to)/from assets classified as
held for sale (6) (14) (23) – (43)
Disposals 37 128 263 – 428
Effect of movements in exchange rates (36) (54) (39) – (129)
Balance as at 31 December 2010 (1,526) (3,124) (2,536) – (7,186)
Balance as at 1 January 2011 (1,526) (3,124) (2,536) – (7,186)
Changes in consolidation note 6 – 4 14 – 18
Depreciation charge for the year note 11 (128) (356) (452) – (936)
Impairment losses note 11 – – (8) – (8)
Reversal impairment losses note 11 – 3 5 – 8
Transfer (to)/from assets classified as
held for sale 3 – – – 3
Disposals 18 92 224 – 334
Effect of movements in exchange rates 11 42 43 – 96
Balance as at 31 December 2011 (1,622) (3,339) (2,710) – (7,671)
Carrying amount
As at 1 January 2010 2,055 2,462 1,185 315 6,017
As at 31 December 2010 2,871 3,083 1,403 330 7,687
As at 1 January 2011 2,871 3,083 1,403 330 7,687
As at 31 December 2011 3,248 2,938 1,342 332 7,860

F I N A N C I A L S TAT E M E N T S 2 0 11
77
Impairment lossesIn 2011 a total impairment loss of €8 million (2010: €40 million) was charged to profit or loss.
Financial lease assetsThe Group leases P, P & E under a number of finance lease agreements. As at 31 December 2011 the net carrying amount of leased P, P & E was €39 million (2010: €95 million). During the year, the Group acquired leased assets of €6 million (2010: €17 million).
Security to authoritiesCertain P, P & E for €137 million (2010: €149 million) has been pledged to the authorities in a number of countries as security for the payment of taxation, particularly excise duties on beers, non-alcoholic beverages and spirits and import duties. This mainly relates to Brazil (see note 34).
Property, plant and equipment under constructionP, P & E under construction mainly relates to expansion of the brewing capacity in Mexico, the UK and Nigeria.
Capitalised borrowing costsDuring 2011 no borrowing costs have been capitalised (2010: €nil).
N O T E S T O T H E C O N S O L I D AT E D F I N A N C I A L S TAT E M E N T S

H E I N E K E N H O L D I N G N .V. A N N U A L R E P O R T 2 0 11
78
Goodwill Brands Customer-
related
intangibles
Contract-
based
intangibles
Software,
research and
development
and other
Total
Cost
Balance as at 1 January 2010 5,713 1,382 351 124 259 7,829
Changes in consolidation 1,748 924 943 86 39 3,740
Purchases/internally developed – – – – 56 56
Disposals (1) (8) – – (16) (25)
Transfers to assets held for sale – – – – 3 3
Effect of movements in exchange rates 132 23 (10) 12 3 160
Balance as at 31 December 2010 7,592 2,321 1,284 222 344 11,763
Balance as at 1 January 2011 7,592 2,321 1,284 222 344 11,763
Changes in consolidation note 6 287 8 18 38 – 351
Purchases/internally developed – – – 6 50 56
Disposals – – – (91) (6) (97)
Effect of movements in exchange rates (70) (57) (74) (13) (10) (224)
Balance as at 31 December 2011 7,809 2,272 1,228 162 378 11,849
N O T E S T O T H E C O N S O L I D AT E D F I N A N C I A L S TAT E M E N T S
note 15 INTANGIBLE ASSETS

F I N A N C I A L S TAT E M E N T S 2 0 11
79
Goodwill Brands Customer-
related
intangibles
Contract-
based
intangibles
Software,
research and
development
and other
Total
Cost
Balance as at 1 January 2010 5,713 1,382 351 124 259 7,829
Changes in consolidation 1,748 924 943 86 39 3,740
Purchases/internally developed – – – – 56 56
Disposals (1) (8) – – (16) (25)
Transfers to assets held for sale – – – – 3 3
Effect of movements in exchange rates 132 23 (10) 12 3 160
Balance as at 31 December 2010 7,592 2,321 1,284 222 344 11,763
Balance as at 1 January 2011 7,592 2,321 1,284 222 344 11,763
Changes in consolidation note 6 287 8 18 38 – 351
Purchases/internally developed – – – 6 50 56
Disposals – – – (91) (6) (97)
Effect of movements in exchange rates (70) (57) (74) (13) (10) (224)
Balance as at 31 December 2011 7,809 2,272 1,228 162 378 11,849
N O T E S T O T H E C O N S O L I D AT E D F I N A N C I A L S TAT E M E N T S
Goodwill Brands Customer-
related
intangibles
Contract-
based
intangibles
Software,
research and
development
and other
Total
Amortisation and impairment losses
Balance as at 1 January 2010 (280) (108) (74) (50) (182) (694)
Changes in consolidation – – – 25 3 28
Amortisation charge for the year note 11 – (54) (88) (16) (34) (192)
Impairment losses note 11 – (1) – (15) – (16)
Disposals 1 2 – – 10 13
Transfers to assets held for sale – – – – (2) (2)
Effect of movements in exchange rates – (2) (1) (4) (3) (10)
Balance as at 31 December 2010 (279) (163) (163) (60) (208) (873)
Balance as at 1 January 2011 (279) (163) (163) (60) (208) (873)
Changes in consolidation note 6 – – – 1 (1) –
Amortisation charge for the year note 11 – (59) (110) (24) (36) (229)
Impairment losses note 11 – (1) – – (2) (3)
Disposals – (1) – 91 1 91
Effect of movements in exchange rates – 3 5 (11) 3 –
Balance as at 31 December 2011 (279) (221) (268) (3) (243) (1,014)
Carrying amount
As at 1 January 2010 5,433 1,274 277 74 77 7,135
As at 31 December 2010 7,313 2,158 1,121 162 136 10,890
As at 1 January 2011 7,313 2,158 1,121 162 136 10,890
As at 31 December 2011 7,530 2,051 960 159 135 10,835

H E I N E K E N H O L D I N G N .V. A N N U A L R E P O R T 2 0 11
80
N O T E S T O T H E C O N S O L I D AT E D F I N A N C I A L S TAT E M E N T S
Throughout the year total goodwill mainly increased due to the acquisition of the Sona and Ethiopian beer business and net foreign currency differences. Goodwill is tested for impairments annually. The recoverable amounts of the CGUs are based on value in use calculations. Value in use was determined by discounting the future cash flows generated from the continuing use of the unit using a pre-tax discount rate.The key assumptions used for the value in use calculations are as follows:• Cash flows were projected based on actual operating results and the three-year business
plan. Cash flows for a further seven-year period were extrapolated using expected annual per country volume growth rates, which are based on external sources. Management believes that this forecasted period is justified due to the long-term nature of the beer business and past experiences.
• The beer price growth per year after the first three-year period is assumed to be at specific per country expected annual long-term inflation, based on external sources.
• Cash flows after the first ten-year period were extrapolated using a perpetual growth rate equal to the expected annual long-term inflation, in order to calculate the terminal recoverable amount.
• A per CGU-specific pre-tax Weighted Average Cost of Capital (WACC) was applied in determining the recoverable amount of the units.
2011 2010*Western Europe 3,396 3,328
Central and Eastern Europe (excluding Russia) 1,394 1,494
Russia 102 105
The Americas (excluding Brazil) 1,743 1,751
Brazil 111 110
Africa and the Middle East (aggregated) 528 245
Heineken N.V. Head Office and others 256 280
7,530 7,313
* Comparatives have been adjusted
due to the transfer of Empaque from
the Americas region to Heineken N.V.
Head Office.
Brands and customer-related/contract-based intangibles The main brands capitalised are the brands acquired in 2008: Scottish & Newcastle (Fosters and Strongbow) and 2010: Cervecería Cuauhtémoc Moctezuma (Dos Equis, Tecate and Sol). The main customer-related and contract-based intangibles were acquired in 2010 and are related to customer relationships with retailers in Mexico (constituting either by way of a contractual agreement or by way of non-contractual relations).
Impairment tests for cash-generating units containing goodwillFor the purpose of impairment testing, goodwill in respect of Western Europe, Central and Eastern Europe (excluding Russia) and the Americas (excluding Brazil) is allocated and monitored on a regional basis. In respect of less integrated Operating Companies of Russia, Brazil and Africa and the Middle East, goodwill is allocated and monitored on an individual country basis. The aggregate carrying amounts of goodwill allocated to each CGU are as follows:

F I N A N C I A L S TAT E M E N T S 2 0 11
81
N O T E S T O T H E C O N S O L I D AT E D F I N A N C I A L S TAT E M E N T S
The values assigned to the key assumptions used for the value in use calculations are as follows:
The values assigned to the key assumptions represent management’s assessment of future trends in the beer industry and are based on both external sources and internal sources (historical data). HEINEKEN applied its methodology to determine CGU specific WACC’s to perform its annual impairment testing on a consistent basis. The trend and outcome of several WACC’s, for amongst others the Western Europe CGU, turned out lower than expected based on the current economic climate and associated outlooks. HEINEKEN does not believe the risk profile in Western Europe is significantly lower than in prior years. The lower WACC for 2011 is mainly driven by lower observed risk-free rates reflecting the capital flee towards safer deemed economies. HEINEKEN performed an additional impairment sensitivity calculation and concluded that applying a different WACC would not result in a materially different outcome. The WACC’s disclosed are based on HEINEKEN’s internal consistent methodology.
Sensitivity to changes in assumptionsLimited headroom is available in HEINEKEN’s CGU’s Russia and Brazil, however the outcome of a sensitivity analysis of a 100 basis points adverse change in key assumptions (lower growth rates or higher discount rates respectively) did not result in a materially different outcome of the impairment test.
In % Pre-tax WACC Expected
annual
long-term
inflation
2015-2021
Expected
volume
growth rates
2015-2021
Western Europe 8.3 2.1 (0.4)
Central and Eastern Europe (excluding Russia) 12.3 2.7 1.7
Russia 14.8 4.8 1.9
The Americas (excluding Brazil) 10.1 2.5 1.8
Brazil 16.1 4.3 3.0
Africa and the Middle East 10.7-21.4 2.7-8.4 1.1-5.9
Heineken N.V. Head Office and others 8.3-12.6 2.1-3.6 (0.4)-2.4

H E I N E K E N H O L D I N G N .V. A N N U A L R E P O R T 2 0 11
82
N O T E S T O T H E C O N S O L I D AT E D F I N A N C I A L S TAT E M E N T S
note 16 INVESTMENTS IN ASSOCIATES AND JOINT VENTURES
HEINEKEN has the following (direct and indirect) significant investments in associates and joint ventures:
Country Ownership (%)
2011 2010
Joint ventures
Brau Holding International GmbH & Co KgaA Germany 49.9 49.9
Zagorka Brewery A.D. Bulgaria 49.4 49.4
Brewinvest S.A. Greece 50.0 50.0
Pivara Skopje A.D. FYR Macedonia 48.2 27.6
Brasseries du Congo S.A. Congo 50.0 50.0
Asia Pacific Investment Pte. Ltd. Singapore 50.0 50.0
Asia Pacific Breweries Ltd. Singapore 41.9 41.9
Compania Cervecerias Unidas S.A. Chile 33.1 33.1
Tempo Beverages Ltd. Israel 40.0 40.0
Heineken Lion Australia Pty. Australia 50.0 50.0
Sirocco FZCo Dubai 50.0 50.0
Diageo Heineken Namibia B.V. Namibia 50.0 50.0
United Breweries Limited India 37.5 37.5
Millennium Alcobev Private Limited2 India – 68.8
DHN Drinks (Pty) Ltd. South Africa 44.5 44.5
Sedibeng Brewery Pty Ltd.1 South Africa 75.0 75.0
UB Nizam Breweries Pvt. Ltd 2 India – 50.0
UB Ajanta Breweries Pvt. Ltd India 50.0 50.0
Associates
Cerveceria Costa Rica S.A. Costa Rica 25.0 25.0
JSC FE Efes Karaganda Brewery 3 Kazakhstan 28.0 28.0
1 HEINEKEN has joint control as
the contract and ownership details
determine that for certain main
operating and financial decisions
unanimous approval is required.
As a result this investment is
not consolidated.2 In 2011 these entities ceased to
exist, they were merged into United
Breweries Limited.3 This entity is classified as held for
sale (see note 7).

F I N A N C I A L S TAT E M E N T S 2 0 11
83
N O T E S T O T H E C O N S O L I D AT E D F I N A N C I A L S TAT E M E N T S
Reporting dateThe reporting date of the financial statements of all HEINEKEN entities and joint ventures disclosed are the same as for the Company except for: (i) Asia Pacific Breweries Ltd., Heineken Lion Australia Pty. and Asia Pacific Investment Pte. Ltd which have a 30 September reporting date (the APB results are included with a three-month delay in reporting); (ii) DHN Drinks (Pty) Ltd. which has a 30 June reporting date, and; (iii) United Breweries Limited and Millennium Alcobev Private Limited which have a 31 March reporting date. The results of (ii) and (iii) have been adjusted to include numbers for the full financial year ended 31 December 2011.
2011 2010Share of profit of associates and
joint ventures and impairments thereof
Income associates 25 28
Income joint ventures 215 165
Impairments – –
240 193
In the year APB (the JV of HEINEKEN and its partner Fraser and Neave) completed the sale of Kingway Brewery for SGD205 (€116 million) of which SGD72 (€41 million) was recorded as income by APB. As HEINEKEN has a share of 45.95% a capital gain of SGD33 million (€19 million) is included in the share of profit of JV’s.
Summary financial information for equity
accounted joint ventures and associates
Joint ventures Associates
2011 2010 2011 2010
Non-current assets 1,708 1,696 73 50
Current assets 1,005 869 52 51
Non-current liabilities (581) (611) (25) (28)
Current liabilities (725) (684) (30) (23)
Revenue 2,313 2,108 153 547
Expenses (1,914) (1,887) (117) (420)
In the above table HEINEKEN represents its share of the aggregated amounts of assets, liabilities, revenues and expenses for its joint ventures and associates for the year ended 31 December.

H E I N E K E N H O L D I N G N .V. A N N U A L R E P O R T 2 0 11
84
N O T E S T O T H E C O N S O L I D AT E D F I N A N C I A L S TAT E M E N T S
note 17 OTHER INVESTMENTS AND RECEIVABLES
Sensitivity analysis – equity price riskAn amount of €95 million as at 31 December 2011 (2010: €87 million) of available-for-sale investments and investments held for trading is listed on stock exchanges. An impact of 1% increase or decrease in the share price on the reporting date would not result in a material impact on a consolidated Group level.
2011 2010Non-current other investments
Loans and advances to customers note 32 384 455
Indemnification receivable note 32 156 145
Other receivables note 32 178 174
Held-to-maturity investments note 32 5 4
Available-for-sale investments note 32 264 190
Non-current derivatives note 32 142 135
1,129 1,103
Current other investments
Investments held for trading note 32 14 17
14 17
Included in loans are loans to customers with a carrying amount of €120 million as at 31 December 2011 (2010: €166 million). Effective interest rates range from 6% to 12%. €72 million (2010: €100 million) matures between 1 and 5 years and €48 million (2010: €66 million) after 5 years. The indemnification receivable represents the receivable on FEMSA and Lewiston investments and is a mirroring of the corresponding indemnified liabilities originating from the acquisition of the beer operations of FEMSA and Sona. The other receivables mainly originate from the acquisition of the beer operations of FEMSA and represent a receivable on the Brazilian Authorities on which interest is calculated in
accordance with Brazilian legislation. Collection of this receivable is expected to be beyond a period of 5 years. The main available-for-sale investments are S.A. Des Brasseries du Cameroun, Consorcio Cervecero de Nicaragua S.A., Desnoes & Geddes Ltd., Brasserie Nationale d’Haiti S.A. and Cerveceria Nacional Dominicana. As far as these investments are listed they are measured at their quoted market price. For others the value in use or multiples are used. Debt securities (which are interest-bearing) with a carrying amount of €20 million (2010: €21 million) are included in available-for-sale investments.

F I N A N C I A L S TAT E M E N T S 2 0 11
85
N O T E S T O T H E C O N S O L I D AT E D F I N A N C I A L S TAT E M E N T S
note 18 DEFERRED TAX ASSETS AND LIABILITIES
Recognised deferred tax assets and liabilities Assets Liabilities Net
Deferred tax assets and liabilities are
attributable to the following items:
2011 2010 2011 2010 2011 2010
Property, plant & equipment 93 86 (590) (550) (497) (464)
Intangible assets 51 62 (733) (789) (682) (727)
Investments 91 87 (6) (9) 85 78
Inventories 16 33 (5) (6) 11 27
Loans and borrowings 3 1 – (2) 3 (1)
Employee benefits 252 254 12 11 264 265
Provisions 150 133 1 1 151 134
Other items 146 77 (138) (51) 8 26
Tax losses carry-forwards 237 213 – – 237 213
Tax assets/(liabilities) 1,039 946 (1,459) (1,395) (420) (449)
Set-off of tax (565) (404) 565 404 – –
Net tax assets/(liabilities) 474 542 (894) (991) (420) (449)
2011 2010Tax losses carry-forwards
HEINEKEN has losses carry-forwards for
an amount of €1,920 million as at
31 December 2011 (2010: €1,833 million),
which expire in the following years:
2011 – 11
2012 5 8
2013 6 32
2014 28 30
2015 23 32
2016 36 –
After 2016 respectively 2015 but not unlimited 372 314
Unlimited 1,450 1,406
1,920 1,833
Recognised as deferred tax assets gross (859) (807)
Unrecognised 1,061 1,026
The unrecognised losses relate to entities for which it is not probable that taxable profit will be available to offset these losses. The majority of the unrecognised losses were acquired as part of the beer operations of FEMSA in 2010.
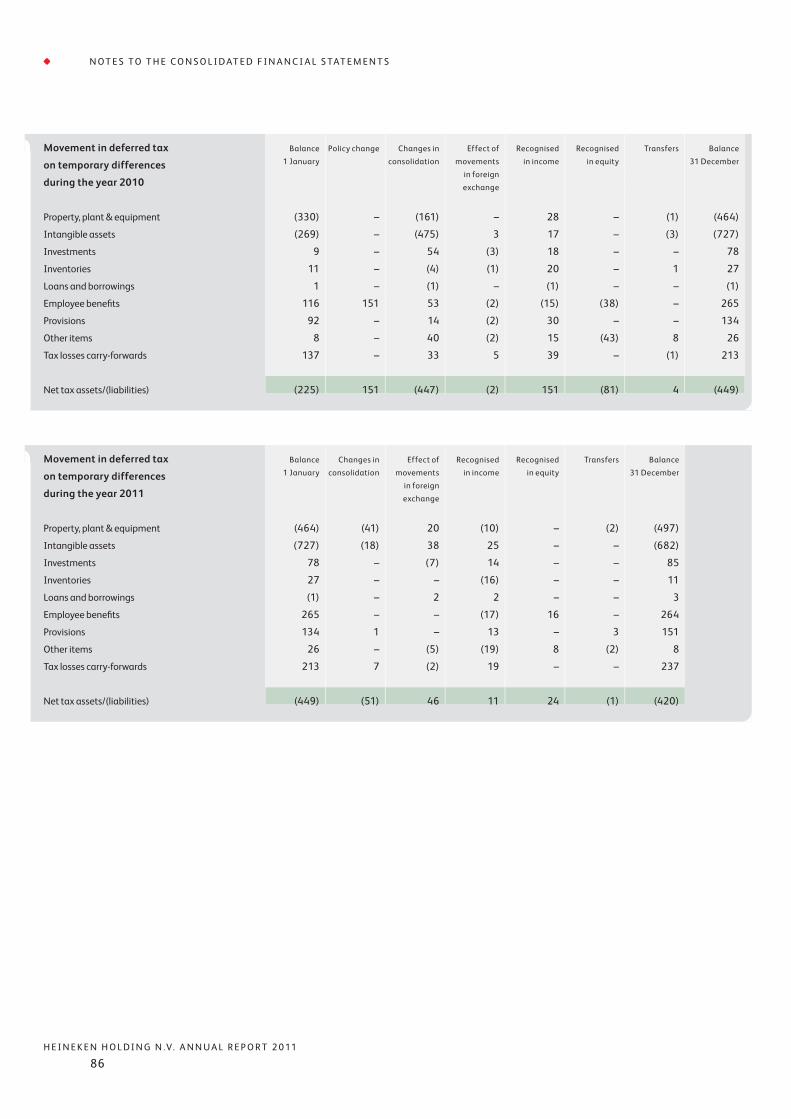
H E I N E K E N H O L D I N G N .V. A N N U A L R E P O R T 2 0 11
86
N O T E S T O T H E C O N S O L I D AT E D F I N A N C I A L S TAT E M E N T S
Movement in deferred tax
on temporary differences
during the year 2010
Balance 1 January
Policy change Changes in consolidation
Effect of movements
in foreign exchange
Recognised in income
Recognised in equity
Transfers Balance 31 December
Property, plant & equipment (330) – (161) – 28 – (1) (464)
Intangible assets (269) – (475) 3 17 – (3) (727)
Investments 9 – 54 (3) 18 – – 78
Inventories 11 – (4) (1) 20 – 1 27
Loans and borrowings 1 – (1) – (1) – – (1)
Employee benefits 116 151 53 (2) (15) (38) – 265
Provisions 92 – 14 (2) 30 – – 134
Other items 8 – 40 (2) 15 (43) 8 26
Tax losses carry-forwards 137 – 33 5 39 – (1) 213
Net tax assets/(liabilities) (225) 151 (447) (2) 151 (81) 4 (449)
Movement in deferred tax
on temporary differences
during the year 2011
Balance 1 January
Changes in consolidation
Effect of movements
in foreign exchange
Recognised in income
Recognised in equity
Transfers Balance 31 December
Property, plant & equipment (464) (41) 20 (10) – (2) (497)
Intangible assets (727) (18) 38 25 – – (682)
Investments 78 – (7) 14 – – 85
Inventories 27 – – (16) – – 11
Loans and borrowings (1) – 2 2 – – 3
Employee benefits 265 – – (17) 16 – 264
Provisions 134 1 – 13 – 3 151
Other items 26 – (5) (19) 8 (2) 8
Tax losses carry-forwards 213 7 (2) 19 – – 237
Net tax assets/(liabilities) (449) (51) 46 11 24 (1) (420)

F I N A N C I A L S TAT E M E N T S 2 0 11
87
N O T E S T O T H E C O N S O L I D AT E D F I N A N C I A L S TAT E M E N T S
2011 2010Raw materials 263 241
Work in progress 150 147
Finished products 354 261
Goods for resale 205 231
Non-returnable packaging 143 120
Other inventories and spare parts 237 206
1,352 1,206
During 2011 and 2010 no write-down of inventories to net realisable value was required.
note 19 INVENTORIES
note 20 TRADE AND OTHER RECEIVABLES
2011 2010Trade receivables due from associates
and joint ventures 42 102
Trade receivables 1,657 1,680
Other receivables 524 481
Derivatives 37 10
note 32 2,260 2,273
A net impairment loss of €57 million (2010: €115 million) in respect of trade and other receivables was included in expenses for raw materials, consumables and services.
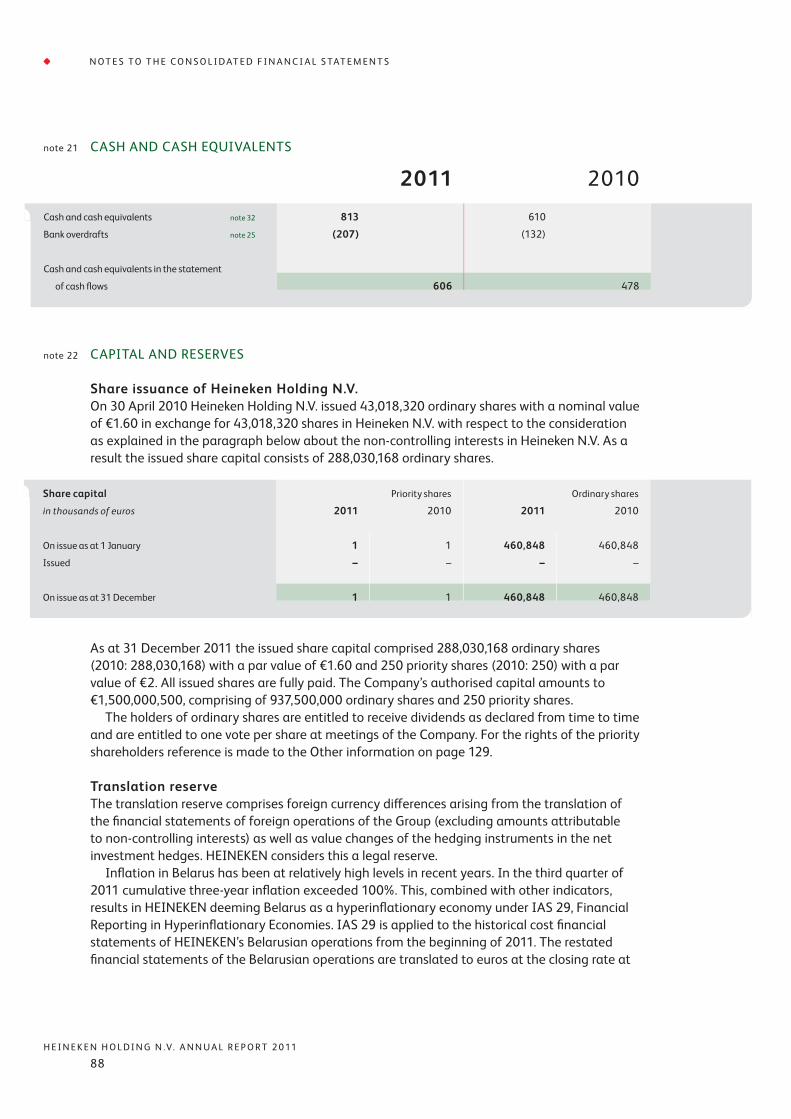
H E I N E K E N H O L D I N G N .V. A N N U A L R E P O R T 2 0 11
88
N O T E S T O T H E C O N S O L I D AT E D F I N A N C I A L S TAT E M E N T S
Share issuance of Heineken Holding N.V.On 30 April 2010 Heineken Holding N.V. issued 43,018,320 ordinary shares with a nominal value of €1.60 in exchange for 43,018,320 shares in Heineken N.V. with respect to the considerationas explained in the paragraph below about the non-controlling interests in Heineken N.V. As a result the issued share capital consists of 288,030,168 ordinary shares.
As at 31 December 2011 the issued share capital comprised 288,030,168 ordinary shares(2010: 288,030,168) with a par value of €1.60 and 250 priority shares (2010: 250) with a par value of €2. All issued shares are fully paid. The Company’s authorised capital amounts to€1,500,000,500, comprising of 937,500,000 ordinary shares and 250 priority shares. The holders of ordinary shares are entitled to receive dividends as declared from time to time and are entitled to one vote per share at meetings of the Company. For the rights of the priority shareholders reference is made to the Other information on page 129.
Translation reserveThe translation reserve comprises foreign currency differences arising from the translation of the financial statements of foreign operations of the Group (excluding amounts attributable to non-controlling interests) as well as value changes of the hedging instruments in the net investment hedges. HEINEKEN considers this a legal reserve. Inflation in Belarus has been at relatively high levels in recent years. In the third quarter of2011 cumulative three-year inflation exceeded 100%. This, combined with other indicators, results in HEINEKEN deeming Belarus as a hyperinflationary economy under IAS 29, Financial Reporting in Hyperinflationary Economies. IAS 29 is applied to the historical cost financial statements of HEINEKEN’s Belarusian operations from the beginning of 2011. The restated financial statements of the Belarusian operations are translated to euros at the closing rate at
2011 2010Cash and cash equivalents note 32 813 610
Bank overdrafts note 25 (207) (132)
Cash and cash equivalents in the statement
of cash flows 606 478
note 21 CASH AND CASH EQUIVALENTS
note 22 CAPITAL AND RESERVES
Share capital Priority shares Ordinary shares
in thousands of euros 2011 2010 2011 2010
On issue as at 1 January 1 1 460,848 460,848
Issued – – – –
On issue as at 31 December 1 1 460,848 460,848

F I N A N C I A L S TAT E M E N T S 2 0 11
89
N O T E S T O T H E C O N S O L I D AT E D F I N A N C I A L S TAT E M E N T S
the end of the reporting period. Differences arising on translation to euros are recognised in the translation reserve. The Consumer Price Index end of 2011 was 224.9 (2009: 100; 2010: 107.8) and increased in 2011 by 108.7. The impact on equity is a net amount of €14 million, P, P & E remeasurement of €18 million with offset in deferred tax liabilities for €4 million. The impact on the income statement for2011 is not material.
Hedging reserveThis reserve comprises the effective portion of the cumulative net change in the fair value of cash flow hedging instruments where the hedged transaction has not yet occurred. HEINEKEN considers this a legal reserve.
Fair value reserveThis reserve comprises the cumulative net change in the fair value of available-for-sale investments until the investment is derecognised or impaired. HEINEKEN considers this a legal reserve.
Other legal reservesThese reserves relate to the share of profit of joint ventures and associates over the distribution of which HEINEKEN does not have control. The movement in these reserves reflects retained earnings of joint ventures and associates minus dividends received. In case of a legal or other restriction which causes that retained earnings of subsidiaries cannot be freely distributed, a legal reserve is recognised for the restricted part.
Non-controlling interests in Heineken N.V.
Share issuance Heineken N.V.On 30 April 2010 Heineken N.V. issued 86,028,019 ordinary shares with a nominal value of €1.60, as a result of which the issued share capital consists of 576,002,613 shares. To these shares a share premium value was assigned of €2,701 million based on the quoted market price value of 43,009,699 shares Heineken N.V. and 43,018,320 shares Heineken Holding N.V. combined being the share consideration paid to Fomento Económico Mexicano, S.A.B. de C.V. (FEMSA) for its beer operations.
Allotted Share Delivery InstrumentIn addition to the shares issued to FEMSA, Heineken N.V. also committed itself to deliver29,172,504 additional Heineken N.V. shares to FEMSA (the ‘Allotted Shares’/ASDI) over a period of no longer than five years. This financial instrument is classified to be equity of Heineken N.V. as the number of shares is fixed. Heineken N.V. had the option to accelerate the delivery of the Allotted Shares at its discretion. Pending delivery of the Allotted Shares, Heineken N.V. paid a coupon on each undelivered Allotted Share such that FEMSA was compensated, on an after tax basis, for dividends FEMSA would have received had all such Allotted Shares been delivered to FEMSA on or prior to the record date for such dividends. On 3 October 2011, Heineken N.V. announced that the share repurchase programme in connection with the acquisition of FEMSA had been completed. During the period of 1 January through 31 December 2011 Heineken N.V. acquired 18,407,246 shares with an average quoted market price of €36.67. During the year 2011 all these shares were delivered to FEMSA under the ASDI.
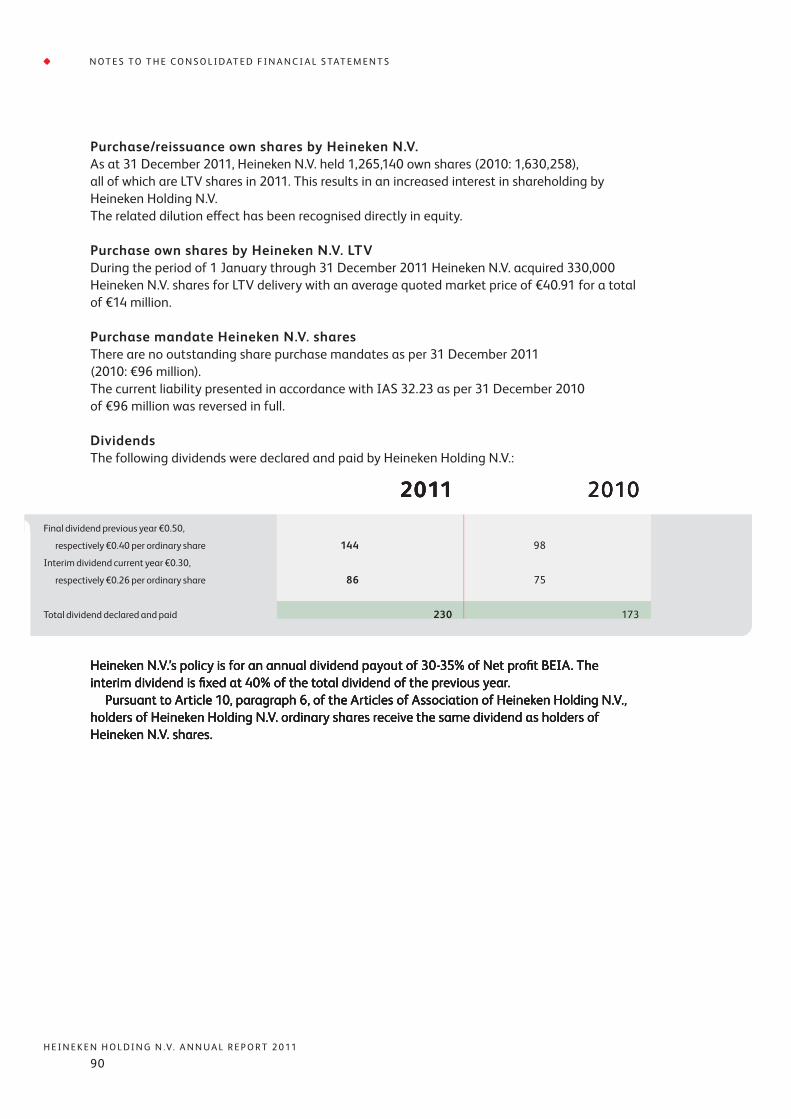
H E I N E K E N H O L D I N G N .V. A N N U A L R E P O R T 2 0 11
90
N O T E S T O T H E C O N S O L I D AT E D F I N A N C I A L S TAT E M E N T S
Purchase/reissuance own shares by Heineken N.V.As at 31 December 2011, Heineken N.V. held 1,265,140 own shares (2010: 1,630,258), all of which are LTV shares in 2011. This results in an increased interest in shareholding by Heineken Holding N.V.The related dilution effect has been recognised directly in equity.
Purchase own shares by Heineken N.V. LTVDuring the period of 1 January through 31 December 2011 Heineken N.V. acquired 330,000 Heineken N.V. shares for LTV delivery with an average quoted market price of €40.91 for a total of €14 million.
Purchase mandate Heineken N.V. sharesThere are no outstanding share purchase mandates as per 31 December 2011 (2010: €96 million).The current liability presented in accordance with IAS 32.23 as per 31 December 2010 of €96 million was reversed in full.
DividendsThe following dividends were declared and paid by Heineken Holding N.V.:
Heineken N.V.’s policy is for an annual dividend payout of 30-35% of Net profit BEIA. The interim dividend is fixed at 40% of the total dividend of the previous year. Pursuant to Article 10, paragraph 6, of the Articles of Association of Heineken Holding N.V., holders of Heineken Holding N.V. ordinary shares receive the same dividend as holders of Heineken N.V. shares.
Heineken N.V.’s policy is for an annual dividend payout of 30-35% of Net profit BEIA. The interim dividend is fixed at 40% of the total dividend of the previous year. Pursuant to Article 10, paragraph 6, of the Articles of Association of Heineken Holding N.V., holders of Heineken Holding N.V. ordinary shares receive the same dividend as holders of Heineken N.V. shares.
Heineken N.V.’s policy is for an annual dividend payout of 30-35% of Net profit BEIA. The interim dividend is fixed at 40% of the total dividend of the previous year. Pursuant to Article 10, paragraph 6, of the Articles of Association of Heineken Holding N.V., holders of Heineken Holding N.V. ordinary shares receive the same dividend as holders of Heineken N.V. shares.
Heineken N.V.’s policy is for an annual dividend payout of 30-35% of Net profit BEIA. The interim dividend is fixed at 40% of the total dividend of the previous year. Pursuant to Article 10, paragraph 6, of the Articles of Association of Heineken Holding N.V., holders of Heineken Holding N.V. ordinary shares receive the same dividend as holders of Heineken N.V. shares.
2011 2010Final dividend previous year €0.50,
respectively €0.40 per ordinary share 144 98
Interim dividend current year €0.30,
respectively €0.26 per ordinary share 86 75
Total dividend declared and paid 230 173
2011 2010Final dividend previous year €0.50,
respectively €0.40 per ordinary share 144 98
Interim dividend current year €0.30,
respectively €0.26 per ordinary share 86 75
Total dividend declared and paid 230 173
2011 2010Final dividend previous year €0.50,
respectively €0.40 per ordinary share 144 98
Interim dividend current year €0.30,
respectively €0.26 per ordinary share 86 75
Total dividend declared and paid 230 173
2011 2010Final dividend previous year €0.50,
respectively €0.40 per ordinary share 144 98
Interim dividend current year €0.30,
respectively €0.26 per ordinary share 86 75
Total dividend declared and paid 230 173

F I N A N C I A L S TAT E M E N T S 2 0 11
91
N O T E S T O T H E C O N S O L I D AT E D F I N A N C I A L S TAT E M E N T S
After the balance sheet date the Board of Directors announced the following dividends. The dividends, taking into account the interim dividends declared and paid, have not been provided for.
2011 2010
Per ordinary share €0.83 (2010: €0.76) 239 219
note 23 EARNINGS PER SHARE
Basic earnings per shareThe calculation of basic earnings per share as at 31 December 2011 is based on the profit attributable to ordinary shareholders of the Company (net profit) of €717 million (2010: €726 million) and a weighted average number of ordinary shares – basic outstanding during the year ended 31 December 2011 of 288,030,168 (2010: 273,690,728). Basic earnings per share for the year amounts to €2.49 (2010: €2.65).
2011 2010Weighted average number
of ordinary shares – basic
Number of ordinary shares – basic –
as at 1 January 288,030,168 245,011,848
Effect of new ordinary shares issued – 28,678,880
Weighted number of basic ordinary shares
for the year 288,030,168 273,690,728

H E I N E K E N H O L D I N G N .V. A N N U A L R E P O R T 2 0 11
92
N O T E S T O T H E C O N S O L I D AT E D F I N A N C I A L S TAT E M E N T S
note 24 INCOME TAX ON OTHER COMPREHENSIVE INCOME
Other comprehensive income Amount Tax Amount Amount Tax Amount
before tax net of tax before tax net of tax
2011 2011 2011 2010* 2010* 2010*
Foreign currency translation differences
for foreign operations (504) 11 (493)
390
– 390
Effective portion of changes in fair value
of cash flow hedge (31) 10 (21) 61 (18) 43
Effective portion of cash flow hedges
transferred to profit or loss (14) 3 (11)
65
(20)
45
Ineffective portion of cash flow hedges
transferred to profit or loss – – – 9 – 9
Net change in fair value available-for-sale
investments 71 – 71 16 (5) 11
Net change in fair value available-for-sale
investments transferred to profit or loss (1) – (1) (17) – (17)
Actuarial gains and losses (109) 16 (93) 137 (38) 99
Share of other comprehensive income
of associates/joint ventures (5) – (5) (29) – (29)
(593) 40 (553) 632 (81) 551
* Comparatives have been adjusted
due to the accounting policy change
in employee benefits (see note 2e).
The difference between the income tax on other comprehensive income and the deferred tax on equity (note 18) in 2011 can be explained by current tax on other comprehensive income.

F I N A N C I A L S TAT E M E N T S 2 0 11
93
N O T E S T O T H E C O N S O L I D AT E D F I N A N C I A L S TAT E M E N T S
2011 2010Non-current liabilities
Secured bank loans 37 48
Unsecured bank loans 3,607 3,260
Unsecured bond issues 2,493 2,482
Finance lease liabilities note 26 33 47
Other non-current interest-bearing liabilities 1,825 1,895
Non-current interest-bearing liabilities 7,995 7,732
Non-current derivatives 177 291
Non-current non-interest-bearing liabilities 27 55
8,199 8,078
Current interest-bearing liabilities
Current portion of secured bank loans 13 11
Current portion of unsecured bank loans 329 346
Current portion of finance lease liabilities note 26 6 48
Current portion of other non-current
interest-bearing liabilities 184 32
Total current portion of non-current
interest-bearing liabilities 532 437
Deposits from third parties (mainly
employee loans) 449 425
981 862
Bank overdrafts note 21 207 132
1,188 994
note 25 LOANS AND BORROWINGS
This note provides information about the contractual terms of HEINEKEN’s interest-bearing loans and borrowings. For more information about HEINEKEN’s exposure to interest rate risk and foreign currency risk, see note 32.

H E I N E K E N H O L D I N G N .V. A N N U A L R E P O R T 2 0 11
94
N O T E S T O T H E C O N S O L I D AT E D F I N A N C I A L S TAT E M E N T S
2011 2010Net interest-bearing debt position
Non-current interest-bearing liabilities 7,995 7,732
Current portion of non-current interest-
bearing liabilities 532
437
Deposits from third parties
(mainly employee loans) 449 425
8,976 8,594
Bank overdrafts note 21 207 132
9,183 8,726
Cash, cash equivalents and current other
investments (828)
(627)
8,355 8,099
Non-current liabilities Secured bank loans
Unsecured bank loans
Unsecured bond issues
Finance lease
liabilities
Other non-current
interest- bearing
liabilities
Non-current derivatives
Non-current non-interest-
bearing liabilities
Total
Balance as at 1 January 2011 48 3,260 2,482 47 1,895 291 55 8,078
Consolidation changes – – – – (24) – – (24)
Effect of movements in exchange rates (1) (35) – – 18 (4) (9) (31)
Transfers to current liabilities (6) (802) 3 (4) (169) (57) (7) (1,042)
Charge to/(from) profit or loss i/r derivatives – – – – – (8) – (8)
Charge to/(from) equity i/r derivatives – – – – – (26) – (26)
Proceeds 1 1,711 – 1 75 – (9) 1,779
Repayments (5) (568) 3 (11) (3) (19) (17) (620)
Other – 41 5 – 33 – 14 93
Balance as at 31 December 2011 37 3,607 2,493 33 1,825 177 27 8,199

F I N A N C I A L S TAT E M E N T S 2 0 11
95
N O T E S T O T H E C O N S O L I D AT E D F I N A N C I A L S TAT E M E N T S
Terms and debt repayment
schedule
Category Currency Nominal Repayment Carrying Face Carrying Face
interest
rate (%)
amount value amount value
2011 2011 2010 2010
Secured bank loans Bank Facilities GBP 1.9 2016 17 17 23 23
Secured bank loans Various various various various 33 33 36 36
Unsecured bank loans 2008 Syndicated Bank Facility EUR 0.4-1.7 2013 1,305 1,313 1,708 1,709
Unsecured bank loans Bank Facility EUR 6.0 2013-2016 329 329 434 434
Unsecured bank loans German Schuldschein notes EUR 1.0-6.0 2016 111 111 111 111
Unsecured bank loans German Schuldschein notes EUR 1.0-6.0 2012 102 102 102 102
Unsecured bank loans German Schuldschein notes EUR 1.0-6.0 2016 207 207 207 207
Unsecured bank loans 2008 Syndicated Bank Facility GBP 0.4-1.2 2013 287 287 336 340
Unsecured bank loans Bank Facilities PLN 5.4-5.6 2013-2014 72 72 60 60
Unsecured bank loans 2011 Syndicated Bank Facilities USD 0.8 2016 450 450 – –
Unsecured bank loans 2011 Syndicated Bank Facilities GBP 0.8 2016 422 422 – –
Unsecured bank loans 2011 Syndicated Bank Facilities EUR 0.8 2016 107 107 – –
Unsecured bank loans Bank Facilities USD 0.8 2012-2013 93 93 167 172
Unsecured bank loans Bank Facilities MXN 4.5-10.6 2012-2013 183 176 444 445
Unsecured bank loans Bank Facilities NGN 12.5-17.3 2012-2016 228 228 – –
Unsecured bank loans Various various various various 40 40 37 37
Unsecured bond Issue under EMTN programme GBP 7.3 2015 476 479 461 465
Unsecured bond Eurobond on Luxembourg
Stock Exchange EUR 5.0 2013 599 600 599 600
Unsecured bond Issue under EMTN programme EUR 7.1 2014 1,000 1,000 1,009 1,000
Unsecured bond Issue under EMTN programme EUR 4.6 2016 398 400 397 400
Unsecured bond issues n/a various various various 20 20 16 16
Other interest-bearing liabilities 2010 US private placement USD 4.6 2018 559 561 541 546
Other interest-bearing liabilities 2002 S&N US private placement USD 5.4-5.6 2012-2014 632 580 616 569
Other interest-bearing liabilities 2005 S&N US private placement USD 5.4 2015 258 232 247 225
Other interest-bearing liabilities 2008 US private placement USD 5.9-6.3 2015-2018 341 342 331 333
Other interest-bearing liabilities 2011 US private placement USD 2.8 2017 69 70 – –
Other interest-bearing liabilities 2008 US private placement EUR 7.25 2016 30 30 30 33
Other interest-bearing liabilities Various various various various 120 120 162 158
Deposits from third parties n/a various various various 449 449 425 425
Finance lease liabilities n/a various various various 39 39 95 100
8,976 8,909 8,594 8,546
Terms and debt repayment scheduleTerms and conditions of outstanding non-current and current loans and borrowings were as follows:
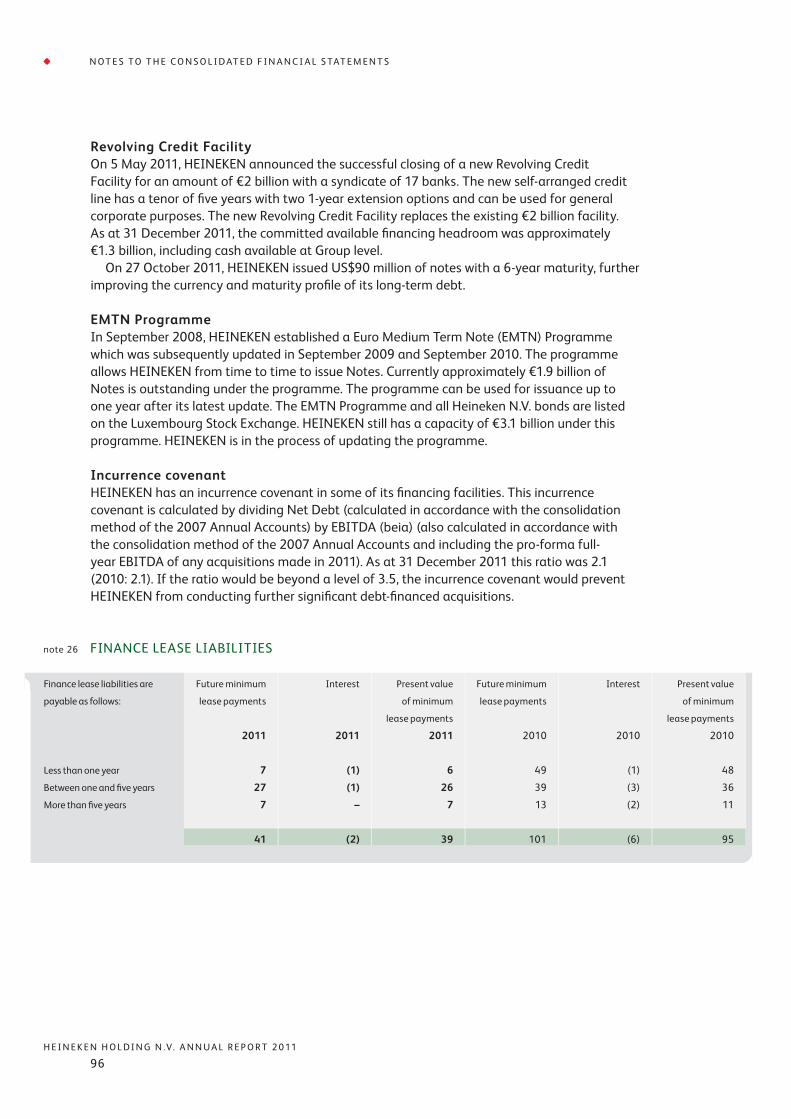
H E I N E K E N H O L D I N G N .V. A N N U A L R E P O R T 2 0 11
96
N O T E S T O T H E C O N S O L I D AT E D F I N A N C I A L S TAT E M E N T S
Revolving Credit Facility On 5 May 2011, HEINEKEN announced the successful closing of a new Revolving Credit Facility for an amount of €2 billion with a syndicate of 17 banks. The new self-arranged credit line has a tenor of five years with two 1-year extension options and can be used for general corporate purposes. The new Revolving Credit Facility replaces the existing €2 billion facility. As at 31 December 2011, the committed available financing headroom was approximately €1.3 billion, including cash available at Group level. On 27 October 2011, HEINEKEN issued US$90 million of notes with a 6-year maturity, further improving the currency and maturity profile of its long-term debt.
EMTN ProgrammeIn September 2008, HEINEKEN established a Euro Medium Term Note (EMTN) Programme which was subsequently updated in September 2009 and September 2010. The programme allows HEINEKEN from time to time to issue Notes. Currently approximately €1.9 billion of Notes is outstanding under the programme. The programme can be used for issuance up to one year after its latest update. The EMTN Programme and all Heineken N.V. bonds are listed on the Luxembourg Stock Exchange. HEINEKEN still has a capacity of €3.1 billion under this programme. HEINEKEN is in the process of updating the programme.
Incurrence covenant HEINEKEN has an incurrence covenant in some of its financing facilities. This incurrence covenant is calculated by dividing Net Debt (calculated in accordance with the consolidation method of the 2007 Annual Accounts) by EBITDA (beia) (also calculated in accordance with the consolidation method of the 2007 Annual Accounts and including the pro-forma full-year EBITDA of any acquisitions made in 2011). As at 31 December 2011 this ratio was 2.1 (2010: 2.1). If the ratio would be beyond a level of 3.5, the incurrence covenant would prevent HEINEKEN from conducting further significant debt-financed acquisitions.
Finance lease liabilities are
payable as follows:
Future minimum Interest Present value Future minimum Interest Present value
lease payments of minimum lease payments of minimum
lease payments lease payments
2011 2011 2011 2010 2010 2010
Less than one year 7 (1) 6 49 (1) 48
Between one and five years 27 (1) 26 39 (3) 36
More than five years 7 – 7 13 (2) 11
41 (2) 39 101 (6) 95
note 26 FINANCE LEASE LIABILITIES

F I N A N C I A L S TAT E M E N T S 2 0 11
97
N O T E S T O T H E C O N S O L I D AT E D F I N A N C I A L S TAT E M E N T S
In the internal management reports HEINEKEN measures its performance primarily based on EBIT and EBIT (beia), these are non-GAAP measures not calculated in accordance with IFRS. A similar non-GAAP adjustment can be made to the IFRS profit or loss as defined in IAS 1 paragraph 7 being the total of income less expense. Exceptional items are defined as items of income and expense of such size, nature or incidence, that in the view of management their disclosure is relevant to explain the performance of HEINEKEN for the period. The table below presents the relationship with IFRS terms, the results from operating activities and profit and HEINEKEN non-GAAP measures being EBIT, EBIT (beia) and profit (beia) for the financial year 2011.
note 27 NON-GAAP MEASURES
2011* 2010*Results from operating activities 2,215 2,298
Share of profit of associates and joint
ventures and impairments thereof
(net of income tax) 240 193
HEINEKEN EBIT 2,455 2,491
Exceptional items and amortisation
included in EBIT 242 132
HEINEKEN EBIT (beia) 2,697 2,623
Profit attributable to equity holders of
Heineken Holding N.V. 717 726
Non-controlling interests in Heineken N.V. 713 721
1,430 1,447
Exceptional items and amortisation included
in EBIT 242 132
Exceptional items included in finance costs (14) (5)
Exceptional items included in tax expense (74) (118)
HEINEKEN net profit beia 1,584 1,456
* Unaudited
The exceptional items included in EBIT contain the amortisation of brands and customer relations for €170 million (2010: €142 million). The EU fine reduction of €21 million (gain), gain on sale of brands €24 million, redundancies and contract settlements for €81 million and the early amortisation and termination of contracts for €36 million relating to the Galaxy pub estate. Exceptional items in the other net financing costs reflects fair value movements on interest rate swaps made by Scottish & Newcastle in the past that do not qualify for hedge accounting under IFRS. The tax expense exceptional items are for €47 million (2010: €39 million) related to amortisation of brands and customer relations and the remainder relates to the other exceptional items included in EBIT. EBIT and EBIT (beia) are not financial measures calculated in accordance with IFRS. The presentation on these financial measures may not be comparable to similarly titled measures reported by other companies due to differences in the ways the measures are calculated.

H E I N E K E N H O L D I N G N .V. A N N U A L R E P O R T 2 0 11
98
N O T E S T O T H E C O N S O L I D AT E D F I N A N C I A L S TAT E M E N T S
Liability for defined benefit obligationsHEINEKEN makes contributions to a number of defined benefit plans that provide pension benefits for employees upon retirement in a number of countries being mainly the Netherlands and the UK (83% of the total DBO). Other countries with a defined benefit plan are: Ireland, Greece, Austria, Italy, France, Spain, Mexico, Belgium, Switzerland, Portugal and Nigeria. In other countries the pension plans are defined contribution plans and/or similar arrangements for employees. In the UK the defined benefit scheme for employees (actives) was closed in 2011 and was replaced by a defined contribution scheme. The remaining defined benefit schemes in the UK are now closed for new entrants. Other long-term employee benefits mainly relate to long-term bonus plans, termination benefits, medical plans and jubilee benefits.
2011 2010*Present value of unfunded obligations 96 118
Present value of funded obligations 6,804 6,525
Total present value of obligations 6,900 6,643
Fair value of plan assets (5,860) (5,646)
Present value of net obligations 1,040 997
Asset ceiling items 14 –
Recognised liability for defined benefit obligations 1,054 997
Other long-term employee benefits 120 100
1,174 1,097
* Comparatives have been adjusted
due to the accounting policy change
in employee benefits (see note 2e).
2011 2010Plan assets comprise:
Equity securities 2,520 2,484
Government bonds 2,534 2,421
Properties and real estate 410 436
Other plan assets 396 305
5,860 5,646
The primary goal of the Heineken pension funds is to monitor the mix of debt and equity securities in its investment portfolio based on market expectations. Material investments within the portfolio are managed on an individual basis.
note 28 EMPLOYEE BENEFITS
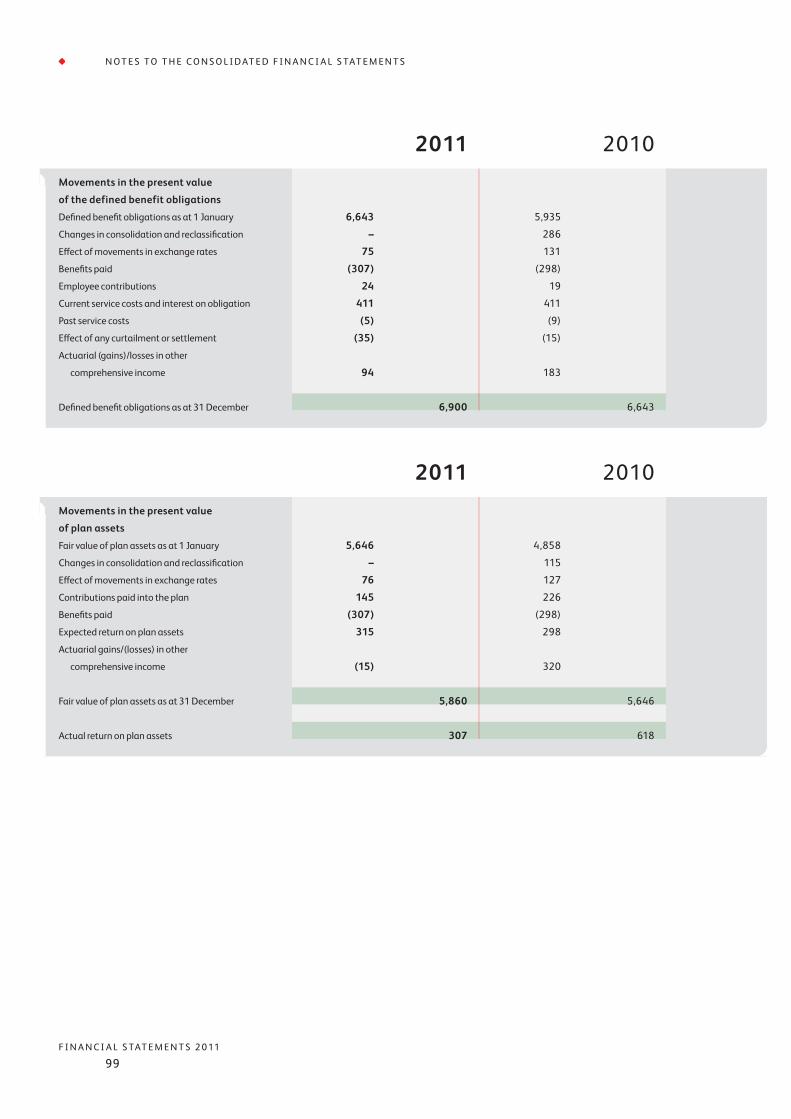
F I N A N C I A L S TAT E M E N T S 2 0 11
99
N O T E S T O T H E C O N S O L I D AT E D F I N A N C I A L S TAT E M E N T S
2011 2010Movements in the present value
of the defined benefit obligations
Defined benefit obligations as at 1 January 6,643 5,935
Changes in consolidation and reclassification – 286
Effect of movements in exchange rates 75 131
Benefits paid (307) (298)
Employee contributions 24 19
Current service costs and interest on obligation 411 411
Past service costs (5) (9)
Effect of any curtailment or settlement (35) (15)
Actuarial (gains)/losses in other
comprehensive income 94
183
Defined benefit obligations as at 31 December 6,900 6,643
2011 2010Movements in the present value
of plan assets
Fair value of plan assets as at 1 January 5,646 4,858
Changes in consolidation and reclassification – 115
Effect of movements in exchange rates 76 127
Contributions paid into the plan 145 226
Benefits paid (307) (298)
Expected return on plan assets 315 298
Actuarial gains/(losses) in other
comprehensive income (15) 320
Fair value of plan assets as at 31 December 5,860 5,646
Actual return on plan assets 307 618

H E I N E K E N H O L D I N G N .V. A N N U A L R E P O R T 2 0 11
100
N O T E S T O T H E C O N S O L I D AT E D F I N A N C I A L S TAT E M E N T S
2011 2010*Expense recognised in profit or loss
Current service costs 71 77
Interest on obligation 340 334
Expected return on plan assets (315) (298)
Past service costs (5) (9)
Effect of any curtailment or settlement (35) (15)
note 10 56 89
* Comparatives have been adjusted
due to the accounting policy change
in employee benefits (see note 2e).
2011 2010Actuarial gains and losses recognised
in other comprehensive income
Amount accumulated in retained earnings
as at 1 January 410 547
Recognised during the year 109 (137)
Amount accumulated in retained earnings
as at 31 December 519 410
The Netherlands UK
2011 2010 2011 2010
Expected return on plan assets 125 121 152 145
Actual return on plan assets 62 275 226 304
Variance (63) 154 74 159
Principal actuarial assumptions as at the balance sheet date The defined benefit plans in the Netherlands and the UK cover 87.2% of the present value of the plan assets (2010: 86.8%), 82.8% of the present value of the defined benefit obligations (2010: 81.7%) and 57.8% of the present value of net obligations (2010: 52.9%) as at 31 December 2011. The table below presents the expected return on plan assets compared to the actual return on plan assets for the main defined benefit plans.

F I N A N C I A L S TAT E M E N T S 2 0 11
101
N O T E S T O T H E C O N S O L I D AT E D F I N A N C I A L S TAT E M E N T S
The Netherlands UK
2011 2010 2011* 2010
Discount rate as at 31 December 4.6 5.1 4.7 5.4
Expected return on plan assets as at 1 January 5.5 5.7 6.2 6.4
Future salary increases 3.0 3.0 – 4.6
Future pension increases 1.0 1.5 3.0 3.0
Medical cost trend rate – – – 7.0
* The UK plan closed for future
accruals leading to certain
assumptions being equal to zero.
For the Netherlands and the UK the following actuarial assumptions apply as at 31 December 2011:
For the other defined benefit plans the following actuarial assumptions apply as at 31 December 2011:
Other Western,
Central and
Eastern Europe
The Americas Africa and the
Middle East
2011 2010 2011 2010 2011 2010
Discount rate as at 31 December 2.9-4.8 2.4-5.8 7.6-10.7 7.0-7.6 13.0 7.0-10.0
Expected return on plan assets as at 1 January 3.3-7.3 2.9-7.3 7.6 6.5-8.2 – –
Future salary increases 1.0-10.0 1.0-10.0 3.8 3.8-5.5 12.0 5.0-10.0
Future pension increases 1.0-2.1 1.0-2.1 2.9 2.8-3.0 – –
Medical cost trend rate 3.5 3.5-4.5 5.1 5.1 – –
Assumptions regarding future mortality rates are based on published statistics and mortality tables. For the Netherlands the rates are obtained from the ‘AG-Prognosetafel 2010-2060’, fully generational. Correction factors from Towers Watson are applied on these. For the UK the rates are obtained from the Continious Mortality Investigation 2011 projection model. The overall expected long-term rate of return on assets is 5.5% (2010: 6%), which is based on the asset mix and the expected rate of return on each major asset class, as managed by the pension funds. Assumed healthcare cost trend rates have no effect on the amounts recognised in profit or loss. A one percentage point change in assumed healthcare cost trend rates would not have any effect on profit or loss neither on the statement of financial position as at 31 December 2011.
Based on the most recent triannual review finalised in early 2010, HEINEKEN has agreed a 12-year plan aiming to fund the recovery of the Scottish & Newcastle pension fund through additional contributions. These could total £504 million of which £35 million has been paid to December 2011. As at 31 December 2011 the IAS 19 present value of the net obligations of the Scottish & Newcastle pension fund represents a £465 million (€557 million) deficit. No additional liability has to be recognised as the net present value of the minimum funding requirement does not exceed the net obligation. The start of the next review of the funding position and the recovery plan will take place no later than around year-end 2012 and is not expected to be finalised beginning 2013. The Group expects the 2012 contributions to be paid for the defined benefit plan to be in line with 2011.

H E I N E K E N H O L D I N G N .V. A N N U A L R E P O R T 2 0 11
102
N O T E S T O T H E C O N S O L I D AT E D F I N A N C I A L S TAT E M E N T S
Historical information 2011 2010 2009 2008 2007
Present value of the defined benefit obligation 6,900 6,643 5,936 4,963 2,858
Fair value of plan assets (5,860) (5,646) (4,858) (4,231) (2,535)
Deficit in the plan 1,040 997 1,078 732 323
Experience adjustments arising on plan
liabilities, losses/(gains) (30) (24) (116) 71 (4)
Experience adjustments arising on plan
assets, (losses)/gains (15) 320 313 (817) 16
note 29 SHARE-BASED PAYMENTS – LONG-TERM VARIABLE AWARD
As from 1 January 2005 HEINEKEN established a performance-based share plan (Long-Term Variable award; LTV) for the Executive Board of Heineken N.V. As from 1 January 2006 a similar plan was established for senior management. Under this LTV Heineken N.V. share rights are awarded to incumbents on an annual basis. The vesting of these rights is subject to the performance of HEINEKEN on specific performance conditions over a three year period. The LTV 2009-2011 performance condition for the Executive Board is HEINEKEN’s Relative Total Shareholder Return (RTSR) or HEINEKEN’s TSR performance in comparison with the TSR performance of a selected peer group. The LTV 2009-2011 performance conditions for senior management are RTSR (25%) and internal financial measures (75%). The performance conditions for LTV 2010-2012 and LTV 2011-2013 are the same for the Executive Board and senior management and comprise solely of internal financial measures, being Organic Gross Profit beia growth, Organic EBIT beia growth, Earnings Per Share (EPS) beia growth and Free Operating Cash Flow. At target performance, 100% of the awarded shares vest. At threshold performance, 50% of the awarded shares vest. At maximum performance 200% of the awarded shares vest for the Executive Board as well as senior managers contracted by the US and 175% vest for all other senior managers. The performance period for share rights granted in 2009 was from 1 January 2009 to 31 December 2011. The performance period for share rights granted in 2010 is from 1 January 2010 to 31 December 2012. The performance period for the share rights granted in 2011 is from 1 January 2011 to 31 December 2013. The vesting date for the Executive Board is within five business days and for senior management the latest of 1 April and twenty business days, after the publication of the annual results of 2011, 2012 and 2013 respectively. As HEINEKEN will withhold the tax related to vesting on behalf of the individual employees, the number of Heineken N.V. shares to be received by the Executive Board and senior management will be a net number.

F I N A N C I A L S TAT E M E N T S 2 0 11
103
N O T E S T O T H E C O N S O L I D AT E D F I N A N C I A L S TAT E M E N T S
Grant date/employees entitled Number * Based on
share price
Vesting
conditions
Contractual
life of rights
Share rights granted to Executive Board in 2009 53,083 21.90 Continued service and
RTSR performance
3 years
Share rights granted to senior management in 2009 562,862 21.90 Continued service,
75% internal performance
conditions and 25% RTSR
performance
3 years
Share rights granted to Executive Board in 2010 55,229 33.27 Continued service,
100% internal
performance conditions
3 years
Share rights granted to senior management in 2010 516,765 33.27 Continued service,
100% internal
performance conditions
3 years
Share rights granted to Executive Board in 2011 65,072 36.69 Continued service,
100% internal
performance conditions
3 years
Share rights granted to senior management in 2011 730,090 36.69 Continued service,
100% internal
performance conditions
3 years
Based on RTSR and internal performance, it is expected that approximately 593,428 shares will vest in 2012 for senior management.
* The number of shares is based
on target performance.
The terms and conditions of the Heineken N.V. share rights granted are as follows:

H E I N E K E N H O L D I N G N .V. A N N U A L R E P O R T 2 0 11
104
N O T E S T O T H E C O N S O L I D AT E D F I N A N C I A L S TAT E M E N T S
Weighted average Number of Weighted average Number of
share price share rights share price share rights
2011 2011 2010 2010*
Outstanding as at 1 January 30.11 1,575,880 30.35 1,481,269
Granted during the year 36.69 795,162 33.27 571,994
Forfeited during the year 31.73 (119,856) 30.89 (94,817)
Vested during the year 44.22 (234,485) 36.03 (253,377)
Performance adjustment – (470,187) – (129,189)
Outstanding as at 31 December 29.14 1,546,514 30.11 1,575,880
* The 2010 figures are restated to
reflect the performance adjustment
in number of shares.
In euros Executive Board Senior management
2009 2009
Fair value on grant date 512,359 8,478,659
Expected volatility (%) 22.8 22.8
Expected dividends (%) 2.1 2.1
No vesting occurred under the LTV 2008-2010 of the Executive Board. A total of 234,485 (gross) shares vested under the LTV 2008-2010 of senior management. Additionally, under extraordinary share plans 52,746 shares were granted and 17,864 (gross) shares vested. These extraordinary grants only have a service condition and vest between 1 and 5 years. The expenses relating to these expected additional grants are recognised in profit or loss during the vesting period. Expenses recognised in 2011 are €0.4 million (2010: €0.5 million).
The fair value of services received in return for share rights granted is based on the fair value of shares granted, measured using the Monte Carlo model (applicable for the LTV 2009-2011), with following inputs:
The number – as corrected for the expected performance for the various awards – and weighted average share price per share under the LTV of senior management are as follows:

F I N A N C I A L S TAT E M E N T S 2 0 11
105
N O T E S T O T H E C O N S O L I D AT E D F I N A N C I A L S TAT E M E N T S
2011 2010Personnel expenses
Share rights granted in 2008 – 3
Share rights granted in 2009 5 5
Share rights granted in 2010 1 7
Share rights granted in 2011 5 –
Total expense recognised
as personnel expenses
note 10 11 15
note 30 PROVISIONS
Restructuring Onerous contracts Other Total
Balance as at 1 January 2011 112 55 431 598
Changes in consolidation note 6 – – 15 15
Provisions made during the year 108 8 53 169
Provisions used during the year (61) (20) (42) (123)
Provisions reversed during the year (10) (3) (61) (74)
Effect of movements in exchange rates – – (13) (13)
Unwinding of discounts 2 2 13 17
Balance as at 31 December 2011 151 42 396 589
84 30 335 449Non-current
Current 67 12 61 140
151 42 396 589
RestructuringThe provision for restructuring of €151 million mainly relates to restructuring programmes in Spain, the Netherlands and the UK.
Other provisionsIncluded are, amongst others, surety and guarantees provided €27 million (2010: €56 million) and litigation and claims €207 million (2010: €230 million).

H E I N E K E N H O L D I N G N .V. A N N U A L R E P O R T 2 0 11
106
N O T E S T O T H E C O N S O L I D AT E D F I N A N C I A L S TAT E M E N T S
note 31 TRADE AND OTHER PAYABLES
2011 2010Trade payables 2,009 1,660
Returnable packaging deposits 490 434
Taxation and social security contributions 665 652
Dividend 33 53
Interest 100 97
Derivatives 164 66
Share purchase mandate – 96
Other payables 243 298
Accruals and deferred income 920 909
note 32 4,624 4,265
note 32 FINANCIAL RISK MANAGEMENT AND FINANCIAL INSTRUMENTS
OverviewHEINEKEN has exposure to the following risks from its use of financial instruments, as they arise in the normal course of HEINEKEN’s business:• Credit risk• Liquidity risk• Market risk.
This note presents information about HEINEKEN’s exposure to each of the above risks, and it summarises HEINEKEN’s policies and processes that are in place for measuring and managing risk, including those related to capital management. Further quantitative disclosures are included throughout these consolidated financial statements.
Risk management frameworkThe Executive Board of Heineken N.V., under the supervision of the Supervisory Board of Heineken N.V., has overall responsibility and sets rules for HEINEKEN’s risk management and control systems. They are reviewed regularly to reflect changes in market conditions and the Group’s activities. The Executive Board oversees the adequacy and functioning of the entire system of risk management and internal control, assisted by HEINEKEN Group departments. The Global Treasury function focuses primarily on the management of financial risk and financial resources. Some of the risk management strategies include the use of derivatives, primarily in the form of spot and forward exchange contracts and interest rate swaps, but options can be used as well. It is the Group policy that no speculative transactions are entered into.
Credit riskCredit risk is the risk of financial loss to HEINEKEN if a customer or counterparty to a financial instrument fails to meet its contractual obligations, and arises principally from HEINEKEN’s receivables from customers and investment securities. The economic crisis has impacted the regular business activities and performance, in particular in consumer spending and solvency. However, the business impact differed across

F I N A N C I A L S TAT E M E N T S 2 0 11
107
N O T E S T O T H E C O N S O L I D AT E D F I N A N C I A L S TAT E M E N T S
the regions and operations. Local management has assessed the risk exposure following Group instructions and is taking action to mitigate the higher than usual risks. Intensified and continuous focus is being given in the areas of customers (managing trade receivables and loans) and suppliers (financial position of critical suppliers). As at the balance sheet date there were no significant concentrations of credit risk. The maximum exposure to credit risk is represented by the carrying amount of each financial instrument, including derivative financial instruments, in the consolidated statement of financial position.
Loans to customersHEINEKEN’s exposure to credit risk is mainly influenced by the individual characteristics of each customer. HEINEKEN’s held-to-maturity investments includes loans to customers, issued based on a loan contract. Loans to customers are ideally secured by, amongst others, rights on property or intangible assets, such as the right to take possession of the premises of the customer. Interest rates calculated by HEINEKEN are at least based on the risk-free rate plus a margin, which takes into account the risk profile of the customer and value of security given. HEINEKEN establishes an allowance for impairment of loans that represents its estimate of incurred losses. The main components of this allowance are a specific loss component that relates to individually significant exposures, and a collective loss component established for groups of similar customers in respect of losses that have been incurred but not yet identified. The collective loss allowance is determined based on historical data of payment statistics. In a few countries the issue of new loans is outsourced to third parties. In most cases, HEINEKEN issues sureties (guarantees) to the third party for the risk of default by the customer.
Trade and other receivablesHEINEKEN’s local management has credit policies in place and the exposure to credit risk is monitored on an ongoing basis. Under the credit policies all customers requiring credit over a certain amount are reviewed and new customers are analysed individually for creditworthiness before HEINEKEN’s standard payment and delivery terms and conditions are offered. HEINEKEN’s review includes external ratings, where available, and in some cases bank references. Purchase limits are established for each customer and these limits are reviewed regularly. As a result of the deteriorating economic circumstances since 2008, certain purchase limits have been redefined. Customers that fail to meet HEINEKEN’s benchmark creditworthiness may transact with HEINEKEN only on a prepayment basis. In monitoring customer credit risk, customers are, on a country base, grouped according to their credit characteristics, including whether they are an individual or legal entity, which type of distribution channel they represent, geographic location, industry, ageing profile, maturity and existence of previous financial difficulties. Customers that are graded as ‘high risk’ are placed on a restricted customer list, and future sales are made on a prepayment basis only with approval of Management. HEINEKEN has multiple distribution models to deliver goods to end customers. Deliveries are done in some countries via own wholesalers, in other markets directly and in some others via third parties. As such distribution models are country specific and on consolidated level diverse, as such the results and the balance sheet items cannot be split between types of customers on a consolidated basis. The various distribution models are also not centrally managed or monitored. HEINEKEN establishes an allowance for impairment that represents its estimate of incurred losses in respect of trade and other receivables and investments. The components of this allowance are a specific loss component and a collective loss component.

H E I N E K E N H O L D I N G N .V. A N N U A L R E P O R T 2 0 11
108
N O T E S T O T H E C O N S O L I D AT E D F I N A N C I A L S TAT E M E N T S
Advances to customersAdvances to customers relate to an upfront cash-discount to customers. The advances are amortised over the term of the contract as a reduction of revenue. In monitoring customer credit risk, refer to the paragraph above relating to trade and other receivables.
InvestmentsHEINEKEN limits its exposure to credit risk by only investing available cash balances in liquid securities and only with counterparties that have a credit rating of at least single A or equivalent for short-term transactions and AA for long-term transactions. HEINEKEN actively monitors these credit ratings.
GuaranteesHEINEKEN’s policy is to avoid issuing guarantees where possible unless this leads to substantial benefits for the Group. In cases where HEINEKEN does provide guarantees, such as to banks for loans (to third parties), HEINEKEN aims to receive security from the third party. Heineken N.V. has issued a joint and several liability statement to the provisions of Section 403 of Book 2 of the Dutch Civil Code with respect to legal entities established in the Netherlands.
Exposure to credit riskThe carrying amount of financial assets represents the maximum credit exposure. The maximum exposure to credit risk on the reporting date was:
2011 2010Loans and advances to customers note 17 384 455
Indemnification receivable note 17 156 145
Other long-term receivables note 17 178 174
Held-to-maturity investments note 17 5 4
Available-for-sale investments note 17 264 190
Non-current derivatives note 17 142 135
Investments held for trading note 17 14 17
Trade and other receivables,
excluding current derivatives note 20 2,223
2,263
Current derivatives note 20 37 10
Cash and cash equivalents note 21 813 610
4,216 4,003

F I N A N C I A L S TAT E M E N T S 2 0 11
109
N O T E S T O T H E C O N S O L I D AT E D F I N A N C I A L S TAT E M E N T S
2011 2010Western Europe 1,038 997
Central and Eastern Europe 448 458
The Americas 405 497
Africa and the Middle East 166 151
Asia Pacific 19 19
Heineken N.V. Head Office/eliminations 147 141
2,223 2,263
The maximum exposure to credit risk for trade and other receivables (excluding derivatives) on the reporting date by geographic region was:
Gross
2011
Impairment
2011
Gross
2010
Impairment
2010
Not past due 1,909 (67) 1,894 (49)
Past due 0-30 days 233 (17) 250 (21)
Past due 31-120 days 210 (83) 271 (106)
More than 120 days 349 (311) 294 (270)
2,701 (478) 2,709 (446)
Impairment lossesThe ageing of trade and other receivables (excluding derivatives) on the reporting date was:
2011 2010Balance as at 1 January 446 378
Impairment loss recognised 104 168
Allowance used (17) (52)
Allowance released (47) (53)
Effect of movements in exchange rates (8) 5
Balance as at 31 December 478 446
The movement in the allowance for impairment in respect of trade and other receivables (excluding derivatives) during the year was as follows:

H E I N E K E N H O L D I N G N .V. A N N U A L R E P O R T 2 0 11
110
N O T E S T O T H E C O N S O L I D AT E D F I N A N C I A L S TAT E M E N T S
2011 2010Balance as at 1 January 171 165
Changes in consolidation – (8)
Impairment loss recognised 10 37
Allowance used (3) (23)
Allowance released (9) (2)
Effect of movements in exchange rates 1 2
Balance as at 31 December 170 171
Impairment losses recognised for trade and other receivables (excluding derivatives) and loans are part of the other non-cash items in the consolidated statement of cash flows. The income statement impact of €1 million (2010: €35 million) in respect of loans and the income statement impact of €57 million (2010: €115 million) in respect of trade receivables (excluding derivatives) were included in expenses for raw materials, consumables and services.
The allowance accounts in respect of trade and other receivables and held-to-maturity investments are used to record impairment losses, unless HEINEKEN is satisfied that no recovery of the amount owing is possible, at that point the amount considered irrecoverable is written off against the financial asset.
The movement in the allowance for impairment in respect of loans during the year was as follows:
Liquidity riskLiquidity risk is the risk that HEINEKEN will encounter difficulty in meeting the obligations associated with its financial liabilities that are settled by delivering cash or another financial asset. HEINEKEN’s approach to managing liquidity is to ensure, as far as possible, that it will always have sufficient liquidity to meet its liabilities when due, under both normal and stressed conditions, without incurring unacceptable losses or risking damage to HEINEKEN’s reputation. Recent times have proven the credit markets situation could be such that it is difficult to generate capital to finance long-term growth of HEINEKEN. Although currently the situation is more stable, HEINEKEN has a clear focus on ensuring sufficient access to capital markets to finance long-term growth and to refinance maturing debt obligations. Financing strategies are under continuous evaluation. In addition, HEINEKEN focuses on a further fine-tuning of the maturity profile of its long-term debts with its forecasted operating cash flows. Strong cost and cash management and controls over investment proposals are in place to ensure effective and efficient allocation of financial resources.

F I N A N C I A L S TAT E M E N T S 2 0 11
111
N O T E S T O T H E C O N S O L I D AT E D F I N A N C I A L S TAT E M E N T S
2011 Carrying
amount
Contractual
cash flows
Less than
1 year
1-2
years
2-5
years
More than
5 years
Financial liabilities
Interest-bearing liabilities 9,183 (10,287) (1,543) (2,864) (4,794) (1,086)
Non-interest-bearing liabilities 27 (20) 7 (16) (5) (6)
Trade and other payables, excluding interest,
dividends and derivatives 4,327 (4,327) (4,327) – – –
Derivative financial (assets) and liabilities
Interest rate swaps used for hedge accounting, net (12) 9 (42) 26 (42) 67
Forward exchange contracts used for hedge
accounting, net 46 (43) (35) (8) – –
Commodity derivatives used for hedge accounting, net 26 (26) (22) (4) – –
Derivatives not used for hedge accounting, net 102 (97) (86) (10) (1) –
13,699 (14,791) (6,048) (2,876) (4,842) (1,025)
The total carrying amount and contractual cash flows of derivatives are included in trade and other receivables (note 20) and trade and other payables (note 31) and non-current non-interest-bearing liabilities (note 25).
Contractual maturitiesThe following are the contractual maturities of non-derivative financial liabilities and derivative financial assets and liabilities, including interest payments and excluding the impact of netting agreements:
2010 Carrying
amount
Contractual
cash flows
Less than
1 year
1-2
years
2-5
years
More than
5 years
Financial liabilities
Interest-bearing liabilities 8,726 (10,073) (1,316) (830) (6,087) (1,840)
Non-interest-bearing liabilities 55 (58) (38) (7) (11) (2)
Trade and other payables, excluding interest,
dividends and derivatives 4,049 (4,073) (4,073) – – –
Derivative financial (assets) and liabilities
Interest rate swaps used for hedge accounting, net 123 (87) (25) (31) (78) 47
Forward exchange contracts used for hedge
accounting, net 7 (16) (20) 4 – –
Commodity derivatives used for hedge accounting, net 7 (7) (8) 3 (2) –
Derivatives not used for hedge accounting, net 75 (121) (77) (15) (29) –
13,042 (14,435) (5,557) (876) (6,207) (1,795)
The total carrying amount and contractual cash flows of derivatives are included in trade and other receivables (note 20), other investments (note 17), trade and other payables (note 31) and non-current non-interest-bearing liabilities (note 25).

H E I N E K E N H O L D I N G N .V. A N N U A L R E P O R T 2 0 11
112
N O T E S T O T H E C O N S O L I D AT E D F I N A N C I A L S TAT E M E N T S
Market riskMarket risk is the risk that changes in market prices, such as foreign exchange rates, interest rates, commodity prices and equity prices will affect HEINEKEN’s income or the value of its holdings of financial instruments. The objective of market risk management is to manage and control market risk exposures within acceptable parameters, while optimising the return on risk. HEINEKEN uses derivatives in the ordinary course of business, and also incurs financial liabilities, in order to manage market risks. Generally, HEINEKEN seeks to apply hedge accounting or make use of natural hedges in order to minimise the effects of foreign currency fluctuations in profit or loss. Derivatives that can be used are interest rate swaps, forward rate agreements, caps and floors, commo dity swaps, spot and forward exchange contracts and options. Transactions are entered into with a limited number of counterparties with strong credit ratings. Foreign currency, interest rate and commodity hedging operations are governed by internal policies and rules approved and monitored by the Executive Board of Heineken N.V.
Foreign currency riskHEINEKEN is exposed to foreign currency risk on sales, purchases and borrowings that are denominated in a currency other than the respective functional currencies of HEINEKEN entities. The main currencies that give rise to this risk are the US dollar, euro and British pound. In managing foreign currency risk, HEINEKEN aims to reduce the impact of short-term fluctuations on earnings. Over the longer term, however, permanent changes in foreign exchange rates would have an impact on profit. HEINEKEN hedges up to 90% of its mainly intra-HEINEKEN US dollar cash flows on the basis of rolling cash flow forecasts in respect to forecasted sales and purchases. Cash flows in other foreign currencies are also hedged on the basis of rolling cash flow forecasts. HEINEKEN mainly uses forward exchange contracts to hedge its foreign currency risk. The majority of the forward exchange contracts have maturities of less than one year after the balance sheet date. HEINEKEN has a clear policy on hedging transactional exchange risks, which postpones the impact on financial results. Translation exchange risks are hedged to a limited extent, as the underlying currency positions are generally considered to be long-term in nature. The result of the net investment hedging is recognised in the translation reserve as can be seen in the consolidated statement of comprehensive income. It is HEINEKEN’s policy to provide intra-HEINEKEN financing in the functional currency of subsidiaries where possible to prevent foreign currency exposure on subsidiary level. The resulting exposure at Group level is hedged by means of forward exchange contracts. Intra-HEINEKEN financing in foreign currencies is mainly in British pound, US dollars, Swiss franc and Polish zloty. In some cases HEINEKEN elects to treat intra-HEINEKEN financing with a permanent character as equity and does not hedge the foreign currency exposure. The principal amounts of HEINEKEN’s British pound, Polish zloty, Mexican peso and Egyptian pound bank loans and bond issues are used to hedge local operations, which generate cash flows that have the same respective functional currencies. Corresponding interest on these borrowings is also denominated in currencies that match the cash flows generated by the underlying operations of HEINEKEN. This provides an economic hedge without derivatives being entered into. In respect of other monetary assets and liabilities denominated in currencies other than the functional currencies of HEINEKEN and the various foreign operations, HEINEKEN ensures that its net exposure is kept to an acceptable level by buying or selling foreign currencies at spot rates when necessary to address short-term imbalances.

F I N A N C I A L S TAT E M E N T S 2 0 11
113
N O T E S T O T H E C O N S O L I D AT E D F I N A N C I A L S TAT E M E N T S
Exposure to foreign currency riskHEINEKEN’s transactional exposure to the British pound, US dollar and euro was as follows based on notional amounts. The euro column relates to transactional exposure to the euro within subsidiaries which are reporting in other currencies.
in millions EUR GBP USD EUR GBP USD
2011 2011 2011 2010 2010 2010
Financial assets
Trade and other receivables 14 1 12 11 – 6
Cash and cash equivalents 52 60 21 40 – 6
Intragroup assets 4 455 1,384 – 355 1,203
Financial liabilities
Interest-bearing borrowings (50) (1,050) (3,082) (54) (746) (2,217)
Non-interest-bearing liabilities – – (75) – – –
Trade and other payables (61) – (34) (46) – (2)
Intragroup liabilities (314) – (502) (259) – (490)
Gross balance sheet exposure (355) (534) (2,276) (308) (391) (1,494)
Estimated forecast sales next year 119 16 1,041 129 1 947
Estimated forecast purchases next year (442) – (723) (463) (1) (539)
Gross exposure (678) (518) (1,958) (642) (391) (1,086)
Net notional amount forward exchange
contracts (851) 535 1,161 (915) 396 1,448
Net exposure (1,529) 17 (797) (1,557) 5 362
Sensitivity analysis
Equity 15 – 14 (5) – 38
Profit or loss – – – – (1) –
Included in the US dollar amounts are intra-HEINEKEN cash flows. Within the net notional amount forward exchange contracts, the cross-currency interest rate swaps of Heineken UK forms the largest component.
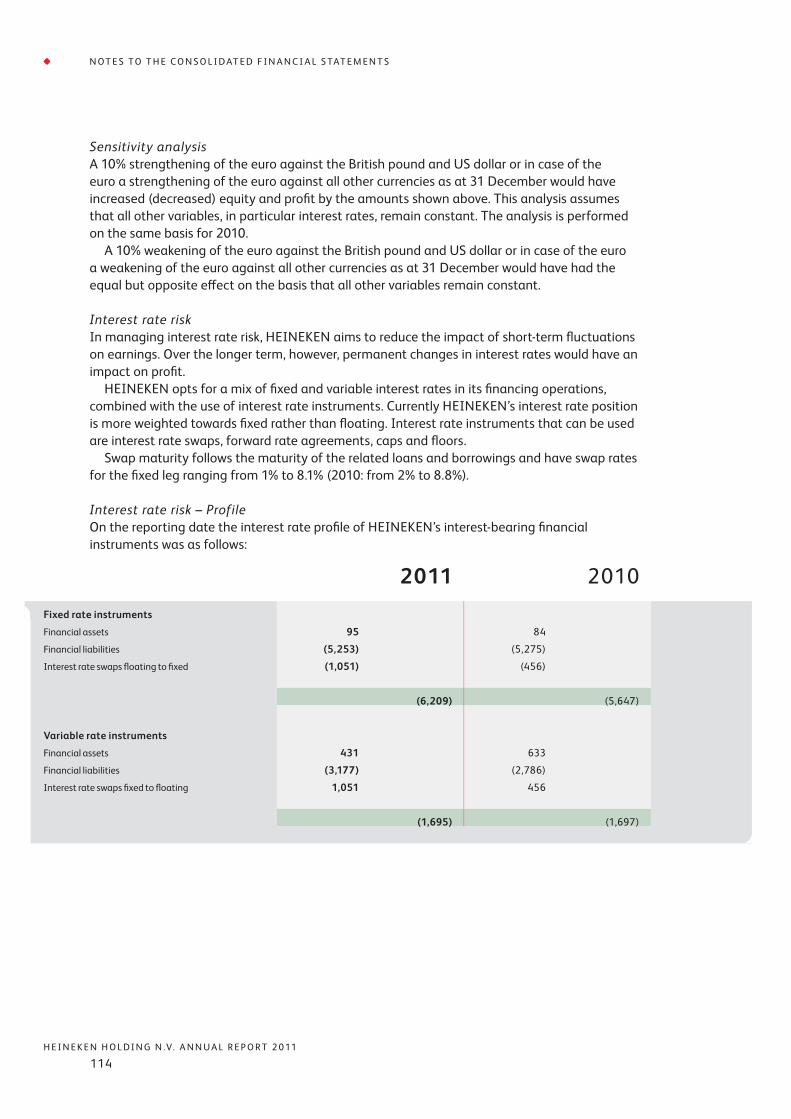
H E I N E K E N H O L D I N G N .V. A N N U A L R E P O R T 2 0 11
114
N O T E S T O T H E C O N S O L I D AT E D F I N A N C I A L S TAT E M E N T S
Sensitivity analysisA 10% strengthening of the euro against the British pound and US dollar or in case of the euro a strengthening of the euro against all other currencies as at 31 December would have increased (decreased) equity and profit by the amounts shown above. This analysis assumes that all other variables, in particular interest rates, remain constant. The analysis is performed on the same basis for 2010. A 10% weakening of the euro against the British pound and US dollar or in case of the euro a weakening of the euro against all other currencies as at 31 December would have had the equal but opposite effect on the basis that all other variables remain constant.
Interest rate riskIn managing interest rate risk, HEINEKEN aims to reduce the impact of short-term fluctuations on earnings. Over the longer term, however, permanent changes in interest rates would have an impact on profit. HEINEKEN opts for a mix of fixed and variable interest rates in its financing operations, combined with the use of interest rate instruments. Currently HEINEKEN’s interest rate position is more weighted towards fixed rather than floating. Interest rate instruments that can be used are interest rate swaps, forward rate agreements, caps and floors. Swap maturity follows the maturity of the related loans and borrowings and have swap rates for the fixed leg ranging from 1% to 8.1% (2010: from 2% to 8.8%).
Interest rate risk – ProfileOn the reporting date the interest rate profile of HEINEKEN’s interest-bearing financial instruments was as follows:
2011 2010Fixed rate instruments
Financial assets 95 84
Financial liabilities (5,253) (5,275)
Interest rate swaps floating to fixed (1,051) (456)
(6,209) (5,647)
Variable rate instruments
Financial assets 431 633
Financial liabilities (3,177) (2,786)
Interest rate swaps fixed to floating 1,051 456
(1,695) (1,697)

F I N A N C I A L S TAT E M E N T S 2 0 11
115
N O T E S T O T H E C O N S O L I D AT E D F I N A N C I A L S TAT E M E N T S
Fair value sensitivity analysis for fixed rate instrumentsDuring 2011, HEINEKEN opted to apply fair value hedge accounting on certain fixed rate financial liabilities. The fair value movements on these instruments are recognised in profit or loss. The change in fair value on these instruments was €(30) million in 2011 (2010: €(67) million), which was offset by the change in fair value of the hedge accounting instruments, which was €39 million (2010: €70 million). A change of 100 basis points in interest rates on the reporting date would have increased (decreased) equity and profit or loss by the amounts shown below (after tax).
As part of the acquisition of Scottish & Newcastle in 2008, HEINEKEN took over a specific portfolio of euro floating-to-fixed interest rate swaps of which currently €690 million is still outstanding. Although interest rate risk is hedged economically, it is not possible to apply hedge accounting on this portfolio. A movement in interest rates will therefore lead to a fair value movement in the profit or loss under the other net financing income/(expenses). Any related non-cash income or expenses in profit or loss are expected to reverse over time.
Profit or loss Equity
100 bp increase 100 bp decrease 100 bp increase 100 bp decrease
31 December 2011
Instruments designated at fair value 29 (29) 29 (29)
Interest rate swaps (20) 21 (2) 2
Fair value sensitivity (net) 9 (8) 27 (27)
31 December 2010
Instruments designated at fair value 39 (40) 40 (40)
Interest rate swaps (25) 27 (4) 5
Fair value sensitivity (net) 14 (13) 36 (35)

H E I N E K E N H O L D I N G N .V. A N N U A L R E P O R T 2 0 11
116
N O T E S T O T H E C O N S O L I D AT E D F I N A N C I A L S TAT E M E N T S
Commodity price riskCommodity price risk is the risk that changes in commodity prices will affect HEINEKEN’s income. The objective of commodity price risk management is to manage and control commodity risk exposures within acceptable parameters, whilst optimising the return on risk. The main commodity exposure relates to the purchase of cans, glass bottles, malt and utilities. Commodity price risk is in principle addressed by negotiating fixed prices in supplier contracts with various contract durations. So far, commodity hedging with financial counterparties by HEINEKEN is limited to the incidental sale of surplus CO2 emission rights and to aluminium hedging and, to a limited extent, gas hedging, which is done in accordance with risk policies. HEINEKEN does not enter into commodity contracts other than to meet HEINEKEN’s expected usage and sale requirements. As at 31 December 2011, the market value of aluminium swaps was €(22) million (2010: €12 million).
Cash flow sensitivity analysis for variable rate instrumentsA change of 100 basis points in interest rates constantly applied during the reporting period would have increased (decreased) equity and profit or loss by the amounts shown below (after tax). This analysis assumes that all other variables, in particular foreign currency rates, remain constant and excludes any possible change in fair value of derivatives at period-end because of a change in interest rates. The analysis is performed on the same basis for 2010.
Profit or loss Equity
100 bp increase 100 bp decrease 100 bp increase 100 bp decrease
31 December 2011
Variable rate instruments (20) 20 (20) 20
Net interest rate swaps fixed to floating 8 (8) 8 (8)
Cash flow sensitivity (net) (12) 12 (12) 12
31 December 2010
Variable rate instruments (16) 16 (16) 16
Net interest rate swaps fixed to floating 3 (3) 3 (3)
Cash flow sensitivity (net) (13) 13 (13) 13

F I N A N C I A L S TAT E M E N T S 2 0 11
117
N O T E S T O T H E C O N S O L I D AT E D F I N A N C I A L S TAT E M E N T S
Cash flow hedgesThe following table indicates the periods in which the cash flows associated with derivatives that are cash flow hedges, are expected to occur.
2011 Carrying
amount
Expected
cash flows
Less than
1 year
1-2
years
2-5
years
More than
5 years
Interest rate swaps:
Assets 170 1,904 120 107 726 951
Liabilities (48) (1,786) (136) (108) (658) (884)
Forward exchange contracts:
Assets 15 1,078 871 207 – –
Liabilities (49) (1,111) (896) (215) – –
Commodity derivatives:
Assets 11 11 11 – – –
Liabilities (36) (36) (32) (4) – –
63 60 (62) (13) 68 67
The periods in which the cash flows associated with forward exchange contracts that are cash flow hedges are expected to impact profit or loss is on average two months earlier than the occurrence of the cash flows as in the above table.
2010 Carrying
amount
Expected
cash flows
Less than
1 year
1-2
years
2-5
years
More than
5 years
Interest rate swaps:
Assets 89 1,902 95 90 715 1,002
Liabilities (105) (1,921) (158) (118) (690) (955)
Forward exchange contracts:
Assets 10 1,093 805 288 – –
Liabilities (18) (1,117) (833) (284) – –
Commodity derivatives:
Assets 26 27 8 18 1 –
Liabilities (33) (33) (15) (15) (3) –
(31) (49) (98) (21) 23 47

H E I N E K E N H O L D I N G N .V. A N N U A L R E P O R T 2 0 11
118
N O T E S T O T H E C O N S O L I D AT E D F I N A N C I A L S TAT E M E N T S
Fair value hedges/net investment hedgesThe following table indicates the periods in which the cash flows associated with derivatives that are fair value hedges or net investment hedges are expected to occur.
2011 Carrying
amount
Expected
cash flows
Less than
1 year
1-2
years
2-5
years
More than
5 years
Interest rate swaps:
Assets 27 967 171 49 747 –
Liabilities (136) (1,059) (180) (22) (857) –
Forward exchange contracts:
Assets – 177 177 – – –
Liabilities (12) (187) (187) – – –
(121) (102) (19) 27 (110) –
2010 Carrying
amount
Expected
cash flows
Less than
1 year
1-2
years
2-5
years
More than
5 years
Interest rate swaps:
Assets 32 1,009 64 176 769 –
Liabilities (139) (1,077) (26) (179) (872) –
Forward exchange contracts:
Assets 1 317 317 – – –
Liabilities – (309) (309) – – –
(106) (60) 46 (3) (103) –

F I N A N C I A L S TAT E M E N T S 2 0 11
119
N O T E S T O T H E C O N S O L I D AT E D F I N A N C I A L S TAT E M E N T S
Capital managementHeineken Holding N.V.’s capital management is strongly related to Heineken N.V.’s capital management because every Heineken N.V. share held by Heineken Holding N.V. is matched by one share issued by Heineken Holding N.V. This enables Heineken N.V. to pursue its long-term policy in the interest of the Heineken N.V. shareholders. There were no major changes in Heineken Holding N.V.’s approach to capital management during the year. The policy of the Board of Directors of Heineken Holding N.V. is to maintain a strong capital base so as to maintain investor, creditor and market confidence and to sustain future development of business and acquisitions of Heineken N.V. Capital is herein defined as equity attributable to equity holders of Heineken Holding N.V. (total equity minus non-controlling interests). Heineken Holding N.V. is not subject to externally imposed capital requirements other than the legal reserves explained in note 22. Pursuant to Article 10, paragraph 6, of the Articles of Association of Heineken Holding N.V., holders of Heineken Holding N.V. ordinary shares receive the same dividend as holders of Heineken N.V. shares.
Carrying amount
2011
Fair value
2011
Carrying amount
2010
Fair value
2010
Bank loans (3,986) (4,017) (3,665) (3,734)
Unsecured bond issues (2,493) (2,727) (2,482) (2,739)
Finance lease liabilities (39) (39) (95) (95)
Other interest-bearing liabilities (2,009) (2,039) (1,927) (2,260)
Fair valuesThe fair values of financial assets and liabilities that differ from the carrying amounts shown in the statement of financial position are as follows:
Basis for determining fair valuesThe significant methods and assumptions used in estimating the fair values of financial instruments reflected in the table above are discussed in note 4.

H E I N E K E N H O L D I N G N .V. A N N U A L R E P O R T 2 0 11
120
N O T E S T O T H E C O N S O L I D AT E D F I N A N C I A L S TAT E M E N T S
31 December 2010 Level 1 Level 2 Level 3
Available-for-sale investments 70 – 120
Non-current derivative assets – 135 –
Current derivative assets – 10 –
Investments held for trading 17 – –
87 145 120
Non-current derivative liabilities – 291 –
Current derivative liabilities – 66 –
– 357 –
Fair value hierarchyIFRS 7 requires disclosure of fair value measurements by level of the following fair value measurement hierarchy:• Quoted prices (unadjusted) in active markets for identical assets or liabilities (level 1)• Inputs other than quoted prices included within level 1 that are observable for the asset or
liability, either directly (that is, as prices) or indirectly (that is, derived from prices) (level 2)• Inputs for the asset or liability that are not based on observable market data (unobservable
inputs) (level 3).
31 December 2011 Level 1 Level 2 Level 3
Available-for-sale investments 81 – 183
Non-current derivative assets – 142 –
Current derivative assets – 37 –
Investments held for trading 14 – –
95 179 183
Non-current derivative liabilities – 177 –
Current derivative liabilities – 164 –
– 341 –

F I N A N C I A L S TAT E M E N T S 2 0 11
121
N O T E S T O T H E C O N S O L I D AT E D F I N A N C I A L S TAT E M E N T S
2011 2010Available-for-sale investments
based on Level 3
Balance as at 1 January 120 162
Fair value adjustments recognised in other
comprehensive income 61 (8)
Disposals – (26)
Transfers 2 (8)
Balance as at 31 December 183 120
HEINEKEN leases buildings, cars and equipment in the ordinary course of business. Raw material contracts include long-term purchase contracts with suppliers in which prices are fixed or will be agreed based upon predefined price formulas. These contracts mainly relate to malt, bottles and cans. During the year ended 31 December 2011 €241 million (2010: €224 million) was recognised as an expense in profit or loss in respect of operating leases and rent. Other off-balance sheet obligations mainly include distribution, rental, service and sponsorship contracts. Committed bank facilities are credit facilities on which a commitment fee is paid as compensation for the bank’s requirement to reserve capital. For the details of these committed bank facilities see note 25. The bank is legally obliged to provide the facility under the terms and conditions of the agreement.
Total 2011 Less than 1 year 1-5 years More than 5 years Total 2010
Lease & operational lease commitments 503 124 258 121 433
Property, plant & equipment ordered 50 45 2 3 49
Raw materials purchase contracts 3,843 1,413 2,134 296 4,503
Other off-balance sheet obligations 2,589 509 1,277 803 1,943
Off-balance sheet obligations 6,985 2,091 3,671 1,223 6,928
Undrawn committed bank facilities 1,274 233 1,041 – 2,188
note 33 OFF-BALANCE SHEET COMMITMENTS

H E I N E K E N H O L D I N G N .V. A N N U A L R E P O R T 2 0 11
122
N O T E S T O T H E C O N S O L I D AT E D F I N A N C I A L S TAT E M E N T S
Guarantees to banks for loans relate to loans to customers, which are given by external parties in the ordinary course of business of HEINEKEN. HEINEKEN provides guarantees to the banks to cover the risk related to these loans.
Guarantees Total 2011 Less than 1 year 1-5 years More than 5 years Total 2010
Guarantees to banks for loans (to third parties) 339 208 91 40 384
Other guarantees 372 128 7 237 271
711 336 98 277 655
NetherlandsHEINEKEN is involved in an antitrust case initiated by the European Commission for particular violations of the European Union competition law. By decision of 18 April 2007 the European Commission concluded that HEINEKEN and other brewers operating in the Netherlands, restricted competition in the Dutch market during the period 1996-1999. This decision follows an investigation by the European Commission that commenced in March 2000. HEINEKEN fully cooperated with the authorities in this investigation. As a result of its decision, the European Commission imposed a fine on HEINEKEN of €219 million in April 2007. On 4 July 2007 HEINEKEN filed an appeal with the European Court of First Instance against the decision of the European Commission as HEINEKEN disagrees with the findings of the European Commission. Pending appeal, HEINEKEN was obliged to pay the fine to the European Commission. This fine was paid in 2007 and was treated as an expense in the 2007 Annual Report. In its judgment of 16 June 2011 the European Court of First Instance largely upheld the decision of the European Commission. However, the original fine was reduced by €21 million. On 26 August 2011 HEINEKEN appealed with the European Court of Justice against the judgment of the European Court of First Instance. A final decision is expected in 2013.
BrazilAs part of the acquisition of the beer operations of FEMSA, HEINEKEN also inherited existing legal proceedings with labour unions, tax authorities and other parties of its, now wholly-owned, subsidiary Cervejarias Kaiser (Heineken Brazil). The proceedings have arisen in the ordinary course of business and are common to the current economic and legal environment of Brazil. The proceedings have partly been provided for, see note 30. The contingent amount being claimed against Heineken Brazil resulting from such proceedings as at 31 December 2011 is €848 million. Such contingencies were classified by legal counsel as less than probable but more than remote of being settled against Heineken Brazil. However, HEINEKEN believes that the ultimate resolution of such legal proceedings will not have a material adverse effect on its consolidated financial position or result of operations. HEINEKEN does not expect any significant liability to arise from these contingencies. A significant part of the aforementioned contingencies (€364 million) are tax related and qualify for indemnification by FEMSA, see note 17. As is customary in Brazil, Heineken Brazil has been requested by the tax authorities to collateralise tax contingencies currently in litigation amounting to €280 million by either pledging fixed assets or entering into available lines of credit which cover such contingencies.
note 34 CONTINGENCIES
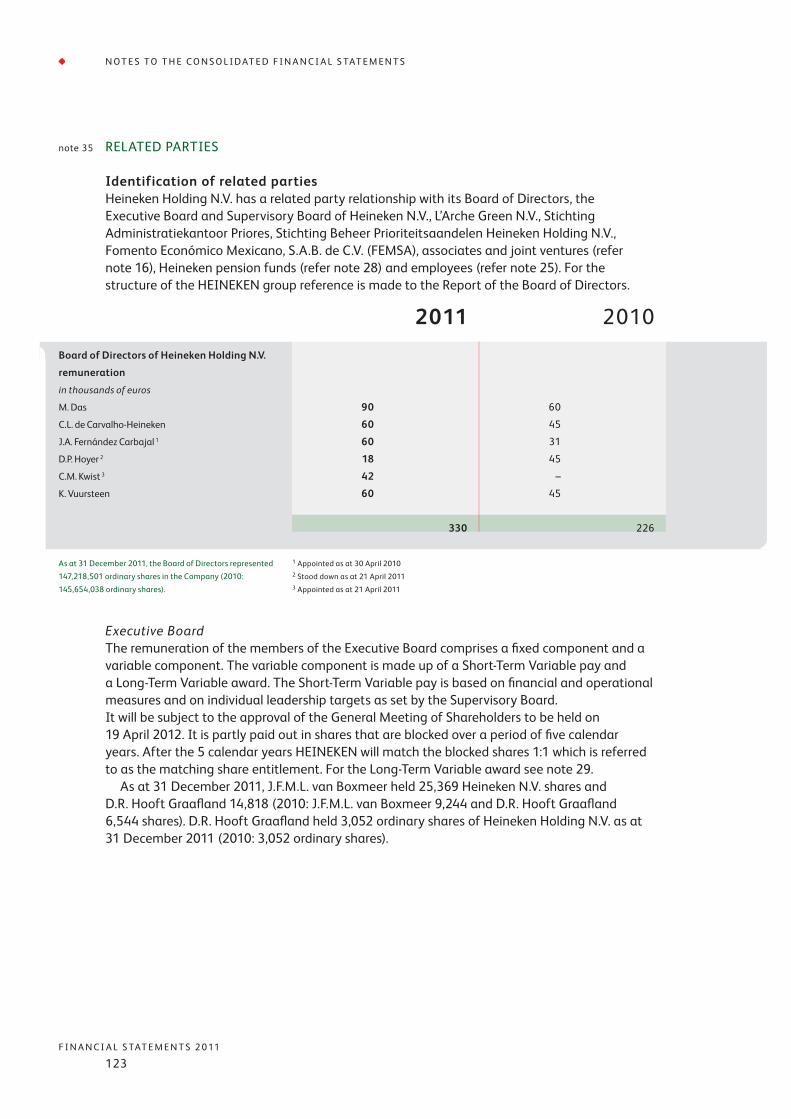
F I N A N C I A L S TAT E M E N T S 2 0 11
123
N O T E S T O T H E C O N S O L I D AT E D F I N A N C I A L S TAT E M E N T S
2011 2010Board of Directors of Heineken Holding N.V.
remuneration
in thousands of euros
M. Das 90 60
C.L. de Carvalho-Heineken 60 45
J.A. Fernández Carbajal 1 60 31
D.P. Hoyer 2 18 45
C.M. Kwist 3 42 –
K. Vuursteen 60 45
330 226
As at 31 December 2011, the Board of Directors represented 147,218,501 ordinary shares in the Company (2010: 145,654,038 ordinary shares).
1 Appointed as at 30 April 2010 2 Stood down as at 21 April 2011 3 Appointed as at 21 April 2011
note 35 RELATED PARTIES
Identification of related partiesHeineken Holding N.V. has a related party relationship with its Board of Directors, the Executive Board and Supervisory Board of Heineken N.V., L’Arche Green N.V., Stichting Administratiekantoor Priores, Stichting Beheer Prioriteitsaandelen Heineken Holding N.V., Fomento Económico Mexicano, S.A.B. de C.V. (FEMSA), associates and joint ventures (refer note 16), Heineken pension funds (refer note 28) and employees (refer note 25). For the structure of the HEINEKEN group reference is made to the Report of the Board of Directors.
Executive BoardThe remuneration of the members of the Executive Board comprises a fixed component and a variable component. The variable component is made up of a Short-Term Variable pay and a Long-Term Variable award. The Short-Term Variable pay is based on financial and operational measures and on individual leadership targets as set by the Supervisory Board. It will be subject to the approval of the General Meeting of Shareholders to be held on 19 April 2012. It is partly paid out in shares that are blocked over a period of five calendar years. After the 5 calendar years HEINEKEN will match the blocked shares 1:1 which is referred to as the matching share entitlement. For the Long-Term Variable award see note 29. As at 31 December 2011, J.F.M.L. van Boxmeer held 25,369 Heineken N.V. shares and D.R. Hooft Graafland 14,818 (2010: J.F.M.L. van Boxmeer 9,244 and D.R. Hooft Graafland 6,544 shares). D.R. Hooft Graafland held 3,052 ordinary shares of Heineken Holding N.V. as at 31 December 2011 (2010: 3,052 ordinary shares).

H E I N E K E N H O L D I N G N .V. A N N U A L R E P O R T 2 0 11
124
N O T E S T O T H E C O N S O L I D AT E D F I N A N C I A L S TAT E M E N T S
The individual members of the Supervisory Board received the following remuneration:
2011 2010Supervisory Board of Heineken N.V.
remuneration
in thousands of euros
C.J.A. van Lede 160 67
J.A. Fernández Carbajal 2 85 35
M. Das 85 52
M.R. de Carvalho 135 53
J.M. Hessels 75 50
J.M. de Jong 80 53
A.M. Fentener van Vlissingen 80 50
M.E. Minnick 70 48
V.C.O.B.J. Navarre 75 48
J.G. Astaburuaga Sanjinés 2 75 35
I.C. MacLaurin 1 – 15
920 506
At the Annual General Meeting of Shareholders of Heineken N.V. held on 21 April 2011 it was proposed to increase the remuneration of the Supervisory Board. The fees initially established on 1 January 2006 were updated as per 1 January 2011 to reflect the increased size and global footprint of HEINEKEN and also to align to the market practice in Europe (excl. UK). In 2010 C.J.A. van Lede and M.R. de Carvalho both received €45 thousand from Heineken Holding N.V. for attending meetings of the Board of Directors of Heineken Holding N.V.
in their position of member of the Preparatory Committee. As of 2011 this fee is included in the fees as stated above and paid by Heineken N.V.M.R. de Carvalho held 8 shares of Heineken N.V. as at 31 December 2011 (2010: 8 shares). As at 31 December 2011 and 2010, the Supervisory Board members did not hold any of the Heineken N.V. bonds or option rights. C.J.A. van Lede held 2,656 and M.R. de Carvalho held 8 ordinary shares of Heineken Holding N.V. as at 31 December 2011 (2010: C.J.A. van Lede 2,656 and M.R. de Carvalho 8 ordinary shares).
1 Stepped down as at 22 April 2010.2 Appointed as at 30 April 2010.
Executive Board of
Heineken N.V. remuneration
in thousands of euros
Fixed salary Short-Term
Variable pay
Matching Share
Entitlement2
Long-Term
Variable award1
Pension plan Total
2011 2010 2011 2010 2011 2010 2011 2010 2011 2010 2011 20102
J.F.M.L. van Boxmeer 1,050 950 1,764 1,306 882 653 669 595 590 464 4,955 3,968
D.R. Hooft Graafland 650 650 780 670 390 335 355 326 399 404 2,574 2,385
1,700 1,600 2,544 1,976 1,272 988 1,024 921 989 868 7,529 6,353
The matching share entitlement for 2010 is based on 2010 performance and was granted upon adoption of the remuneration policy by Heineken N.V.’s Annual General Meeting of Shareholders. The matching share entitlement for 2011 is based on 2011 performance. The granted matching shares vest immediately and as such €2.3 million was recognised in the 2011 consolidated income statement, consisting of €1 million for 2010 and €1.3 million for 2011. No vesting occurred under the 2008-2010 LTV of the Executive Board.
1 The remuneration reported as part
of LTV is based on IFRS accounting
policies and does not reflect the
value of vested performance shares.2 At the Annual General Meeting of
Shareholders of Heineken N.V. held
on 21 April 2011 it was proposed to
amend the short-term incentive for
the Executive Board. A matching
share entitlement was introduced
already per pay-out over 2010.
In HEINEKEN’s 2011 financial
statement this has been reflected
in the 2010 remuneration as the
matching entitlement relates to
the 2010 performance.

F I N A N C I A L S TAT E M E N T S 2 0 11
125
N O T E S T O T H E C O N S O L I D AT E D F I N A N C I A L S TAT E M E N T S
Other related party transactions Transaction value Balance outstanding as at 31 December
2011 2010 2011 2010
Sale of products and services
To associates and joint ventures 98 93 35 12
To FEMSA 572 298 77 78
670 391 112 90
Raw materials, consumables and services
Goods for resale – joint ventures 2 – – –
Other expenses – joint ventures – – – 1
Other expenses FEMSA 128 54 13 –
130 54 13 1
There are no significant transactions with L’Arche Green N.V.
FEMSAAs consideration for HEINEKEN’s acquisition of the beer operations of Fomento Económico Mexicano, S.A.B. de C.V. (FEMSA). FEMSA, became a major shareholder of Heineken Holding N.V. and Heineken N.V. Therefore, several existing contracts between FEMSA and former FEMSA-owned companies acquired by HEINEKEN have become related party contracts. The total revenue amount related to these related party relationships amounts to €572 million.

H E I N E K E N H O L D I N G N .V. A N N U A L R E P O R T 2 0 11
126
N O T E S T O T H E C O N S O L I D AT E D F I N A N C I A L S TAT E M E N T S
note 36 HEINEKEN ENTITIES
Control of HEINEKENThe ordinary shares of the Company are traded on Euronext Amsterdam. L’Arche Green N.V. holds 51.083% of the Heineken Holding N.V. ordinary shares. The Heineken family has an interest of 88.55% in L’Arche Green N.V. Heineken Holding N.V. holds an interest in Heineken N.V. of 50.005% of the issued capital (being 50.115% (2010: 50.147%) of the outstanding capital following the purchase of own shares by Heineken N.V.). The Heineken family also owns a direct 0.03% stake in Heineken Holding N.V. A declaration of joint and several liability pursuant to the provisions of Section 403 of Book 2 of the Dutch Civil Code has been issued by Heineken N.V. with respect to legal entities established in the Netherlands marked with a • below.
Country of incorporationSignificant subsidiaries of Heineken N.V.
Ownership interest (%)
2011 2010
• Heineken Nederlands Beheer B.V. The Netherlands 100.0 100.0• Heineken Brouwerijen B.V. The Netherlands 100.0 100.0• Heineken CEE Investments B.V. The Netherlands 100.0 100.0• Heineken Nederland B.V. The Netherlands 100.0 100.0• Heineken International B.V. The Netherlands 100.0 100.0• Heineken Supply Chain B.V. The Netherlands 100.0 100.0• Amstel Brouwerij B.V. The Netherlands 100.0 100.0• Amstel Internationaal B.V. The Netherlands 100.0 100.0• Vrumona B.V. The Netherlands 100.0 100.0• Invebra Holland B.V. The Netherlands 100.0 100.0• B.V. Beleggingsmaatschappij Limba The Netherlands 100.0 100.0• Brand Bierbrouwerij B.V. The Netherlands 100.0 100.0• Heineken CEE Holdings B.V. The Netherlands 100.0 100.0• Brasinvest B.V. The Netherlands 100.0 100.0• Heineken Beer Systems B.V. The Netherlands 100.0 100.0
Central Europe Beverages B.V. The Netherlands 72.0 72.0Heineken France S.A.S. France 100.0 100.0Heineken UK Ltd. United Kingdom 100.0 100.0Sociedade Central de Cervejas et Bebidas S.A. Portugal 98.7 98.7Oy Hartwell Ab. Finland 100.0 100.0Heineken España S.A. Spain 98.7 98.7Heineken Italia S.p.A. Italy 100.0 100.0Athenian Brewery S.A. Greece 98.8 98.8Brau Union AG Austria 100.0 100.0Brau Union Österreich AG Austria 100.0 100.0Grupa Żywiec S.A. Poland 61.9 61.9Heineken Ireland Ltd.* Ireland 100.0 100.0Heineken Hungária Sorgyárak Zrt. Hungary 100.0 100.0Heineken Slovensko a.s. Slovakia 100.0 100.0Heineken Switzerland AG Switzerland 100.0 100.0Karlovačka Pivovara d.o.o. Croatia 100.0 100.0Mouterij Albert N.V. Belgium 100.0 100.0Ibecor S.A. Belgium 100.0 100.0

F I N A N C I A L S TAT E M E N T S 2 0 11
127
N O T E S T O T H E C O N S O L I D AT E D F I N A N C I A L S TAT E M E N T S
Country of incorporationSignificant subsidiaries of Heineken N.V.
Ownership interest (%)
2011 2010
N.V. Brouwerijen Alken-Maes Brasseries S.A. Belgium 99.9 99.9LLC Heineken Breweries Russia 100.0 100.0Heineken USA Inc. United States 100.0 100.0Heineken Česká republika a.s. Czech Republic 100.0 100.0Heineken Romania S.A. Romania 98.4 98.6FCJSC Heineken Breweries Belarus 100.0 100.0OJSC, Rechitsapivo Belarus 96.2 95.4Commonwealth Brewery Ltd. Bahamas 75.0 100.0Windward & Leeward Brewery Ltd. St Lucia 72.7 72.7Cervecerias Baru-Panama S.A. Panama 74.9 74.9Nigerian Breweries Plc. Nigeria 54.1 54.1Al Ahram Beverages Company S.A.E. Egypt 99.9 99.9Brasserie Lorraine S.A. Martinique 100.0 100.0Surinaamse Brouwerij N.V. Surinam 76.2 76.2Cuauhtémoc Moctezuma Holding, S.A. de C.V. Mexico 100.0 100.0Fabricas Monterrey, S.A. de C.V. Mexico 100.0 100.0Silices de Veracruz, S.A. de C.V. Mexico 100.0 100.0Cervejarias Kaiser Brazil S.A. Brazil 100.0 100.0Consolidated Breweries Ltd. Nigeria 50.5 50.5Brasserie Almaza S.A.L. Lebanon 67.0 67.0Brasseries, Limonaderies et Malteries ‘Bralima’ S.A.R.L. D.R. Congo 95.0 95.0Brasseries et Limonaderies du Rwanda ‘Bralirwa’ S.A. Rwanda 75.0 75.0Brasseries et Limonaderies du Burundi ‘Brarudi’ S.A. Burundi 59.3 59.3Brasseries de Bourbon S.A. Réunion 85.7 85.7Sierra Leone Brewery Ltd. Sierra Leone 83.1 83.1Tango s.a.r.l. Algeria 100.0 100.0Société Nouvelle des Boissons Gazeuses S.A. (‘SNBG’) Tunisia 74.5 74.5Société Nouvelle de Brasserie S.A. ‘Sonobra’ Tunisia 49.9 49.9
* In accordance with Article 17 of
the Republic of Ireland Companies
(Amendment) Act 1986,
Heineken N.V. issued an irrevocable
guarantee for the years ended
31 December 2011 and 2010
regarding the liabilities of Heineken
Ireland Ltd., Heineken Ireland
Sales Ltd., West Cork Bottling Ltd.,
Western Beverages Ltd., Beamish
and Crawford Ltd. and Nash
Beverages Ltd. as referred to in
Article 5(l) of the Republic of Ireland
Companies (Amendment) Act 1986.

H E I N E K E N H O L D I N G N .V. A N N U A L R E P O R T 2 0 11
128
N O T E S T O T H E C O N S O L I D AT E D F I N A N C I A L S TAT E M E N T S
Acquisition of business in HaitiOn 14 December 2011 HEINEKEN announced its intention to increase its shareholding in Brasserie Nationale d’Haiti S.A. (Brana), the country’s leading brewer from 22.5% to 95%. The transaction closed on 17 January 2012 and has been funded from existing resources.
SUBSEQUENT EVENTSnote 37

H E I N E K E N H O L D I N G N.V. A N N U A L R E P O R T 2 0 11
129
OTHER INFORMATION
Rights of holders of priority sharesThe priority shares in issue with a nominal value of €500, which comprise 250 shares of €2 nominal value, are held by:Stichting Administratiekantoor Priores (125 priority shares)The members of the board of this foundation are:Mrs C.L. de Carvalho-Heineken, chairmanMr M. DasMr R.H. Meppelink
Stichting Beheer Prioriteitsaandelen Heineken Holding N.V. (125 priority shares)The members of the board of this foundation are:Mr H.A. Oosters, chairmanMr P.E.B. Corten
For the rights conferred by the priority shares, reference is made to the following articles of the company’s Articles of Association:Article 4, para. 8 (cooperation of the meeting of priority shareholders in issue of depositary receipts for shares)Article 7, para. 2(the meeting of priority shareholders draws up non-binding list of candidates for appointments to the Board of Directors by the General Meeting)Article 8, para. 5 (the meeting of priority shareholders gives approval for exercising voting rights on shares)Article 8, para. 6(the meeting of priority shareholders and the General Meeting give approval for resolutions relating to any material change in the nature or identity of the company or the enterprise)Article 9, para. 4(appointment of representative by the meeting of priority shareholders in the event of absence or inability to act of all members of the Board of Directors)Article 10, para. 6(4% dividend, after distribution of dividend to holders of ordinary shares)Article 13, para. 1(the meeting of priority shareholders brings resolutions to amend the Articles of Association or wind up the company to the General Meeting)
Article 14, para. 3(priority shareholders’ claims to liquidation surplus are subordinated).
Provisions of the Articles of Association concerning appropriation of profitThe relevant provisions of the Articles of Association concerning appropriation of profit read as follows:Article 10, para. 4: Profit distributions may only be made if the shareholders’ equity of the company exceeds the sum of the paid-up and called capital and the reserves prescribed by law.Article 10, para. 6: Out of the profit as shown by the income statement adopted by the General Meeting, the ordinary shareholders shall first be paid the same dividend per share as paid by Heineken N.V. for the year concerned, having due regard to the provisions of paragraph 4. If and to the extent that the dividend paid by Heineken N.V. is in the form of a stock dividend, the dividend paid to the ordinary shareholders shall also be in the form of a stock dividend. From what remains after the distribution to the ordinary share holders, the priority shareholders shall be paid a dividend of four per cent (4%) of the nominal value of the priority shares and the remainder shall be appropriated to the reserves. On a motion of the meeting of priority shareholders, the General Meeting shall be authorised to make distributions from the reserves.
Remuneration of the Board of DirectorsPursuant to the company’s Articles of Association, Article 7, para. 5, the meeting of holders of priority shares may pass resolutions fixing the remuneration of the members of the Board of Directors.
Shares held by the Board of DirectorsAs at 31 December 2011, the Board of Directors represented 147,218,501 ordinary shares of the company.
Proposed appropriation of profitIt is proposed to appropriate €239 million of the profit for payment of dividend and to add €478 million to the reserves.

H E I N E K E N H O L D I N G N .V. A N N U A L R E P O R T 2 0 11
130
O T H E R I N F O R M AT I O N
STATEMENT OF THE BOARD OF DIRECTORS
Statement ex Article 5:25c Paragraph 2 sub cFinancial Markets Supervision Act(‘Wet op het Financieel Toezicht’)
To our knowledge,
1. the Financial Statements give a true and fair view of the assets, liabilities, financial position and profit of Heineken Holding N.V. and its consolidated companies;
2. the Report of the Board of Directors gives a true and fair view of the position as at 31 December 2011 and the developments during the financial year 2011 of Heineken Holding N.V. and its related companies included in its Financial Statements; and
3. the Report of the Board of Directors describes the material risks Heineken Holding N.V. is facing.
Amsterdam, 14 February 2012
Board of DirectorsMr M. DasMrs C.L. de Carvalho-HeinekenMr J.A. Fernández CarbajalMrs C.M. KwistMr K. Vuursteen

131
O T H E R I N F O R M AT I O N
INDEPENDENT AUDITOR’S REPORT
To: the Annual General Meeting of Shareholders of Heineken Holding N.V.
Report on the financial statementsWe have audited the accompanying financial statements 2011 of Heineken Holding N.V., Amsterdam. The financial statements include the consolidated financial statements and the company financial statements. The consolidated financial statements comprise the consolidated statement of financial position as at 31 December 2011, the consolidated income statement, the consolidated statements of comprehensive income, changes in equity and cash flows for the year then ended, and notes, comprising a summary of the significant accounting policies and other explanatory information as included on page 28 to 128. The company financial statements comprise the company balance sheet as at 31 December 2011, the company income statement for the year then ended and the notes, comprising a summary of the accounting policies and other explanatory information as included on page 20 to 27.
Management’s responsibilityManagement is responsible for the preparation and fair presentation of the financial statements in accordance with International Financial Reporting Standards as adopted by the European Union and with Part 9 of Book 2 of the Netherlands Civil Code, and for the preparation of the Report of the Board of Directors in accordance with Part 9 of Book 2 of the Netherlands Civil Code. Furthermore, management is responsible for such internal control as it determines is necessary to enable the preparation of the financial statements that are free from material misstatement, whether due to fraud or error.
Auditor’s responsibilityOur responsibility is to express an opinion on these financial statements based on our audit. We conducted our audit in accordance with Dutch law, including the Dutch Standards on Auditing. This requires that we comply with ethical requirements and plan and perform the audit to obtain reasonable assurance about whether the financial statements are free from material misstatement. An audit involves performing procedures to obtain audit evidence about the amounts and disclosures in the financial statements. The procedures selected depend on the auditor’s judgment, including the
assessment of the risks of material misstatement of the financial statements, whether due to fraud or error. In making those risk assessments, the auditor considers internal control relevant to the entity’s preparation and fair presentation of the financial statements in order to design audit procedures that are appropriate in the circumstances, but not for the purpose of expressing an opinion on the effectiveness of the entity’s internal control.An audit also includes evaluating the appropriateness of accounting policies used and the reasonableness of accounting estimates made by management, as well as evaluating the overall presentation of the financial statements. We believe that the audit evidence we have obtained is sufficient and appropriate to provide a basis for our audit opinion.
Opinion with respect to the company financial statementsIn our opinion, the company financial statements give a true and fair view of the financial position of Heineken Holding N.V. as at 31 December 2011 and of its result for the year then ended in accordance with Part 9 of Book 2 of the Netherlands Civil Code.
Opinion with respect to the consolidated financial statementsIn our opinion, the consolidated financial statements give a true and fair view of the financial position of Heineken Holding N.V. as at 31 December 2011 and of its result and its cash flows for the year then ended in accordance with International Financial Reporting Standards as adopted by the European Union and with Part 9 of Book 2 of the Netherlands Civil Code.
Report on other legal and regulatory requirementsPursuant to the legal requirements under Section 2:393 sub 5 at e and f of the Netherlands Civil Code, we have no deficiencies to report as a result of our examination whether the Report of the Board of Directors, as set out on pages 9 to 18, to the extent we can assess, has been prepared in accordance with Part 9 of Book 2 of this Code, and if the information as required under Section 2:392 sub 1 at b - h has been annexed. Further, we report that the Report of the Board of Directors, to the extent we can assess, is consistent with the financial statements as required by Section 2:391 sub 4 of the Netherlands Civil Code.
Amsterdam, 14 February 2012KPMG ACCOUNTANTS N.V.E.J.L. van Leeuwen RA

COLOPHON
A Heineken Holding N.V. publication
Heineken Holding N.V.Tweede Weteringplantsoen 51017 ZD AmsterdamThe Netherlands
telephone +31 20 622 11 52fax +31 20 625 22 13
An abbreviated version of this report is available in the Dutch language.In the event of any discrepancy between language versions the English version prevails.
TranslationVVH business translations
Graphic Design and Electronic PublishingKentieDesign BNO
PrintingBoom & van Ketel grafimedia
BindingBinderij Hexspoor
Copies of this annual report are obtainable from the company’s office in Amsterdam viawww.theHEINEKENcompany.com
This annual report is printedon Heaven42, FSC® certified.