heineken holding n.v. reports strong organic growth for ...€¦ · heineken continued its high...
TRANSCRIPT

www.heinekeninternational.com Tweede Weteringplantsoen 5 - 1017 ZD Amsterdam, The Netherlands Registered Office at Amsterdam, Trade Register Amsterdam No.. 33078624
1
Heineken Holding N.V. reports strong organic growth for 2008; Acquisitions and impairments significantly impact profit Amsterdam, 18 February 2009 – Heineken Holding N.V. today announced:
• The net result of Heineken Holding N.V.’s participating interest in Heineken N.V. for 2008 amounts to EUR105 million;
• Strong organic net profit (beia) growth of 11%, ahead of forecast; Net profit (beia) amounted to EUR1,013 million;
• Reported net profit of Heineken N.V. of EUR209 million: diluted by lower than
expected profits from new businesses and related financing charges. Net exceptional charges of EUR757 million, 80% of which relates to non-cash items;
• Consolidated beer volume grew 3.5% organically. Strong growth in Africa, Asia
and Central and Eastern Europe; volumes in Western Europe and the Americas were lower due to the challenging economic environment;
• Heineken® volume in the international premium segment grew 4.7% and
exceeded 25 million hectolitre for the first time, gaining share;
• A new company-wide action programme will deliver a cash conversion rate of more than 100% in the period 2009-2011; Capital expenditure for 2009 to be reduced by EUR400 million versus 2008;
• Fixed cost ratio improved to 29.5% (2007: 30.7%). Fit2Fight cost reduction
programme delivered in full and on time. Continued focus on rigorous cost reduction; Total Cost Management programme launched;
• Proposed dividend of EUR0.62 per ordinary share for 2008.
www.heinekeninternational.com Tweede Weteringplantsoen 5 - 1017 ZD Amsterdam, The Netherlands Registered Office at Amsterdam, Trade Register Amsterdam No.. 33078624
2
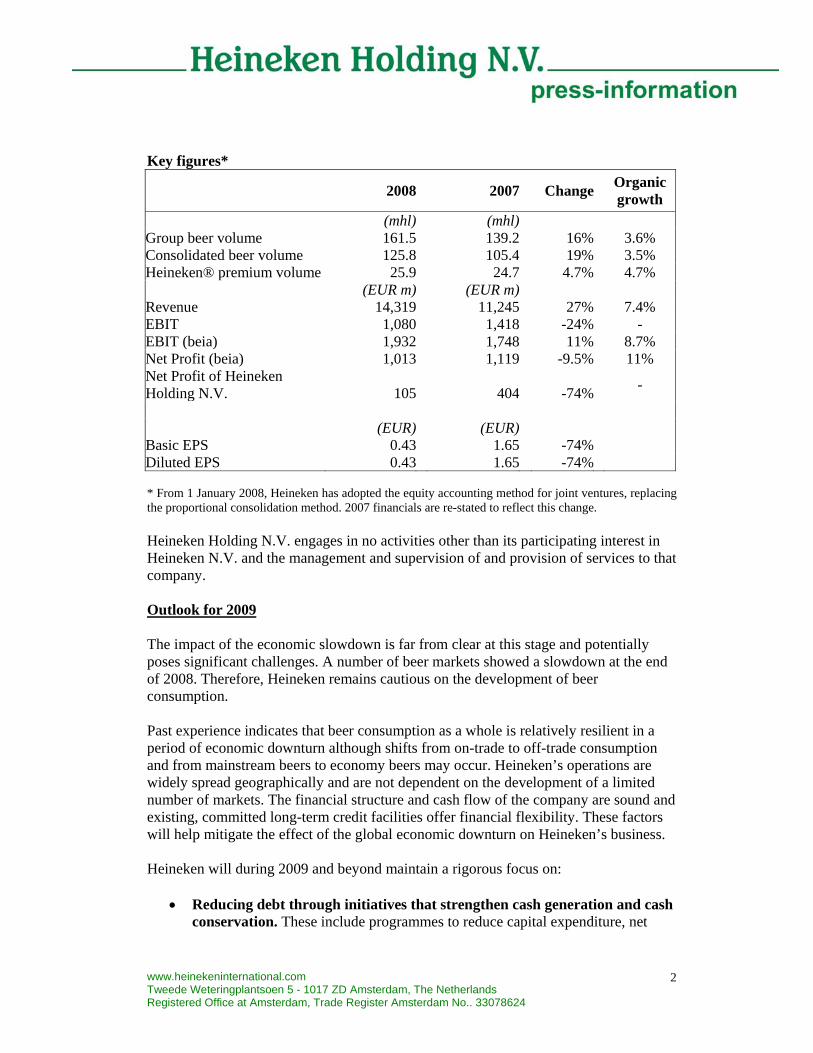
Key figures*
2008 2007 Change Organic
growth (mhl) (mhl) Group beer volume 161.5 139.2 16% 3.6% Consolidated beer volume 125.8 105.4 19% 3.5% Heineken® premium volume 25.9 24.7 4.7% 4.7% (EUR m) (EUR m) Revenue 14,319 11,245 27% 7.4% EBIT 1,080 1,418 -24% - EBIT (beia) 1,932 1,748 11% 8.7% Net Profit (beia) 1,013 1,119 -9.5% 11% Net Profit of Heineken Holding N.V. 105 404 -74% -
(EUR) (EUR) Basic EPS 0.43 1.65 -74% Diluted EPS 0.43 1.65 -74% * From 1 January 2008, Heineken has adopted the equity accounting method for joint ventures, replacing the proportional consolidation method. 2007 financials are re-stated to reflect this change. Heineken Holding N.V. engages in no activities other than its participating interest in Heineken N.V. and the management and supervision of and provision of services to that company. Outlook for 2009 The impact of the economic slowdown is far from clear at this stage and potentially poses significant challenges. A number of beer markets showed a slowdown at the end of 2008. Therefore, Heineken remains cautious on the development of beer consumption. Past experience indicates that beer consumption as a whole is relatively resilient in a period of economic downturn although shifts from on-trade to off-trade consumption and from mainstream beers to economy beers may occur. Heineken’s operations are widely spread geographically and are not dependent on the development of a limited number of markets. The financial structure and cash flow of the company are sound and existing, committed long-term credit facilities offer financial flexibility. These factors will help mitigate the effect of the global economic downturn on Heineken’s business. Heineken will during 2009 and beyond maintain a rigorous focus on:
• Reducing debt through initiatives that strengthen cash generation and cash conservation. These include programmes to reduce capital expenditure, net

www.heinekeninternational.com Tweede Weteringplantsoen 5 - 1017 ZD Amsterdam, The Netherlands Registered Office at Amsterdam, Trade Register Amsterdam No.. 33078624
3
working capital and the sale of non-core assets. The company has instigated a programme to increase the cash conversion rate in excess of 100% in the period 2009-2011.
• Improving performance of newly acquired companies. Every new business has specific, focused action plans to improve their performance.
• Reducing costs through Total Cost Management. Heineken has launched new cost reduction initiatives focusing on savings that will have an immediate and positive impact on cash flow.
• Maintaining the price positioning of key brands. Heineken will continue to pass on the effect of higher costs, currency impacts and higher excise duties, in the selling prices of its key brands. It will restore margins, which were negatively affected by high cost increases in 2008.
• Increasing the efficiency and effectiveness of all marketing investments. Heineken will ensure the right level of marketing support for key local and international brands, leveraging the fall in media costs.
For 2009, Heineken expects that the underlying downward trend in the number of employees will continue due to cost-reduction and efficiency improvement programmes. Capital expenditures related to property, plant and equipment, including the investments of newly acquired businesses, will amount to approximately EUR700 million (4.9% of 2008 revenue), of which EUR230 million relates to the carry-over of expansion projects started in previous years. This is substantially below the like-for-like EUR1.1 billion of 2008, which is mainly due to new capex reducing initiatives and the completion of a number of investment programmes. Heineken will finance the capital expenditure from cash flow. Starting in 2009, Heineken will issue a trading update after each first and third quarter. Dividend The Annual General Meeting of Shareholders of Heineken N.V. on 23 April 2009 will be asked to approve the distribution of a cash dividend of EUR0.62 per share of EUR1.60 nominal value (2007: EUR0.70). This represents a dividend pay out ratio of 30% in line with Heineken’s dividend policy to payout 30-35% of its Net profit (beia). As an interim dividend of EUR0.28 per share was paid on 3 September 2008, the final dividend will be EUR0.34 per share, subject to the 15% Dutch withholding tax, payable on 4 May 2009. If Heineken N.V. shareholders approve the proposed dividend, Heineken Holding N.V. will, according to its articles of association, pay an identical dividend per ordinary share. A final dividend of EUR0.34 per ordinary shares of EUR1.60 nominal value will be payable on 4 May 2009. Heineken Holding N.V. ordinary shares will be quoted ex-dividend on 27 April 2009.
www.heinekeninternational.com Tweede Weteringplantsoen 5 - 1017 ZD Amsterdam, The Netherlands Registered Office at Amsterdam, Trade Register Amsterdam No.. 33078624
4
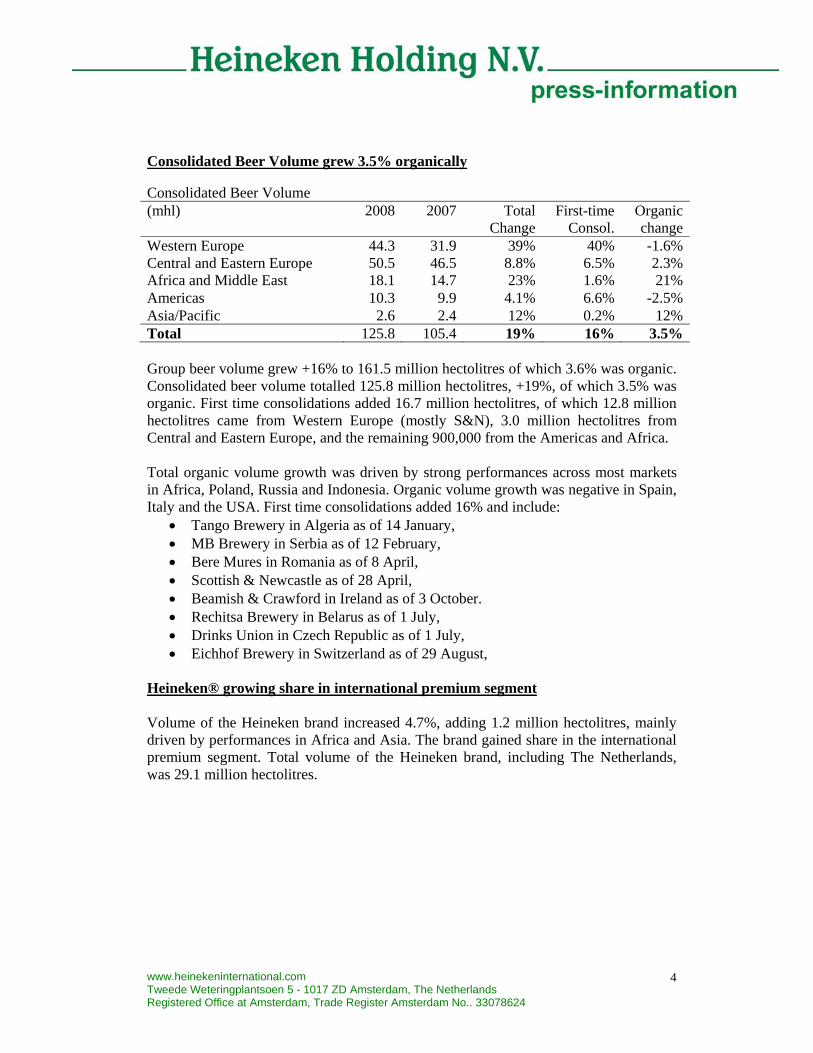
Consolidated Beer Volume grew 3.5% organically Consolidated Beer Volume (mhl) 2008 2007 Total
ChangeFirst-time
Consol. Organic change
Western Europe 44.3 31.9 39% 40% -1.6%Central and Eastern Europe 50.5 46.5 8.8% 6.5% 2.3%Africa and Middle East 18.1 14.7 23% 1.6% 21%Americas 10.3 9.9 4.1% 6.6% -2.5%Asia/Pacific 2.6 2.4 12% 0.2% 12%Total 125.8 105.4 19% 16% 3.5% Group beer volume grew +16% to 161.5 million hectolitres of which 3.6% was organic. Consolidated beer volume totalled 125.8 million hectolitres, +19%, of which 3.5% was organic. First time consolidations added 16.7 million hectolitres, of which 12.8 million hectolitres came from Western Europe (mostly S&N), 3.0 million hectolitres from Central and Eastern Europe, and the remaining 900,000 from the Americas and Africa. Total organic volume growth was driven by strong performances across most markets in Africa, Poland, Russia and Indonesia. Organic volume growth was negative in Spain, Italy and the USA. First time consolidations added 16% and include:
• Tango Brewery in Algeria as of 14 January, • MB Brewery in Serbia as of 12 February, • Bere Mures in Romania as of 8 April, • Scottish & Newcastle as of 28 April, • Beamish & Crawford in Ireland as of 3 October. • Rechitsa Brewery in Belarus as of 1 July, • Drinks Union in Czech Republic as of 1 July, • Eichhof Brewery in Switzerland as of 29 August,
Heineken® growing share in international premium segment Volume of the Heineken brand increased 4.7%, adding 1.2 million hectolitres, mainly driven by performances in Africa and Asia. The brand gained share in the international premium segment. Total volume of the Heineken brand, including The Netherlands, was 29.1 million hectolitres.

www.heinekeninternational.com Tweede Weteringplantsoen 5 - 1017 ZD Amsterdam, The Netherlands Registered Office at Amsterdam, Trade Register Amsterdam No.. 33078624
5
Volume of the Heineken brand in international premium segment
(mhl) 2008 2007
Change Western Europe 7.6 7.5 1.9% Central and Eastern Europe 2.8 2.6 6.6% Africa and the Middle East 2.1 1.6 31% Americas 9.0 9.1 -1.3% Asia/Pacific 4.4 3.9 12% Total volume 25.9 24.7 4.7% In Africa, Heineken® showed the strongest growth rate thanks to Nigeria (+60%) and South Africa (+40%). In Central and Eastern Europe, growth was driven by Russia, Romania and Greece. In a declining beer market in Western Europe, the Heineken brand proved particularly resilient, with volumes growing 1.9% and gaining significant market share. Growth in the UK (+24%) and France (+4.6%) more than offset softer volumes in Ireland, Spain and Italy. In the Americas, lower volume in the USA was partly offset by strong increases in Canada, Chile and the Caribbean. Heineken continued its high profile marketing and sponsorship activities, including a partnership with the 22nd James Bond Film, “Quantum of Solace”, activating a worldwide promotional campaign in more than 40 markets. Significant communication and promotion activities supported the Heineken Extra Cold beer programme, activated in 23 new cities across 11 European countries. Extra Cold beer sold 1.5 million hectolitres and is now available in 112 markets. BeerTender is now available in 10 markets and sold more than 318,000 hectolitres of beer. DraughtKeg grew in all regions except the Americas. Amstel Brand maintained volume Group volume of the Amstel brand was stable at 10.6 million hectolitres, as strong increases in South Africa and the effect of the roll out of Amstel Pulse in Central and Eastern Europe was offset by lower volume in Greece and in the USA. In the first full year after regaining the brand in South Africa, Amstel is now widely available and growing, confirming its leadership in the premium segment in South Africa. Organic revenue growth driven by strong pricing Revenue increased 27% to EUR14.3 billion. Organic revenue growth was strong at 7.4%, of which 7.0% came from better pricing and sales mix and the remaining 0.4% from higher volume. Revenue grew more strongly in the second half of 2008 as a result of higher prices and better sales mix despite lower volumes, particularly in the last quarter. Heineken increased its selling prices in the vast majority of its markets and was able to pass on a substantial part of higher energy and input costs.

www.heinekeninternational.com Tweede Weteringplantsoen 5 - 1017 ZD Amsterdam, The Netherlands Registered Office at Amsterdam, Trade Register Amsterdam No.. 33078624
6
Foreign currency fluctuation against the euro, mainly the US dollar and the British pound, accounted for 0.9% decrease in revenue. First time consolidation added EUR2,350 million to revenue of which more than 90% was related to Scottish & Newcastle. 3-year F2F delivered in full and on time The Fit 2 Fight (F2F) programme launched in 2006 promised gross savings of EUR450 million in fixed costs by the end of 2008. Heineken has fully delivered, not only cutting its cost base in production, wholesaling and in support functions, but also embedding a strong drive for further cost reduction in its company culture. Between 2006 and 2008, Heineken achieved EUR469 million gross cost savings, slightly ahead of the original target. More than 150 different projects were completed across all regions, leading to a total reduction of more than 12,000 jobs and the closure of 5 breweries. The F2F fixed cost ratio at the end of 2008 was 29.5%, compared with 34.9% three years ago. Heineken will continue its efforts to lower the fixed cost ratio. Several new cost savings initiatives have already been announced for 2009 and 2010, including brewery closures in France, Spain, the UK and Ireland. In the UK, Heineken is also streamlining its sales and commercial functions and increasing efficiency in its cider operations. In 2008, Heineken realised gross savings of EUR164 million under F2F. Total exceptional restructuring costs in 2008 amounted to EUR125 million, mainly cash items. Of the total 2008 savings, 60% was achieved in Western Europe, 25% in Central and Eastern Europe whilst the other regions and the Heineken N.V. head office organisation accounted for the remaining 15%. The contribution per stream of business was: Supply chain 65%, support functions 13% and wholesale operations 22%. Integration of Scottish & Newcastle In October 2008, Heineken received unconditional approval from the Irish Competition Authority for the acquisition of the Irish assets of S&N, Beamish & Crawford, thus completing the acquisition of S&N in the European Union. The integration of the S&N operations has been achieved quickly. Sales organisations in the UK, Ireland and the USA were integrated, S&N’s international Head Office was closed, Heineken’s benchmarking systems were introduced and purchasing contracts were combined. In 2009, the Beamish brewery in Ireland will be closed and early 2010, the Berkshire brewery in the UK.

www.heinekeninternational.com Tweede Weteringplantsoen 5 - 1017 ZD Amsterdam, The Netherlands Registered Office at Amsterdam, Trade Register Amsterdam No.. 33078624
7
The Heineken brand was added to the portfolios in the UK, Portugal and Finland. In the UK, the brand portfolio was further strengthened by the inclusion of Amstel, Tiger and Murphy’s Irish Stout and the Polish brand Zywiec. S&N operations were consolidated as of 28 April, excluding Ireland which was included as of 3 October, adding EUR2,159 million to revenue and EUR111 million to EBIT (beia) (EUR/GBP exchange rate of 1.20). Had the first time consolidation of the full acquisition occurred on 1 January 2008, management estimates that the contribution of S&N operations would have been EUR3,063 million to revenue and EUR87 million to EBIT (beia), at EUR/GBP 1.20 exchange rate (2007: EUR/GBP 1.39). In August 2008, Heineken published unaudited, pro forma results for 2007 and for the first half of 2008 related to the parts of S&N it acquired in April 2008. The pro forma information is derived from S&N’s financial information and adjusted to reflect Heineken’s accounting policies, and measures assets and liabilities at fair market value per the balance sheet date of 28 April 2008 for the opening balance sheet. The adjustments were subject to revision. Based on the information now available, Heineken estimates that the unaudited pro-forma EBIT (beia) of S&N for 2007 amounts to EUR253 million (previously estimated at EUR303 million) of which EUR59 million was for the first half of 2007 (previously estimated at EUR89 million) and EUR194 million was for the second half of 2007 (previously estimated at EUR214 million). The first 4 months of 2008 before Heineken took control of S&N, accounted for an unaudited pro forma negative EBIT (beia) of EUR24 million (previously estimated at EUR4 million positive). The 2007 and 2008 differences are caused by higher, non-cash depreciation charges due to the difference in life tables for fixed assets and intangibles between Heineken and S&N. The pro-forma EBIT (beia) information above does not purport to represent what Heineken’s actual result of operations would have been had the acquisition of the S&N acquired businesses actually occurred on 1 January 2008 or 1 January 2007. The integration of the S&N and Heineken operations progressed well, and large parts of the expected cost synergies have been realised. In the 8 months since Heineken took control, a total of EUR40 million cost synergies has been achieved, corresponding to an annualised value of EUR90 million, almost 50% of the expected total synergies. Related exceptional restructuring costs were EUR110 million before tax. In view of the economic environment, management has taken additional steps to strengthen the brand portfolio, lower costs and improve margins. However, given the current environment, Heineken no longer expects that the acquisition will be value accretive by the fourth full year.

www.heinekeninternational.com Tweede Weteringplantsoen 5 - 1017 ZD Amsterdam, The Netherlands Registered Office at Amsterdam, Trade Register Amsterdam No.. 33078624
8
Financial structure The financial structure of Heineken remains sound. At the end of 2008, Net interest bearing debt of Heineken amounted to EUR8,932 million, implying a Net debt/EBITDA (beia) ratio of 3.3 times. The maturity profile of Heineken’s long-term debt (excluding factoring, including cross currency interest rate swap on long term debt, at the nominal amount) per 31 December 2008 is as follows: Euro millions Repayment Long-
Term obligation 2009* 3282010 1,7542011 4062012 7992013 3,6882014 and beyond 2,066
* On February 9, 2009 the GBP3.85 billion S&N Acquisition Facility (available and drawn amount per 31 December 2008 EUR4,064 million) was restated to become a dual currency Facility, for GBP480 million and EUR3.1 billion. Without this conversion, the available amount expressed in Euros could fluctuate if and when the EUR/GBP exchange rate would move beyond certain thresholds. Before the Facility was restated, the exchange rate mechanism triggered a repayment of EUR100 million on the one year tranche with an extension option to 2 years (expiring April 2010) and a repayment on 15 January 2009 of EUR325 million on the five year tranche (expiring April 2013). These repayments were financed out of the EUR2 billion Revolving Credit Facility. After these and other, scheduled repayments, a total of EUR1.1 billion remains undrawn as per 15 February 2009. On 17 February 2009, Heineken obtained from ING BANK N.V. an additional, fully committed two-year stand-by revolving credit facility for an amount of EUR 250 million. Heineken will be able to repay all debt falling due in the next twelve months from the Revolving Credit Facilities and its internally generated cash flow. Heineken is fully committed to debt reduction and is targeting a Net debt/EBITDA (beia) of 2.5 times. Heineken has an incurrence covenant in some of its financing facilities. This incurrence covenant is calculated by dividing Net Debt by EBITDA (beia), which includes the pro-forma full-year EBITDA of any acquisitions made during the previous twelve months. If the ratio would be beyond a level of 3.5 times, the incurrence covenant would prevent Heineken from conducting further significant debt-financed acquisitions. Heineken has started new initiatives to improve cash generation through a programme named Hunt for Cash 2 (H4C2). H4C2 aims at improving the cash conversion ratio to more than 100%, (Cash conversion ratio is Free operating cash flow/Net profit before minority interests (beia)), in the period 2009-2011. The programme involves reducing net working capital and capital expenditures, and the sale of redundant assets. In addition, Heineken has launched a new cost reduction initiative, Total Cost Management, which covers all cost categories and will focus on those savings that will have an immediate and positive impact on cash flow.
www.heinekeninternational.com Tweede Weteringplantsoen 5 - 1017 ZD Amsterdam, The Netherlands Registered Office at Amsterdam, Trade Register Amsterdam No.. 33078624
9
At the end of December, Heineken’s gross debt was more than 80% euro denominated, as most of the acquired S&N debt and credit facilities in relation to the S&N acquisition were either drawn in or swapped into euro. The remaining debt is mainly denominated in British pounds. Long-term debt is 85% at fixed interest rates, for a substantial part due to the use of hedges. The average interest rate in the second half of 2008 was 5.8%. Barring unforeseen circumstances, Heineken forecasts a similar average interest rate for 2009.

www.heinekeninternational.com Tweede Weteringplantsoen 5 - 1017 ZD Amsterdam, The Netherlands Registered Office at Amsterdam, Trade Register Amsterdam No.. 33078624
10
Review by Region Western Europe 2008 2007 ChangeConsolidated beer volume, mhl 44.3 31.9 39%Consolidated cider volume, mhl 3.2 - -Revenue, EUR m 7,661 5,450 41%EBIT (beia), EUR m 775 665 16%Operating Profit (beia) margin 10.1% 12.3% Western Europe is Heineken’s most profitable region, accounting for 57% of the pro-forma revenue and 40% of the pro-forma EBIT (beia) of the Group. Despite exceptionally volatile and deteriorating global macro economic factors, Heineken was able to balance lower volume by increasing prices and improving its sales mix, the latter mainly by delivering growth of the Heineken brand. EBIT (beia) grew organically as the effect of a positive price and sales mix and realised cost reductions exceeded the impact of lower beer volume and the increase in input and energy costs. In addition, the first time consolidation of S&N and Eichhof Beverage Holding contributed positively. Volume of the Heineken brand increased 1.9% to 7.6 million hectolitres. Growth was driven by strong marketing programmes and innovations, such as the Extra Cold beer programme, which drove good performances in France, the UK and Switzerland. In 2008, DraughtKeg was rolled out for the first time for brands other than Heineken (eg Pelforth in France) and in 2009, a further broadening of the offering is planned. Beer markets in Western Europe faced a challenging year due to the combined impact of the financial crisis, mixed weather, smoking bans in France, the UK, Finland and the Netherlands, and unprecedented increases in excise duties in the UK. Beer consumption in Western Europe came increasingly under pressure, particularly in the on-trade and consolidated beer volume declined 1.6% organically. In total, consolidated beer volume increased, mainly due to the first time inclusion of S&N for 8 months and Eichhof Beverage Holding (±12.8 million hectolitres). Spain Heineken España reported EBIT (beia) growth mainly driven by lower costs. Revenue was marginally higher as better pricing across all trade channels exceeded the effect of lower volume. The beer market decreased by more than 2% affected by the decline in consumer confidence due to the financial crisis and the collapse of real estate prices. In particular, the on-trade channel came under pressure and consumption of low-priced beers in the off-trade increased. This had an adverse effect on beer volume of Heineken España, but the company maintained its market share in the branded beer segment. Heineken brand volume was 5.5% lower, but brand equity improved as a result of new commercial

www.heinekeninternational.com Tweede Weteringplantsoen 5 - 1017 ZD Amsterdam, The Netherlands Registered Office at Amsterdam, Trade Register Amsterdam No.. 33078624
11
activities and the Extra Cold beer programme activation. Cruzcampo, Heineken’s leading mainstream brand, was impacted by the shift from mainstream to low priced beers whilst Buckler volume fell only slightly. At the end of 2008, Heineken España announced the closure of the brewery in Arano. The four remaining breweries will take over the production from Arano. France Heineken France and France Boissons, Heineken’s wholesale business, increased market share. The beer market in France fell 1.3% due to a 14% decrease in on-trade consumption. The introduction of the smoking ban, the economy and unfavourable weather are the major drivers of this decrease. Volume of the Heineken brand grew 4.6%, and the brand now has a 12% share of the market, and is the market leader by value. Revenues were stable, as organic growth was offset by the effect of the sale of the St. Omer brewery, the private label unit. EBIT (beia) was lower, due to higher variable costs, which were not fully compensated by higher prices. The streamlining of the French operations, both in wholesale and production is well under way. The sale of the St. Omer brewery was finalised in the summer and the Fischer Brewery in Schiltigheim will be closed in the first half of 2009. Italy Heineken Italia increased market share thanks to the positive performance of its key brands. Beer volume at Heineken Italia fell 2.2%, broadly in line with a market affected by substantial price increases, prolonged periods of wet weather and declining consumer confidence. Volume of the Heineken and Moretti brands were slightly lower due to significant price increases. Moretti 0/0, the alcohol free version of Moretti, continued to grow satisfactorily. Revenue grew organically, driven by better prices and stable revenue of the wholesale operations, Partesa. Higher input and energy costs and declining volumes in the on-trade resulted in a lower EBIT (beia). The streamlining of the Italian wholesale operations is proceeding as planned. The Netherlands The beer market slowed due to unfavourable weather, the introduction of the smoking ban in July, and lower consumer confidence. Beer volume of Heineken Netherlands was 2.2% lower, affected by a substantial price increase, ahead of the competition. The Heineken brand, sold as a mainstream proposition in The Netherlands, was able to maintain its volume. EBIT (beia) grew driven by a better packaging mix, strict cost control and higher prices. Revenue was also higher.

www.heinekeninternational.com Tweede Weteringplantsoen 5 - 1017 ZD Amsterdam, The Netherlands Registered Office at Amsterdam, Trade Register Amsterdam No.. 33078624
12
In 2008, the wholesale operations were streamlined further, and the range of products was expanded. EBIT (beia) at Vrumona, the soft drink unit, was higher thanks to better prices and a favourable shift in sales mix. The United Kingdom The UK beer market experienced an exceptionally challenging year, decreasing by 5.1%. This was driven by a number of external factors such as the financial crisis, two increases in excise duties within 12 months and continued impact of the smoking ban in the on-trade. The on-trade segment was hit particularly hard (-9.5%), whilst off-trade volume was still slightly positive (+0.5%) due to higher price promotion activity by retailers. The sharp decline in the beer market was aggravated by the steep drop of the British pound against the euro (-21%). The abrupt and unexpected change in the market, led to a much lower than anticipated revenue and EBIT (beia) in euro of S&N UK. Its domestic beer market share was slightly lower, mainly due to its overweight in on-trade and a reduction of price promotions in the off trade. Since the acquisition of S&N, Heineken has strengthened the UK brand portfolio with the inclusion of Heineken® and selected other brands from the Heineken Group. The business now has the strongest and most complete brand portfolio in the market and is the leader in cider. Increased marketing investments in the beer brands will further strengthen the brands’ equity and performance. The Heineken brand performed strongly, growing 24% to more than half a million hectolitres thanks to the success of the Extra Cold beer programme, the extension of the distribution network and new commercial activations. Cider volume grew 6.5% and market share in cider reached 48%, driven by the excellent performance of both the premium Bulmer’s brand and of the mainstream Strongbow brand. Foster’s, the key mainstream brand, refrained from heavy promotional activities, preserving its long-term brand equity and positioning. This affected volume, which was 10% lower. John Smith’s, Heineken’s leading ale brand, and Kronenbourg 1664, the second premium lager in Heineken’s portfolio, performed in line with the market. The exceptional economic circumstances required Heineken to reduce the value of its pub portfolios in the UK by EUR51 million. Belgium The beer market continued to decrease due to declining consumer confidence. Market share of Alken-Maes Breweries, acquired from S&N, was lower, as sales of its main brand Maes were affected by a 5% price increase. EBIT (beia) was lower as better

www.heinekeninternational.com Tweede Weteringplantsoen 5 - 1017 ZD Amsterdam, The Netherlands Registered Office at Amsterdam, Trade Register Amsterdam No.. 33078624
13
pricing was offset by the combined negative effect of lower volume and higher input, and energy costs. Finland Despite the overall beer market trend, 2008 marked a turnaround for the Hartwall business, as the business grew its market share for the first time in 10 years. The beer market declined 3.5%, affected by the introduction of the smoking ban and exceptionally poor summer weather. Hartwall, part of the S&N acquisition, gained more than 1% market share, mainly thanks to its strong performance in the off-trade. Both the Foster’s brand and the Karjala brand improved their equity and sales volume, and partially offset the lower volume of the Lapin Kulta brand. The Heineken brand will become part of Hartwall’s portfolio in 2009. The market trend for other beverages in Hartwall’s wide product range, mainly waters and soft drinks, was weak. Total beverage volume decreased 1% and, together with higher costs, affected EBIT (beia) negatively. Ireland Heineken Ireland increased its market share. The Irish beer market decreased 5.5% in 2008, mainly in the on-trade. Revenue and EBIT (beia) of Heineken Ireland increased organically, thanks to higher prices, which more than offset lower volume (-1.5%) and higher costs. The Heineken brand increased its share in the beer market. Reported EBIT in Ireland decreased slightly due to exceptional costs related to the first time consolidation of Beamish & Crawford as of 3 October 2008. In the last quarter of 2008, Heineken received anti-trust approval for the unconditional acquisition of Beamish and Crawford, part of the S&N acquisition. After a review of the business, Heineken announced its intention to close the Beamish & Crawford brewery in Cork in 2009, in order to reduce overcapacity and improve efficiency. Portugal Centralcer, part of the S&N acquisition, grew its market share. Volume of Centralcer was slightly lower (-2.1%), marginally ahead of the market trend. Revenue grew 6.4%. Sagres, the flagship brand, outperformed the market by maintaining its volume thanks largely to its performance in the on-trade, where it gained leadership. Heineken® was included in Centralcer’s portfolio. The weak on-trade affected volume of the soft drink and water portfolio. Switzerland The positive effect of the UEFA European Football Championship in June and strong growth of private label beer boosted the beer market by 4%. Heineken Switzerland’s volume grew 22%, as a result of a 4.5% organic growth and the first time consolidation of Eichhof Beverages Holding as of 29 August. Heineken Switzerland received unconditional approval to acquire the beverage division of Eichhof Holding. The

www.heinekeninternational.com Tweede Weteringplantsoen 5 - 1017 ZD Amsterdam, The Netherlands Registered Office at Amsterdam, Trade Register Amsterdam No.. 33078624
14
integration of Eichhof into the existing organisation is proceeding at pace and will lead to substantial synergies, in particular in overhead costs and distribution. Organic volume growth of Heineken Switzerland was driven by its Calanda brand and private label business, whilst the Heineken brand was broadly stable. Underlying EBIT (beia) increased more than 20%, thanks to higher revenue and cost cutting under the F2F program. Central and Eastern Europe 2008 2007 Change Consolidated beer volume, mhl 50.5 46.5 8.8% Revenue, EUR m 3,687 3,226 14% EBIT (beia), EUR m 400 428 -6.6% Operating Profit (beia) margin 10.5% 13.2% Heineken further strengthened its leadership in the region through bolt-on acquisitions and organic growth. Volume was 8.8% higher, thanks to the first time consolidation of breweries acquired in Belarus, Romania and the Czech Republic, which added 3 million hectolitres of beer. Organic growth in volume was 2.3%, mainly driven by Russia, Poland, Slovakia, Austria and Croatia. Volume growth slowed in the second half of the year due to the more challenging economic conditions and the impact of higher selling prices. In particular, the higher margin mainstream segment was affected, leading to an unfavourable effect on average margins. Volume of the Heineken brand grew 170,000 hectolitres (+6.6%), thanks to the successful roll out of the Extra Cold beer programme, combined with new commercial programmes and the introduction of clear plastic labels. The brand grew in almost every country, with Greece, Russia and Romania generating 71% of the total increase. Revenue grew 14%, of which 8.7% was organic growth, mainly driven by better pricing. A positive currency impact, mostly from the Polish zloty and the Czech koruna, contributed 1.7%, whilst first time consolidation added the remaining 3.9%. EBIT (beia) was 6.6% lower due to the effect of lower volume in the mainstream segment, significant higher input costs and the depreciation cost of new capacity, which was only partially offset by higher selling prices. Austria The market grew thanks to the substantial volume increase of beer in cans during the UEFA European Football Championship. Volume of Brau Union Austria grew 2%, resulting in share gains in the premium and mainstream segments. The Zipfer and Puntigamer brands reported strong increases, and volume of the Heineken brand grew 7.3%. Revenue grew in line with volumes. EBIT

www.heinekeninternational.com Tweede Weteringplantsoen 5 - 1017 ZD Amsterdam, The Netherlands Registered Office at Amsterdam, Trade Register Amsterdam No.. 33078624
15
(beia) was stable, impacted by a shift from on-trade towards off-trade and towards lower margin pack types. Greece In the second half of 2008, the beer market suffered from the economic slow-down and social disturbances in Greece, which disrupted distribution and reduced both tourism and consumer confidence, causing lower sales in the large on-trade channel. Beer volume of Athenian Brewery was broadly flat, as good increases posted by the Heineken brand (+4.1%) and the strong growth of Fischer lager, offset lower volume of mainstream brand Amstel. Revenue and EBIT (beia) increased mid-single digit, thanks to higher pricing, a better sales mix and the cost savings of the F2F programme. Poland Volume of Grupa Zywiec grew 3.4%, and market share increased 1%. Growth in beer was held back by price increases undertaken to compensate for higher input costs and by an unfavourable weather comparison, but the positive trend in off-trade continued. Mainstream brand Warka grew by double digits, and Zywiec, the national premium brand, outperformed the market. Volume of the Heineken brand was slightly down. Grupa Zywiec increased prices twice in 2008, and revenue in euro grew 18%, of which half was organic growth and half the effect of positive exchange rate movement. EBIT (beia) was also higher. Russia The beer market was 0.6% lower due to mixed weather and the effect of a rapidly declining oil price on the economy, the first fall in 11 years. Selling prices were increased significantly to pass on higher input costs and an increase in excise duty. Heineken Russia improved its market share to 15.8%, driven by strong growth of premium, regional and economy beers (source: AC Nielsen), growing volume by 2.9%. In particular, the Heineken brand developed well reaching 475,000 hectolitres (+9%) whilst economy brand Three Bears reached 2.5 million hectolitres (+39%). Amstel Pulse and premium priced Doctor Diesel lager achieved strong growth, but volume of Ochota was lower. Revenue grew by double digits due to a 12% price increase, but EBIT (beia) was affected by significantly higher transport and input costs, costs related to capacity expansions and a deteriorating sales mix. The weaker rouble results in substantially higher input costs as a large part of raw and packaging materials is invoiced in euros and dollars. These increases may not be passed on in domestic selling prices and, therefore, in combination with the effect of the

www.heinekeninternational.com Tweede Weteringplantsoen 5 - 1017 ZD Amsterdam, The Netherlands Registered Office at Amsterdam, Trade Register Amsterdam No.. 33078624
16
deteriorating economic environment the expected market growth and an increase of the WACC, a goodwill impairment of EUR275 million before tax has been recognised. Other markets in Central & Eastern Europe Volume of Brau Holding International, Heineken’s joint venture with the Schoerghuber group in Germany, was 4.3% lower in a declining market. Lower volume and higher input costs affected its profitability. Heineken’s share in net profit was lower. Heineken Romania enjoyed another good year, with the Heineken brand growing 26% and single-digit growth rates for the Bucegi, Goldenbrau and Ciuc brands. The breweries in the Czech Republic achieved excellent volume (+7.35%), revenue and EBIT (beia) growth. The Heineken brand grew 15%. Africa and the Middle East 2008 2007 ChangeConsolidated beer volume, mhl 18.1 14.7 23%Revenue, EUR m 1,774 1,311 35%EBIT (beia), EUR m 463 326 42%Operating Profit (beia) margin 24.9% 22.9% The Africa and the Middle East region was the star performer in terms of delivering organic growth in both volume and profit. The region added over 3.4 million hectolitres of beer to volume and EUR137 million to EBIT (beia). The strong performance is attributable to a combination of increased market share, rigorous cost control and improved pricing. Political stability and strong economic growth in the region played their role in assisting this result. Consolidated beer volume grew 23%. Almost all countries showed positive volume growth, with substantial volume gains in Nigeria, South Africa and the Democratic Republic of Congo (DRC). This helped to reinforce Heineken’s number two position in this fast growing continent. Revenue grew 35%, of which 33% was organic. This was driven by higher volume and better pricing. An improvement in sales mix also contributed to a strong increase in revenue. EBIT (beia) increased 42%, driven by strong performances of Heineken’s operations in Nigeria, DRC and Egypt. Volume of the Heineken brand across the region grew 31%, or 492,000 hectolitres. South Africa (+40%) and Nigerian Breweries (+60%) were the largest contributors. Group volume of the Amstel brand grew 33% to 2.3 million hectolitres. In South Africa, we continue to regain volume. Consolidated soft drink volume in Africa and the Middle East increased 6% at 4.3 million hectolitres.

www.heinekeninternational.com Tweede Weteringplantsoen 5 - 1017 ZD Amsterdam, The Netherlands Registered Office at Amsterdam, Trade Register Amsterdam No.. 33078624
17
Nigeria Heineken operates in Nigeria through controlling stakes in Nigerian Breweries and Consolidated Breweries of Nigeria, and enjoys an estimated market share of 67%. Combined volume grew 17%. Revenue and EBIT (beia) grew in excess of 30%, thanks to the combination of higher volume, an average 6.5% price increase and the positive effect of cost control. Volumes of Star and Gulder in the mainstream segment experienced double-digit growth and the Heineken brand grew 60%. Higher volumes were driven in part by the introduction of cans for several brands, and the introduction of new packaging for Amstel Malta and Legend. Nigerian Breweries installed a second canning line and can introductions for other brands are underway. The introduction of Fayrouz, a malt-based soft drink, is also proceeding according to plan, with total sales of 180,000 hectolitres, +40%. Egypt The beer market showed another year of strong growth, increasing 8% driven by a growing tourist sector. Al Ahram performed well, significantly increasing EBIT (beia), driven by higher beer volumes, better pricing and rigorous cost cutting. The Heineken brand grew 28%, whilst the Sakara brand, which is particularly strong in tourist areas, also reported good growth. The national mainstream brand, Stella, developed well after its earlier re-launch. South Africa In South Africa, Heineken operates through joint ventures with Diageo and Namibian Breweries, that offer a range of beers, ciders and ready-to-drink brands. Construction of the 3 million hectolitre brewery near Johannesburg is on schedule, and will be operational towards the end of 2009. Group beer volume continued to grow strongly reaching 1.7 million hectolitres. Volume of imported Amstel met its ambitious target and is now selling 1.2 million hectolitres. The strong brand equity, supported by a further increase in distribution and intensive commercial support drove this performance. Heineken brand volume grew organically by more than 40%. Currently, Amstel is sold in cans and one-way bottles imported from The Netherlands. Due to high transportation costs and the weak rand, profit is negative at this stage. However, it is expected to reverse once local brewing commences.

www.heinekeninternational.com Tweede Weteringplantsoen 5 - 1017 ZD Amsterdam, The Netherlands Registered Office at Amsterdam, Trade Register Amsterdam No.. 33078624
18
The Americas 2008 2007 ChangeConsolidated beer volume, mhl 10.3 9.9 4.1%Revenue, EUR m 1,566 1,608 -2.6%EBIT (beia), EUR m 210 234 -10%Operating Profit (beia) margin 10.7% 11.5% The import segment of the US beer market was affected by lower consumer confidence. Heineken’s other important markets in the region showed a positive performance. Consolidated beer volume grew 4.1%, driven by the good performances of local and import operations in the Caribbean and Latin America, which more than offset lower volume in the USA. Heineken® volume in South America and Canada continued to perform well, but lower sales in the USA caused a 3% decline of Heineken volume. Revenue in local currency increased, thanks to higher prices and the first time consolidation of the S&N operations, but revenue in euros was lower in part due to exchange rate fluctuations. The negative currency impact on EBIT (beia), mostly the effect of the lower dollar/euro hedge rate, amounted to EUR56 million. The integration of S&N’s US import operation into Heineken USA went smoothly and Newcastle Brown Ale became part of the sales portfolio immediately after the summer. United States According to AC Nielsen data, the US beer market grew 0.1% in 2008, the result of slight growth in the first part of 2008 and a weaker trend by the end of the year, when the on-trade and convenience store channels in particular came under increasing pressure due to the economic downturn. According to AC Nielsen data, the import segment declined 1.5%. Total beer sales of Heineken USA were 2% lower, with sales volume of the Dutch brands declining -5.6% and the Mexican brands growing +8.3%. Depletions (sales by distributors to retailers) of the Dutch portfolio and Mexican portfolio were -4.9% and +7.9% respectively. Depletions of imported Heineken lager (-4.8%) were also affected by the lack of significant new advertising campaigns whilst sales volume was also affected by a 4.1% price increase across the entire Dutch portfolio in November 2008. Depletions of Heineken Premium Light were only slightly lower, despite price promotions of competing imported light beers. Amstel Light depletions were down 11%. The FEMSA portfolio gained share in the import segment and amongst Mexican-American consumers. Growth was driven by Dos Equis and the Tecate brand family

www.heinekeninternational.com Tweede Weteringplantsoen 5 - 1017 ZD Amsterdam, The Netherlands Registered Office at Amsterdam, Trade Register Amsterdam No.. 33078624
19
(Tecate and Tecate Light), which grew significantly despite a price increase of 4% in October 2008. At the 2009 Super Bowl, Heineken USA launched a new advertising campaign for Heineken lager, which focuses the consumer on the brand’s premium equity and positioning. Lower volume and negative currency developments led to lower reported revenue. EBIT (beia) grew double digit on an organic basis, thanks to significant fixed cost reductions and more efficiency in marketing spend. Reported EBIT (beia) was negatively affected by the lower US dollar hedge rate (-EUR45 million). Canada Heineken Canada increased substantially its revenues and EBIT (beia), driven by the strong performance of the Heineken brand, which grew 11% mainly thanks to additional penetration in the on-trade segment. For the first time the brand exceeded the 500,000 hectolitres threshold. Latin America and Caribbean Heineken operates in the region through
• Controlled operations: Panama, Bahamas, St. Lucia, Martinique and Suriname • CCU, a joint venture controlling the leading brewer in Chile and number two in
Argentina. • A minority stake in FEMSA Cervejas Brazil and in FIFCO in Costa Rica. • Exports to a number of markets of which Puerto Rico is the most significant
Both revenues and EBIT (beia) for Heineken’s fully consolidated operations in the area grew, thanks to higher volume and the implementation of price increases. In Chile, CCU continues to enjoy strong market leadership, and recorded 8% beer volume growth driven by Heineken (+22%) and other local brands Escudo and Cristal. The devaluation of the peso (-21%) limited the profit contribution to Heineken. Volume in the Caribbean markets grew 7.9% despite weaker tourism affecting trading in Bahamas and Puerto Rico. Performances in Panama and Suriname were strong.

www.heinekeninternational.com Tweede Weteringplantsoen 5 - 1017 ZD Amsterdam, The Netherlands Registered Office at Amsterdam, Trade Register Amsterdam No.. 33078624
20
Asia Pacific
2008 2007 ChangeConsolidated beer volume, mhl 2.6 2.4 12%Revenue, EUR m 279 245 14%EBIT (beia), EUR m 65 65 0.1%Operating Profit (beia) margin 16.7% 13.7% Volume and revenue developed well in the region. Underlying EBIT (beia) was positive, but reported EBIT showed only a marginal increase due to the effect of negative currency fluctuation against the euro, start up costs of recently completed breweries and a reduction of the book value of a stake in the Kingway Breweries in China. Heineken operates in the region through:
• Asia Pacific Breweries (APB), the joint venture with Fraser & Neave • Its own operations • Export and licensing
Heineken also has a substantial investment in United Breweries, the market leader in India. Heineken group volume in the region grew 9% and reached 14.6 million hectolitres, with strong growth in Vietnam, Taiwan, China, Malaysia, Singapore, South Korea and Indonesia. Asia Pacific Breweries The Asia Pacific Breweries joint venture experienced a strong year. Overall volume and profit grew and most markets contributed to this performance. APB expanded its footprint with the opening of greenfield breweries in Vientiane, Laos, and Hyderabad, India. The Tiger brand reported a strong year with volumes up 16.3% growing across all its Asian markets. The business in Indochina, which includes Vietnam, Cambodia and Laos, continued to develop strongly and remained the top contributor to APB’s profit in spite of the start up loss in Laos. Beer volume increased 8% and the Tiger and Heineken brands reported strong growth. Volume increased 10% in Papua New Guinea and margins improved thanks to higher selling prices and a better sales mix. Profitability increased substantially. In Singapore, profit increased due to higher volumes and an improvement in the sales mix. Both the Tiger and the Heineken brand grew volumes driven by higher marketing investments and the introduction of innovations. Conditions in the Chinese beer market remain challenging due to fierce competition, unfavourable weather conditions and margin pressure from higher input costs. In view

www.heinekeninternational.com Tweede Weteringplantsoen 5 - 1017 ZD Amsterdam, The Netherlands Registered Office at Amsterdam, Trade Register Amsterdam No.. 33078624
21
of the decrease in value, an impairment charge was taken in relation to the investment in Kingway Brewery Holdings. In Thailand, volume grew in an uncertain political and economic environment, but rising costs led to a lower profit, whilst the brewery in Mongolia was profitable in its first full year of operation. Volumes and profit in Malaysia grew once again. Own operations Multi Bintang Indonesia reported a higher revenue and EBIT (beia) driven by higher volumes of its three key brands, Bintang, Guinness and Heineken. Despite strong pricing, Multi Bintang increased its market share. Brasserie de Nouvelle Caledonie increased sales of its “Number One” beer and the Heineken brand. The brand portfolio was strengthened with the introduction of Hinano, a Tahitian beer brand produced under license. The range of soft drinks was extended with the inclusion of higher margin drinks. Revenue and EBIT (beia) increased. Export and licensing operations in the region Asia Pacific In Taiwan, the Heineken brand continued its growth trajectory. The growth was particularly strong in the on-trade. Heineken® volume in South Korea, Taiwan and Australia enjoyed healthy growth. United Breweries, India United Breweries (UBL) is the market leader in India and sells the leading Indian beer brand Kingfisher. Heineken has a stake of 37.5% in the company. UBL continued to grow volume despite suspension of beer supply in the State of Andhra Pradesh during summer, and the company gained share. Beer volume of United Breweries is not included in Heineken’s Group beer volume. The decrease of the share price of United Breweries in India was a trigger for impairment testing. Because no detailed financial information is provided by UBL to Heineken, it had to reduce the book value of its investment based on the share price. In March 2008, the joint venture partners of Heineken in UBL filed legal proceedings in India against various Scottish & Newcastle, Heineken and Carlsberg entities claiming that the rights enjoyed by Scottish & Newcastle India Private Limited (the entity through which Heineken holds its investment in UBL) in a shareholders agreement relating to UBL and the Articles of Association of UBL are personal to S&N and do not survive the takeover of S&N by Sunrise Acquisitions Limited in April 2008.

www.heinekeninternational.com Tweede Weteringplantsoen 5 - 1017 ZD Amsterdam, The Netherlands Registered Office at Amsterdam, Trade Register Amsterdam No.. 33078624
22
Heineken N.V.’s Head Office Costs and Eliminations 2008 2007 ChangeEBIT (beia), EUR m 19 30 -33% EBIT (beia) contribution of Heineken N.V.’s Head Office Costs and Elimination is EUR11 million lower, as the increase in license incomes (mostly related to the Heineken brand) was more than offset by higher costs related to projects and additional fixed costs in the IT and Supply Chain operations. Organic EBIT (beia) up 8.7% EBIT (beia) grew 11% to EUR1,932 million, of which 8.7% was organic growth (EUR153 million). First time consolidation contributed EUR71 million to the increase, mainly S&N. Lower foreign currency exchange rates against the euro, mostly the hedge rate of the US dollar, had a negative impact of 2.3%. Reported EBIT was 24% lower, at EUR1,080 million. This is due to exceptional costs of EUR789 million, versus EUR319 million in 2007 and includes mainly restructuring costs associated with F2F of EUR125 million, S&N restructuring costs of EUR110 million, S&N integration costs of EUR28 million and write-offs of EUR526 million in relation to the impairment of assets in Russia, India and the UK. Development of EBIT 2008 2007EBIT 1,080 1,418Amortisation of brands and customer relations 63 11Exceptional items 789 319EBIT (beia) 1,932 1,748 ChangeEBIT (beia) 2007 1,748Organic EBIT growth 153 8.7%Exchange rate effects -40 -2.3%First-time consolidations 71 4.1%EBIT (beia) 2008 1,932 11% Marketing and selling costs increased 16%, due to first time consolidation, but did not increase organically, thanks to higher efficiency in brand allocation and savings programmes. Marketing & selling expenses as a percentage of revenue decreased from 12.8% to 11.7%. Input costs – raw materials and packaging expenses – were 38% higher, of which 18% was organic (15% due to higher purchasing prices and 3% volume and changes in packaging mix) and the remainder the result of first time consolidation.
www.heinekeninternational.com Tweede Weteringplantsoen 5 - 1017 ZD Amsterdam, The Netherlands Registered Office at Amsterdam, Trade Register Amsterdam No.. 33078624
23
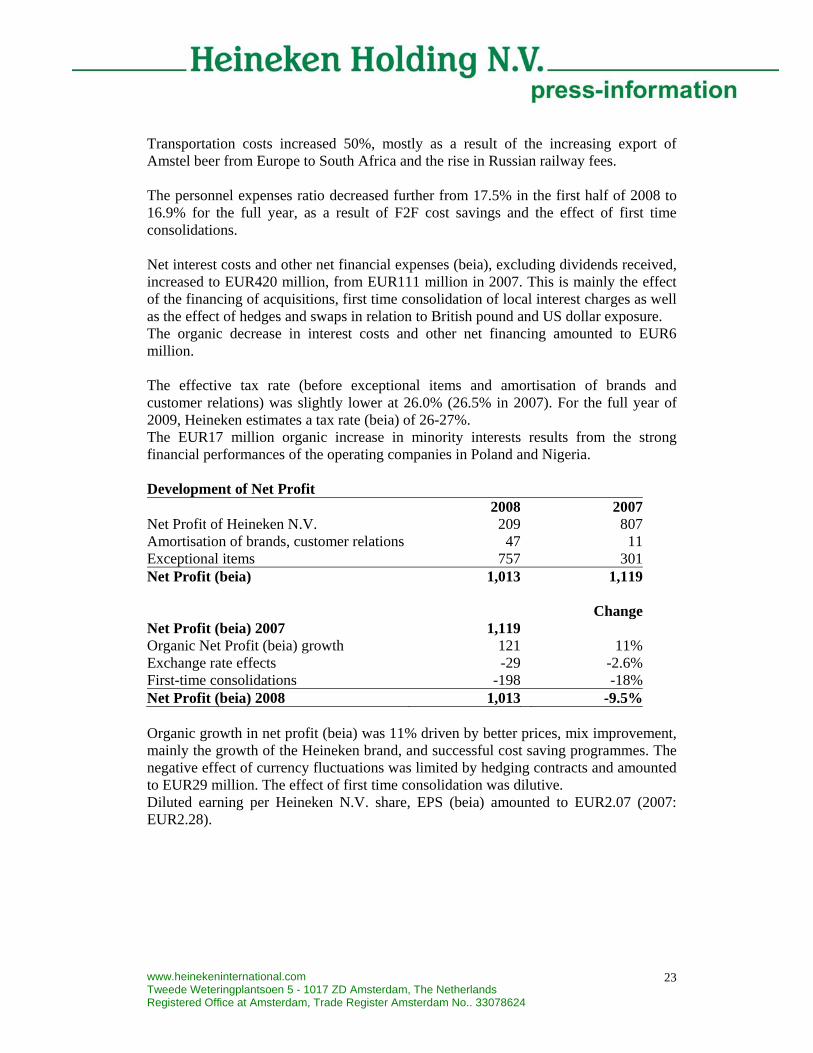
Transportation costs increased 50%, mostly as a result of the increasing export of Amstel beer from Europe to South Africa and the rise in Russian railway fees. The personnel expenses ratio decreased further from 17.5% in the first half of 2008 to 16.9% for the full year, as a result of F2F cost savings and the effect of first time consolidations. Net interest costs and other net financial expenses (beia), excluding dividends received, increased to EUR420 million, from EUR111 million in 2007. This is mainly the effect of the financing of acquisitions, first time consolidation of local interest charges as well as the effect of hedges and swaps in relation to British pound and US dollar exposure. The organic decrease in interest costs and other net financing amounted to EUR6 million. The effective tax rate (before exceptional items and amortisation of brands and customer relations) was slightly lower at 26.0% (26.5% in 2007). For the full year of 2009, Heineken estimates a tax rate (beia) of 26-27%. The EUR17 million organic increase in minority interests results from the strong financial performances of the operating companies in Poland and Nigeria. Development of Net Profit 2008 2007Net Profit of Heineken N.V. 209 807Amortisation of brands, customer relations 47 11Exceptional items 757 301Net Profit (beia) 1,013 1,119 ChangeNet Profit (beia) 2007 1,119 Organic Net Profit (beia) growth 121 11%Exchange rate effects -29 -2.6%First-time consolidations -198 -18%Net Profit (beia) 2008 1,013 -9.5% Organic growth in net profit (beia) was 11% driven by better prices, mix improvement, mainly the growth of the Heineken brand, and successful cost saving programmes. The negative effect of currency fluctuations was limited by hedging contracts and amounted to EUR29 million. The effect of first time consolidation was dilutive. Diluted earning per Heineken N.V. share, EPS (beia) amounted to EUR2.07 (2007: EUR2.28).
www.heinekeninternational.com Tweede Weteringplantsoen 5 - 1017 ZD Amsterdam, The Netherlands Registered Office at Amsterdam, Trade Register Amsterdam No.. 33078624
24
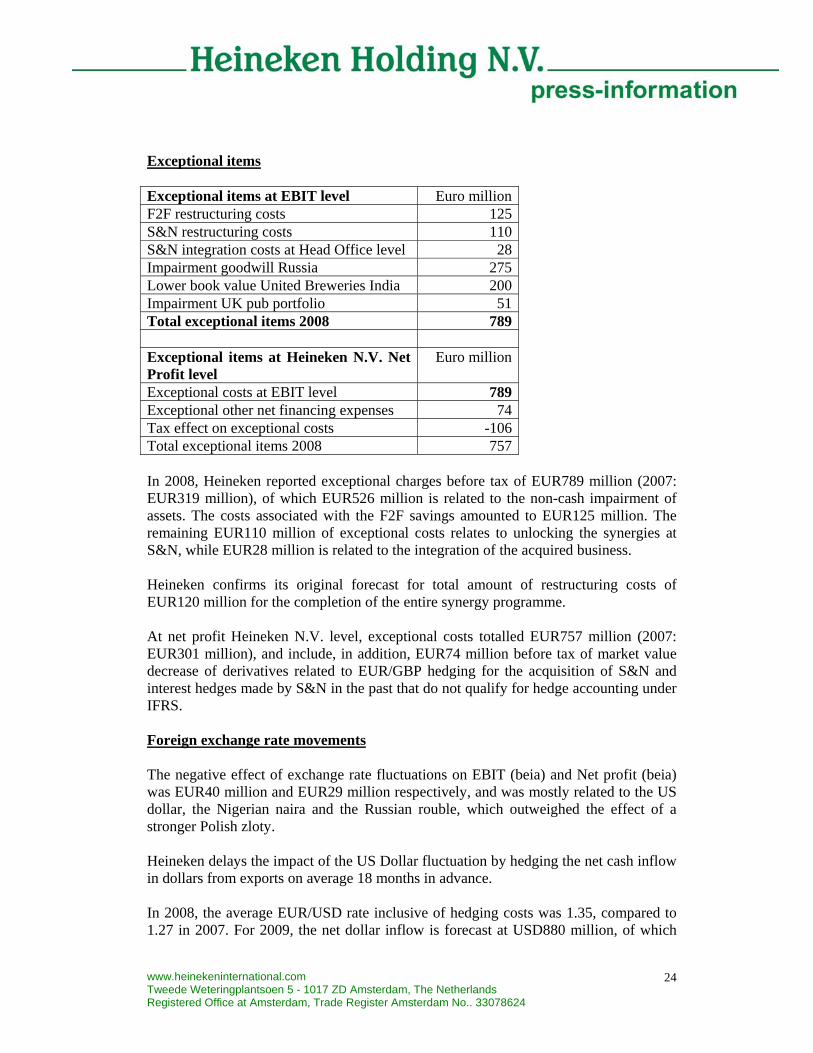
Exceptional items Exceptional items at EBIT level Euro millionF2F restructuring costs 125S&N restructuring costs 110S&N integration costs at Head Office level 28Impairment goodwill Russia 275Lower book value United Breweries India 200Impairment UK pub portfolio 51Total exceptional items 2008 789 Exceptional items at Heineken N.V. Net Profit level
Euro million
Exceptional costs at EBIT level 789Exceptional other net financing expenses 74Tax effect on exceptional costs -106Total exceptional items 2008 757 In 2008, Heineken reported exceptional charges before tax of EUR789 million (2007: EUR319 million), of which EUR526 million is related to the non-cash impairment of assets. The costs associated with the F2F savings amounted to EUR125 million. The remaining EUR110 million of exceptional costs relates to unlocking the synergies at S&N, while EUR28 million is related to the integration of the acquired business. Heineken confirms its original forecast for total amount of restructuring costs of EUR120 million for the completion of the entire synergy programme. At net profit Heineken N.V. level, exceptional costs totalled EUR757 million (2007: EUR301 million), and include, in addition, EUR74 million before tax of market value decrease of derivatives related to EUR/GBP hedging for the acquisition of S&N and interest hedges made by S&N in the past that do not qualify for hedge accounting under IFRS. Foreign exchange rate movements The negative effect of exchange rate fluctuations on EBIT (beia) and Net profit (beia) was EUR40 million and EUR29 million respectively, and was mostly related to the US dollar, the Nigerian naira and the Russian rouble, which outweighed the effect of a stronger Polish zloty. Heineken delays the impact of the US Dollar fluctuation by hedging the net cash inflow in dollars from exports on average 18 months in advance. In 2008, the average EUR/USD rate inclusive of hedging costs was 1.35, compared to 1.27 in 2007. For 2009, the net dollar inflow is forecast at USD880 million, of which
www.heinekeninternational.com Tweede Weteringplantsoen 5 - 1017 ZD Amsterdam, The Netherlands Registered Office at Amsterdam, Trade Register Amsterdam No.. 33078624
25
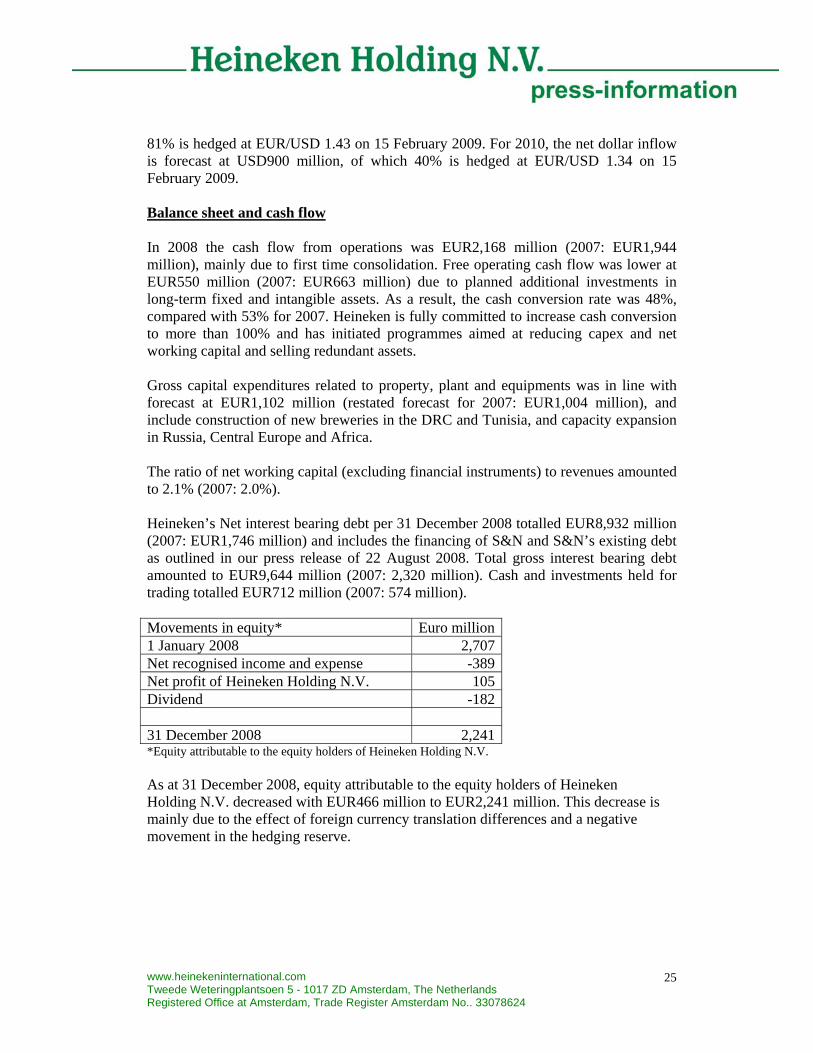
81% is hedged at EUR/USD 1.43 on 15 February 2009. For 2010, the net dollar inflow is forecast at USD900 million, of which 40% is hedged at EUR/USD 1.34 on 15 February 2009. Balance sheet and cash flow In 2008 the cash flow from operations was EUR2,168 million (2007: EUR1,944 million), mainly due to first time consolidation. Free operating cash flow was lower at EUR550 million (2007: EUR663 million) due to planned additional investments in long-term fixed and intangible assets. As a result, the cash conversion rate was 48%, compared with 53% for 2007. Heineken is fully committed to increase cash conversion to more than 100% and has initiated programmes aimed at reducing capex and net working capital and selling redundant assets. Gross capital expenditures related to property, plant and equipments was in line with forecast at EUR1,102 million (restated forecast for 2007: EUR1,004 million), and include construction of new breweries in the DRC and Tunisia, and capacity expansion in Russia, Central Europe and Africa. The ratio of net working capital (excluding financial instruments) to revenues amounted to 2.1% (2007: 2.0%). Heineken’s Net interest bearing debt per 31 December 2008 totalled EUR8,932 million (2007: EUR1,746 million) and includes the financing of S&N and S&N’s existing debt as outlined in our press release of 22 August 2008. Total gross interest bearing debt amounted to EUR9,644 million (2007: 2,320 million). Cash and investments held for trading totalled EUR712 million (2007: 574 million). Movements in equity* Euro million1 January 2008 2,707Net recognised income and expense -389Net profit of Heineken Holding N.V. 105Dividend -182 31 December 2008 2,241*Equity attributable to the equity holders of Heineken Holding N.V. As at 31 December 2008, equity attributable to the equity holders of Heineken Holding N.V. decreased with EUR466 million to EUR2,241 million. This decrease is mainly due to the effect of foreign currency translation differences and a negative movement in the hedging reserve.

www.heinekeninternational.com Tweede Weteringplantsoen 5 - 1017 ZD Amsterdam, The Netherlands Registered Office at Amsterdam, Trade Register Amsterdam No.. 33078624
26
The loss on foreign currency translation differences for foreign operations in equity amounts to EUR301 million and is mainly due to the impact of depreciation of the British pound on the net assets and goodwill measured in British pounds of total EUR423 million. Remaining impact is related to devaluation of the Russian rouble and Chilean peso off set by the appreciation of the US dollar. Hedge accounting on interest rate swaps and hedging of US dollar export cash flows mainly cause the negative impact on the hedging reserve. Press enquiries Investor and analyst enquiries Véronique Schyns Jan van de Merbel Tel: +31 20 5239 355 Tel: +31 20 5239 590 [email protected] [email protected] The press conference will be broadcast live via the website today from 09:00 CET. The presentation for analysts can be seen live from 15:00 CET. The presentations can be monitored live on www.heinekeninternational.com, from which they can be downloaded afterwards. Editorial information: Heineken N.V. is one of the world’s great brewers and is committed to growth and remaining independent. The brand that bears the founder’s family name – Heineken – is available in almost every country on the globe and is the world’s most valuable international premium beer brand. The company’s aim is to be a leading brewer in each of the markets in which we operate and to have the world’s most prominent brand portfolio. In 2008, the Company operated 125 breweries in more than 70 countries and sold 162 million hectolitres of beer. Heineken is Europe’s largest brewer and the world’s third largest by volume. Heineken is committed to the responsible marketing and consumption of its more than 200 international premium, regional, local and specialty beers and ciders. These include Amstel, Birra Moretti, Cruzcampo, Foster’s, Maes, Murphy’s Newcastle Bown Ale, Ochota, Primus, Sagres, Star, Strongbow, Tiger and Zywiec. In 2008, revenue totalled EUR 14.3 billion and Net Profit before exceptional items and amortisation was EUR 1.0 billion. In 2008, the average number of people employed was 56,208. Heineken N.V. and Heineken Holding N.V. shares are listed on the Amsterdam stock exchange. Prices for the ordinary shares may be accessed on Bloomberg under the symbols HEIA:NA and HEIO:NA and on the Reuter Equities 2000 Service under HEIN.AS and HEIO.AS. Additional information is available on Heineken's home page: http://www.heinekeninternational.com.
www.heinekeninternational.com Tweede Weteringplantsoen 5 - 1017 ZD Amsterdam, The Netherlands Registered Office at Amsterdam, Trade Register Amsterdam No.. 33078624
27
Appendices
1. Consolidated income statement 2. Consolidated balance sheet 3. Movement in total equity 4. Consolidated statement of recognised income and expense 5. Information by region 6. Consolidated statement of cash flows 7. Loans and borrowings 8. Acquisitions 9. Notes to the appendices 10. Glossary

www.heinekeninternational.com Tweede Weteringplantsoen 5 - 1017 ZD Amsterdam, The Netherlands Registered Office at Amsterdam, Trade Register Amsterdam No.. 33078624
28
Appendix 1 Consolidated income statement of Heineken Holding N.V.
For the year ended 31 December 2008 In millions of euro 2008 2007 Restated * Revenue 14,319 11,245 Other income 32 28 Raw material, consumables and services 9,548 7,320Personnel expenses 2,415 1,951Amortisation, depreciation and impairments 1,206 638Total expenses 13,169 9,909Results from operating activities 1,182 1,364 Interest income 91 64Interest expenses (469) (155)Other net finance expenses (107) (4)Net finance expenses (485) (95) Share of profit of associates and joint ventures and impairments thereof (net of income tax)
(102) 54
Profit before income tax 595 1,323 Income tax expense (248) (394)Profit 347 929 Attributable to: Equity holders of Heineken Holding N.V. (Net Profit)
105
404
Minority interest in Heineken N.V. 104 403Minority interests in Heineken N.V. group companies 138 122Profit 347 929 Number of issued shares 245,011,848 245,011,848Number of outstanding shares 245,011,848 245,011,848 Basic earnings per share (EUR) 0.43 1.65Diluted earnings per share (EUR) 0.43 1.65 * 2007 comparatives have been restated due to the deconsolidation of joint ventures

www.heinekeninternational.com Tweede Weteringplantsoen 5 - 1017 ZD Amsterdam, The Netherlands Registered Office at Amsterdam, Trade Register Amsterdam No.. 33078624
29
Appendix 1 continued Raw materials, consumables and services In millions of euro 2008 2007
Restated* Raw materials 1,230 763Non-returnable packaging 1,782 1,418Goods for resale 2,158 1,501Inventory movements (154) (50)Marketing and selling expenses 1,671 1,439Transport expenses 988 656Energy and water 349 257Repair and maintenance 295 237EC fine - 219Loss on disposals 16 -Other expenses 1,213 880 9,548 7,320 * 2007 comparatives have been restated due to the deconsolidation of joint ventures

www.heinekeninternational.com Tweede Weteringplantsoen 5 - 1017 ZD Amsterdam, The Netherlands Registered Office at Amsterdam, Trade Register Amsterdam No.. 33078624
30
Appendix 2 Consolidated balance sheet of Heineken Holding N.V.
As at 31 December 2008 In millions of euro 31 December
200831 December
2007 Restated*Assets Property, plant & equipment 6,314 4,673Intangible assets 7,109 2,110Investments in associates and joint ventures 1,145 892Other investments 641 397Advances to customers 346 209Deferred tax assets 259 316Total non-current assets 15,814 8,597Inventories 1,246 883Other investments 14 14Trade and other receivables 2,504 1,769Prepayments and accrued income 231 110Cash and cash equivalents 698 560Assets classified as held for sale 56 21Total current assets 4,749 3,357Total assets 20,563 11,954 Equity Share capital 392 392Reserves (17) 361Retained earnings 1,866 1,954Equity attributable to the equity holders of Heineken Holding N.V.
2,241 2,707
Minority interests in Heineken N.V. 2,230 2,697Minority interests in Heineken N.V. group companies 281 307Total equity 4,752 5,711Liabilities Loans and borrowings 9,084 1,295Employee benefits 688 586Provisions 344 158Deferred tax liabilities 637 427Total non-current liabilities 10,753 2,466Bank overdrafts 94 251Loans and borrowings 875 787Trade and other payables 3,846 2,525Tax liabilities 85 71Provisions 158 143Total current liabilities 5,058 3,777Total liabilities 15,811 6,243Total equity and liabilities 20,563 11,954 * 2007 comparatives have been restated due to the deconsolidation of joint ventures

www.heinekeninternational.com Tweede Weteringplantsoen 5 - 1017 ZD Amsterdam, The Netherlands Registered Office at Amsterdam, Trade Register Amsterdam No.. 33078624
31
Appendix 3 Movement in Total equity of Heineken Holding N.V. In millions of euro
Sharecapital
Translationreserve
Hedging
reservesFair value
reserveOther legal
reservesRetained earnings Equity1
Minority interests in
Heineken N.V.
Minorityinterests in
Heineken N.V.group
companiesRestated* Total equity
Balance as at 1 January 2007 392 48 14 48 231 1,774 2,507 2,502 284 5,293 Net recognised income and expense - (44) 8 1 9 (10) (36) (35) (2) (73) Profit - - - - 44 360 404 403 122 929 Transfer to retained earnings - - - - 2 (2) - - - - Dividends to shareholders - - - - - (167) (167) (166) (84) (417) Purchase minority shares - - - - - - - - (21) (21) Purchase own shares by Heineken N.V. - - - - - (5) (5) (10) - (15) Share based payments by Heineken N.V. - - - - - 4 4 3 - 7 Changes in consolidation - - - - - - - - 8 8 Balance as at 31 December 2007 392 4 22 49 286 1,954 2,707 2,697 307 5,711 Balance as at 1 January 2008 392 4 22 49 286 1,954 2,707 2,697 307 5,711 Net recognised income and expense - (302) (83) (5) (22) 22 (390) (389) (44) (823) Profit - - - - 71 34 105 104 138 347 Transfer to retained earnings - - - - (37) 37 - - - - Dividends to shareholders - - - - - (182) (182) (181) (148) (511) Purchase minority shares - - - - - - - - (7) (7) Purchase/reissuance own shares by Heineken N.V.
- - - - - (5) (5) (6) - (11)
Share based payments by Heineken N.V. - - - - - 6 6 5 - 11 Changes in consolidation - - - - - - - - 35 35 Balance as at 31 December 2008 392 (298) (61) 44 298 1,866 2,241 2,230 281 4,752 1 Equity attributable to equity holders of Heineken Holding N.V. * 2007 comparatives have been restated due to the deconsolidation of joint ventures

www.heinekeninternational.com Tweede Weteringplantsoen 5 - 1017 ZD Amsterdam, The Netherlands Registered Office at Amsterdam, Trade Register Amsterdam No.. 33078624
32
Dividends The following dividends were declared and paid by Heineken Holding N.V.: In millions of euro 2008 2007 Final dividend previous year EUR0.46, respectively EUR0.44 per ordinary share
113
108 Interim dividend current year EUR0.28, respectively EUR0.24 per ordinary share
69
59 Total dividend declared and paid 182 167 After the balance sheet date the Board of Directors announced the following dividends. The dividends, taken into account the interim dividends declared and paid, have not been provided for. In millions of euro 2008 2007 EUR0.62 per qualifying ordinary share (2007: EUR0.70) 152 172

www.heinekeninternational.com Tweede Weteringplantsoen 5 - 1017 ZD Amsterdam, The Netherlands Registered Office at Amsterdam, Trade Register Amsterdam No.. 33078624
33
Appendix 4 Consolidated statement of recognised income and expense of Heineken Holding N.V.
For the period ended 31 December 2008 In millions of euro 31 December
2008 31 December 2007
Restated* Foreign currency translation differences for foreign operations (645) (90)Effective portion of change in fair value of cash flow hedge (108) 51Effective portion of cash flow hedges transferred to the income statement
(59) (36)
Net change in fair value available-for-sale investments (12) 2Net change in fair value available-for-sale investments transferred to the income statement
1 -
Net income and expense recognised directly in equity (823) (73)Profit 347 929Total recognised income and expense (476) 856 Attributable to: Equity holders of Heineken Holding N.V. (285) 368Minority interests in Heineken N.V. (285) 368Minority interests in Heineken N.V. group companies 94 120Total recognised income and expense (476) 856 * 2007 comparatives have been restated due to the deconsolidation of joint ventures

www.heinekeninternational.com Tweede Weteringplantsoen 5 - 1017 ZD Amsterdam, The Netherlands Registered Office at Amsterdam, Trade Register Amsterdam No.. 33078624
34
Appendix 5 Information by region For the year ended 31 December 2008 In millions of euro 2008 2007
Restated* Revenue Western Europe 7,661 5,450Central and Eastern Europe 3,687 3,226Africa and Middle East 1,774 1,311Americas 1,566 1,608Asia/Pacific 279 245Head Office Heineken N.V. /eliminations/others (648) (595)Total revenue 14,319 11,245
EBIT
Western Europe 509 410Central and Eastern Europe 111 353Africa and Middle East 462 326Americas 206 234Asia/Pacific (136) 65Head Office Heineken N.V./eliminations/others (72) 30Total EBIT 1,080 1,418 EBIT (excl. exceptional items and amortisation of brands)and customer relationships
Western Europe 775 665Central and Eastern Europe 400 428Africa and Middle East 463 326Americas 210 234Asia/Pacific 65 65Head Office Heineken N.V./eliminations/others 19 30Total EBIT (BEIA) 1,932 1,748 Total assets
Western Europe 11,687 3,798Central and Eastern Europe 5,198 5,213Africa and Middle East 1,919 1,284Americas 1,512 935Asia/Pacific 552 346Head Office Heineken N.V. (472) 73
20,396 11,649Unallocated items 167 305Total assets 20,563 11,954 * 2007 comparatives have been restated due to the deconsolidation of joint ventures

www.heinekeninternational.com Tweede Weteringplantsoen 5 - 1017 ZD Amsterdam, The Netherlands Registered Office at Amsterdam, Trade Register Amsterdam No.. 33078624
35
Appendix 6 Consolidated statement of cash flows of Heineken Holding N.V. For the year ended 31 December 2008 In millions of euro
2008 2007
Restated*Operating activities Profit 347 929Adjustments for: Amortisation, depreciation and impairments 1,206 638Net interest (income)/expenses 378 91Gain on sale of property, plant & equipment, intangible assetsand subsidiaries, joint ventures and associates (32) (28)Investment income and share of profit and impairments ofassociates and joint ventures 108 (70)Income tax expenses 248 394Other non-cash items 74 106Cash flow from operations before changes in working capital and provisions
2,329 2,060
Change in inventories (157) (130)Change in trade and other receivables (184) (159)Change in trade and other payables 294 244Total change in working capital (47) (45)Change in provisions and employee benefits (114) (71)Cash flow from operations 2,168 1,944Interest paid & received (309) (87)Dividend received 52 47Income taxes paid (251) (375)Cash flow related to interest, dividend and income tax (508) (415)Cash flow from operating activities 1,660 1,529 Investing activities Proceeds from sale of property, plant & equipment and intangible assets
93
70
Purchase of property, plant & equipment (1,102) (1,004)Purchase of intangible assets (158) (17)Loans issued to customers and other investments (163) (133)Repayment on loans to customers 220 218Cash flow used in operational investing activities (1,110) (866)Free operating cash flow 550 663 Acquisition of subsidiaries and minority interests, net of cash acquired
(3,580)
(241)
Acquisition of associates, joint ventures and other investments (202) (58)Disposal of subsidiaries and minority interests, net of cash disposed of
68
12
Disposal of associates, joint ventures and other investments 80 28Cash flow used for acquisitions and disposals (3,634) (259)Cash flow from/(used in) investing activities (4,744) (1,125)* 2007 comparatives have been restated due to the deconsolidation of joint ventures

www.heinekeninternational.com Tweede Weteringplantsoen 5 - 1017 ZD Amsterdam, The Netherlands Registered Office at Amsterdam, Trade Register Amsterdam No.. 33078624
36
Appendix 6 continued Consolidated statement of cash flows of Heineken Holding N.V.– continued For the year ended 31 December 2008 In millions of euro
2008 2007
Restated* Financing activities Proceeds from loans and borrowings 6,361 67Repayment of loans and borrowings (2,532) (252)Dividends paid (485) (417)Purchase own shares (11) (15)Other (24) (14)Cash flow from/(used in) financing activities 3,309 (631) Net Cash Flow 225 (227) Cash and cash equivalents as at 1 January 309 541Effect of movements in exchange rates 70 (5)Cash and cash equivalents as at 31 December 604 309 * 2007 comparatives have been restated due to the deconsolidation of joint ventures
www.heinekeninternational.com Tweede Weteringplantsoen 5 - 1017 ZD Amsterdam, The Netherlands Registered Office at Amsterdam, Trade Register Amsterdam No.. 33078624
37
Appendix 7
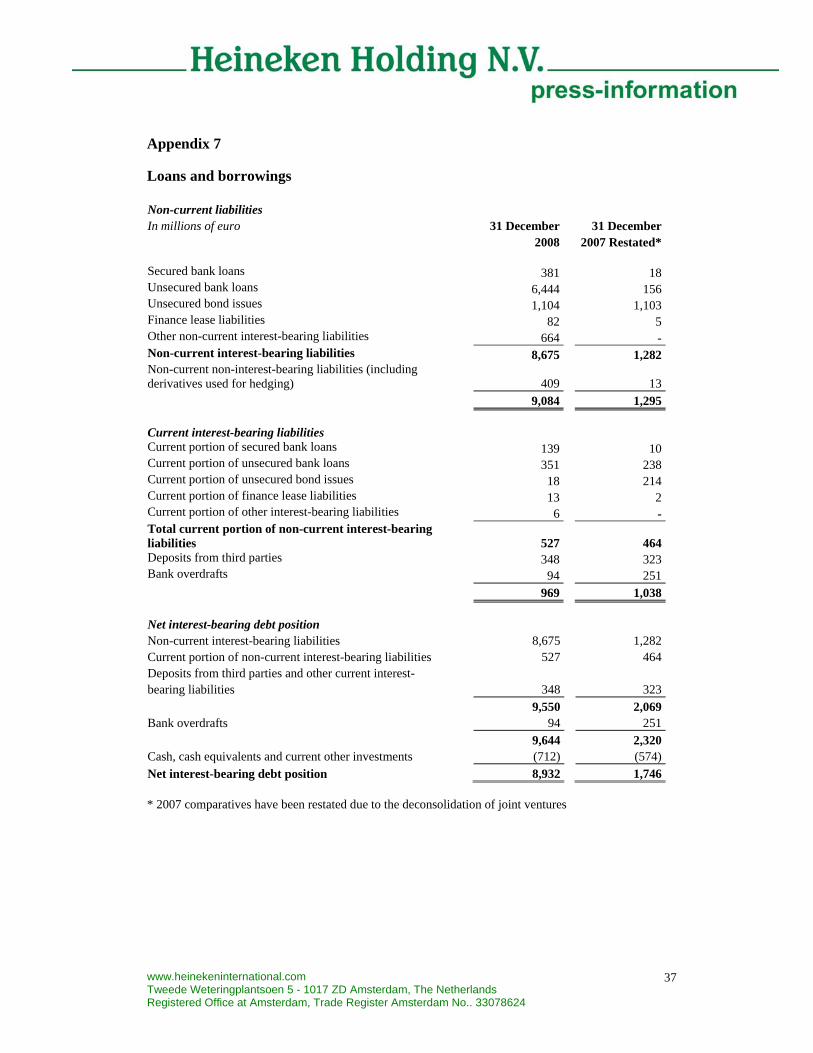
Loans and borrowings Non-current liabilities In millions of euro 31 December
2008 31 December
2007 Restated* Secured bank loans 381 18Unsecured bank loans 6,444 156Unsecured bond issues 1,104 1,103Finance lease liabilities 82 5Other non-current interest-bearing liabilities 664 -Non-current interest-bearing liabilities 8,675 1,282Non-current non-interest-bearing liabilities (including derivatives used for hedging)
409 13
9,084 1,295 Current interest-bearing liabilities Current portion of secured bank loans 139 10Current portion of unsecured bank loans 351 238Current portion of unsecured bond issues 18 214Current portion of finance lease liabilities 13 2Current portion of other interest-bearing liabilities 6 -Total current portion of non-current interest-bearing liabilities
527
464
Deposits from third parties 348 323Bank overdrafts 94 251 969 1,038 Net interest-bearing debt position Non-current interest-bearing liabilities 8,675 1,282Current portion of non-current interest-bearing liabilities 527 464Deposits from third parties and other current interest-bearing liabilities
348
323
9,550 2,069Bank overdrafts 94 251 9,644 2,320Cash, cash equivalents and current other investments (712) (574)Net interest-bearing debt position 8,932 1,746 * 2007 comparatives have been restated due to the deconsolidation of joint ventures
www.heinekeninternational.com Tweede Weteringplantsoen 5 - 1017 ZD Amsterdam, The Netherlands Registered Office at Amsterdam, Trade Register Amsterdam No.. 33078624
38
Appendix 7 continued To finance the acquisition and to replace existing loans and borrowings of Scottish & Newcastle (refer to appendix 8), Heineken entered into an Acquisition Credit Facility of GBP3.85 billion (‘S&N acquisition facility’) with a consortium of nine banks. The S&N acquisition facility was reduced during the year, and as at 31 December 2008, the facility was fully drawn with GBP480 million and EUR3,560 million (in total EUR4,064 million) under two tranches. A one-year tranche with an extension option to 2 years (EUR1,144 million) and a five-year tranche of EUR2,920 million. Interest is based on Libor/Euribor plus a margin. The S&N acquisition facility is denominated in British Pound. If the amounts denominated in another currency would exceed a certain British Pound threshold, measured on a recurring basis, the total facility amount would remain at the original British Pound amount and any shortfall in the other currency would have to be repaid. As at 31 December 2008, it is the intention to extend the one-year tranche with the extension option to a total of 2 years until April 2010. Heineken has an incurrence covenant in some of its financing facilities. This incurrence covenant is calculated by dividing Net Debt (calculated in accordance with the consolidation method of the 2007 consolidated financial statements) by EBITDA (beia), also calculated in accordance with the consolidation method of the 2007 consolidated financial statements and including the pro-forma full-year EBITDA of any acquisitions made during the previous 12 months. As at 31 December 2008 this ratio was 3.14. The incurrence covenant would prevent Heineken from conducting further significant debt-financed acquisitions if this would lead to passing the threshold of 3.50. Following the acquisition of S&N, EUR4,014 million of interest-bearing loans and borrowings has been assumed, of which a USD1.15 billion S&N US private placement has been renegotiated as per the date of the acquisition with maturities between 2009 and 2015 and a weighted annual interest rate of 5.4 percent. Assumed debt amounting to EUR1,996 million has been repaid, partly by the S&N acquisition facility. As per 31 December 2008 EUR470 million was drawn on the existing revolving credit facility of EUR2 billion. This revolving credit facility matures in 2012. Interest is based on EURIBOR plus a margin. Heineken established a EUR3 billion EMTN-program in September 2008. This program has been approved by the Luxembourg Commission de Surveillance du Secteur Financier which is the Luxembourg competent authority for the purpose of Directive 2003/71/EC and facilitates flexible access to Debt Capital Markets going-forward.

www.heinekeninternational.com Tweede Weteringplantsoen 5 - 1017 ZD Amsterdam, The Netherlands Registered Office at Amsterdam, Trade Register Amsterdam No.. 33078624
39
Appendix 8 Acquisitions Scottish & Newcastle (‘S&N’) acquisition On 28 April 2008, Scottish & Newcastle plc (‘S&N’) was acquired by Sunrise Acquisition Ltd. (‘Sunrise’). The consortium agreement between Heineken N.V. and Carlsberg A/S regulates the allocation of the consideration, brands, businesses and separation steps to be completed after the acquisition. Based on the consortium agreement, Heineken has acquired 100 percent of the voting rights of the S&N businesses in the United Kingdom, Finland, Portugal, United States and Ireland and 99.65 percent of the voting rights in Belgium. Through the S&N acquisition, Heineken acquired 37.5 percent of the voting rights in United Breweries Ltd. (India, included as joint venture). Furthermore, two Special Purpose Entities (SPEs) were acquired. These SPEs relate to a pub estate partnership and a logistic partnership in the UK. The consideration paid amounted to EUR2.7 billion with a net cash outflow of EUR2.8 billion. The S&N acquisition had the following effect on Heineken’s assets and liabilities on acquisition date:
In millions of euro Pre-acquisition
carrying amounts
Fair value adjustments
Recognised values on
acquisition date* Property, plant & equipment 1,705 (198) 1,507Intangible assets 514 1,025 1,539Investments in associates and joint ventures 357 46 403Other investments 434 (19) 415Advances to customers 105 - 105Deferred tax assets 2 25 27Inventories 262 4 266Trade and other receivables, prepayments and accrued income 971 (27) 944Cash and cash equivalents 178 - 178Loans and borrowings (2,085) 106 (1,979)Employee benefits (42) (183) (225)Deferred tax liabilities (296) (185) (481)Provisions (251) (5) (256)Bank overdrafts (287) - (287)Current liabilities (3,089) 10 (3,079)Net identifiable assets and liabilities (1,522) 599 (923)Goodwill on acquisition 3,651Consideration paid 2,728Net bank overdrafts acquired 109Net cash outflow 2,837 * Beamish & Crawford is consolidated as per 3 October 2008, the date at which Heineken gained control. All fair value adjustments up until 31 December 2008 have been incorporated in the recognised values on acquisition date.

www.heinekeninternational.com Tweede Weteringplantsoen 5 - 1017 ZD Amsterdam, The Netherlands Registered Office at Amsterdam, Trade Register Amsterdam No.. 33078624
40
Appendix 8 continued
Scottish & Newcastle (‘S&N’) acquisition - continued On 3 October 2008 Heineken received unconditional approval from the Irish Competition Authority, until that date Beamish and Crawford was classified as an available-for-sale investment with fair value changes in equity (other investments). The S&N shareholdings in India are classified as joint ventures, although legal proceedings have been filed by the joint venture partner of Heineken in United Brewery Limited. The S&N acquired entities are fully integrated in the Heineken regional structure and the former S&N head office has been dismantled. Goodwill on the acquisition of S&N has been allocated to the Western European and Americas region for the purpose of impairment testing in line with the operational responsibility. Goodwill in Western Europe and the Americas is monitored on a regional level. Synergies in the Western European market are expected to be achieved as result of a stronger presence in Western Europe enabling Heineken to secure its position and to increase its market share through appropriate commercial investments. Synergies in the Americas are expected to be achieved as a result of a stronger position in the US, Canada and export to the Caribbean. For both regions cost synergies are expected through more efficient central purchasing, sourcing and selling in respect of both the S&N and Heineken brands. The purchase price and the allocated fair values of assets and liabilities acquired have been determined on a provisional basis, because the final settlement with the consortium partner Carlsberg has not yet been completed and there remains uncertainty regarding certain positions such as the tax balances brought forward. The S&N acquired businesses have been included for 8 months in the year ended 31 December 2008. The contribution to revenue amounted to EUR2,159 million and results from operating activities and share of profit of associates and joint ventures amounted to EUR62 million, excluding the impact of exceptional restructuring costs and impairments – relating to the UK pub portfolio and the India investment– recognised in the 8-month period of EUR389 million. Amortisation of brands and customer relationships included amounted to EUR49 million. Should the S&N acquired businesses have been included as from 1 January 2008, management estimates that the pro-forma contribution to revenue would have amounted to EUR3,063 million and pro-forma results from operating activities and share of profit of associates and joint ventures amounted to EUR14 million, excluding the impact of exceptional restructuring costs and impairments – relating to the UK pub portfolio and the India investment. Amortisation of brands and customer relationships included, amounted to EUR73 million. This pro-forma information does not purport to represent what Heineken’s actual results would have been had the acquisition actually occurred on 1 January 2008, nor are they necessarily indicative of future results of operations. In determining the contributions, management has assumed that the fair value adjustments that arose on the date of the acquisitions would have been the same if the acquisitions had occurred on 1 January 2008.

www.heinekeninternational.com Tweede Weteringplantsoen 5 - 1017 ZD Amsterdam, The Netherlands Registered Office at Amsterdam, Trade Register Amsterdam No.. 33078624
41
Appendix 8 continued
Eichhof acquisition On 29 August 2008 Heineken acquired 96.54 percent of the voting rights of the beverage division of Eichhof Holding AG in Lucerne, Switzerland. After the completion of the tender offer a squeeze-out procedure was started. As at balance sheet date Heineken owned 100 percent. The consideration paid amounted to EUR192 million and with a net cash outflow of EUR190 million. The Eichhof acquisition had the following effect on Heineken’s assets and liabilities on acquisition date: In millions of euro Pre-acquisition
carrying amounts
Fair value adjustments
Recognised values on
acquisition date Property, plant & equipment 37 16 53Intangible assets 2 36 38Other investments 20 - 20Inventories 14 1 15Trade and other receivables, prepayments and accrued income 20 - 20Cash and cash equivalents 2 - 2Employee benefits - (19) (19)Deferred tax liabilities (7) (3) (10)Provisions - (3) (3)Current liabilities (42) (1) (43)Net identifiable assets and liabilities 46 27 73Goodwill on acquisition 119Consideration paid 192Net cash and cash equivalents acquired (2)Net cash outflow 190 The fair values of assets and liabilities acquired have been determined on a provisional basis and will be completed in 2009. The Eichhof acquired entities have been fully integrated in Heineken Switzerland. Goodwill on the acquisition of Eichhof has been allocated to the Western European region for the purpose of impairment testing in line with the operational responsibility. Goodwill in Western Europe is monitored on a regional level. Synergies in the Western European market are expected to be achieved as result of a stronger presence in Western Europe enabling Heineken to secure its position and to grow its market share through appropriate commercial investments. Cost synergies are expected through more efficient central purchasing, sourcing and selling in respect of both the Eichhof and Heineken brands.

www.heinekeninternational.com Tweede Weteringplantsoen 5 - 1017 ZD Amsterdam, The Netherlands Registered Office at Amsterdam, Trade Register Amsterdam No.. 33078624
42
Appendix 8 continued
Eichhof acquisition - continued The contribution to revenue amounted to EUR44 million and to results from operating activities EUR-7 million, due to significant restructuring costs. If the acquisition had occurred on 1 January 2008, management estimates that revenue would have been EUR86 million higher and results from operating activities would have been EUR16 million higher. This pro-forma information does not purport to represent what Heineken’s actual results would have been had the acquisition actually occurred on 1 January 2008, nor are they necessarily indicative of future results of operations. In determining the contributions, management has assumed that the fair value adjustments that arose on the date of the acquisitions would have been the same if the acquisitions had occurred on 1 January 2008.
Other acquisitions and disposals In addition to the acquisition of S&N and Eichhof, other acquisitions and disposals occurred during 2008. In Serbia, Romania, Belarus, Czech Republic, Sierra Leone and Algeria breweries, and in Tunisia a soft drinks company were acquired. The following acquisition dates and percentages of voting rights apply to these other acquisitions:
Entity acquired Country of
incorporation Acquisition date% of voting rights as
per balance sheetOJSC ,Rechitsapivo’ Belarus 1 July 2008 80.8*Drinks Union a.s. Czech Republic 1 July 2008 98.5United Serbian Breweries EUC LLC Serbia 12 February 2008 72Central Europe Beverages B.V. The Netherlands 22 August 2008 72Bere Mures S.A. Romania 8 April 2008 100Sierra Leone Brewery Ltd. Sierra Leone 23 June 2008 83.1Tango s.a.r.l. Algeria 14 January 2008 100Société Nouvelle des Boissons Gazeuses S.A. (‘SNBG’) Tunisia 28 February 2008 49* Excluding treasury shares (will be cancelled in the course of 2009). With respect to these other acquisitions and disposals the following applies: The aggregate consideration paid amounts to EUR548 million. United Serbian Breweries EUC LLC (previously known as Brauerei MB) was acquired at
12 February 2008. On 22 August 2008, Heineken contributed United Serbian Breweries EUC LLC into Central Europe Beverages B.V., a company previously owned by Efes Breweries International, effectively gaining control over Central Europe Beverages B.V.
On 30 October 2008 Heineken sold its 100% subsidiary Dinal (Kazakhstan) to Efes Karaganda (a company owned by Efes Breweries International). On the same date Heineken purchased a 28 percent share in Efes Karaganda.
On 30 June 2008 Heineken sold its investment in Brasserie Saint-Omer. The shareholders agreement of SNBG provides Heineken with de facto control. As such
SNBG is classified as a subsidiary.
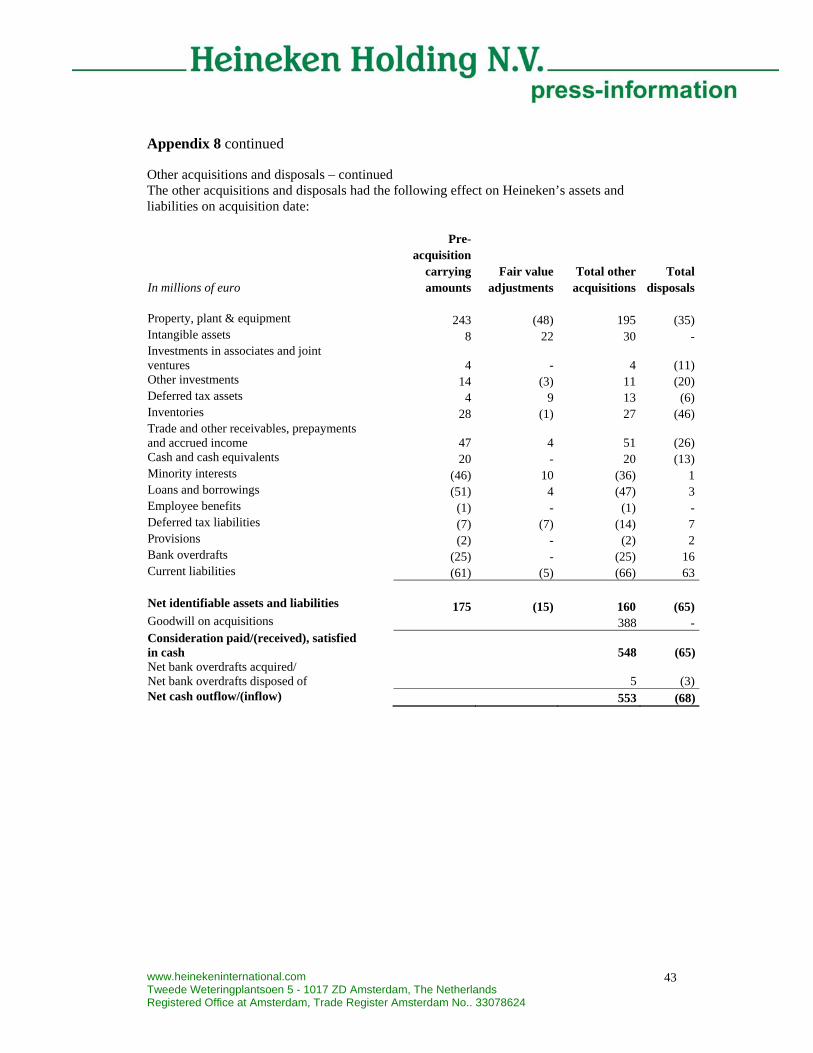
www.heinekeninternational.com Tweede Weteringplantsoen 5 - 1017 ZD Amsterdam, The Netherlands Registered Office at Amsterdam, Trade Register Amsterdam No.. 33078624
43
Appendix 8 continued Other acquisitions and disposals – continued The other acquisitions and disposals had the following effect on Heineken’s assets and liabilities on acquisition date:
In millions of euro
Pre-acquisition
carrying amounts
Fair value adjustments
Total other acquisitions
Total disposals
Property, plant & equipment 243 (48) 195 (35)Intangible assets 8 22 30 -Investments in associates and joint ventures
4 - 4 (11)
Other investments 14 (3) 11 (20)Deferred tax assets 4 9 13 (6)Inventories 28 (1) 27 (46)Trade and other receivables, prepayments and accrued income
47 4 51 (26)
Cash and cash equivalents 20 - 20 (13)Minority interests (46) 10 (36) 1Loans and borrowings (51) 4 (47) 3Employee benefits (1) - (1) -Deferred tax liabilities (7) (7) (14) 7Provisions (2) - (2) 2Bank overdrafts (25) - (25) 16Current liabilities (61) (5) (66) 63
Net identifiable assets and liabilities
175 (15) 160 (65)Goodwill on acquisitions 388 -Consideration paid/(received), satisfied in cash
548 (65)
Net bank overdrafts acquired/ Net bank overdrafts disposed of
5 (3)
Net cash outflow/(inflow) 553 (68)

www.heinekeninternational.com Tweede Weteringplantsoen 5 - 1017 ZD Amsterdam, The Netherlands Registered Office at Amsterdam, Trade Register Amsterdam No.. 33078624
44
Appendix 8 continued Other acquisitions and disposals – continued The fair values of assets and liabilities of some acquisitions have been determined on a provisional basis, and will be completed in 2009. The acquired entities in Central and Eastern Europe have been fully integrated in the Central and Eastern European region. Goodwill on these acquisitions amounting to EUR203 million has been allocated to the Central and Eastern European region for the purpose of impairment testing in line with the operational responsibility. Goodwill in Central and Eastern Europe is monitored at a regional level. Synergies in the Central and Eastern European market are expected to be achieved as result of a stronger presence in Central and Eastern Europe enabling Heineken to grow its market share through appropriate commercial investments. Cost synergies are expected through more efficient central purchasing, sourcing and selling in respect of both the newly acquired and Heineken brands. In respect of the other newly acquired entities acquired in Africa goodwill amounting to EUR185 million has been allocated to the individual Opcos. Although synergies are achieved on a regional basis these entities are less integrated in the region and therefore goodwill is monitored on an individual country basis. The total contribution of these other acquisitions to revenue amounted to EUR138 million and to results from operating activities EUR-34 million. If these acquisitions had occurred on 1 January 2008, management estimates that revenue would have been EUR38 million higher and results from operating activities would have been EUR8 million lower. This pro-forma information does not purport to represent what our actual results would have been had the acquisition actually occurred on 1 January 2008, nor are they necessarily indicative of future results of operations. In determining these amounts, management has assumed that the fair value adjustments that arose on the date of the acquisitions would have been the same if the acquisitions had occurred on 1 January 2008. Provisional accounting Krušovice and Syabar acquisition In the consolidated financial statements as at and for the year ended 31 December 2007, the fair values of assets and liabilities of the acquisition of Krušovice and Syabar were determined on a provisional basis. The purchase price adjustments for Krusovice and Syabar have been finalised without significant changes.
www.heinekeninternational.com Tweede Weteringplantsoen 5 - 1017 ZD Amsterdam, The Netherlands Registered Office at Amsterdam, Trade Register Amsterdam No.. 33078624
45
Appendix 9 Notes to the appendices Reporting entity Heineken Holding N.V. (the ‘Company’) is a company domiciled in the Netherlands. The address of the Company‘s registered office is Tweede Weteringplantsoen 5, Amsterdam. The consolidated financial statements as at and for the year ended 31 December 2008 comprise Heineken Holding N.V., Heineken N.V., its subsidiaries (together referred to as ‘Heineken’ or the ‘Group’ and individually as ‘Heineken’ entities) and Heineken’s interests in Joint Ventures (‘JVs’) and associates. The financial information included in appendix 1-9 (excluding EBIT and EBIT beia) is extracted from Heineken Holding N.V.’s consolidated financial statements 2008. These financial statements were authorised for issue on 17 February 2009. The financial statements have been audited and an unqualified auditors’ report has been issued. The annual report is yet to be approved in the annual general meeting of shareholders at 23 April 2009 and will be published on 20 March 2009. Heineken Holding N.V.’s consolidated financial statements for 2008 will be available on request from Heineken’s Corporate Relations department, P.O. Box 28, 1000 AA Amsterdam, The Netherlands or can be obtained from the website www.heinekeninternational.com. Accounting policies Except for the accounting policies mentioned below, the accounting policies applied by Heineken Holding N.V. in these appendices are the same as the policies applied in the consolidated financial statements for 2007. Applied are International Financial Reporting Standards (IFRS) adopted by the EU (i.e., only IFRS’s that are adopted for use in the EU at the date of publication). These appendices do not contain all the information required for a complete full-year set of financial statements. Accounting policy joint ventures (JVs) The group’s share of the recognised income and expenses of joint ventures are accounted for using the equity method. The equity method implicates that the interest in the jointly controlled entity is initially recorded at cost (including the amount of goodwill) in the consolidated financial statements at the date that joint control commences. The consolidated financial statements include Heineken’s share of the total recognised income and expenses of JVs on an equity-accounted basis, from the date that joint control commences until the date that joint control ceases. When Heineken’s share of losses exceeds the carrying amount of the JV, the carrying amount is reduced to nil and recognition of further losses is discontinued except to the extent that Heineken has an obligation or has made a payment on behalf of the JV. This change in accounting policy was recognised retrospectively in accordance with IAS 8 ‘Accounting Policies, Changes in Accounting Estimates and Errors’, and comparatives have been restated. The change in accounting policy had a negative impact for the year ended 31 December 2007 of EUR1,319 million on revenue and EUR139 million on results from operating activities. The share of profit of associates and joint ventures is positively impacted by EUR29 million. Total assets as at 31 December 2007 decreased by EUR1,014 million due to
www.heinekeninternational.com Tweede Weteringplantsoen 5 - 1017 ZD Amsterdam, The Netherlands Registered Office at Amsterdam, Trade Register Amsterdam No.. 33078624
46
this policy change. The restatement had no impact on equity and profit attributable to equity holders of Heineken Holding N.V.

www.heinekeninternational.com Tweede Weteringplantsoen 5 - 1017 ZD Amsterdam, The Netherlands Registered Office at Amsterdam, Trade Register Amsterdam No.. 33078624
47
Accounting policy intangible assets
Brands Following the Scottish & Newcastle (‘S&N’) acquisition, strategic brands and customer-related and contract-based intangibles have been acquired. No strategic brands and material customer-related and contract-based intangibles have been acquired in other acquisitions since the conversion to IFRS in 2004. Brands acquired, separately or as part of a business combination, are capitalised if they meet the definition of an intangible asset and the recognition criteria are satisfied. Brands acquired as part of a business combination are valued at fair value based on the royalty relief method. Brands acquired separately are measured at cost. Strategic brands are well known international/local brands with a strong market position and an established brand name. Strategic brands are amortised on an individual basis over the estimated useful life of the brand. Other brands are amortised on a portfolio basis per country. Customer-related and contract-based intangibles Customer-related and contract-based intangibles are capitalised if they meet the definition of an intangible asset and the recognition criteria are satisfied. If the amounts are not material these are included in the brand valuation. The relationship between brands and customer-related intangibles is carefully considered so that brands and customer-related intangibles are not both recognised on the basis of the same cash flows. Customer-related and contract-based intangibles acquired as part of a business combination are valued at fair value. Customer-related and contract-based intangibles acquired separately are measured at cost. Customer-related and contract-based intangibles are amortised over the period of the contractual arrangements or the remaining useful life of the customer relationships. Amortisation Intangible assets with a finite life are amortised on a straight-line basis over their estimated useful lives from the date they are available for use. The estimated useful lives are as follows: Strategic brands 40 - 50 years Other brands 15 - 25 years Customer-related and contract-based intangibles 5-30 years Software 3 years Capitalised development costs 3 years

www.heinekeninternational.com Tweede Weteringplantsoen 5 - 1017 ZD Amsterdam, The Netherlands Registered Office at Amsterdam, Trade Register Amsterdam No.. 33078624
48
Use of estimates The preparation of these appendices involves the forming of judgements by management, based on estimates and assumptions affecting the application of the accounting policies and the reported carrying amounts of assets and liabilities and amounts of income and expenses. The actual figures may differ from these estimates. In preparing these appendices, the principal judgements formed by management in applying Heineken Holding N.V.’s accounting policies and the principal sources of the estimates used were the same as the judgements and sources used in preparing the consolidated financial statements for 2007. Issued and outstanding shares The number of issued and outstanding shares as per 31 December 2007 was 245,011,848. Exceptional items In 2008 a total of EUR789 million is recognised at EBIT level as exceptional items: • Impairment of goodwill Russia EUR275 million • Impairment investments in India EUR200 million • Impairment Pub portfolios in UK EUR51 million • Restructuring costs EUR79 million • Losses on disposals and write offs related to restructurings EUR46 million • Acquisition, integration and restructuring costs of S&N acquisition EUR138 million Impairments Russia The impairment of EUR275 million in Russia is mainly caused by an increase of the WACC and the reduced expected long term growth rate due to the economic crisis. In addition it is expected that it will take longer for the Russian market to recover. Shareholdings India In March 2008, the joint venture partners of Heineken in United Breweries Limited (UBL) filed legal proceedings in India against various Scottish & Newcastle, Heineken and Carlsberg entities claiming that the rights enjoyed by Scottish & Newcastle India Private Limited (the entity through which Heineken holds its investment in UBL) in a shareholders agreement relating to UBL and the Articles of Association of UBL are personal to S&N and do not survive the takeover of S&N by Sunrise Acquisitions Limited in April 2008. Since this date, the joint venture partners and UBL itself have effectively excluded Heineken from the management of UBL and restricted the scope of the financial information previously available to Scottish & Newcastle. The latter is also applicable for our 50% share in Millenium Alcobev Private Limited (MAPL) in which UBL has also a 50% share. As Heineken only has public Indian GAAP information available, Heineken does not have sufficient information to apply equity accounting for its investments in UBL and MAPL and has used the share price of UBL as at 31 December 2008 for the purposes of impairment testing.

www.heinekeninternational.com Tweede Weteringplantsoen 5 - 1017 ZD Amsterdam, The Netherlands Registered Office at Amsterdam, Trade Register Amsterdam No.. 33078624
49
Other An amount of EUR51 million has been impaired on the pubs in the UK. A total of EUR125 million for restructuring costs have been recognised in 2008, including the loss of EUR16 million on the disposal of the investment in Brasserie Saint-Omer and related impairments. These restructuring costs are related to the Fit 2 Fight (F2F) programme. Income tax expense As from 2008, the share of profit of associates and joint ventures and the impairments thereof has been excluded from the effective tax rate calculation. The dividend income from investments and gain of sale of subsidiaries and associates have been included. The comparatives have been adjusted accordingly. The consolidated effective tax rate in respect of continuing operations for the year ended 31 December 2008 was 35.6 percent (2007: 31.0 percent). This increase in effective tax rate is mainly caused by the fact that in 2008 the tax effect relating to the EUR275 million impairment on the goodwill of Russia has been considered as non-deductible expenses, calculated on a significantly lower profit before income tax. Contingencies The Netherlands Heineken is involved in an antitrust case initiated by the European Commission for alleged violations of the EU competition laws. By decision of 18 April 2007 the European Commission stated that Heineken and other brewers operating in the Netherlands, restricted competition in the Dutch market during the period 1996-1999. This decision follows an investigation by the European Commission that commenced in March 2000. Heineken fully cooperated with the authorities in this investigation. As a result of its decision, the European Commission has imposed a fine on Heineken of EUR219 million. All cartel decisions by the European Commission may be appealed against before the European Court of First Instance and then before the Court of Justice of the European Communities in Luxembourg. These two courts are empowered to annul decisions in whole or in part and to reduce or increase fines, where this is deemed appropriate. On 4 July 2007 Heineken filed an appeal with the European Court of First Instance against the decision of the European Commission as Heineken disagrees with the findings of the European Commission. Pending appeal, Heineken was obliged to pay the fine to the European Commission. This imposed fine was treated as an expense in 2007. The European Commission filed its defense on 22 November 2007. Heineken has filed its statement of reply on 3 March 2008. The European Commission filed its reply by rejoinder on 29 May 2008. Heineken is entitled to request for oral pleadings before the court. A final decision by the European Court is expected thereafter. Carlsberg The consideration paid (purchase price) for the acquisition of S&N is subject to change as, in line with the consortium agreement, the final net debt settlement is being discussed between the consortium partners. It is not expected that these discussions will be completed before expiration of the one-year time window under IFRS 3. Any changes to the consideration paid in subsequent accounting periods will be adjusted to goodwill. Given that the outcome is not

www.heinekeninternational.com Tweede Weteringplantsoen 5 - 1017 ZD Amsterdam, The Netherlands Registered Office at Amsterdam, Trade Register Amsterdam No.. 33078624
50
virtually certain it would be impracticable to estimate of the financial effects of the net debt settlement. Subsequent events On February 9, 2009 the GBP3.85 billion S&N acquisition facility (available and drawn amount per 31 December 2008 EUR4,064 million) was restated to become a facility with two base currencies, one for GBP480 million and the other for EUR3.1 billion. Without this conversion the available amount expressed in euros could fluctuate if the EUR/GBP exchange rate would move beyond certain thresholds. As from 15 January 2009 onwards, before the facility was restated, a series of repayments was triggered of EUR100 million on the one-year tranche with an extension option to a total of two years expiring in April 2010 and a repayment of EUR325 million on the five-year tranche expiring in April 2013. These repayments were financed out of the Revolving Credit Facility of EUR2 billion of which EUR470 million was drawn per 31 December 2008. To mitigate the impact of these repayments on the headroom of the Group, Heineken has recently obtained a credit commitment of ING for a fully committed two years standby facility for EUR250 million.

www.heinekeninternational.com Tweede Weteringplantsoen 5 - 1017 ZD Amsterdam, The Netherlands Registered Office at Amsterdam, Trade Register Amsterdam No.. 33078624
51
Appendix 10 Glossary Beia Before exceptional items and amortisation of brands and customer relationships. Cash conversion ratio Free operating cash flow/Net profit (beia) before deduction of minority interests. Depletions Sales by distributors to the retail trade. Dividend payout Proposed dividend as percentage of net profit (beia). Earnings per share Basic Net profit divided by the number of issued and outstanding shares – basic – during the year. Diluted Net profit divided by the number of issued and outstanding shares – diluted – during the year EBIT Earnings before interest and taxes and net finance expenses. EBITDA Earnings before interest and taxes and net finance expenses before depreciation and amortisation. Effective tax rate Taxable profit adjusted for share of profit of associates and joint ventures, dividend income and impairments of other investments. Fit2Fight Cost saving program aimed at reducing the fixed cost base versus 2005 by EUR450 million by 2008. Fixed costs under Fit2Fight Fixed costs under Fit2Fight include personnel costs, depreciation and amortisation, repair and maintenance costs and other fixed costs. Exceptional items are excluded from these costs. Fixed costs ratio Fixed costs under Fit2Fight as a percentage of revenue.

www.heinekeninternational.com Tweede Weteringplantsoen 5 - 1017 ZD Amsterdam, The Netherlands Registered Office at Amsterdam, Trade Register Amsterdam No.. 33078624
52
Appendix 10 - continued Free operating cash flow This represents the total of cash flow from operating activities and cash flow from operational investing activities. Gearing Net debt/total equity. Heineken Heineken Holding N.V., Heineken N.V., its subsidiaries and interests in Joint Ventures (‘JVs’) and associates. Net debt Non-current and current interest-bearing loans and borrowings and bank overdrafts less investments held for trading and cash. Net profit Profit after deduction of minority interests (profit attributable to equity holders of Heineken Holding N.V.). Organic growth Growth excluding the effect of foreign exchange rate movements, consolidation changes, exceptional items, amortisation of brands and customer relationships and changes in accounting policies. Organic volume growth Increase in consolidated volume, excluding the effect of the first time consolidation of acquisitions. Profit Total profit of the Group before deduction of minority interests. ® All brand names mentioned in this report, including those brand names not marked by an ®, represent registered trade marks and are legally protected. Region A region is defined as Heineken’s managerial classification of countries into geographical units. Revenue Net realised sales proceeds in euros. S&N Scottish and Newcastle plc allocated businesses.

www.heinekeninternational.com Tweede Weteringplantsoen 5 - 1017 ZD Amsterdam, The Netherlands Registered Office at Amsterdam, Trade Register Amsterdam No.. 33078624
53
Appendix 10 - continued Top-line growth Growth in net revenue. Volume Amstel® volume The group beer volume of the Amstel brand. Consolidated beer volume 100 percent of beer volume produced and sold by fully consolidated companies. Group beer volume The part of the total Group volume that relates to beer. Heineken® volume The Group beer volume of the Heineken brand. Heineken® volume in premium segment The Group beer volume of the Heineken brand in the premium segment (Heineken volume in the Netherlands is excluded). Total beer volume The Group beer volume in a country. Total group volume 100 percent of beer, soft drinks and other beverages volume produced and sold by fully consolidated companies and joint-venture companies as well as the volume of Heineken’s brands produced and sold under licence by third parties.

www.heinekeninternational.com Tweede Weteringplantsoen 5 - 1017 ZD Amsterdam, The Netherlands Registered Office at Amsterdam, Trade Register Amsterdam No.. 33078624
54
Disclaimer This press release contains forward-looking statements with regard to the financial position and results of Heineken’s activities. These forward-looking statements are subject to risks and uncertainties that could cause actual results to differ materially from those expressed in the forward-looking statements. Many of these risks and uncertainties relate to factors that are beyond Heineken’s ability to control or estimate precisely, such as future market and economic conditions, the behaviour of other market participants, changes in consumer preferences, the ability to successfully integrate acquired businesses and achieve anticipated synergies, costs of raw materials, interest-rate and exchange-rate fluctuations, changes in tax rates, changes in law, pension costs, the actions of government regulators and weather conditions. These and other risk factors are detailed in Heineken’s publicly filed annual reports. You are cautioned not to place undue reliance on these forward-looking statements, which are only relevant as of the date of this press release. Heineken does not undertake any obligation to publicly release any revisions to these forward-looking statements to reflect events or circumstances after the date of these statements. Market share estimates contained in this press release are based on outside sources, such as specialised research institutes, in combination with management estimates.