heineken n.v. reports 2016 full year results - …€¦ · heineken n.v. reports 2016 full year...
TRANSCRIPT

Heineken N.V. reports 2016 full year results
Amsterdam, 15 February 2017 – Heineken N.V. (EURONEXT: HEIA; OTCQX: HEINY) todayannounces:
▪ Organic revenue +4.8% with revenue per hectolitre up 2.2%1 ▪ Consolidated beer volume +3.0% with growth in Americas, Asia Pacific and Europe
offsetting weaker volume in Africa, Middle East & Eastern Europe▪ Heineken® volume in premium segment +3.7%▪ Operating profit (beia) +9.9% organically and operating margin +54bps1
▪ Net profit (beia) of €2,098 million, up 8.5% organically▪ Diluted EPS (beia) of €3.68 (2015: €3.57) up 2.9%▪ Proposed 2016 total dividend up 3.1% at €1.34 per share (2015: €1.30)
MEDIA RELEASE
P.O. Box 28 – 1000 AA Amsterdam – The Netherlands Office address - Tweede Weteringplantsoen 21 – 1017 ZD Amsterdam Heineken N.V. - Registered Office at Amsterdam – Trade Register Amsterdam No. 33011433
Page 1 of 26
CEO STATEMENTJean-François van Boxmeer, CEO, Chairman of the Executive Board, commented:“We delivered strong results in 2016, with clear outperformance of our premium brandportfolio led by Heineken®, and sustained momentum from our innovation agenda. Ourunique diversified footprint was again a competitive advantage, enabling us to deliver morethan 50 basis points margin expansion, despite more challenging economic conditions insome developing markets and significant currency pressures. Performance in keyEuropean markets was good and results in Vietnam and Mexico were strong. In Africa, MiddleEast & Eastern Europe market conditions remained tough, most notably in Nigeria, DRC andRussia. Excluding major unforeseen macro economic and political developments as well asthe impact of the proposed acquisitions in Brazil and in the UK, we expect continued marginexpansion in 2017 in line with our previous guidance.”
FINANCIAL SUMMARY
Key financials1,2
(in mhl or € million unless otherwise stated)FY16 FY15 Total
growth%
Organicgrowth
%
Revenue 20,792 20,511 1.4 4.8
Revenue/hl (in €) 91 95 -3.9 2.2
Operating profit (beia) 3,540 3,381 4.7 9.9
Operating profit (beia) margin 17.0% 16.5% 54 bps
Net profit (beia) 2,098 2,048 2.5 8.5
Net profit 1,540 1,892 -18.6
Diluted EPS (beia) (in €) 3.68 3.57 2.9
Free operating cash flow 1,773 1,692 4.8
Net debt/ EBITDA (beia)3 (x) 2.3 2.41 Excluding an accounting adjustment in the UK in 2H16 with no impact on operating profit, HEINEKEN organic revenue growthwould have been +4.4%, organic revenue per hl +1.7% and operating margin (beia) +61bps. For the impact on Europe please referto page 11. 2 Consolidated figures are used throughout this report, unless otherwise stated; please refer to the Glossary section for anexplanation of non-GAAP measures and other terms used throughout this report.3 Includes acquisitions and excludes disposals on a 12 month pro-forma basis.

FULL YEAR 2017 OUTLOOK STATEMENT
▪ Economic conditions are expected to remain volatile and we have assumed a negativeimpact from currency comparable to 2016.
▪ We expect further organic revenue and profit growth. ▪ Excluding major unforeseen macro economic and political developments as well as the
impact of the proposed acquisitions in Brazil and in the UK, we expect continuedmargin expansion in 2017 in line with the medium term margin guidance of a year onyear improvement in operating profit (beia) margin of around 40bps.
▪ We expect an average interest rate broadly in line with 2016 (2016: 3.1%), and aneffective tax rate (beia) also broadly in line with 2016 (2016: 28.3%).
▪ Capital expenditure related to property, plant and equipment should be slightly below€2 billion (2016: €1.8 billion).
MEDIA RELEASE
P.O. Box 28 – 1000 AA Amsterdam – The Netherlands Office address - Tweede Weteringplantsoen 21 – 1017 ZD Amsterdam Heineken N.V. - Registered Office at Amsterdam – Trade Register Amsterdam No. 33011433
Page 2 of 26
OPERATIONAL REVIEWAfter a strong first half and in line with our guidance, operating profit (beia) growth slowed inthe second half reflecting tougher comparatives, increased currency headwinds as well asfurther challenging economic conditions in some developing markets. In the full year, strongperformance in Americas, Europe and Asia Pacific more than offset weaker performance inAfrica, Middle East & Eastern Europe where both the difficult economic backdrop and currencypressure adversely impacted results. Revenue per hectolitre improved organically, with apositive contribution from both price and mix.
HEINEKEN continues to invest in key developing markets and in 2016 entered new countriesincluding Ivory Coast and the Philippines, and expanded production capacity in China,Vietnam, Ethiopia and Cambodia.
Revenue increased 4.8% organically, with a 2.6% increase in total volume and a 2.2% increasein revenue per hectolitre. In 2016 the underlying price mix impact was 1.7%. In the secondhalf revenue increased 5.0% (1H16: 4.7%), with volume growth of 1.5% (1H16: 3.8%), revenueper hectolitre up 3.4% (1H16: 0.8%) and underlying price mix impact of 2.6%.
Consolidated beer volumes(in mhl)
4Q16 Organicgrowth
%
FY16 Organicgrowth
%
Heineken N.V. 49.1 2.2 200.1 3.0
Africa, Middle East & Eastern Europe 10.0 0.6 38.4 -1.3
Americas 15.6 2.8 58.7 3.7
Asia Pacific 6.8 17.8 24.4 17.9
Europe 16.7 -2.5 78.6 0.7
Consolidated beer volume grew 3.0% organically in 2016, with 4.1% growth in the first halfand 2.1% growth in the second half. Beer volume in the fourth quarter was up 2.2%, much inline with 2% volume growth seen in the third quarter.

Heineken® volume (in mhl)
4Q16 Organic growth
%
FY16 Organic growth
%
Heineken® volume in premium segment 8.0 5.9 31.7 3.7
Africa, Middle East & Eastern Europe 1.3 9.9 4.7 1.3
Americas 2.7 8.7 9.8 4.3
Asia Pacific 1.7 1.2 6.6 3.4
Europe 2.3 4.0 10.6 4.3
Heineken® volume in the premium segment grew 3.7%, with positive volume performanceacross all regions. Volume grew double digit in Brazil, South Africa, Mexico, the UK andRomania. Brand growth was also strong in France, China, Italy, Spain and Taiwan. Theseresults more than offset weaker volume in Russia, the US, Thailand and Greece. Heineken®continued to benefit from global platforms including UEFA Champions League, the Cities,Product Stories and Music campaigns. In September 2016 HEINEKEN started a new globalpartnership with Formula 1® which will allow us to reach new consumers. Additionally newinnovations included the 'wild lager' beers H41 and H71, launched in a selected number ofEuropean markets. Heineken® Light was launched in Ireland and New Zealand, piloted inGreece and Switzerland and introduced in Australia as Heineken® 3.
The international brand portfolio, which includes brands complementary to Heineken® andwith high potential to travel across geographies, outperformed. Volume was up double digitfor Affligem, Sol Premium, Lagunitas, Red Stripe, Tecate and Tiger brands. Desperadosand Krušovice volume grew high single digit and Amstel mid single digit.
Cider volume increased mid single digit, with double digit volume growth in the first half andsingle digit volume growth in the second half. Strongbow, our international cider brandcontinued to outperform. In the UK, the home base of cider, we continued to gain marketshare driven by the ongoing success of Strongbow Dark Fruit, Strongbow Cloudy Apple andOld Mout. Outside the UK, cider delivered double digit volume growth. During the year weintroduced Orchard Thieves in five markets. In Ireland Orchard Thieves continued tooutperform the market. In Romania, Czech Republic and Poland there was also good volumegrowth. In Africa, Middle East & Eastern Europe, South Africa and Russia saw positive ciderperformance. Mexico was the main contributor to cider growth in the Americas. In AsiaPacific, Strongbow which is now available in five markets, showed encouraging early signs.
Innovation continued to positively contribute to results, generating €2.2 billion in revenuewith an implied innovation rate of 10.6% (2015: 9.2%). There were a number of launches in2016 in low and no alcohol, with Amstel 0.0% and Cruzcampo 0.0% in Spain, Żywiec alcoholfree in Poland and Bintang 0.0% Maxx in Indonesia. In craft and variety Mort Subite, BirraMoretti Regionali, and Żywiec variants all continued to excite the consumers and drivevolume.
Operating profit (beia) grew 9.9% organically, primarily reflecting higher revenue and costefficiencies.
MEDIA RELEASE
P.O. Box 28 – 1000 AA Amsterdam – The Netherlands Office address - Tweede Weteringplantsoen 21 – 1017 ZD Amsterdam Heineken N.V. - Registered Office at Amsterdam – Trade Register Amsterdam No. 33011433
Page 3 of 26
SUSTAINABILITYWe believe business growth and sustainability go hand in hand. This is why our sustainabilityagenda, Brewing a Better World, is embedded in our business strategy. In 2016 HEINEKENcontinued to make significant progress. Highlights included decreasing our waterconsumption to 3.6 hl/hl from 3.7 hl/hl in the previous year resulting in 28% decline since2008, the baseline year for our 2020 commitments. For breweries in water scarce areas wehave already reached our 2020 target of 3.3 hl/hl. We also reduced our CO² emissions to 6.5kg CO²e/hl down from 6.7 kg CO²e/hl in 2015 (representing a 37% decline since 2008). Wecontinued to advocate responsible consumption by investing in our ‘When you drive, neverdrink’ campaign through the new Formula 1® global platform, and the‘Moderate DrinkersWanted’ campaign. Our safety performance also improved significantly. HEINEKEN will publishits first combined financial and sustainability annual report on 22 February 2017.
MEDIA RELEASE
P.O. Box 28 – 1000 AA Amsterdam – The Netherlands Office address - Tweede Weteringplantsoen 21 – 1017 ZD Amsterdam Heineken N.V. - Registered Office at Amsterdam – Trade Register Amsterdam No. 33011433
Page 4 of 26
NET PROFITNet profit (beia) increased 8.5% organically to €2,098 million.
Exceptionals included an asset impairment in the Democratic Republic of Congo (DRC) of€286 million, with €233 million in the first half and an additional €53 million in the secondhalf of the year.
Net profit after exceptionals was €1,540 million (2015: €1,892 million). In 2015 net profitincluded an exceptional gain of €379 million from the sale of EMPAQUE in Mexico.
TOTAL DIVIDEND FOR 2016The Heineken N.V. dividend policy is to pay out a ratio of 30% to 40% of full year net profit(beia). For 2016, payment of a total cash dividend of €1.34 per share (2015: €1.30) will beproposed to the Annual General Meeting. This implies a 36% payout ratio, in line with thepayout ratio in 2015. If approved, a final dividend of €0.82 per share will be paid on 3 May2017, as an interim dividend of €0.52 per share was paid on 11 August 2016. The paymentwill be subject to a 15% Dutch withholding tax. The ex-final dividend date for Heineken N.V.shares will be 24 April 2017.
TRANSLATIONAL CURRENCY CALCULATED IMPACT FOR 2017Using spot rates as at 9 February 2017 for the remainder of this year, the calculated negativecurrency translational impact would be approximately €75 million at consolidated operatingprofit (beia), and €30 million at net profit (beia). Foreign exchange markets remain veryvolatile.
ACQUISITION OF BRASIL KIRIN HOLDING S.A. On 13 February 2017 HEINEKEN announced that it had entered into an agreement with KirinHoldings Company, Limited (“Kirin”) to acquire Brasil Kirin Holding S.A. (“Brasil Kirin”), one ofthe largest beer and soft drinks producers in Brazil. The transaction will transformHEINEKEN’s existing business across the country by extending its footprint, increasing scaleand further strengthening its brand portfolio. On closing, HEINEKEN will become the secondlargest beer company in Brazil, with a stronger commercial platform from which to capturefuture profitable growth in an exciting beer market. Further details can be found in theHEINEKEN N.V. release dated 13 February 2017.

PROPOSED ACQUISITION OF PUNCHOn 15 December 2016 HEINEKEN announced that following Vine Acquisitions Limited’sannouncement of a recommended cash offer for Punch Taverns plc, HEINEKEN throughHEINEKEN UK had agreed a back-to-back deal with Vine Acquisitions to acquire PunchSecuritisation A (‘Punch A’), comprising approximately 1,900 pubs across the UK. On 10 February 2017 Punch Shareholders voted in favour of the Scheme at the Court Meetingand that the special resolution proposed at the General Meeting was passed. The Acquisition remains subject to the satisfaction or (where capable of being waived) waiverof the other Conditions set out in the Scheme Document, including the Court sanctioning theScheme at the Court Hearing. Subject to being approved by the relevant regulatoryauthorities, the Acquisition is expected to become effective by the end of the first half of2017. Further detail can be found in the HEINEKEN N.V. release dated 15 December 2016.
MEDIA RELEASE
P.O. Box 28 – 1000 AA Amsterdam – The Netherlands Office address - Tweede Weteringplantsoen 21 – 1017 ZD Amsterdam Heineken N.V. - Registered Office at Amsterdam – Trade Register Amsterdam No. 33011433
Page 5 of 26
SUPERVISORY BOARD COMPOSITIONMessrs. Maarten Das, Christophe Navarre and Henk Scheffers will resign by rotation from theSupervisory Board at the Annual General Meeting (AGM) on 20 April 2017. Messrs. Das andNavarre are eligible for re-appointment for a period of four years and a non-bindingnomination for their re-appointment will be submitted to the AGM. Mr. Scheffers hasinformed the Supervisory Board that he will not seek a further term as member of theSupervisory Board. The Supervisory Board is grateful for Mr. Scheffers' commitment over thepast four years and for his contributions to the Supervisory Board and as Chairman of theAudit Committee.
ENQUIRIES
Media InvestorsJohn Clarke Sonya Ghobrial
Director of Global Communication Director of Investor RelationsMichael Fuchs Marc Kanter / Gabriela Malczynska
Financial Communications Manager Investor Relations Manager / Senior AnalystE-mail: [email protected] E-mail: [email protected] Tel: +31-20-5239355 Tel: +31-20-5239590
INVESTOR CALENDAR HEINEKEN N.V.
Trading Update for Q1 2017 19 April 2017Annual General Meeting 20 April 2017Half Year 2017 Results 31 July 2017Trading Update for Q3 2017 25 October 2017

Conference call detailsHEINEKEN will host an analyst and investor conference call in relation to its 2016 FY resultstoday at 10:00 CET/ 9:00 GMT. The call will be audio cast live via the company’s website:www.theheinekencompany.com/investors/webcasts. An audio replay service will also bemade available after the conference call at the above web address. Analysts and investors candial-in using the following telephone numbers:
Netherlands United KingdomLocal line: +31(0)20 716 8257 Local line: +44(0)20 3427 1902National free phone: 0800 020 2577 National free phone: 0800 279 5004
United States of AmericaLocal line: +1646 254 3364National free phone: 1877 280 2342
Participation/ confirmation code for all countries: 3570680
MEDIA RELEASE
P.O. Box 28 – 1000 AA Amsterdam – The Netherlands Office address - Tweede Weteringplantsoen 21 – 1017 ZD Amsterdam Heineken N.V. - Registered Office at Amsterdam – Trade Register Amsterdam No. 33011433
Page 6 of 26
Editorial information:HEINEKEN is the world’s most international brewer. It is the leading developer and marketer of premium beer and ciderbrands. Led by the Heineken® brand, the Group has a powerful portfolio of more than 250 international, regional, local andspecialty beers and ciders. We are committed to innovation, long-term brand investment, disciplined sales execution andfocused cost management. Through “Brewing a Better World”, sustainability is embedded in the business and delivers valuefor all stakeholders. HEINEKEN has a well-balanced geographic footprint with leadership positions in both developed anddeveloping markets. We employ over 73,000 employees and operate more than 165 breweries, malteries, cider plants andother production facilities in more than 70 countries. Heineken N.V. and Heineken Holding N.V. shares trade on theEuronext in Amsterdam. Prices for the ordinary shares may be accessed on Bloomberg under the symbols HEIA NA andHEIO NA and on Reuters under HEIN.AS and HEIO.AS. HEINEKEN has two sponsored level 1 American Depositary Receipt(ADR) programmes: Heineken N.V. (OTCQX: HEINY) and Heineken Holding N.V. (OTCQX: HKHHY). Most recent informationis available on HEINEKEN's website: www.theHEINEKENcompany.com and follow us on Twitter via @HEINEKENCorp.
Market Abuse RegulationThis press release contains inside information within the meaning of Article 7(1) of the EU Market Abuse Regulation.
Disclaimer: This press release contains forward-looking statements with regard to the financial position and results of HEINEKEN’sactivities. These forward-looking statements are subject to risks and uncertainties that could cause actual results to differmaterially from those expressed in the forward-looking statements. Many of these risks and uncertainties relate to factorsthat are beyond HEINEKEN’s ability to control or estimate precisely, such as future market and economic conditions, thebehaviour of other market participants, changes in consumer preferences, the ability to successfully integrate acquiredbusinesses and achieve anticipated synergies, costs of raw materials, interest-rate and exchange-rate fluctuations,changes in tax rates, changes in law, change in pension costs, the actions of government regulators and weatherconditions. These and other risk factors are detailed in HEINEKEN’s publicly filed annual reports. You are cautioned not toplace undue reliance on these forward-looking statements, which speak only of the date of this press release. HEINEKENdoes not undertake any obligation to update these forward-looking statements contained in this press release. Marketshare estimates contained in this press release are based on outside sources, such as specialised research institutes, incombination with management estimates.

REGIONAL OVERVIEW
Revenue(in € million)
FY16 FY15 Organicgrowth
%
Heineken N.V. 20,792 20,511 4.8
Africa, Middle East & Eastern Europe 3,203 3,263 3.5
Americas 5,203 5,159 6.9
Asia Pacific 2,894 2,483 13.1
Europe 10,112 10,227 1.9
Head Office & Eliminations -620 -621 n.a.
Operating Profit (beia)(in € million)
FY16 FY15 Organicgrowth
%
Heineken N.V. 3,540 3,381 9.9
Africa, Middle East & Eastern Europe 376 579 -21.2
Americas 1,021 904 23.5
Asia Pacific 927 702 26.5
Europe 1,261 1,196 7.1
Head Office & Eliminations -45 0 n.a.
Developing markets FY16
(in mhl or € million unless otherwise stated) Group beervolume
Group revenue
Group operating profit (beia)1
Developing markets in: 143.2 11,730 2,246
Africa, Middle East & Eastern Europe 39.8
Latin America & the Caribbean 52.1
Asia Pacific 26.7
Europe 24.6
% of Group 66% 51% 59%1 Excludes Head Office & Eliminations
MEDIA RELEASE
P.O. Box 28 – 1000 AA Amsterdam – The Netherlands Office address - Tweede Weteringplantsoen 21 – 1017 ZD Amsterdam Heineken N.V. - Registered Office at Amsterdam – Trade Register Amsterdam No. 33011433
Page 7 of 26
Africa, Middle East & Eastern Europe
Key Financials(in mhl or € million unless otherwise stated)
FY16 FY15 Totalgrowth
%
Organicgrowth
%
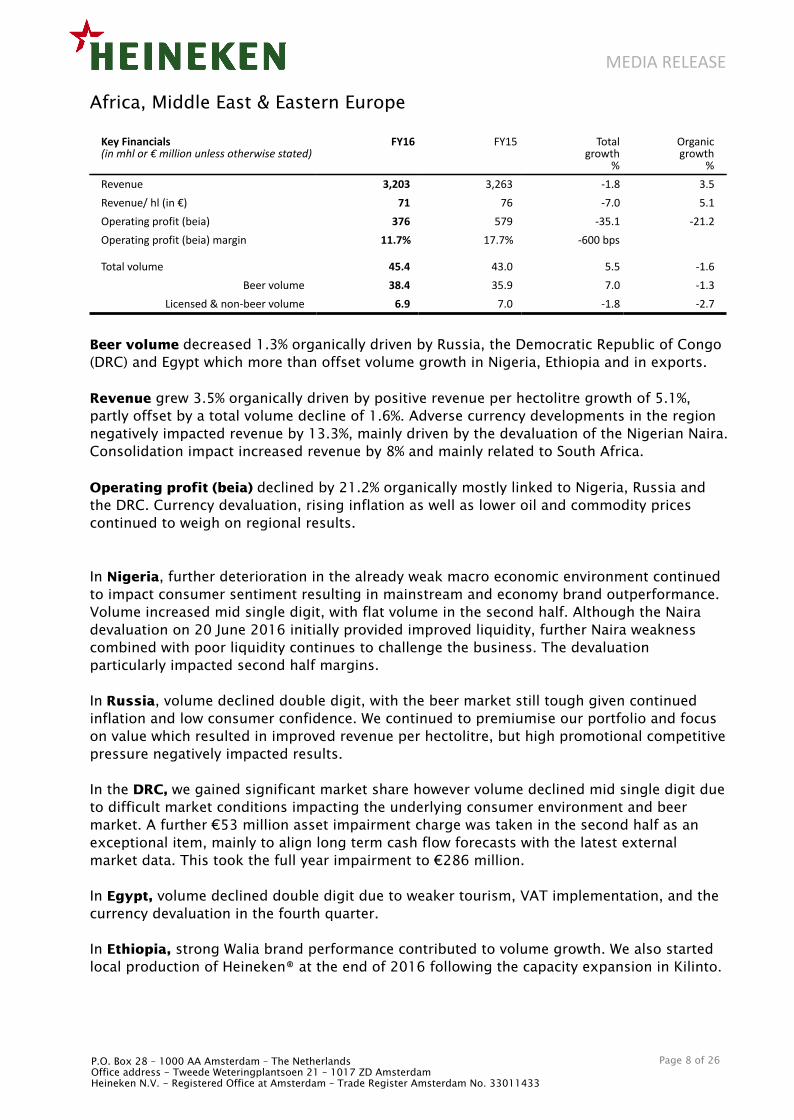
Revenue 3,203 3,263 -1.8 3.5
Revenue/ hl (in €) 71 76 -7.0 5.1
Operating profit (beia) 376 579 -35.1 -21.2
Operating profit (beia) margin 11.7% 17.7% -600 bps
Total volume 45.4 43.0 5.5 -1.6
Beer volume 38.4 35.9 7.0 -1.3
Licensed & non-beer volume 6.9 7.0 -1.8 -2.7
Beer volume decreased 1.3% organically driven by Russia, the Democratic Republic of Congo(DRC) and Egypt which more than offset volume growth in Nigeria, Ethiopia and in exports.
Revenue grew 3.5% organically driven by positive revenue per hectolitre growth of 5.1%,partly offset by a total volume decline of 1.6%. Adverse currency developments in the regionnegatively impacted revenue by 13.3%, mainly driven by the devaluation of the Nigerian Naira.Consolidation impact increased revenue by 8% and mainly related to South Africa.
Operating profit (beia) declined by 21.2% organically mostly linked to Nigeria, Russia andthe DRC. Currency devaluation, rising inflation as well as lower oil and commodity pricescontinued to weigh on regional results.
In Nigeria, further deterioration in the already weak macro economic environment continuedto impact consumer sentiment resulting in mainstream and economy brand outperformance.Volume increased mid single digit, with flat volume in the second half. Although the Nairadevaluation on 20 June 2016 initially provided improved liquidity, further Naira weaknesscombined with poor liquidity continues to challenge the business. The devaluationparticularly impacted second half margins.
In Russia, volume declined double digit, with the beer market still tough given continuedinflation and low consumer confidence. We continued to premiumise our portfolio and focuson value which resulted in improved revenue per hectolitre, but high promotional competitivepressure negatively impacted results.
In the DRC, we gained significant market share however volume declined mid single digit dueto difficult market conditions impacting the underlying consumer environment and beermarket. A further €53 million asset impairment charge was taken in the second half as anexceptional item, mainly to align long term cash flow forecasts with the latest externalmarket data. This took the full year impairment to €286 million.
In Egypt, volume declined double digit due to weaker tourism, VAT implementation, and thecurrency devaluation in the fourth quarter.
In Ethiopia, strong Walia brand performance contributed to volume growth. We also startedlocal production of Heineken® at the end of 2016 following the capacity expansion in Kilinto.
MEDIA RELEASE
P.O. Box 28 – 1000 AA Amsterdam – The Netherlands Office address - Tweede Weteringplantsoen 21 – 1017 ZD Amsterdam Heineken N.V. - Registered Office at Amsterdam – Trade Register Amsterdam No. 33011433
Page 8 of 26
Americas
Key Financials(in mhl or € million unless otherwise stated)
FY16 FY15 Totalgrowth
%
Organicgrowth
%
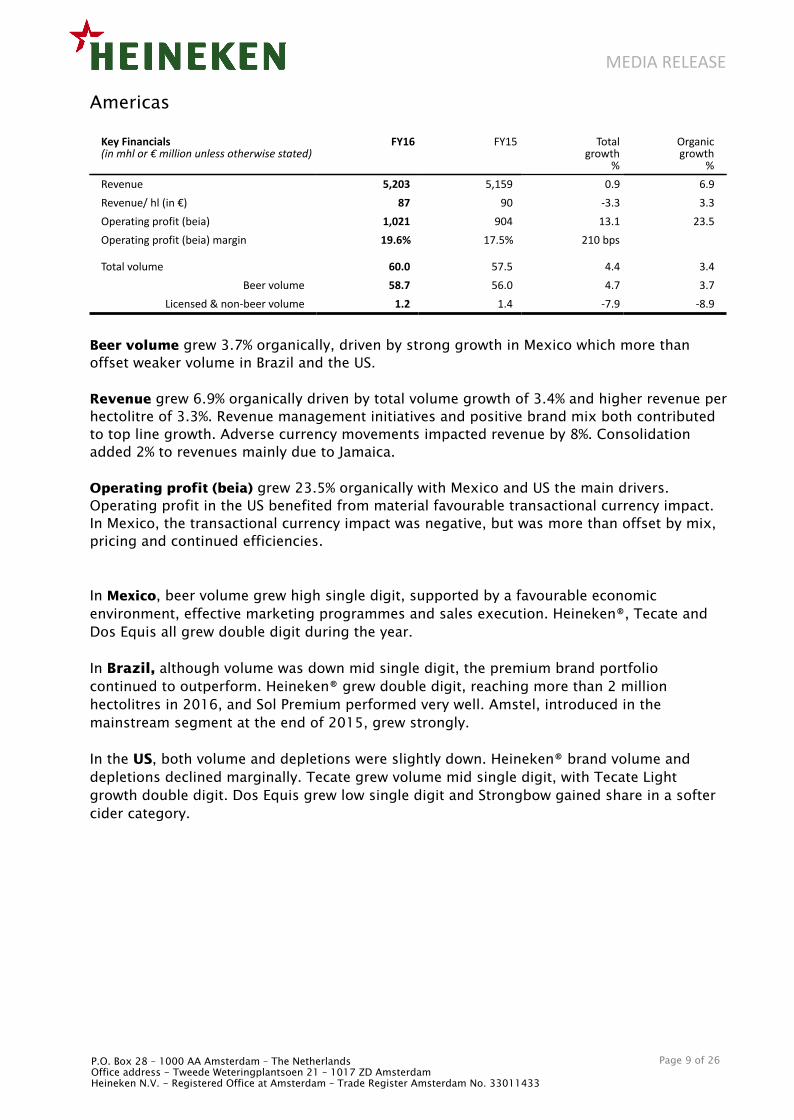
Revenue 5,203 5,159 0.9 6.9
Revenue/ hl (in €) 87 90 -3.3 3.3
Operating profit (beia) 1,021 904 13.1 23.5
Operating profit (beia) margin 19.6% 17.5% 210 bps
Total volume 60.0 57.5 4.4 3.4
Beer volume 58.7 56.0 4.7 3.7
Licensed & non-beer volume 1.2 1.4 -7.9 -8.9
Beer volume grew 3.7% organically, driven by strong growth in Mexico which more thanoffset weaker volume in Brazil and the US.
Revenue grew 6.9% organically driven by total volume growth of 3.4% and higher revenue perhectolitre of 3.3%. Revenue management initiatives and positive brand mix both contributedto top line growth. Adverse currency movements impacted revenue by 8%. Consolidationadded 2% to revenues mainly due to Jamaica.
Operating profit (beia) grew 23.5% organically with Mexico and US the main drivers.Operating profit in the US benefited from material favourable transactional currency impact.In Mexico, the transactional currency impact was negative, but was more than offset by mix,pricing and continued efficiencies.
In Mexico, beer volume grew high single digit, supported by a favourable economicenvironment, effective marketing programmes and sales execution. Heineken®, Tecate andDos Equis all grew double digit during the year.
In Brazil, although volume was down mid single digit, the premium brand portfoliocontinued to outperform. Heineken® grew double digit, reaching more than 2 millionhectolitres in 2016, and Sol Premium performed very well. Amstel, introduced in themainstream segment at the end of 2015, grew strongly.
In the US, both volume and depletions were slightly down. Heineken® brand volume anddepletions declined marginally. Tecate grew volume mid single digit, with Tecate Lightgrowth double digit. Dos Equis grew low single digit and Strongbow gained share in a softercider category.
MEDIA RELEASE
P.O. Box 28 – 1000 AA Amsterdam – The Netherlands Office address - Tweede Weteringplantsoen 21 – 1017 ZD Amsterdam Heineken N.V. - Registered Office at Amsterdam – Trade Register Amsterdam No. 33011433
Page 9 of 26

Asia Pacific
Key Financials(in mhl or € million unless otherwise stated)
FY16 FY15 Totalgrowth
%
Organicgrowth
%
Revenue 2,894 2,483 16.5 13.1
Revenue/ hl (in €) 116 122 -4.9 -3.7
Operating profit (beia) 927 702 32.1 26.5
Operating profit (beia) margin 32.0% 28.3% 370 bps
Total volume 24.9 20.3 22.5 17.5
Beer volume 24.4 19.8 23.1 17.9
Licensed & non-beer volume 0.4 0.4 -2.5 3.0
Beer volume grew 17.9% organically, with double digit volume growth in Vietnam, Cambodia,and Indonesia.
Revenue grew 13.1% organically, with total volume up 17.5% and revenue per hectolitre down3.7%, as a result of negative country mix. Underlying price mix for the region was virtuallyflat.
Operating profit (beia) increased 26.5% organically driven by strong growth in Vietnam,Cambodia and Indonesia.
In Vietnam, beer volume grew double digit reflecting strong growth of Tiger in the affordablepremium segment. Portfolio strategy, effective marketing and sales execution resulted incontinued market share gain. The brewery acquired in July in the South of Vietnam (Vũng Tàu)provided increased capacity.
In China, volume was up low single digit led by strong Heineken® performance. Volumedevelopment was slightly down in the second half.
In Indonesia, volume continued to increase led by strong growth of the low and non alcoholicportfolio, and successful innovations.
In Cambodia, volume grew double digit benefiting from successful portfolio strategy roll outas well as the capacity extension earlier this year. This strong performance resulted in furthermarket share gains.
MEDIA RELEASE
P.O. Box 28 – 1000 AA Amsterdam – The Netherlands Office address - Tweede Weteringplantsoen 21 – 1017 ZD Amsterdam Heineken N.V. - Registered Office at Amsterdam – Trade Register Amsterdam No. 33011433
Page 10 of 26

Europe
Key Financials(in mhl or € million unless otherwise stated)
FY16 FY15 Totalgrowth
%
Organic growth
%
Revenue 10,112 10,227 -1.1 1.91
Revenue/ hl (in €) 97 100 -3.3 1.41
Operating profit (beia) 1,261 1,196 5.4 7.1
Operating profit (beia) margin 12.5% 11.7% 80 bps1
Total volume 97.5 95.2 2.4 0.8
Beer volume 78.6 76.6 2.6 0.7
Licensed & non-beer volume 10.9 10.3 6.2 3.1
Beer volume increased by 0.7% driven by strong growth in the premium portfolio, led byHeineken®. France, Serbia, Spain, Italy and Poland contributed positively and more than offsetthe decline in Romania. Beer volume in the fourth quarter declined 2.5%, largely due to adeliberate reduction in promotions and private label volume in some markets as well as astrong comparative in December 2015.
Revenue increased by 1.9% organically, with revenue per hectolitre up 1.4%. Deflationarypressure and off trade pricing pressure continued to impact the region.
Operating profit (beia) was up 7.1% organically due to successful revenue management,continued focus on premiumisation and innovation, as well as disciplined cost management.
In the UK, beer volume declined slightly, although premium beer and cider volume increasedstrongly, led by Heineken®. Cider innovations were successful and value enhancing. The pubsbusiness continued to perform well. In 2H16 there was an adjustment in the way the UKaccounts for products bought for resale that were previously partly netted in Revenue andRaw materials. This has no impact on operating profit. In France, volume grew mid single digit, with growth led by premium brands includingHeineken®, Desperados and Affligem. The pricing environment continues to remainchallenging.
In Spain, beer volume was up low single digit, with double digit premium segment growthsupported by continued improvement in the underlying economic environment and good ontrade performance. In the Netherlands, volume grew low single digit, led by Heineken® and supported by strongperformance of Brand and Affligem in the premium segment.
In Poland, beer volume increased low single digit. The underlying market continued to beadversely impacted by channel mix and competitive pricing strategy.
1 Excluding an accounting adjustment in the UK in 2H16 with no impact on operating profit, Europe organic revenue growth wouldhave been +1.0%, organic revenue per hl +0.5% and operating margin (beia) +90bps.
MEDIA RELEASE
P.O. Box 28 – 1000 AA Amsterdam – The Netherlands Office address - Tweede Weteringplantsoen 21 – 1017 ZD Amsterdam Heineken N.V. - Registered Office at Amsterdam – Trade Register Amsterdam No. 33011433
Page 11 of 26

FINANCIAL REVIEW
Key figures(in mhl or € million unless otherwise stated)
FY15 Currencytranslation
Consolidationimpact
Organicgrowth
FY16 Organicgrowth
%
Revenue (beia) 20,511 -1,150 441 989 20,792 4.8
Total expenses (beia) -17,130 934 -401 -654 -17,252 -3.8
Operating profit (beia) 3,381 -216 40 335 3,540 9.9
Share of net profit of assoc./ JVs (beia) 177 -3 — -14 161 -7.8
EBIT (beia) 3,558 -219 40 321 3,700 9.0
Net interest income/(expenses) (beia) -352 3 -32 27 -355 7.6
Other net finance income/(expenses) (beia) -76 2 -3 -38 -114 -49.7
Income tax expense (beia) -822 75 2 -125 -869 -15.2
Minority interests (beia) -261 14 -6 -12 -265 -4.6
Net profit (beia) 2,048 -125 1 174 2,098 8.5
Eia -156 -558
Net profit 1,892 1,540
MEDIA RELEASE
P.O. Box 28 – 1000 AA Amsterdam – The Netherlands Office address - Tweede Weteringplantsoen 21 – 1017 ZD Amsterdam Heineken N.V. - Registered Office at Amsterdam – Trade Register Amsterdam No. 33011433
Page 12 of 26
Main changes in consolidation▪ On 7 October 2015 HEINEKEN announced the acquisition of Diageo plc's shareholding
in Jamaican formerly listed Desnoes & Geddes (“D&G”). During 2016 HEINEKENacquired 22.5% of the floating shares in D&G. HEINEKEN owned a 95.8% stake in D&Gas at 31 December 2016.
▪ As of 7 October 2015 HEINEKEN has full ownership of GAPL Pte Ltd (''GAPL''). GAPLowns 51% of the issued share capital of HEINEKEN Malaysia Berhad, which is listed onthe Malaysian Stock Exchange.
▪ On 15 October 2015 HEINEKEN completed the acquisition of a 53.4% stake ofPivovarna Laško Union d.o.o. (formerly known as Pivovarna Laško d.d.) in Slovenia.Following the completion of the mandatory takeover offer, HEINEKEN holds 100% ofthe share capital of this company.
▪ On 1 December 2015 HEINEKEN completed the restructuring of its operations in SouthAfrica and Namibia. In South Africa, HEINEKEN holds a 75% stake in both HeinekenSouth Africa (Pty) Limited (formerly known as DHN Drinks (Pty) Limited) and inSedibeng Brewery (Pty) Limited with Namibian Breweries Limited ("NBL") holding a 25%stake in both entities.
▪ On 1 February 2016, Grupa Żywiec completed the sale of 80% in Distribev Sp. z o.o.,Grupa Żywiec’s local sales and distribution company serving the traditional trade andhoreca market, to the Orbico Group.
▪ An agreement with Asia Brewery Incorporated to create AB HEINEKEN Philippines Incwas announced on 27 May 2016. The transaction closed on 15 November 2016.
RevenueRevenue increased by 1.4% to €20,792 million. Currency developments had a negative impactof 5.6% (€1,150 million), largely driven by the depreciation of the Mexican Peso, the NigerianNaira and the British pound. The impact of consolidation changes was €441 million, adding2.2%. The organic revenue increase of 4.8% comprised of total consolidated volume growth of2.6% and a 2.2% increase in revenue per hectolitre.

Total expenses (beia)Total expenses (beia) were €17,252 million, up by 3.8% organically. On an organic basis,input costs increased by 10.8% and by 7.7% on a per hectolitre basis predominantly due toadverse currency movements leading to a negative transactional FX impact. Marketing andselling (beia) expenses increased organically by 4.9% to €2,830 million, representing 13.6% ofrevenues (2015: 13.4%).
Operating profit (beia)Operating profit (beia) was €3,540 million, up 9.9% organically, with a €216 million negativeforeign currency impact and €40 million increase from consolidation changes. Higher revenueand the benefit of realised cost savings and efficiencies were only partially offset by highermarketing and selling expenses.
Share of net profit of associates and joint ventures (beia)Share of net profit of associates and joint ventures (beia) decreased from €177 million to€161 million. The €14 million decline mainly reflected lower net profit from the joint ventureoperation in the Republic of the Congo due to difficult market conditions.
Net finance expenses (beia)Net interest expenses (beia) slightly increased by €3 million to €355 million, reflecting ahigher average net debt position. The average interest rate in 2016 was 3.1% (2015: 3.3%).Other net finance expenses (beia) increased by €38 million to €114 million, primarily due toadverse foreign currency transactional movements.
Income tax expense (beia)The effective tax rate (beia) was 28.3%, a slight increase on the rate in 2015 (27.8%).
Net profit and net profit (beia)Net profit decreased by €352 million to €1,540 million. Net profit (beia) grew by €50 million to €2,098 million, an organic increase of 8.5%.Unfavourable currency impact was 6%, with consolidation impact minimal.
Exceptional items & amortisation of acquisition related intangibles (Eia) The impact of EIA on Net profit amounted to €558 million (2015: €156 million). On EBIT the impact of EIA amounted to €795 million (2015: €311 million).
Amortisation of acquisition related intangibles in EBIT amounted to €315 million (2015: €321million). Exceptional items in EBIT amounted to €480 million (2015: €10 million income)including impairments of €328m (2015: €78 million), of which €286 million related to DRC,and restructuring expenses of €80 million (2015: €106 million). Other exceptional expensesin EBIT amounted €72 million (2015: €194 million income which included €379 million gainfrom EMPAQUE). This includes asset write downs and the recording of provisions of €62million (2015: €79 million).
Please refer to page 24 for a more detailed description of the exceptional items andamortisation of acquisition related intangibles.
MEDIA RELEASE
P.O. Box 28 – 1000 AA Amsterdam – The Netherlands Office address - Tweede Weteringplantsoen 21 – 1017 ZD Amsterdam Heineken N.V. - Registered Office at Amsterdam – Trade Register Amsterdam No. 33011433
Page 13 of 26

US dollar hedgingHEINEKEN delays the impact of the US dollar fluctuations versus the Euro by hedging the netcash inflow of US dollars from exports for up to 18 months in advance.
For 2016 the average EUR/USD exchange rate inclusive of hedging was 1.16, versus 1.30 in2015. For the full year 2017, the net dollar inflow is forecast to be USD$518 million, of which85% has been hedged at EUR/USD 1.13. For 2018, the net dollar inflow is forecast to beapproximately USD$496 million of which 34% is hedged at EUR/USD 1.11 as of 9 February2017.
Capital expenditure and cash flowCapital expenditure related to property, plant and equipment amounted to €1,757 million in2016 (2015: €1,638 million) representing 8.5% of revenues. The increase in capitalexpenditure on the prior year included investments in Ethiopia, Cambodia, Ivory Coast,Mexico, Brazil, Vietnam and China.
Free operating cash flow amounted to €1,773 million (2015: €1,692 million), higher than lastyear primarily due to positive cash flow generated from operations, which was partly offset byhigher capital expenditure. Cash flow from changes in working capital in 2016 was againpositive, albeit lower than last year due to one offs in receivables and less favourablemovements in our payables due to capital expenditure phasing.
Financial structureTotal gross debt amounts to €14,570 million (2015: €14,973 million). The gross debtposition includes the impact of the change in accounting policy on netting cash and overdraftbalances in cash pooling arrangements. Net debt decreased to €11,293 million (2015:€11,510 million) as free operating cash flow exceeded the cash outflow for dividends,acquisitions and foreign currency impact on debt.
Including the effect of cross-currency swaps, 59% of net debt is Euro-denominated and 31%is US dollar and US dollar proxy currencies. The pro forma net debt/EBITDA (beia) ratio was2.3x on 31 December 2016 (2015: 2.4x) in line with the long-term target net debt/EBITDA(beia) ratio of below 2.5x.
During 2016 the following notes were issued under HEINEKEN's Euro Medium Term NoteProgramme:
• €800 million 10-year Notes with a coupon of 1.0% (May 2016)
• €500 million long 10-year Notes with a coupon of 1.375% (November 2016)
Average number of sharesHEINEKEN has 576,002,613 shares in issue. For the calculation of 2016 basic EPS, theweighted impact of the share buyback and shares purchased for the employee incentiveprogramme reduced the number of weighted average shares outstanding to 569,737,210(572,292,454 in 2015).For the calculation of 2016 diluted EPS, the number of weighted average outstanding sharesis adjusted for the amount of shares to be delivered under the employee incentiveprogramme, resulting in a weighted average diluted number of shares of 570,370,392(572,944,188 in 2015).
MEDIA RELEASE
P.O. Box 28 – 1000 AA Amsterdam – The Netherlands Office address - Tweede Weteringplantsoen 21 – 1017 ZD Amsterdam Heineken N.V. - Registered Office at Amsterdam – Trade Register Amsterdam No. 33011433
Page 14 of 26

Full Year 2016 Metrics In mhl or €million unless otherwise stated &consolidated figures unless otherwise stated FY15 Currency
TranslationConsolidation
ImpactOrganicGrowth FY16 Organic
Growth %
Africa, Middle East & Eastern EuropeRevenue 3,263 -435 262 113 3,203 3.5Revenue per Hl (in €)1 76 4 71 5.1Operating profit (beia) 579 -58 -22 -123 376 -21.2Operating profit (beia) margin 17.7% 11.7%Total volume 43.0 3.0 -0.7 45.4 -1.6
Beer volume 35.9 3.0 -0.5 38.4 -1.3Licensed & non-beer volume 7.0 — -0.2 6.9 -2.7Third party products volume 0.1 — — 0.1 -10.3
Group beer volume 39.9 40.0AmericasRevenue 5,159 -417 106 355 5,203 6.9Revenue per Hl (in €)1 90 3 87 3.3Operating profit (beia) 904 -104 9 213 1,021 23.5Operating profit (beia) margin 17.5% 19.6%Total volume 57.5 0.6 2.0 60.0 3.4
Beer volume 56.0 0.6 2.1 58.7 3.7Licensed & non-beer volume 1.4 — -0.1 1.2 -8.9Third party products volume 0.1 — — 0.1 -11.2
Group beer volume 60.2 63.4Asia PacificRevenue 2,483 -50 135 326 2,894 13.1Revenue per Hl (in €)1 122 -5 116 -3.7Operating profit (beia) 702 -15 54 186 927 26.5Operating profit (beia) margin 28.3% 32.0%Total volume 20.3 1.0 3.5 24.9 17.5
Beer volume 19.8 1.0 3.5 24.4 17.9Licensed & non-beer volume 0.4 — — 0.4 3.0Third party products volume 0.1 — — 0.1 -1.8
cGroup beer volume 25.7 30.6EuropeRevenue2 10,227 -243 -62 190 10,112 1.9Revenue per Hl (in €)1,2 100 1 97 1.4Operating profit (beia) 1,196 -36 17 84 1,261 7.1Operating profit (beia) margin 11.7% 12.5%Total volume 95.2 1.5 0.8 97.5 0.8
Beer volume 76.6 1.5 0.6 78.6 0.7Licensed & non-beer volume 10.3 0.2 0.3 10.9 3.1Third party products volume 8.3 -0.2 -0.1 8.0 -1.3
Group beer volume 79.6 81.6Head Office & EliminationsRevenue -621 -5 — 5 -620 n.a.Operating profit (beia) — -3 -18 -25 -45 n.a.Heineken N.V.Revenue2 20,511 -1,150 441 989 20,792 4.8Revenue per Hl (in €)1,2 95 2 91 2.2Total expenses (beia) -17,130 934 -401 -654 -17,252 -3.8Operating profit (beia) 3,381 -216 40 335 3,540 9.9Operating profit (beia) margin 16.5% 17.0%Share of net profit of associates /JVs (beia) 177 -3 — -14 161 -7.8Net Interest income / (expenses) (beia) -352 3 -32 27 -355 7.6Other net finance income / (expenses) (beia) -76 2 -3 -38 -114 -49.7Income tax expense (beia) -822 75 2 -125 -869 -15.2Minority Interests -261 14 -6 -12 -265 -4.6Net profit (beia) 2,048 -125 1 174 2,098 8.5Total volume 216.0 6.2 5.6 227.8 2.6
Beer volume 188.3 6.0 5.7 200.1 3.0Licensed & non-beer volume 19.1 0.4 — 19.4 0.1Third party products volume 8.6 -0.2 -0.1 8.3 -1.6
Group beer volume 205.4 215.61 Revenue per Hl calculation excludes interregional revenue2 Refer to page 1 for additional detail on UK accounting adjustment impact on HEINEKEN and on Europe please go to page 11. Note: due to rounding, this table will not always cast
MEDIA RELEASE
P.O. Box 28 – 1000 AA Amsterdam – The Netherlands Office address - Tweede Weteringplantsoen 21 – 1017 ZD Amsterdam Heineken N.V. - Registered Office at Amsterdam – Trade Register Amsterdam No. 33011433
Page 15 of 26

Fourth Quarter 2016 MetricsIn mhl or €million unless otherwise stated &consolidated figures unless otherwise stated 4Q15 Consolidation
Impact Organic Growth 4Q16 Organic Growth%
Africa, Middle East & Eastern EuropeTotal volume 10.9 0.8 -0.1 11.6 -0.9
Beer volume 9.2 0.7 0.1 10.0 0.6Licensed & non-beer volume 1.7 0.1 -0.2 1.6 -8.6Third party products volume — — — — —
Group beer volume 10.2 10.4AmericasTotal volume 15.5 — 0.4 16.0 2.6
Beer volume 15.1 — 0.4 15.6 2.8Licensed & non-beer volume 0.4 — — 0.4 -3.1Third party products volume — — — — —
Group beer volume 16.5 17.1Asia PacificTotal volume 5.9 0.1 1.0 7.0 16.8
Beer volume 5.7 0.1 1.0 6.8 17.8Licensed & non-beer volume 0.2 — — 0.2 -10.5Third party products volume — — — — —
Group beer volume 7.1 8.2EuropeTotal volume 21.5 -0.1 -0.5 21.0 -2.1
Beer volume 17.1 — -0.4 16.7 -2.5Licensed & non-beer volume 2.5 — — 2.5 1.5Third party products volume 1.9 -0.1 -0.1 1.8 -3.4
Group beer volume 17.8 17.3Heineken N.V.Total volume 53.8 0.8 0.8 55.5 1.6
Beer volume 47.2 0.9 1.1 49.1 2.2Licensed & non-beer volume 4.6 — -0.2 4.5 -3.0Third party products volume 2.0 -0.1 -0.1 1.9 -3.5
Group beer volume 51.6 53.0Note: due to rounding, this table will not always cast
MEDIA RELEASE
P.O. Box 28 – 1000 AA Amsterdam – The Netherlands Office address - Tweede Weteringplantsoen 21 – 1017 ZD Amsterdam Heineken N.V. - Registered Office at Amsterdam – Trade Register Amsterdam No. 33011433
Page 16 of 26

Consolidated financial statements for the full year 2016
Contents Page
Consolidated income statement 18
Consolidated statement of comprehensive income 19
Consolidated statement of financial position 20
Consolidated statement of cash flows 21
Consolidated statement of changes in equity 23
Non-GAAP measures 24
Glossary 25
The 2016 financial information included in the primary statements attached to this pressrelease are derived from the Annual Report 2016. This Annual Report has been authorised forissue. The Annual Report has not yet been published by law and still has to be adopted by theAnnual General Meeting on 20 April 2017.In accordance with section 393, Title 9, Book 2 of the Netherlands Civil Code, DeloitteAccountants B.V. has issued an unqualified auditors’ opinion on the Annual Report.
The full Annual Report will be available to download on the HEINEKEN website(www.theheinekencompany.com) from 22 February 2017.
MEDIA RELEASE
P.O. Box 28 – 1000 AA Amsterdam – The Netherlands Office address - Tweede Weteringplantsoen 21 – 1017 ZD Amsterdam Heineken N.V. - Registered Office at Amsterdam – Trade Register Amsterdam No. 33011433
Page 17 of 26

CONSOLIDATED INCOME STATEMENT
2016 2015
For the year ended 31 December
In millions of EUR
Revenue 20,792 20,511
Other income 46 411
Raw materials, consumables and services (13,003) (12,931)
Personnel expenses (3,263) (3,322)
Amortisation, depreciation and impairments (1,817) (1,594)
Total expenses (18,083) (17,847)
Results from operating activities 2,755 3,075
Interest income 60 60
Interest expenses (419) (412)
Other net finance income/(expenses) (134) (57)
Net finance expenses (493) (409)
Share of profit of associates and joint ventures and impairments thereof (net of incometax) 150 172
Profit before income tax 2,412 2,838
Income tax expense (673) (697)
Profit 1,739 2,141
Attributable to:
Equity holders of the Company (net profit) 1,540 1,892
Non-controlling interests 199 249
Profit 1,739 2,141
Weighted average number of shares – basic 569,737,210 572,292,454
Weighted average number of shares – diluted 570,370,392 572,944,188
Basic earnings per share (EUR) 2.70 3.31
Diluted earnings per share (EUR) 2.70 3.30
MEDIA RELEASE
P.O. Box 28 – 1000 AA Amsterdam – The Netherlands Office address - Tweede Weteringplantsoen 21 – 1017 ZD Amsterdam Heineken N.V. - Registered Office at Amsterdam – Trade Register Amsterdam No. 33011433
Page 18 of 26

CONSOLIDATED STATEMENT OF COMPREHENSIVE INCOME
2016 2015
For the year ended 31 December
In millions of EUR
Profit 1,739 2,141
Other comprehensive income:
Items that will not be reclassified to profit or loss:
Actuarial gains and losses (252) 95
Items that may be subsequently reclassified to profit or loss:
Currency translation differences (908) (43)
Recycling of currency translation differences to profit or loss — 129
Effective portion of net investment hedges 44 15
Effective portion of changes in fair value of cash flow hedges 6 23
Effective portion of cash flow hedges transferred to profit or loss 41 24
Net change in fair value available-for-sale investments 140 43
Recycling of fair value of available-for-sale investments to profit or loss — (16)
Share of other comprehensive income of associates/joint ventures — 7
Other comprehensive income, net of tax (929) 277
Total comprehensive income 810 2,418
Attributable to:
Equity holders of the Company 660 2,150
Non-controlling interests 150 268
Total comprehensive income 810 2,418
MEDIA RELEASE
P.O. Box 28 – 1000 AA Amsterdam – The Netherlands Office address - Tweede Weteringplantsoen 21 – 1017 ZD Amsterdam Heineken N.V. - Registered Office at Amsterdam – Trade Register Amsterdam No. 33011433
Page 19 of 26

CONSOLIDATED STATEMENT OF FINANCIAL POSITION2016 2015*
As at 31 December
In millions of EUR
Assets
Property, plant and equipment 9,232 9,552
Intangible assets 17,424 18,183
Investments in associates and joint ventures 2,166 1,985
Other investments and receivables 1,077 856
Advances to customers 274 266
Deferred tax assets 1,011 958
Total non-current assets 31,184 31,800
Inventories 1,618 1,702
Other investments — 16
Trade and other receivables 3,052 2,873
Prepayments 328 343
Income tax receivables 47 33
Cash and cash equivalents 3,035 3,232
Assets classified as held for sale 57 123
Total current assets 8,137 8,322
Total assets 39,321 40,122
Equity
Share capital 922 922
Share premium 2,701 2,701
Reserves (1,173) (655)
Retained earnings 10,788 10,567
Equity attributable to equity holders of the Company 13,238 13,535
Non-controlling interests 1,335 1,535
Total equity 14,573 15,070
Liabilities
Loans and borrowings 10,954 10,658
Tax liabilities 3 3
Employee benefits 1,420 1,289
Provisions 302 320
Deferred tax liabilities 1,672 1,858
Total non-current liabilities 14,351 14,128
Bank overdrafts and commercial papers 1,669 2,950
Loans and borrowings 1,981 1,397
Trade and other payables 6,224 6,013
Tax liabilities 352 379
Provisions 154 154
Liabilities classified as held for sale 17 31
Total current liabilities 10,397 10,924
Total liabilities 24,748 25,052
Total equity and liabilities 39,321 40,122
*Revised to reflect the change in accounting policy on netting cash and overdraft balances in cash pooling arrangements with legallyenforceable rights to offset.
MEDIA RELEASE
P.O. Box 28 – 1000 AA Amsterdam – The Netherlands Office address - Tweede Weteringplantsoen 21 – 1017 ZD Amsterdam Heineken N.V. - Registered Office at Amsterdam – Trade Register Amsterdam No. 33011433
Page 20 of 26

CONSOLIDATED STATEMENT OF CASH FLOWS
2016 2015
For the year ended 31 December
In millions of EUR
Operating activities
Profit 1,739 2,141
Adjustments for:
Amortisation, depreciation and impairments 1,817 1,594
Net interest expenses 359 352
Gain on sale of property, plant and equipment, intangible assets and subsidiaries, joint ventures and associates (46) (411)
Investment income and share of profit and impairments of associates and jointventures and dividend income on available-for-sale and held-for-trading investments (161) (182)
Income tax expenses 673 697
Other non-cash items 332 89
Cash flow from operations before changes in working capital and provisions 4,713 4,280
Change in inventories (20) 27
Change in trade and other receivables (228) (59)
Change in trade and other payables 328 403
Total change in working capital 80 371
Change in provisions and employee benefits (73) (165)
Cash flow from operations 4,720 4,486
Interest paid (441) (446)
Interest received 70 87
Dividends received 118 159
Income taxes paid (749) (797)
Cash flow related to interest, dividend and income tax (1,002) (997)
Cash flow from operating activities 3,718 3,489
Investing activities
Proceeds from sale of property, plant and equipment and intangible assets 116 83
Purchase of property, plant and equipment (1,757) (1,638)
Purchase of intangible assets (109) (92)
Loans issued to customers and other investments (219) (195)
Repayment on loans to customers 24 45
Cash flow (used in)/from operational investing activities (1,945) (1,797)
Free operating cash flow 1,773 1,692
Acquisition of subsidiaries, net of cash acquired (9) (757)
Acquisition of/additions to associates, joint ventures and other investments (68) (543)
Disposal of subsidiaries, net of cash disposed of 15 979
Disposal of associates, joint ventures and other investments — 54
Cash flow (used in)/from acquisitions and disposals (62) (267)
Cash flow (used in)/from investing activities (2,007) (2,064)
MEDIA RELEASE
P.O. Box 28 – 1000 AA Amsterdam – The Netherlands Office address - Tweede Weteringplantsoen 21 – 1017 ZD Amsterdam Heineken N.V. - Registered Office at Amsterdam – Trade Register Amsterdam No. 33011433
Page 21 of 26

2016 2015For the year ended 31 December
In millions of EUR
Financing activities
Proceeds from loans and borrowings 1,670 1,888
Repayment of loans and borrowings (1,001) (1,753)
Dividends paid (1,031) (909)
Purchase own shares and shares issued (31) (377)
Acquisition of non-controlling interests (294) (21)
Other 15 (1)
Cash flow (used in)/from financing activities (672) (1,173)
Net cash flow 1,039 252
Cash and cash equivalents as at 1 January 282 73
Effect of movements in exchange rates 45 (43)
Cash and cash equivalents as at 31 December 1,366 282
MEDIA RELEASE
P.O. Box 28 – 1000 AA Amsterdam – The Netherlands Office address - Tweede Weteringplantsoen 21 – 1017 ZD Amsterdam Heineken N.V. - Registered Office at Amsterdam – Trade Register Amsterdam No. 33011433
Page 22 of 26

CONSOLIDATED STATEMENT OF CHANGES IN EQUITY
In millions of EURShare
capitalShare
premiumTranslation
reserveHedgingreserve
Fair valuereserve
Otherlegal
reserves
Reservefor own
sharesRetainedearnings
Equityattributable
to equityholders of the
Company
Non-controlling
interestsTotal
equity
Balance as at1 January 2015 922 2,701 (1,097) (99) 96 743 (70) 9,213 12,409 1,043 13,452
Profit — — — — — 186 — 1,706 1,892 249 2,141
Othercomprehensiveincome — — 80 52 26 — — 100 258 19 277
Totalcomprehensiveincome — — 80 52 26 186 — 1,806 2,150 268 2,418
Transfer to retained earnings — — — — — (210) — 210 — — —
Dividends toshareholders — — — — — — — (676) (676) (248) (924)
Purchase/reissuanceown/non-controllingshares — — — — — — (384) — (384) 10 (374)
Own sharesdelivered — — — — — — 22 (22) — — —
Share-basedpayments — — — — — — — 32 32 — 32
Acquisition of non-controlling interestswithout a change incontrol — — — — — — — 4 4 (2) 2
Changes inconsolidation — — — — — — — — — 464 464
Balance as at31 December 2015 922 2,701 (1,017) (47) 122 719 (432) 10,567 13,535 1,535 15,070
In millions of EURShare
capitalShare
premiumTranslation
reserveHedgingreserve
Fair valuereserve
Otherlegal
reserves
Reservefor own
sharesRetainedearnings
Equityattributable
to equityholders of the
Company
Non-controlling
interestsTotal
equity
Balance as at1 January 2016 922 2,701 (1,017) (47) 122 719 (432) 10,567 13,535 1,535 15,070
Profit — — — — — 153 — 1,387 1,540 199 1,739
Othercomprehensiveincome — — (812) 46 140 — — (254) (880) (49) (929)
Totalcomprehensiveincome — — (812) 46 140 153 — 1,133 660 150 810
Transfer to/(from)retained earnings — — — — — (34) — 34 — — —
Dividends toshareholders — — — — — — — (786) (786) (261) (1,047)
Purchase/reissuanceown/non-controllingshares — — — — — — (39) — (39) 8 (31)
Own sharesdelivered — — — — — — 28 (28) — — —
Share-basedpayments — — — — — — — 13 13 — 13
Acquisition of non-controlling interestswithout a change incontrol — — — — — — — (145) (145) (144) (289)
Changes inconsolidation — — — — — — — — — 47 47
Balance as at31 December 2016 922 2,701 (1,829) (1) 262 838 (443) 10,788 13,238 1,335 14,573
MEDIA RELEASE
P.O. Box 28 – 1000 AA Amsterdam – The Netherlands Office address - Tweede Weteringplantsoen 21 – 1017 ZD Amsterdam Heineken N.V. - Registered Office at Amsterdam – Trade Register Amsterdam No. 33011433
Page 23 of 26

NON-GAAP MEASURES In the internal management reports, HEINEKEN measures its performance primarily based onEBIT and EBIT beia (before exceptional items and amortisation of acquisition-relatedintangible assets). Both are non-GAAP measures not calculated in accordance with IFRS. Beiaadjustments are also applied on profit metrics. The presentation of these financial measuresmay not be comparable to similarly titled measures reported by other companies due todifferences in the ways the measures are calculated.
In millions of EUR 2016 2015
EBIT (beia) 3,700 3,558
Exceptional items and amortisation of acquisition-related intangible assets included in EBIT (795) (311)
EBIT 2,905 3,247
Net finance expenses (493) (409)
Profit before income tax 2,412 2,838
Profit attributable to equity holders of the Company (net profit) 1,540 1,892
Amortisation of acquisition-related intangible assets included in EBIT 315 321
Exceptional items included in EBIT 480 (10)
Exceptional items included in net finance expenses/(income) 25 (18)
Exceptional items included in income tax expense (196) (124)
Exceptional items included in non-controlling interest (66) (13)
Net profit (beia) 2,098 2,048
The 2016 exceptional items and amortisation of acquisition-related intangibles on net profitamounts to €558 million (2015: €156 million). This amount consists of:
• €315 million (2015: €321 million) of amortisation of acquisition-related intangiblesrecorded in EBIT. €10 million (2015: €5 million) of this amount is included in share ofnet profit of associates and joint ventures.
• €480 million (2015: €10 million income) of exceptional items recorded in EBIT. Thisincludes restructuring expenses of €80 million (2015: €106 million), impairments of€328 million (2015: €78 million) of which €286 million relates to The DemocraticRepublic of Congo (DRC). Other exceptional expenses in EBIT amounted to €72 million(2015: €194 million income which included €379 million disposal gain for EMPAQUE).This includes asset write downs and the recording of provisions for an amount of €62million (2015: €79 million).
• €25 million (2015: €18 million income) of exceptional items in net finance expenses,mainly related to the currency impact on dividend receivables from Nigeria.
• €196 million (2015: €124 million) in income tax expense includes the tax impact onamortisation of acquisition-related intangible assets of €73 million (2015: €75million), the tax impact on exceptional items of €36 million (2015: €58 million) and anexceptional income tax benefit of €87 million (2015: €9 million expense), mainlyrelating to previously unrecognised deferred tax assets in 2016
• Total amount of Eia allocated to non-controlling interest amounts to €66 million(2015: €13 million).
MEDIA RELEASE
P.O. Box 28 – 1000 AA Amsterdam – The Netherlands Office address - Tweede Weteringplantsoen 21 – 1017 ZD Amsterdam Heineken N.V. - Registered Office at Amsterdam – Trade Register Amsterdam No. 33011433
Page 24 of 26

GLOSSARYAcquisition-related intangible assets Acquisition-related intangible assets are assets that HEINEKEN only recognises as part of apurchase price allocation following an acquisition. This includes, among others, brands,customer-related and certain contract-based intangibles.
Beia Before exceptional items and amortisation of acquisition-related intangible assets.
Cash conversion ratio Free operating cash flow/net profit (beia) before deduction of non-controlling interests.
Cash flow (used in)/from operational investing activities This represents the total of cash flow from sale and purchase of property, plant andequipment and intangible assets, proceeds and receipts of loans to customers and otherinvestments.
Depletions Sales by distributors to the retail trade.
Dividend payout Proposed dividend as percentage of net profit (beia).
Earnings per share Basic Net profit divided by the weighted average number of shares – basic – during the year. Diluted Net profit divided by the weighted average number of shares – diluted – during the year.
EBIT Earnings before interest, taxes and net finance expenses. EBIT includes HEINEKEN’s share innet profit of joint ventures and associates.
EBITDA Earnings before interest, taxes, net finance expenses, depreciation and amortisation. EBITDAincludes HEINEKEN’s share in net profit of joint ventures and associates.
Effective tax rate Income tax expense expressed as a percentage of the profit before income tax, adjusted forshare of profit of associates and joint ventures and impairments thereof (net of income tax).
Eia Exceptional items and amortisation of acquisition-related intangible assets.
Exceptional items Items of income and expense of such size, nature or incidence, that in the view ofmanagement their disclosure is relevant to explain the performance of HEINEKEN for theperiod.
Free operating cash flow This represents the total of cash flow from operating activities and cash flow from operationalinvesting activities.
Innovation rate Revenues generated from innovations (introduced in the past 40 quarters for a new category,20 quarters for a new brand and 12 quarters for all other innovations, excluding packagingrenovations) divided by total revenue.
MEDIA RELEASE
P.O. Box 28 – 1000 AA Amsterdam – The Netherlands Office address - Tweede Weteringplantsoen 21 – 1017 ZD Amsterdam Heineken N.V. - Registered Office at Amsterdam – Trade Register Amsterdam No. 33011433
Page 25 of 26

Net debt Non-current and current interest bearing loans and borrowings, bank overdrafts andcommercial papers and market value of cross-currency interest rate swaps less investmentsheld for trading and cash.
Net profit Profit after deduction of non-controlling interests (profit attributable to equity holders of theCompany).
Operating profit Results from operating activities.
Organic growth Growth excluding the effect of foreign currency translational effects, consolidation changes,exceptional items and amortisation of acquisition-related intangible assets.
Organic volume growth Growth in volume, excluding the effect of consolidation changes.
Profit Total profit of HEINEKEN before deduction of non-controlling interests.
® All brand names mentioned in this report, including those brand names not marked by an ®,represent registered trademarks and are legally protected.
Region A region is defined as HEINEKEN’s managerial classification of countries into geographicalunits.
Volume (Consolidated) beer volume 100 per cent of beer volume produced and sold by consolidated companies. Group beer volume Consolidated beer volume plus attributable share of beer volume from joint ventures andassociates. Heineken® volume in premium segment Heineken® volume excluding Heineken® volume in the Netherlands. Licensed & non-beer volume HEINEKEN’s brands produced and sold under licence by third parties as well as cider, softdrinks and other non-beer volume sold in consolidated companies. Third party products volume Volume of third party products sold through consolidated companies. Total volume 100 per cent of volume produced and sold by consolidated companies (including beer, cider,soft drinks and other beverages), volume of third party products and volume of HEINEKEN’sbrands produced and sold under licence by third parties.
Weighted average number of shares Basic Weighted average number of outstanding shares. Diluted Weighted average number of outstanding shares and the weighted average number ofordinary shares that would be issued on conversion of the dilutive potential ordinary sharesinto ordinary shares as a result of HEINEKEN's share based payment plans.
MEDIA RELEASE
P.O. Box 28 – 1000 AA Amsterdam – The Netherlands Office address - Tweede Weteringplantsoen 21 – 1017 ZD Amsterdam Heineken N.V. - Registered Office at Amsterdam – Trade Register Amsterdam No. 33011433
Page 26 of 26