henry krautter title v - permitting division maricopa ... lms100 turbine, other than the chosen...
TRANSCRIPT

1
April 9, 2015 Henry Krautter Title V - Permitting Division Maricopa County Air Quality Department 1001 N. Central Ave., Suite 400 Phoenix, AZ 85004 [email protected] RE: Ocotillo Power Plant – Permit Number V95-007 Dear Mr. Krautter:
These comments are submitted on behalf of Sierra Club and its 600,000 members, including over 12,500 members in Arizona. The issues addressed below regarding the proposed Draft Permit Renewal and Revision (Draft Permit) are based on publicly available materials, including the March 4, 2015 Technical Support Document (TSD) prepared by the Maricopa County Air Pollution Control District (the County), the draft permit, the permit application (Application), the applicant’s January 23, 2015 updated Control Technology Review (Application Appendix B), and the Application for a Certificate of Environmental Compatibility from the Arizona Power Plant and Transmission Line Siting Committee (CEC Application).
The Applicant, Arizona Public Service (APS), is planning to install five new natural gas-fired GE Model LMS100 simple cycle turbines (GTs) at the site of the existing Ocotillo Power Plant. Each of the proposed new GTs have a 102 MW nominal capacity, for a combined capacity increase of 510 MW. The Ocotillo Facility currently consists of two 110 MW steam generators and two 55 MW gas turbines, for a total output of 330 MW. The Facility operates on natural gas supplied by Kinder Morgan’s El Paso Natural Gas pipeline system. The Facility is located on about 126 acres in Tempe, Arizona, in Maricopa County. The Applicant proposes to retire the two existing 110 MW steam generators, but will leave in place the two existing 55 MW gas turbines. The Project would nearly double the Facility’s total capacity to about 620 MW.
The location of the Ocotillo Power Plant is currently classified as a serious nonattainment area for particulate matter (PM10), and is also classified as a marginal nonattainment area for ozone.

2
The draft permit includes a permitted greenhouse gas (GHG) emission rate for the GTs of 1,690 lb CO2e/MWhr (gross) based on a 12-month rolling average. (TSD at 30.) The proposed permit limits would allow the units to operate more than 4,000 hours per year (46% of the time).1 The total annual project emission limit is 1,029,022 tpy CO2e.
The Ocotillo Power Plant is subject to greenhouse gas (GHG) prevention of significant deterioration (PSD) regulations. New construction projects that are expected to emit at least 100,000 tpy of total GHGs on a CO2e basis, or modifications at existing facilities that are expected to increase total GHG emissions by at least 75,000 tpy CO2e, are subject to PSD permitting requirements where a PSD permit is otherwise required based on emissions of conventional pollutants. The proposed modifications at the Ocotillo Power Plant will result in new GHG emissions of 1,029,022 tons per year (tpy) of CO2e. (TSD at 27.) The proposed modifications would emit GHGs at a rate far greater than 75,000 tpy CO2e and the TSD acknowledges that the project is subject to PSD permitting for Carbon Monoxide (CO), PM, and PM2.5.
I. THE PERMIT DOES NOT SATISFY BACT FOR GHG EMISSIONS FROM THE GAS
TURBINES
The major source of greenhouse gas emissions (GHG), expressed here as carbon dioxide equivalents (CO2e) is the gas turbines, which are projected to emit 1,100,640 ton/yr CO2e, or 99.8% of the total. (TSD, Table 15.) The net increase in GHG emissions, 1,029,032 ton/yr, exceeds the PSD significance threshold of 75,000 ton/yr by a huge amount. (TSD, Table 24.) Thus, BACT for GHG is required under federal PSD regulations. The Application includes a top-down BACT analysis for GHG. (TSD, Appx. A, Chapter 6 and Ap, Appx. B, Chapter 6.)2
This analysis concluded that BACT for GHG is the use of “good combustion practices in combination with low carbon containing fuel (natural gas)” satisfied through a three part limit:
a gas turbine initial heat rate of no more than 8,742 BTU/kWh of gross electric output at 100% load and a dry bulb temperature of 73 F;
an emission factor of 1,690 lb CO2/MWh gross electric output, based on a 12-month rolling average; and
a turbine maintenance plan.
(Ap, Appx. B, p. 50.) The proposed Permit fails to include a limit on initial heat rate. These requirements do not satisfy BACT for GHG because the top-down BACT analysis is fundamentally flawed. The permitted emission rate of 1,690 lb CO2/MWh is the least-protective limit for any natural gas PSD permit for any simple-cycle natural gas facility identified by the
1 See Section I.B.1, below, for calculation of permissible operating hours. 2 Note: Appendix A to the TSD is the same document as Appendix B to the Application. For clarity, these comments refer to the Control Technology Review as Application Appendix B.

3
applicant,3 and Sierra Club is aware of no other simple-cycle natural gas facility with a more lenient GHG emission rate in the entire country.
In 2011, EPA issued its PSD and Title V Permitting Guidance for Greenhouse Gas (“GHG Guidance”) to assist permitting authorities in addressing PSD and Title V permitting requirements for GHGs. Section III of the GHG Guidance addresses the BACT analysis.4 The GHG Guidance directs permitting authorities to “continue to use the Agency’s five-step ‘top-down’ BACT process to determine BACT for GHGs.”5
The first step requires the permitting authority to identify all “potentially” available control options.6 The second step is to eliminate “technically infeasible” options from the potentially available options identified at step 1.7 In step 3 of the top-down method, the remaining control technologies are ranked and then listed in order of control effectiveness for the pollutant under review, with the most effective alternative at the top. In the fourth step of the analysis, the energy, environmental and economic impacts are considered and the top alternative is either confirmed as appropriate or is determined to be inappropriate.8 Issues regarding the cost-effectiveness of the alternative technologies are considered under step 4.9 The purpose of step 4 of the analysis is to validate the suitability of the top control option identified, or provide a clear justification as to why the top control option should not be selected as BACT.10 Finally, under step 5, the most effective control alternative not eliminated in step 4 is selected and the permit issuer sets as BACT an emissions limit for a specific pollutant that is appropriate for the selected control method.11
A. Step 1 of the GHG Top-Down BACT Analysis Is Flawed In step 1, all control technologies must be identified.12 The list of control option types that
must be considered when establishing a BACT limit includes both “add-on” controls that remove pollutants from a facility’s emissions stream and “inherently lower-polluting process or practices that prevent the pollutants from being formed in the first place.13 The NSR Manual describes the categories as follows:
Potentially applicable control alternatives can be categorized in three ways:
Inherently Lower Emitting Processes/Practices, including the use of materials and production processes and work practices that
3 See Application at p.35. 4 GHG Guidance at 17-46. 5 Id. at 17. 6 Office of Air Quality Planning and Standards, U.S. EPA, New Source Review Workshop Manual at B.5 (Draft, Oct. 1990) (“NSR Manual”). 7 Id. at B.7. 8 Id. at B.29. 9 Id. at B.31-.46. 10 Id. atB.26. 11 Id. at B.53; see, generally, In re Prairie State Generating Co., 13 E.A.D. 1, 11 (EAB 2006). 12 NSR Manual, p. B.5. 13 In re Knauf Fiber Glass, 8 E.A.D. at 129.

4
prevent emissions and result in lower “production specific” emissions; and
Add-on Controls, such as scrubbers, fabric filters, thermal oxidizers and other devices that control and reduce emissions after they are produced.
Combination of Inherently Lower Emitting Practices and Add-on Controls. For example, the application of combustion and post-combustion controls to reduce NOx emissions at a gas-fired turbine.14
The Applicant identified the following control technologies for GHG (Ap., Appx. B at p. 36):
1. The use of low carbon containing or lower emitting primary fuels. 2. The use of energy efficient processes and technologies, including:
a. Efficient simple cycle gas turbine generators, b. Combined cycle gas turbines, c. Reciprocating internal combustion engine generators.
3. Good combustion, operating, and maintenance practices, 4. Carbon capture and sequestration (CCS) as a post combustion control system
This list is incomplete because it excludes both energy storage and smaller units. Energy
storage is a feasible technology under both the category of inherently lower emitting technologies and the category of add-on control technology. The TSD further failed to identify good combustion practice options with lower GHG emissions that are commercially available for the LMS100 turbine, other than the chosen turbine configuration using water injection. These alternatives include using the same LMS100 turbines with: (1) steam injection; (3) dry low NOx (DLN) combustors; and (3) as a Steam Injected Gas Turbine (STIG).15 Rather than considering these options, the Application and TSD looked only at water injection, which is the least efficient and thus highest GHG emitting combustion option.
1. Energy Storage Options Improperly Omitted
The purpose of the Project, as defined by the Applicant, is to provide temporary peaking capacity to interface with APS’s growing renewable portfolio. Because renewable energy is an intermittent source of electricity, APS argues it requires peaking capacity to maintain reliable electric service and maintain grid stability. (Ap., p. 2.) This need could be achieved using energy storage to replace some or all of the proposed LMS100 turbines. Incorporating energy storage
14 NSR Manual at B.10; see, also, PSD and Title V Permitting Guidance for Greenhouse Gas at 25 (March 2011) (“GHG Guidance”). 15 GE Power Systems, GE’s New Gas Turbine System: Designed to Change the Game in Power Generation, 2003, Available at: http://www.dec.ny.gov/docs/permits_ej_operations_pdf/atechspecs.pdf and GE Energy, New High Efficiency Simple Cycle Gas Turbine – GE’s LMS1000, June 2004, Available at: http://site.ge-energy.com/prod_serv/products/tech_docs/en/downloads/ger4222a.pdf.

5
units into the Project could serve to lower GHG emissions in two ways: (1) as an add-on technology; and (2) as an inherently lower emitting technology.
There are several types of energy storage technologies available that a project developer can tailor to meet site-specific needs and constraints. Proven storage technologies include batteries, compressed air energy storage (CAES), Liquid Air Energy Storage (LAES), pumped hydro, and flywheels.16 The first two commercial CAES projects – the 290-MW plant in Huntorf, Germany, built in 1978, and the 110-MW McIntosh, Alabama plant, built in 1991 – have proven the CAES technology is technically feasible. Other projects of varying sizes are rapidly coming online. AES Energy Storage recently announced a power purchase agreement with Southern California Edison to provide 100 MW of battery-based energy storage capable of providing 400 MWh of energy.17
Many of these technologies are modular, which allows for scaling them up to meet site-specific needs. Energy storage also acts as both generation and load to enable more than twice the flexible range of a peaker plant on the same interconnection. For example, a 50 MW battery provides 100 MW of load flexibility because it can provide 50 MW of energy and capacity to meet load, and it can also receive up to 50 MW of charge if APS is in a period of over-generation. The technologies can be paired with traditional thermal generating units or renewable generation to provide an independent source to charge the storage and to provide other backup services. Energy storage is always synchronized to the grid and able to provide key reliability services such as frequency regulation, spinning reserves, and renewable integration without a minimum set point.
APS’ own 2014 Integrated Resource Plan (IRP) acknowledged several energy storage options that are potentially available for their system, including CAES (100 MW), pumped hydro (900 MW), Li-ion battery (30 MW), flow battery (20 MW) and flywheels (20 MW).18 Furthermore, the issue of storage in lieu of or in addition to the Ocotillo Project was raised during the state citing process. On September 12, 2014, the Arizona Residential Utility Consumer Office (RUCO) submitted testimony in APS’s application for a Certificate of Environmental Compatibility (CEC) before the Arizona Power Plant and Transmission Line Siting Committee. (Docket No. 14-0292-00169.) RUCO reviewed APS’s assertion regarding the need for the 500 MW of simple-cycle generation and concluded that APS should have evaluated energy storage technologies to meet those needs.19 This discussion regarding energy storage as a viable alternative to the LMS100s to meet the project purpose occurred in September 2014. Yet the Applicant’s Control Technology Review, which was updated January 23, 2015, does not even mention energy storage as a potential control technology.
16 http://energystorage.org/energy-storage/energy-storage-technologies 17 http://www.aesenergystorage.com/2014/11/05/aes-help-sce-meet-local-power-reliability-20-year-power-purchase-agreement-energy-storage-california-new-facility-will-provide-100-mw-interconnected-storage-equivalent-200-mw/ 18 Exhibit 1, APS 2014 IRP Presentation, Sept. 11, 2014, p.20. 19 Exhibit 2, Testimony of Riley G. Rhorer on behalf of RUCO in Response to Application for Certificate of Environmental Compatibility (CEC), Arizona Power Plant and Transmission Line Siting Committee, Dkt. 14-0292-00169 (“Rhorer Testimony”) at 11.
6
2. Energy Storage as an Add-On Technology
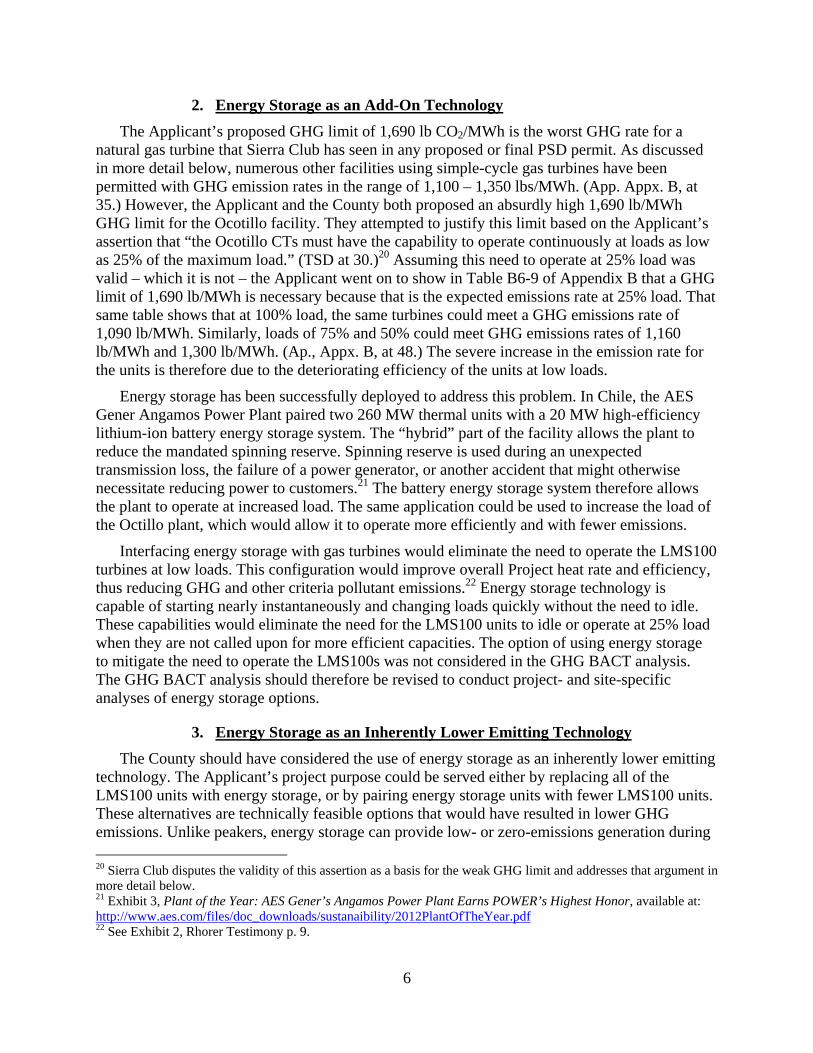
The Applicant’s proposed GHG limit of 1,690 lb CO2/MWh is the worst GHG rate for a natural gas turbine that Sierra Club has seen in any proposed or final PSD permit. As discussed in more detail below, numerous other facilities using simple-cycle gas turbines have been permitted with GHG emission rates in the range of 1,100 – 1,350 lbs/MWh. (App. Appx. B, at 35.) However, the Applicant and the County both proposed an absurdly high 1,690 lb/MWh GHG limit for the Ocotillo facility. They attempted to justify this limit based on the Applicant’s assertion that “the Ocotillo CTs must have the capability to operate continuously at loads as low as 25% of the maximum load.” (TSD at 30.)20 Assuming this need to operate at 25% load was valid – which it is not – the Applicant went on to show in Table B6-9 of Appendix B that a GHG limit of 1,690 lb/MWh is necessary because that is the expected emissions rate at 25% load. That same table shows that at 100% load, the same turbines could meet a GHG emissions rate of 1,090 lb/MWh. Similarly, loads of 75% and 50% could meet GHG emissions rates of 1,160 lb/MWh and 1,300 lb/MWh. (Ap., Appx. B, at 48.) The severe increase in the emission rate for the units is therefore due to the deteriorating efficiency of the units at low loads.
Energy storage has been successfully deployed to address this problem. In Chile, the AES Gener Angamos Power Plant paired two 260 MW thermal units with a 20 MW high-efficiency lithium-ion battery energy storage system. The “hybrid” part of the facility allows the plant to reduce the mandated spinning reserve. Spinning reserve is used during an unexpected transmission loss, the failure of a power generator, or another accident that might otherwise necessitate reducing power to customers.21 The battery energy storage system therefore allows the plant to operate at increased load. The same application could be used to increase the load of the Octillo plant, which would allow it to operate more efficiently and with fewer emissions.
Interfacing energy storage with gas turbines would eliminate the need to operate the LMS100 turbines at low loads. This configuration would improve overall Project heat rate and efficiency, thus reducing GHG and other criteria pollutant emissions.22 Energy storage technology is capable of starting nearly instantaneously and changing loads quickly without the need to idle. These capabilities would eliminate the need for the LMS100 units to idle or operate at 25% load when they are not called upon for more efficient capacities. The option of using energy storage to mitigate the need to operate the LMS100s was not considered in the GHG BACT analysis. The GHG BACT analysis should therefore be revised to conduct project- and site-specific analyses of energy storage options.
3. Energy Storage as an Inherently Lower Emitting Technology
The County should have considered the use of energy storage as an inherently lower emitting technology. The Applicant’s project purpose could be served either by replacing all of the LMS100 units with energy storage, or by pairing energy storage units with fewer LMS100 units. These alternatives are technically feasible options that would have resulted in lower GHG emissions. Unlike peakers, energy storage can provide low- or zero-emissions generation during 20 Sierra Club disputes the validity of this assertion as a basis for the weak GHG limit and addresses that argument in more detail below. 21 Exhibit 3, Plant of the Year: AES Gener’s Angamos Power Plant Earns POWER’s Highest Honor, available at: http://www.aes.com/files/doc_downloads/sustanaibility/2012PlantOfTheYear.pdf 22 See Exhibit 2, Rhorer Testimony p. 9.

7
peak demand by discharging energy stored from efficient natural gas combined-cycle plants, nuclear or renewable generators.
When paired with a traditional generating unit, the total emissions of the an energy storage facility would be much lower than the proposed 1,690 lb/MWh GHG rate of the Ocotillo Facility. Once charged, the energy storage component has a very low marginal cost and would therefore discharge zero-emission or very low-emission power before needing to rely on any reserve combustion generated power.
As an example, three CAES units in Texas already have acquired a signed Interconnection Agreement within ERCOT23 and received GHG permits from EPA.24 These technologies use a small amount of natural gas to run their turbines, and therefore are not zero-emission, but they will emit significantly less GHGs than a traditional natural gas plant. Indeed, the EPA itself has approved PSD GHG permits for several CAES units. EPA Region 6 issued a final permit for the Apex Bethel Energy Center in March 2014, another final permit for the Apex Matagorda Energy Center in April 2014, and a final permit for Chamisa CAES at Tulia in March 2014.25
The permitted limits of the CAES facilities in Texas, which will serve essentially the same function as the Ocotillo turbines, are dramatically lower than the proposed limit of 1,690 lb CO2/MWhr (gross) for Ocotillo.
The GHG BACT limit for the 270 MW Chamisa facility is 575 lb CO2/MWh on a gross electrical output basis on a 12-operating month rolling average basis.26
The GHG BACT limits for both the 317 MW Apex Bethel Energy plant and the Apex Matagora plant are 558 lb CO2/MWh (net) for both trains on a 365-day rolling average.27
These limits for permitted CAES facilities are nearly one-third the proposed limits for Ocotillo. Other storage technologies, such as batteries, could provide even lower GHG emission rates.
Even if one considers the GHG emissions necessary to charge an energy storage unit, the overall GHG emissions rate of an energy storage unit is lower than the proposed Ocotillo Facility. Energy storage uses electricity as a fuel source and has proven efficiencies greater than 90%. If natural gas combined cycle units that currently turn down or cycle-off overnight are used to charge energy storage, the emissions reduction impact would be 30% lower compared to the
23 Texas to Host 317 MW of Compressed Air Energy Storage, http://www.greentechmedia.com/articles/read/texas-calls-for-317mw-of-compressed-air-energy-storage2 24 EPA Grants Permit for Texas Gas Plant, April 17, 2014, Compressed Air Energy Storage Project, http://www.elp.com/articles/2014/04/epa-grants-permit-for-texas-gas-plant-compressed-air-energy-storage-project.html. 25 http://yosemite.epa.gov/r6/Apermit.nsf/AirP 26 Exhibit 4. Chamisa CAES Statement of Basis, Prepared by Region 6 February 2014. Available at: http://yosemite.epa.gov/r6/Apermit.nsf/AirP. 27 Exhibit 5, APEX Bethel Energy Center, LLC Statement of Basis, Prepared by Region 6 November 2013 at page 12. Available at: http://yosemite.epa.gov/r6/Apermit.nsf/AirP; Exhibit 6, APEX Matagora Energy Center, LLC Statement of Basis, Prepared by Region 6 January 2014 at page 12. Available at: http://yosemite.epa.gov/r6/Apermit.nsf/AirP

8
Ocotillo LMS100 simple cycle unit operated at 50% load,28 including losses associated with charging and discharging. The first table below illustrates the difference in emissions rates for an efficient natural gas combined cycle plant and the proposed Ocotillo simple-cycle combustion turbine at 50% load. The second table shows the reduction in emissions from replacing one MWh of electricity from the LMS100 with the equivalent amount of electricity from energy storage, charged using a natural gas combined-cycle plant (NGCC).
Emissions Rate (lbs/MWh) CO2 NGCC 825 Simple-Cycle 1300
An energy storage system with a 90% round-trip efficiency would require 1.11 MWh of
energy provided from an NGCC to replace 1.0 MWh of energy from a simple-cycle combustion turbine, but still creates a 30% emissions reduction compared to using the peaker.
Emissions (lbs) CO2 Charge (NGCC) 916 Discharge (Simple Cycle, avoided)
( 1300 )
Reduction ( 384 ) % Reduction -30%
These calculations show that a zero-emission discharge energy storage unit such as a battery
would provide energy at a 30% lower GHG emission rate, even when considering the re-charge of the battery. The GHG emissions decrease would be even more significant if one assumes that the charge of the battery relies on excess renewable energy generation during periods of over-generation, which is an issue that APS expressly stated is likely to occur on its system.29 The County must consider modern energy storage units in step 1 of the BACT analysis. The GHG BACT analysis must be revised to include project- and site-specific analyses of both CAES and battery energy storage options.
Energy storage is a zero-carbon or low-carbon alternative that can meet most, if not all, of the peaking capacity needs in this case. If, as the Applicant states, the purpose of the Project is to provide temporary peaking capacity to interface with its renewables portfolio, then energy storage units may provide that service with far lower emissions. Energy storage is particularly attractive for a system such as APS’, where a high amount of low-marginal cost solar is frequently available. Any excess generation or low-cost generation from solar during non-peak
28 For purposes of this calculation, Sierra Club assumes that an energy storage unit would displace operation of the LMS100 at 50% load. The emissions reductions would be even greater where the energy storage unit replaced the LMS100 at 25%, which the Applicant asserts is a necessary capability of the LMS100. 29 Exhibit 2, Rhorer Testimony at p.8. (“APS identifies over-generation as a concern or ‘need’ that the proposed Ocotillo Modernization Project will supposedly help to address.”)

9
periods could be used to charge the energy storage units. In turn, when solar is constrained or loads exceed supply, the energy storage units can respond within seconds or milliseconds to provide capacity.
4. Requirement to Incorporate Energy Storage Does Not Redefine the Source
Including energy storage, either paired with the LMS100 gas turbines or in lieu of the turbines, does not constitute “redefining the source.” A requirement to consider energy storage would not change the underlying business purpose of the facility, nor would it require a completely different fuel source. The Environmental Appeals Board (EAB) recently reminded permitting agencies that they must carefully consider projects that include cleaner fuels or operating configurations. “The Board has cautioned that permitting authorities should not simply dismiss alternative control options, such as cleaner fuels, as constituting redesign, thereby creating an ‘automatic BACT off-ramp’ from further consideration of the option.” La Paloma Energy Center, 16 E.A.D. ___, 26 (EAB 2014). The permitting authority must make a case-specific assessment about the feasibility of incorporating energy storage into the design of the Ocotillo Project. The BACT analysis for Ocotillo is completely silent as to energy storage, and as such fails to even consider a feasible control alternative.
Incorporating energy storage into the plant design would increase the overall fuel efficiency and reduce emissions from the plant. Incorporation of energy storage would reduce the air pollution emissions per unit of electricity generated without changing the fundamental purposes of the plant. See e.g., PSD Permitting Guidance for Greenhouse Gases at 30 (“EPA recommends that permitting authorities consider technologies or processes that not only maximize the energy efficiency of the individual emitting units, but also process improvements that impact the facility’s energy utilization assuming it can be shown that efficiencies in energy use… lead to reductions in emissions from the facility.”).
The applicable law requires that BACT limits be established based on the maximum degree of pollution reduction achievable with a number of specified methods, including cleaner and innovative production processes and cleaner fuels. 42 U.S.C. § 7479(3) (BACT includes “available methods, systems, and techniques, including clean fuels, fuel cleaning or treatment or innovative fuel combination techniques for control of the air contaminant.”); 40 C.F.R. § 52.21(b)(12) (same). As a matter of policy, EPA has generally not required a permittee to consider an inherently lower polluting process or practice that would “redefine the design of the source.”30 In determining whether an alternative would redefine the source, the permitting authority should look at “how the applicant defined its goal, objectives, purpose or basic design for the proposed facility in its application [… and] then take a ‘hard look’ at the applicant’s proposed design in order to discern which design elements are inherent for the applicant’s purpose and which design elements may be changed to achieve pollutant emissions reductions without disrupting the applicant’s basic business purpose for the proposed facility.”31 In determining the facility's basic design, the permitting authority should look at how the project is
30 NSR Manual at B.13-.14. 31 U.S. EPA, PSD and Title V Permitting Guidance for Greenhouse Gases (“GHG Permitting Guidance”) 26 (March 2011).

10
described in the application and supporting materials. La Paloma Energy Center, 16 E.A.D. ___, 26 (EAB 2014).
Thus, the “redefining” policy does not shield an applicant from having to alter its design to use a cleaner process, particularly where the redesign would still meet the applicant’s basic business purpose. As the Seventh Circuit held, discussing the clean fuels provision in the BACT definition but equally applicable to the cleaner production processes component of the BACT definition, there must be some adjustment allowed to an applicant’s design or the BACT definition’s requirement to consider cleaner processes, fuels, and methods to reduce pollution would be rendered meaningless. Sierra Club v. EPA, 499 F.3d 653, 656 (7th Cir. 2007) (“Some adjustment in the design of the plant would be necessary in order to change the fuel source… but if it were no more than would be necessary whenever a plant switched from a dirtier to a cleaner fuel the change would be the adoption of a ‘control technique.’ Otherwise ‘clean fuels’ would be read out of the definition of such technology.”); see also In re Desert Rock Energy Company, LLC, PSD Appeal Nos. 08-03 through 08-06, Remand Order at 63 n.60 (EAB, Sept. 24, 2009) (quoting Sierra Club, 499 F.3d at 655); PSD Guidance for Greenhouse Gases at 26 (noting that the redefining policy “does not preclude a permitting authority from considering options that would change aspects (either minor or significant) of an applicant’s proposed facility design in order to achieve pollutant reductions…”).
The Environmental Appeals Board recently considered this question with respect to Sierra Club’s recommendation to consider a hybrid solar energy-natural gas plant. The Board ultimately determined that site-specific constraints eliminated a hybrid alternative. However, the Board noted that the Region cannot reject a hybrid design proposal out of hand, and instead must take a “hard look” at the underlying business purpose of the project and the site-specific constraints that might exist.
The Region’s explanation comes very close to suggesting that adding supplemental solar power generation is always redesign if the applicant does not propose it in the first place. Such a bright line, “automatic BACT off-ramp” approach is not consistent with the NSR Manual, the GHG Permitting Guidance, or Board precedent, all of which suggest that a case-specific assessment of the situation be made in concluding that a proposed control option would redefine a particular source.
La Paloma Energy Center, 16 E.A.D. ___, 29 (EAB 2014).
In contrast to the La Paloma recommendation to consider solar power, energy storage is not a fuel; rather, it is a design of the project that would allow the Applicant to meet the project needs with lower or zero fuel combustion, and therefore lower or zero emissions of GHG and other pollutants. The size, modularity, and flexible capabilities of energy storage units match the stated technical requirements of the Project. Furthermore, integrating energy storage into the design of the Ocotillo Power Plant could increase the inherent efficiency of the LMS100 units by mitigating the need to operate at low loads.

11
APS described its business purpose for the Ocotillo Project in both the Application and in supporting material provided as hearing exhibits during the siting process.32 As a basis for rejecting various technical options, the Application identified the following technical requirements:
Ability to achieve peak power of 102 MW. High plant efficiency over the operating range of the generators. Quick start capability to ramp from 0% output to 100% in 10 minutes or less. Must serve peaking loads at all times of the day and night. Performance in high ambient temperature conditions.
APS’s Director of Resource Planning, James Wilde, described the overall business need for
the Ocotillo Project more broadly. Specifically, Mr. Wilde stated that the project was needed for the following reasons:
APS resource portfolio needs peaking generation. Fast-growing renewable generation is variable, requiring the addition of flexible
generation resources to respond quickly. Flexible generation allows APS and its customers to benefit from market
opportunities.33
Energy storage units can meet each of these criteria with much lower emissions of both GHGs and other pollutants. Thus, energy storage should have been listed in step 1 of the BACT analysis.
Peaking Generation – Energy storage units can be built in a wide variety of sizes. Many are small and modular, allowing the user to size the project to particular needs. Energy storage can also be paired with natural gas fired thermal units to provide extra peaking capacity while maintaining a lower overall emissions profile and fast response time. For example, PowerSouth’s McIntosh Power Plant currently includes four natural-gas fired combustion turbines and a 110 MW Compressed Air Energy Storage (CAES) unit.34 The plant is specifically designed to meet peaking needs, similar to Ocotillo, though the total plant size is much larger when the attached thermal combustion units are included. Other similarly sized plants include the recently permitted Apex and Chamis CAES plants in Texas, which will be between 270-317 MW.
Other storage facilities demonstrate a high level of flexibility and generation output. Another example is AES’s Laurel Mountain facility in West Virginia, which pairs 98 MW of wind generation with the equivalent of 64 MW of integrated battery-based storage resource.35 AES Energy Storage recently announced a power purchase agreement with Southern California Edison to provide 100 MW of battery-based energy storage capable of providing 400 MWh of
32 Exhibit 7, Witness Presentation Slides for James Wilde (“Wilde Presentation”), Sept. 9, 2014, Arizona Power Plant and Transmission Line Siting Committee, Dkt. 14-0292-00169. 33 Exhibit 7, Wilde Presentation at L-3. 34 http://www.powersouth.com/mcintosh_power_plant 35 See, Exhibit 8. Available at: http://www.aesenergystorage.com/wp-content/uploads/2014/03/FINDING_THE_HIDDEN_MEGAWATTS_FINAL.pdf

12
energy.36 This system could therefore provide 100 MW of peaking capacity for a period of four hours.
Energy storage is well suited to meet peaking needs because, unlike baseload units, peaking units are needed only to meet high loads for a few hours. Mr. Wilde included the following chart in his presentation addressing the need for the Ocotillo Project:37
This chart shows the benefits that energy storage can provide to APS’ system. The difference between the relatively flat 2014 line and the spiked 2029 line shows the need that the Ocotillo Project is intended to meet. The dip in net load between 9 am and 5 pm in 2029 is the result of over-generation due to renewables. Mr. Wilde noted that during this period, APS would have to significantly reduce dispatch of conventional resources. However, if energy storage were included, those conventional resources could continue to dispatch at higher, more efficient loads so that the energy storage units could be charged. As the peak increases from around 7 PM to 11 PM, both due to increasing demand and lower solar output, the energy storage units could instantly switch to discharge mode and provide a zero-emission peaking resource.
36 http://www.aesenergystorage.com/2014/11/05/aes-help-sce-meet-local-power-reliability-20-year-power-purchase-agreement-energy-storage-california-new-facility-will-provide-100-mw-interconnected-storage-equivalent-200-mw/ 37 Exhibit 7, Wilde Presentation at L-9.

13
High Plant Efficiency – APS asserts that it requires high plant efficiency to meet its needs, yet it requested a BACT GHG limit that assumes a low efficiency based on 25% loads. Energy storage units could provide much higher efficiency than the proposed LMS100 units across all operating loads. If paired together with a simple cycle unit, energy storage could fill the gap in generation needs during a peaking event until the LMS100 units were able to come online at 100% load, which would correspond to the LMS100’s highest efficiency. Even on its own, a 100 MW energy storage facility could provide peaking capacity for up to four hours or more, depending on how it was designed.
The overall emissions of such a configuration would be vastly improved. Many energy storage units do not use fuel, and therefore the efficiency of the units exceeds the proposed natural gas units over the operating ranges. A 100% battery energy storage plant could discharge with zero emissions. CAES plants use only a small amount of fuel to heat the compressed air as it expands. Even if a hybrid plant is considered, the overall efficiency of the plant would still increase compared to the current proposal because much of the generation supply would be provided with a less or no fuel storage unit. The charge of the unit, as discussed above, would depend on the emissions of the grid feeding into it. If the grid is operating with a high penetration of renewables, as APS claims would be the case, then the overall charge of the battery would be accomplished with a mix of low GHG resources.
Generation Output Turndown – Energy storage units provide greater turndown flexibility than the proposed natural gas units. Battery units are instantly available and have no p-min (i.e. they can turndown to any output). This eliminates the need to idle the LMS100 units at 25% load, which is extremely inefficient. Other types of energy storage technology have comparable or better turndown efficiencies to the proposed LMS100 turbines. Dresser-Rand, the manufacturer of the PowerSouth CAES unit, has noted that the 110 MW CAES unit can turndown to 10 MW38, which is much lower than the LMS100 turbines, which contrary to assertions elsewhere in the Application, cannot be operated at loads below 50%, or about 50 MW. (Ap., Appx. B at p. 25.) Energy storage units actually provide greater flexibility because, unlike thermal units, they can “go negative” and act as load in times of over-generation.
Quick Start – Many types of energy storage units – such as battery - can ramp in less than one second.39 Other technologies such as CAES systems are designed to reach full capacity within 10 minutes.40 Energy storage units are also better than thermal units at cycling because they do not incur the thermal and mechanical penalty associated with quickly ramping up or down. The quick start capabilities also do not produce excess emissions in startup, and therefore there is no emission penalty during quick ramps. In contrast, APS noted in its Application that the LMS100 turbines will not achieve full emissions control until approximately 30 minutes. (Ap., p. 19.) This means that during periods of quick-ramp, the turbines would produce higher
38 See, Exhibit 9, Dresser Rand CAES Document at page 3. Available at: https://www.dresser-rand.com/literature/general/85164-10-caes.pdf 39 See, Exhibit 10, CESA Presentation at page 34. Available at: http://www.storagealliance.org/sites/default/files/Presentations/VDE%20Keynote%20Janice%20Lin%202014-03-26%20FINAL.pdf 40See, Exhibit 9, Dresser Rand CAES Document at page 3. Available at: https://www.dresser-rand.com/literature/general/85164-10-caes.pdf (page 4)

14
emissions. The County must consider this emissions penalty in comparing the gas turbines to storage options.
Low Water Usage – Most storage technologies do not require any substantial water usage because the energy is stored either as compressed air, chemically in batteries, or other methods that do not require steam generation. The proposed LMS100 turbines require significant amounts of water for cooling, pumped from existing wells. The CEC Application acknowledges that “[l]ong-term groundwater use is a major concern for APS, as well as the State of Arizona, because of the arid climate and minimal natural recharge in the Phoenix area.”41
Serving Peaking Loads at Any Time of Day or Night – Energy storage units have a high level of availability 24 hours per day. For example, the Laurel Mountain battery storage unit described above has a 95% availability rating.42 The intermittent availability of wind or solar resources does not affect energy storage.
Black Start – Black start refers to the initial power supply required to rebuild a power grid after a full blackout. Dedicated, 100-percent-reliable power sources are needed to provide this emergency energy, since standard plants themselves require some electricity for startup operations. A 2011 study by the Boston Consulting Group found that for many storage technologies, including CAES, black starts are both technically feasible and in some instances economical when compared to diesel backup.43 For Ocotillo, energy storage by itself could provide the necessary black-start capabilities. Similarly, a paired configuration of LMS100 turbines and storage would clearly provide black start capability because both the storage components and the LMS100 components could provide black start capability.
Performance in High Ambient Temperatures – Energy storage typically does not suffer a penalty from high temperature environments. For example, CAES output is not affected by temperature.44 The proposed LMS turbines, on the other hand, suffer a significant temperature penalty, requiring inlet cooling. (Ap., Appx. B, Tables B6-7 & B6-9.)
Low Load Operation – The GHG emission limit is based on emissions at steady state loads of 25% of maximum output capability of the turbines. Energy storage would eliminate the need to operate the gas turbines at low loads, improving the overall efficiency of the plant and significantly reducing GHG and other criteria pollutant emissions.
Overall, energy storage or a paired energy storage-LMS100 unit design, offers all of the technical attributes required for the Project. Replacing any or all of the proposed five LMS100 gas turbines with storage will reduce GHG and other criteria pollutant emissions from the entire plant.
In addition to meeting all of the technical specifications identified by APS in the Application, energy storage would also provide additional benefits and ancillary services.45 Energy storage
41 Exhibit 11, CEC Ap., Exhibit B2, p.B2-1. 42 http://energystorage.org/energy-storage/case-studies/frequency-regulation-services-and-firm-wind-product-aes-energy-storage 43 See, Exhibit 12, Boston Consulting Group “Revisiting Energy Storage” 2011, at page 7-8. Available at: http://www.abve.org.br/downloads/bcg_-_revisiting_energy_storage.pdf 44 See, Exhibit 9, Dresser Rand CAES Document at page 3. Available at: https://www.dresser-rand.com/literature/general/85164-10-caes.pdf (page 5) 45 http://www.aesenergystorage.com/advancion/advantages/

15
provides more flexibility to allow APS to match its renewables portfolio. It would also protect APS from market risks because it would allow APS to charge the units during periods of over-generation rather than selling surplus power at low to negative prices.46 Customers could therefore benefit from low or negative priced power. The ability to act as both generation and load provides greater grid flexibility. The marginal cost of providing peaking service is also much lower than the LMS100 gas turbines proposed by APS. When taken together, the generation benefits and ancillary services make energy storage cost competitive with simple-cycle peaking units.
Neither the Applicant nor the County considered either a full energy storage facility or a hybrid energy storage-LMS100 facility. BACT step 1 requires the permitting agency to identify “all available control technologies.” Energy storage technology could feasibly meet the business purpose of the Applicant to provide peaking capacity, reliability, and integration of renewable resources. It is also commercially available, as demonstrated by the projects referenced above, as well as numerous other storage projects not addressed. The County must include energy storage as an identified technology for providing energy services for purposes of its GHG BACT analysis.
The County must, at a minimum, consider energy storage as an available technology in step 1 of the BACT analysis, and it may only reject energy storage if it makes a detailed, process- and site-specific showing that the cleaner process does not constitute BACT.
5. Smaller Unit Options Omitted
As discussed above, the Applicant’s basis for setting the GHG limit at 1,690 lb/MWh is premised on the asserted need to operate each unit at 25% loads. This is an extremely inefficient use of a simple-cycle turbine and leads to much higher GHG emission rates. The BACT analysis should have considered the incorporation of small units operating at high efficiencies in lieu of allowing the LMS100s to operate at 25% load. The five new LMS100 gas turbines are all 102 MW units. The Applicant asserts that meeting the Project’s goals would require partial load operation of one or more of these units when demand is low. A combination of smaller units and a smaller number of 102-MW LMS100 units could meet Project goals while improving efficiency and reliability. Smaller units could be operated at 100% efficiency when demand is low, rather than operating a 102 MW turbine at 25% load. A 25 MW turbine, for example, could be operated at 100% load, rather than operating a 102 MW unit at 25% load. This would greatly improve efficiency, reducing GHG and other criteria pollutant emissions. Further, smaller units could be added incrementally during Project buildout, to more closely align with projected growth.47
6. Combustion Options Omitted
The Ocotillo project proposed to use an inefficient configuration of the LMS100 turbines compared to other available options. The BACT analysis lists “good combustion, operating, and maintenance practices” as one of the potential control options for GHGs. (Ap., Appx. B, p. 36.)
46 Exhibit 7, Wilde Presentation at p. L-11. 47 Exhibit 2, Rhorer Testimony, p. 9.

16
However, it does not list individual combustion options, but rather only discusses the option that was selected – the LMS100 turbine using water injection. (Ap., Appx. B, Sec. 6.4.2.)
The LMS100 gas turbines selected for the Project come in different “models” or “configurations” that have different efficiencies, heat rates, and electrical outputs, and thus different GHG and other emissions. The Applicant chose the LMS100, Model PA – 60 Hz, with an efficiency of 43% and a heat rate ISO full load gross of 8,939 BTU/kWh HHV. (Ap., p. 14.) This model uses a water-injected single annular combustor (SAC with water injection). It is the least efficient, and thus highest emitting, of the available LMS100 models. The available LMS models are summarized in Table 1 from a GE brochure:
Table 1 Simple Cycle Gas Turbine 60 Hz Applications48
Model Output (MWe)
Heat Rate (BTU/KWH)
Efficiency %
DLE 98.7 7509 46 SAC (w/Water) 102.6 7813 44 SAC (w/Steam) 102.1 7167 48 STIG 112.2 6845 50
This table shows that the LMS100 also is available with a steam-injected single annular combustor (SAC), a dry low emissions (DLE) combustor, and as a Steam Injected Gas Turbine (STIG).49 All of these options are capable of fast starts (0 to 100% in 10 minute); high efficiency (>43%); fast response (50 MW per minute ramp-up); high part load efficiency; meet the peak load of 102 MW; are capable of multiple daily starts with no maintenance penalties; and have high availability and reliability. Thus, all of these options, based on the same LMS100 turbine, but with different “low combustion options,” satisfy the Project’s requirements.
All of these options are more efficient than the LMS100 Model PA-60Hz selected for the Project. Thus, all of the combustion options have lower GHG and other emissions than the selected option, as they are able to produce the same amount of electricity by combusting less natural gas. A proper BACT analysis should have identified all of these options and among them, listed the STIG option as the top LMS100 turbine option.50 Some of these combustion options
48 GE Power Systems, GE’s New Gas Turbine System: Designed to Change the Game in Power Generation, November 2003, Performance at generator terminals: NOx = 25 ppm; 59 F, 60% relative humidity, 0”/0” inlet/exhaust losses and natural gas (LHV = 19,000 Btu/lb). http://www.dec.ny.gov/docs/permits_ej_operations_pdf/atechspecs.pdf 49 GE Power Systems, GE’s New Gas Turbine System: Designed to Change the Game in Power Generation, November 2003, http://www.dec.ny.gov/docs/permits_ej_operations_pdf/atechspecs.pdf and GE Energy, New High Efficiency Simple Cycle Gas Turbine – GE’s LMS1000, June 2004, http://site.ge-energy.com/prod_serv/products/tech_docs/en/downloads/ger4222a.pdf. 50 See, La Paloma Energy Center, LLC, 16 E.A.D. ___, PSD 13-10 at 21 (deferring to the permitting authority’s discretion to select among various turbine models where the permitting authority had included a rational basis for its determination on the record).

17
are mentioned in the BACT analyses for PM/PM2.5, NOx, and CO, but are improperly eliminated based on misinformation.
The NOx BACT analysis is the most specific, arguing that water injection was selected due to its ability to achieve higher peak power output than steam injection or DLN combustors. The NOx BACT analysis failed to acknowledge STIG. It claimed that water injection increases the mass flow through the turbine, increasing power output, especially at higher ambient temperatures when peak power is often required. While this is true, steam injection and STIG also increase power output for the same reason, but to an even greater degree. The DLN combustor was reported to have a maximum gross electric output of 99 MW, versus 103 MW for water-injected combustors. (Ap., Appx. B, pp. 24-25.) A similar, though less specific peak power argument is made in the PM/PM2.5 BACT analysis (Ap., Appx. B, p. 25) and the CO BACT analysis (Ap., Appx. B, p. 13).
The peak power argument asserted by the Applicant for non-GHG emissions is misleading and cannot be used to eliminate the more efficient and lower emissions options of the LMS100 turbines. First, the BACT analyses argue water injection would allow up to 103 MW output, while the CEC Application (CEC Ap., pp. ES-1/2) and Draft Permit both list the LMS100s as 102 MW turbines (Draft Permit, p.33). Further, all of the rejected combustion options, except the DLN combustor, can achieve higher peak output than water injection, while simultaneously achieving lower emission rates, improved energy efficiency, and reduced environmental impacts. Steam injection, for example, achieves a maximum power output of 102.1 MWe and STIG achieves 112.2 MWe, meeting the peak power goal of 102 MW listed in the Draft Permit. (Draft Permit, p.33.) Thus, the peak power goal could be easily met by selecting other LMS100 combustion options, such as STIG, which are more efficient and thus have lower emissions. Further, the record contains no demonstration that peak power goals cannot be achieved using more than one turbine model.
B. Step 2 of the GHG Top-Down Analysis Is Flawed Step 2 of the BACT analysis directs the permitting authority to eliminate technically
infeasible control options. “A demonstration of technical infeasibility should be clearly documented and should show, based on physical, chemical, and engineering principles, that technical difficulties would preclude the successful use of the control option on the emissions unit under review.” NSR Manual, p. B.6. The step 2 analysis in the Ocotillo BACT analysis improperly eliminated combined cycle gas turbines. (Ap., Appx. B, p. 38.)
The GHG BACT analysis concluded that combined cycle turbines were technically feasible
for the Project, but rejected them in step 2 on the grounds that they “would change the project in such a fundamental way that the requirement to use these technologies would effectively redefine the Project.” (Ap., Appx. B, p. 36.) However, the record shows that the Applicant has defined the Project specifically to skirt GHG BACT, rather than to satisfy necessary Project goals.
The GHG BACT analysis rejected highly efficient combined cycle plants in step 2 as technically infeasible. (Ap., Appx. B, Table B6-6, p. 42.) The BACT analysis argues that the purpose of the Project “is to construct peaking power capacity” that can start quickly, even under “cold” start conditions, that can repeatedly start and stop as needed, and that can reduce output to provide spinning reserve when necessary. The BACT analysis claimed combined-cycle turbines

18
cannot meet these requirements, even with new fast-start, combined cycle technology, which it asserted requires more than 3 hours to achieve full load, compared to about 30 minutes for the LMS100 simple cycle turbines. (Ap., Appx. B, pp. 38-39.) The factual assertions made by the Applicant regarding fast-start combined cycles are wrong and cannot be used to eliminate combined cycle turbines in the BACT analysis.
Reducing GHG emissions is directly related to minimizing the quantity of fuel required to make electricity. Thus, the more efficient a turbine, the less fuel it uses to generate the same amount of electricity and thus the lower emissions, including GHG, NOx, CO, and PM/PM10. The BACT requirement is defined as “the maximum degree of reduction for each pollutant.” 42 USC 7479(3). Therefore, the top-down BACT analysis requires the County to select the lowest emitting technology as the basis for setting the BACT emission limit. In this case, the simple-cycle turbine option, the LMS100, model PA – 60 Hz, selected by the Applicant is much less efficient than other models of the LMS100 (discussed above) and it is less efficient than modern combined-cycle units.
This dismissal of recognizable and achievable energy efficiency gains is contrary to EPA’s PSD and Title V Permitting Guidance for Greenhouse Gases, which expressly addresses an example of energy efficiency at a coal plant:
In general, a more energy efficient technology burns less fuel than a less energy efficient technology on a per unit of output basis. For example, coal-fired boilers operating at supercritical steam conditions consume approximately 5 percent less fuel per megawatt hour produced than boilers operating at subcritical steam conditions.51
The EPA guidance makes clear that energy efficiency must be considered in the BACT analysis. The NSR Manual further provides: “The reviewing authority…specifies an emissions limitation for the source that reflects the maximum degree of reduction achievable…” (NSR Manual, p.B.2 (emphasis added). Without a showing that the most efficient design is either technically infeasible or that it should be eliminated due to disproportionate site-specific energy, economic or environmental impacts, the County must set the GHG BACT emission rate limit based on the most efficient turbine design.
A lower emitting control technology for generation of electricity from fossil fuels is combined cycle natural gas generation with inlet cooling. As demonstrated below, combined cycle gas turbines commonly perform peaking functions in U.S. generating systems.
There are a number of commercially available units from reputable manufacturers that are capable of (1) greater full load efficiency; (2) greater part load efficiency; and (3) ample ramp
51 PSD and Title V Permitting Guidance for Greenhouse Gases, March 2011, p.21 (citing: U.S. Department of Energy, Cost and Performance Baseline for Fossil Energy Plants - Volume 1: Bituminous Coal and Natural Gas to Electricity, DOE/NETL-2007/1281, Final Report, Revision 1 (August 2007) at 6 (finding that the absolute efficiency difference between supercritical and subcritical boilers is 2.3 percent (39.1 percent compared to 36.8 percent), which is equivalent to a 5.9 percent reduction in fuel use), available at http://www.netl.doe.gov/energyanalyses/pubs/Bituminous%20Baseline_Final%20Report.pdf).

19
rates to respond to the daily fluctuations in demand. These units range in capacity from less than 100 MW to over 900 MW and include the following:
Table 2 Efficient Combined-Cycle GasTurbines
Unit MW (net)
CT/HRSG (MW)
Efficiency (net %)
Heat rate (Btu/kWh)
Part Load Overnight
Alstom KA 24 2x152
664 450/214 59.5 5739 >98% of full load eff. to 80 % load;
95% to 50 % load
450 MW in 10 min.
Mitsubishi M501GAC53
404 264/132 59.2 5763 10 min to 264
Mitsubishi 701G
498 334/164 59.3 575554
Mitsubishi M501J
470 320/140 61.555 5551 10 min to 320/30 min to 460
GE Flex 60 512 339/181 >61 < 5584 >60% efficiency to 87% of load
28 min startup
Siemens SCC6-8000-1S
410 274/136 >60 <5687 <30 min.56
Siemens SCC6-5000F (Lodi)
305 232/73 >57 <5989 70 MW in 10 min; hot/warm start 200 MW in <30 min.
Proposed 5xLMS100
510 510/0 4357 8939 34% efficiency
(80% of full load eff.) at 50% load
10 min.
The County must analyze these combined-cycle units to determine whether the greater
achievable efficiencies constitute BACT for the Ocotillo Project. In this case, the County did not consider any of the available combined-cycle units because it improperly concluded in step 2 that combined-cycle units are technologically infeasible to meet the Project purpose as asserted in the Application. The following sections demonstrate that the County’s conclusion regarding the technical feasibility of combined-cycle units is factually incorrect. The County must therefore revise its BACT analysis for all criteria pollutants to consider the turbines listed above, as well as any other available turbines that can achieve lower GHG (and other criteria pollutant) emissions.
52 A smaller 1x1 configuration is also available. 53 http://www.doosan.com/doosanheavybiz/attach_files/services/power/power_plant/turbine_gas.pdf 54 http://www.mpshq.com/products/gas_turbines/g_series/performance.html 55 www.mhi.co.jp/technology/review/pdf/e491/e491018.pdf 56 http://www.energy.siemens.com/hq/pool/hq/power-generation/power-plants/gas-fired-power-plants/combined-cycle-powerplants/scc5- 8000H/PowerGen_Asia_2012_Bangkok_OneYearCommercialOperation_HClass_Balling_Sfar_Staedtler.pdf 57 Ap., p. 14.

20
1. Operating Hours for Peaking Units Are Too High
The Application states that “the purpose of this Project is to construct peaking power capacity”. (Ap., Appx. B, p. 38.) Elsewhere, it argues that the fundamental purpose of the Project is as a peaking power plant (Ap., Appx. B, p. 36) and that the turbines are “peaking GTs” (Ap., Appx. B, p. 23). The BACT analysis eliminates technically feasible options as it alleges they are not capable of peaking operation. (Ap., Appx. B., pp. 38-39.)
However, the Applicant’s assertion that it needs a “peaking unit” to operate the Ocotillo plant as a peaking facility is contradicted by the actual operating parameters discussed in the Application and required by the Draft Permit. The proposed operating mode is not consistent with peaking operation, and therefore the assumption that combined-cycle units are not appropriate is unsupported. The record shows that the Applicant intends to operate the facility much more frequently and for longer hours than a traditional “peaking” unit. At those higher operating levels, a combined-cycle unit would provide much better efficiencies while still meeting the basic needs of the project to provide quick start and quick ramping capabilities.
The Application does not disclose the assumed number of hours of operation or the capacity factor of the new turbines, factors that distinguish “peaking” units from “combined cycle” units. In fact, the Application asserts it is not proposing limits on hours of turbine operation nor the number of startups and shutdowns to increase operational flexibility. (Ap., p. 17.) Instead, it proposes emission caps that have been incorporated into the Draft Permit as limits on operation.
The assumed number of hours of operation can be back calculated from the emissions by dividing the tons per year per turbine by the pounds per hour per turbine. (Ap., Tables 3-1, 3-2.) This calculation for the major pollutants yields an average of 3,571 hr/yr of normal operation per turbine.58 (Ap., Table 3-1.) In addition, each turbine would undergo up to 730 startups/shutdowns per year, each lasting a total of 41 minutes (30 min startup, 11 min shutdown). (Ap. Table 3-2.) This amounts to 499 hours per year per turbine59 of startup and shutdown. Thus, each turbine is permitted to operate 4,070 hr/yr or 46% of the time.
The Applicant’s proposed operation of the Ocotillo plant deviates substantially from the historical operation of “peaking units.” The annual operating hours for the proposed Ocotillo turbines are much higher than typical peaking units. The available data show that almost all simple cycle turbines have low operating hours. In contrast, the emission calculations for Ocotillo show that each LMS100 turbine would operate approximately 4,070 hrs/yr. Figure 1 shows this level of planned operation is far too high to be considered a “peaker.” The “knee in the curve” in the table below shows that more than 90% of existing simple-cycle units operated at 2,000 hours or less for 2011 (the most favorable60 year for industry), thus showing that operation greater than 2,000 hours is not consistent with the normal operation of combustion turbines in peaking service.
58 Operating hours based on CO2: (202,438 ton/yr)(2000 lb/ton)/113,467 lb/hr = 3,568 hrs; CO: (24.1 ton/yr)(2000 lb/ton)/13.5 lb/hr = 3,570 hrs; NOx (16.5 ton/yr)(2000 lb/ton)/9.3 lb/hr = 3,548 hrs; VOC (4.7 ton/yr)(2000) lb/ton)/2.6 lb/hr = 3,615 hrs; PM (9.6 ton/yr)(2000 lb/ton)/5.4 lb/hr=3,556 hr/yr. Average: [3568+3570+3548+3615+3556]/5 = 3,571 hrs/yr. 59 Startup/shutdown hours: [(31+11)/60]730 = 511 hrs/yr. 60 For 2008, it is closer to 1100 hours.

21
Hours of Operation for Combustion Turbines, by Year61
This analysis suggests that the Ocotillo Project is designed to primarily supply base load and intermediate load, rather than peaking load. Thus, the Project’s goals could be achieved with different turbines, or a different mix of turbines (e.g. a portion true peakers and a portion of conventional combined cycle turbines). For example, APS could configure two of the five units as a combined-cycle design, thereby increasing the efficiency of those units while maintaining the fast-start capabilities of the simple-cycle units.
General Electric defines “peaking” units in terms of an average hour of operation per startup. GE Performance defines base load as operation at 8,000 hours per year with 800 hours per start. It then defines peak load as operation at 1,250 hours per year with five hours per start.62 Thus, if APS really wants to build a “peaking” unit – and thereby eliminate other more efficient non-peaking technologies – the County should set BACT limits based on no more than 2,000 operating hours per year to ensure that the proposed simple cycle turbines are used as true peaking units rather than as base load or intermediate load units. If, on the other hand, APS plans to operate the five new LMS100 turbines for more than 2,000 hours per year, then the BACT analysis must consider alternative electricity generation technologies, such as combined cycle, 61 First year of operation 2006 or later, as determined by earliest occurrence of CAMD CEMS data. This data is included in Appendix D. 62 Brooks, F., GE Power Systems, GE Gas Turbine Performance Characteristics, GER-3567H, p.14 (available at: http://www.muellerenvironmental.com/documents/GER3567H.pdf.)
0
10
20
30
40
50
60
70
80
90
100
0 500 1000 1500 2000 2500 3000 3500 4000 4500 5000
Per
cent
age
of U
nits
with
Low
er O
pera
tion
Hou
rs
Operation Hours Per Year
Natural Gas Simple Cycle Operation Hours for Units Reporting 12 Months, Units Online 2006 and Later
2006 2007 2008 2009 2010 2011 2000 Hours
2000

22
that can operate more efficiently and therefore at lower GHG (and other criteria pollutant) emission rates.
There are numerous examples of other facilities with lower emissions of GHGs that operate in the range of hours proposed by APS for the Ocotillo plant. In comments on EPA’s proposed New Source Performance Standards, Sierra Club and other environmental commenters compiled data on the actual emissions performance of all simple-cycles (CTs) and combined cycle (CCGTs) in the United States based on their annual hours of operation in 2012. Those data, split into different operational categories, are below:
Table 3: Aggregate Emissions Data for CTs and CCGTs by Annual Hours of Operation Source: 2012 CAMD Data Set
2012 Emission rate (lb/MWh) ‐ key statistics
CT + CCGT > 4,000 hrs gross/net
CT + CCGT 1,200‐4,000 hrs gross/net
(average operating hours)
CT + CCGT < 1,200 hrs gross/net
(average operating hours)
average of all units
995/1,025 1,080/1,112 (2,561) 1,368/1,409 (438)
median 879/905 978/1,007 (1,353) 1,321/1,361 (204) average of top 10 percent
767/790 803/827 (2,692) 1,019/1,050 (589)
90th percentile unit
800/824 827/852 (2,799) 1,131/1,165 (477)
average of top 20 percent
789/813 822/847 (2,994) 1,164/1,199 (528)
80th percentile unit
818/843 849/874 (3,576) 1,189/1,225 (457)
average of bottom 10 percent
1,466 1,501 (2,416) 1,900 (308)
average of bottom 10‐20th percent
1,303 1,349 (2,997) 1,582 (346)
This table shows that in the operating range of 1,200 hours to 4,000 hours annually, the average unit that exists in the fleet today achieves a gross emission rate of 1,080 lbs CO2/MWh (gross). In contrast, for Ocotillo, which could operate roughly 4,000 hour each year as currently proposed, the proposed GHG BACT limit is 1,690 lb CO2/MWh. This proposed limit is worse than the bottom 10 percent of actual emissions from currently operating natural gas units in the United States. It is contrary to BACT to set an emissions limit for a new major source of GHG emissions at a rate that more than 90 percent of the existing fleet is already exceeding. The NSR Manual suggests that for categories of controls that have a range of emission rates, the most

23
recent permit limits or emission data be used to represent the category.63 The best-in-class emission rate can then represent the entire class of similar control options all the way through the process to the setting the emission limit without having to determine the bottom of the range for options in the same category.
Even assuming a generous compliance margin, the County should set the GHG emissions limit for Ocotillo based on the top-performers of similarly situated facilities. At a minimum, the County must explain in the BACT analysis why site-specific limitations at the Ocotillo facility prevent it from achieving a 12-month average GHG emission rate that is worse than almost all other natural gas units in the country.
2. Combined-Cycle Turbines Are Technically Feasible to Meet the Project’s Generation Requirements
The County and APS improperly rejected combined-cycle technology in step 2 of the BACT analysis on the grounds that allegedly longer startup times are incompatible with the ramping needs of the proposed Project:
“Even with faster-start technology, new combined-cycle units may require more than 3 hours to achieve full load, as compared to approximately 30 minutes to full electric output for the proposed GE Model LMS100 simple cycle gas turbines. The long startup time for combined cycle units is incompatible with the purpose of the Project which is to provide quick response to changes in the supply and demand of electricity in which these turbines may be required to startup and shutdown multiple times per day.” (Ap., Appx. B, p. 39.)
Elsewhere, the BACT analysis relies on a 10-minute startup time to reject combined cycle turbines, even though its emission calculations assume a 30-minute startup time. (Ap., Table 3-2.) The County did not investigate whether the startup time of combined cycle units is 30 minutes or whether there was any evidence to support the need for a 10-minute startup time.64
APS cannot simply claim, without providing evidence, that its needs can be met only by this specific turbine design based on startup times. Such a claim is an overly narrow description of the source that would undermine the BACT analysis of other feasible technologies. See Pio Pico Energy Center, 16 E.A.D.___, 67 (2013) (“Sierra Club’s fear that applicants and permit issuers could so narrowly define the source type they consider in step 2 as to make all other control technologies infeasible is well taken”). Even if there was such a need, the evidence provided below with respect to modern combined-cycle turbine capabilities and the LMS100 STIG option shows that more efficient combined-cycle units are capable of meeting a 10-minute startup.
63 NSR Manual at B.23. 64 Ap., Appx. B, p. 36 (“…new combined-cycle units may require more than 3 hour to achieve full load, as compared to approximately 10 minutes to achieve the full rated electric output for the proposed GE Model LMS100 simple cycle gas turbines”); p. 51 (“For these GE Model LMS100 simple cycle GTs, the length of time for a normal startup, that is, the time from initial fuel firing to the time the unit goes on line and water injection begins, is normally about 10 minutes..”).

24
In fact, there is substantial evidence demonstrating that this assertion is both inaccurate and unrepresentative of the actual needs of a utility system. It also fails to assess the modern capabilities of combined-cycle units before even reaching the question of costs. The GHG BACT analysis therefore clearly violates BACT.
For the purposes of reliability and renewable integration, combined-cycle units are fully capable of providing fast-response generation. They are therefore fully capable of matching variable renewable output, and can satisfy load-following and immediate dispatch needs in manner comparable, if not identical, to simple cycle units. Siemens has published documentation showing that its Fast Start 30 is capable of 10 minute starts after an overnight shutdown. Longer times necessary to reach full load are limited to circumstances where an operator elects to shut the unit down for more than 48 hours. There is no technological limitation requiring a unit to shut down for that period of time, but an operator may elect to do so if the unit will not be needed for that duration. However, even under this scenario, full output of the combustion turbines that are components of these units are available within 10 minutes.
Sierra Club queried turbine vendors on the specific question of whether combined-cycle units can meet fast-ramping capabilities of simple-cycle plants. In response, a representative from Siemens responded as follows: “With the application of proper HRSG and steam turbine technology, gas turbines can start up and ramp up just as fast in combined cycle configurations as in simple cycle configurations. This capability was demonstrated in aeroderivative gas turbines quite some time ago. In recent years, the advance of HRSG and SCR technology has allowed the fast starting of heavy frame gas turbines.”65
The Siemens letter also noted that NRG recently commissioned a plant in El Segundo, California in a combined-cycle configuration that is capable of the same startup times (12 minutes) as the same unit in a simple-cycle configuration. A recent press release noted that the El Segundo plant can achieve even faster startup times: “The new plant can deliver more than half of its [550 MW] generating capacity in less than 10 minutes and the balance in less than 1 hour, which is needed as California relies more on intermittent renewable technologies like wind and solar that depend on weather conditions.”66
Combined-cycle units can act as peakers or load-following units by ramping up their combustion turbines very quickly, while still meeting full load simply by warming up the heat recovery steam generator in anticipation of increased demand. This point is important because the “peak” is rarely a surprise. Utilities are quite good at estimating peak demand based on weather and usage patterns. Thus, operators have sufficient time to warm up a combined-cycle unit to meet full-load needs, while at the same time having sufficient flexibility to dispatch units quickly at more than half of their full-load capacities within 10 minutes if an urgent need arises.
There are several other examples of combined cycle units that can meet fast-start and quick ramping times in a manner comparable to simple cycle units. For example, Footprint Power’s Salem Harbor Station will be capable of providing 300 MW of power to the grid “within 10
65 Exhibit 13, October 18, 2013 Letter from Rich Batey to Travis Ritchie; see, also, Exhibit 14, 2013 GTW Handbook Price List (Excerpt). 66 Exhibit 15, Aug. 2, 2013, NRG’s California El Segundo Natgas Power Plant Enters Service

25
minutes” using GE’s 7F 5-series gas turbine with its “Rapid Response” package.67 The plant will reduce greenhouse gases as well as other pollutants including NOx, SO2 and mercury.68 In addition, the plant’s operators have touted its “flexibility” to enable integration of renewables onto the grid.69 See also 7F 5-Series Gas Turbine Fact Sheet (indicating a start time of 11 minutes);70 7F 7-Series Gas Turbine Fact Sheet (indicating start time of 10 minutes).71
Similarly, the proposed Oakley Generating Station in California has been designed with the capability to start up and dispatch quickly with GE’s Rapid Response package.72 The Rapid Response package will allow the plant to start up from warm or hot conditions in less than 30 minutes. The system achieves fast performance by initially bypassing the steam turbine when the gas turbines are first started up. In a conventional combined cycle system, the gas turbine must be held at low load for a period of time while the HRSG is warmed up and steam is gradually fed into the steam turbine to bring it up to operating temperature. This process must occur slowly in order to minimize thermal stresses on the equipment and to maintain the necessary clearances between the turbine’s rotating and stationary components. In the past, this delay necessitated a slow warm-up of the HRSG and steam turbine, which meant that the plant’s gas turbine could not increase load as rapidly as a simple-cycle turbine to quickly provide power to the grid. This method also resulted in increased emissions of air pollutants, including CO2, because the combustion turbine remained at low load—where it operated less efficiently—while the HRSG and steam turbine warmed up. Those constraints are avoidable with today’s technology. The GE Rapid Response system initially bypasses the steam turbine when the combustion turbines are started, allowing them to ramp up quickly and begin providing power to the grid. The steam turbine can then be warmed up slowly without requiring the combustion turbines to remain at low load (except for a short time during cold startups), which is achieved through the controlled admission of steam from the HRSGs into the steam turbine. The Rapid Response package therefore allows the facility to start up and begin providing power to the grid more quickly than a conventional system, achieving enhanced operational flexibility and reduced emissions associated with startups.
Another example of a currently operating facility that uses this technology is the 300 MW Lodi Energy Center, which came online in 2011 and can deliver 200 MW to the grid in 30 minutes.73 The plant can also ramp up and down at a rate of 13.3 MW/min. This flexibility
67 Exhibit 16, Press Release, GE Technology to Repower Footprint Power’s Salem Harbor Station, Reducing Emissions and Ensuring Reliable Electric Service for Greater Boston Area (Nov. 1, 2013), available at http://www.genewscenter.com/Press-Releases/GE-Technology-to-Repower-Footprint-Power-s-Salem-Harbor-Station-Reducing-Emissions-and-Ensuring-Rel-43a6.aspx. 68 Id. 69 Id. 70 GE, 7F 5-Series Gas Turbine Fact Sheet (2012), available at http://www.ge-flexibility.com/ static/global-multimedia/flexibility/documents/7F_5-series_Gas_Turbine_Fact_Sheet_FINAL.pdf. 71 GE, 7F 7-Series Gas Turbine Fact Sheet (2012), available at http://www.ge-flexibility.com/static/global-multimedia/flexibility/documents/7F_7_Series_Product_Fact_Sheet.pdf, 72 See Bay Area Air Quality Mgmt. Dist., Final Determination of Compliance for Oakley Generating Station (Jan. 2011), at 12, available at http://www.energy.ca.gov/ sitingcases/oakley/documents/others/2011-01-21_BAAQMD_FDOC_TN-59531.pdf 73 See Exhibit 17, Isles, Lodi’s 300MW Flex 30 plant ushers in a new era for the US, Gas Turbine World (Sept./Oct. 2012), available at http://www.gasturbineworld.com/assets/sept_oct_2012.pdf ; Exhibit 18, Gawlicki, Lessons from
26
allows the unit to respond quickly to intermittent resources or demand while still complying with stringent California emissions requirements. The Siemens fast-start units are specifically designed to reduce the “thermal shock” or “thermal penalty” associated with ramping combined cycle units up and down. Furthermore, these units are available today, and demand for them is increasing.74 In April 2013, Siemens was awarded a contract for a Siemens Flex Plant 30 fast-start unit at the Panda Temple II plant in Temple, TX.75 Financing has been secured and construction of the plant has commenced.76 Additional fast-response units will be constructed at the Palmdale Hybrid Energy Plant, where they will operate in conjunction with a 50 MW solar facility, and are also planned for inclusion at the proposed Huntington Beach Energy Project.
In addition, units designed by GE and other manufacturers are operating in other countries that, due to higher natural gas prices, have led the way in developing and adopting high efficiency, flexible natural gas-fired electric generating technology. GE asserts that it has orders totaling $1.2 billion for Flex Efficiency for 60 plants in the U.S., Japan and Saudi Arabia – countries that use 60-cycle electricity.77 Likewise, the Severn Power Plant in Wales is capable of providing full load (834 MWh) within 30-35 minutes with a high degree of flexibility to compensate for intermittent resources such as wind.78 The plant is the result of concerted efforts by turbine manufacturers to meet demand for flexible units with better efficiencies and lower emissions. Combined-cycle plants with enhanced flexibility and start-up capabilities have also appeared recently in France, England, the Netherlands, and Portugal.79
Lastly, data indicates that units such as those described above can meet stringent CO2 performance standards even when they undergo frequent cycling. As part of its study of the performance of over three hundred NGCC units, EPA evaluated whether units that cycle more frequently exhibit higher CO2 emission rates. Although the units included in the study pool had a wide range of cycling behavior, ranging from to 1,553 starts per year, EPA found “limited correlation” between the number of starts and CO2 emission rates. In addition, EPA found that the average CO2 emission rate of the ten units that cycled most frequently was 883 lb/MWh, which is very close to our recommended standard for intermediate load units. These results Lodi, Public Utilities Fortnightly (Apr. 2010), available at http://www.fortnightly.com/fortnightly/2010/04/lessons-lodi, attached 74 See Exhibit 19, Siemens takes the early lead in the sale of packaged fast-start plants for the US market, CCJ Onsite-Combined Cycle Journal (Oct. 21, 2012), available at http://www.ccj-online.com/siemens-takes-the-early-lead-in-the-sale-of-packaged-fast-start-plants-for-the-us-market-ge-rounds-out-the-activity-a-distant-second/, 75 See Exhibit 20, Press Release, Siemens receives order for EPC contract for power plant in the United States (Apr. 04, 2013), available at http://www.siemens.com/press/en/pressrelease/?press=/en/pressrelease/2013/ energy/fossil-power-generation/efp201304026.htm. 76 See Exhibit 21, Press Release, Panda Power Funds Secures Financing for Expansion of Temple, Texas Power Plant (Apr. 04, 2013), available at http://newsroom.pandafunds.com/press-release/panda-power-funds-secures-financing-expansion-temple-texas-power-plant 77 See Exhibit 22, Press Release, GE Launches Breakthrough Power Generation Portfolio with Record Efficiency and Flexibility with Natural Gas; Announces Nearly $1.2 Billion in New Orders (Sept. 26, 2012), available at http://www.businesswire.com/news/home/20120926005952/en/GE-Launches-Breakthrough-Power-Generation-Portfolio-Record#.VSb92_nF8zs 78 See Exhibit 23, Balling, Fast cycling and rapid start-up: new generation of plants achieves impressive results, Modern Power Systems (Jan. 11), at 7, available at http://www.energy.siemens.com/hq/pool/hq/power-generation/power-plants/gas-fired-power-plants/combined-cycle-powerplants/Fast_cycling_and_rapid_start-up_US.pdf, 79 See id. at 2.

27
confirm that load-following units are capable of meeting an emission standard that is much more stringent than the 1,000 and 1,100 lb/MWh standards that EPA has proposed.
These examples demonstrate that the feasibility of fast-start and quick-ramping combined-cycle turbines has advanced substantially. It is factually inaccurate to claim that combined-cycle units are incapable of meeting the technical function of a load-following unit. Advances in HRSG technology have allowed for faster response times with reduced or even eliminated thermal penalties. In short, CTs are unnecessary—and unnecessarily dirty—options for intermediate and load-following services. There is simply no technological basis to reject combined-cycle units for the five new Ocotillo gas turbines.
3. Other Utility Operators of Peaking Units Recognize the Ability of Combined-Cycle Units to Serve as Peaking Units.
While neither the County nor APS evaluated potential natural gas fired alternatives to the GE LMS100, it turns out that another permit applicant has done so, for a facility located in the South Coast Air Quality Management District (SCAMD). The County’s BACT/RACT guidance memorandum, “Requirements, Procedures and Guidance in Selecting BACT and RACT,80 specifically notes the Department will accept a BACT control technology for the same category of industry as listed by the South Coast Air Quality Management District (SCAQMD), SJVAPCD, or the BAAQMD, as BACT, forgoing the need for a top-down analysis. (TSD, p. 29.) The BACT analysis for Huntington Beach Energy Plant (HBEP) below was accepted by the SCAQMD and thus should be accepted as BACT for Ocotillo by the County. The applicant for that facility concluded that the GHG BACT limit should be 1,082 lb CO2/MWh (gross).81
The following is an excerpt from the GHG BACT analysis prepared by CH2MHill for the Huntington Beach Energy Plant (HBEP) peaking project which utilizes82 a fast response Mitsubishi 3 x 1 501 D CCGT unit:
The HBEP’s design objectives are to be able to operate over a wide MW production range with an overall high thermal efficiency, in order to respond to the fast changing load demands and changes necessitated by renewable energy generation swings. This rapid response is accomplished by utilizing fast start/stop and ramping capability and the use of the duct burners to bridge the MW production when additional combustion turbines are started (as opposed to the duct burner’s traditional roll of providing peaking power during periods of high electrical demand). At maximum firing rate, the maximum power island ramp rate is 110 MW/minute for increasing in load and 250 MW/minute for
80 Maricopa County Air Quality Management District, Requirements, Procedures and Guidance in Selecting BACT and RACT , July 2010, http://www.maricopa.gov/aq/divisions/permit_engineering/docs/pdf/BACT%20Guidance.pdf 81 Available at: http://www.energy.ca.gov/sitingcases/huntington_beach_energy/documents/applicant/AFC/Volume%202%20Appendices/HBEP_Appendix%205.1D_BACT%20Determination.pdf at p.3-25. 82 The permit applications for the project demonstrate its commercial availability. The project is undergoing California environmental review and commencement of onsite construction is anticipated in 2015.

28
decreasing load. At other load points, the load ramp rate is 30 percent. The HBEP start time to 67 percent load of the power island is 10 minutes, and it is projected that the project will operate at an approximate 40 percent annual capacity factor. The HBEP offers the flexibility of fast start and ramping capability of a simple-cycle configuration, as well as the high efficiency associated with a combined cycle. Therefore, comparison of operating efficiency and heat rate of the HBEP should be made with simple cycle or peaking units instead of combined-cycle or more base-loaded units.
* * * *
The HBEP will be dispatched remotely by a centralized control center over an anticipated load range of approximately 160 to 528 MW for each 3-by-1 power island. Over this load range, the HBEP anticipated heat rate is estimated at approximately 7,400 to 8,000 BTU/kWh lower heating value (LHV) (~ 8,140 to 8,800 BTU/kWh HHV). The HBEP will be able to start and provide 67 percent of the power island load in 10 minutes and provide 110 MW/min of upward ramp and 250 MW/min of downward ramp capability. Comparing the thermal efficiency of the HBEP to other recently permitted California projects demonstrates that the HBEP is more thermally efficient than other similar projects that are designed to operate as a peaker unit. Based both on its flexible operating characteristics and favorable energy and thermal efficiencies as compared with other comparable peaking gas turbine projects, the HBEP thermal efficiency is BACT for GHGs.83
In the course of its analysis CH2MHill produced an analysis of the heat rate for the 501 DA fast response CCGT proposed compared to the LMS100 units across the anticipated range of outputs. In this analysis it can be seen that as each LMS unit comes on line the system suffers a substantial penalty for part load performance compared to the 501 DA and that across the entire anticipated load range the 501 DA demonstrates a lower (more efficient) heat rate.
83 BACT Determination for the Huntington Beach Energy Project http://www.energy.ca.gov/sitingcases/huntington_beach_energy/documents/applicant/AFC/Volume%202%20Appendices/HBEP_Appendix%205.1D_BACT%20Determination.pdf (page 3.24).

29
CH2MHill also provided a graphic illustration of the startup and ramp rate of the proposed Mitsubishi fast response unit.

30
This analysis of the HBEP plant demonstrates that more efficient, lower polluting technology is available for peaking service. The County must consider these data in determining the appropriate BACT limit for the Project. The County cannot simply rely on the Applicant’s own assertions and data that its preferred turbine technology constitutes BACT.
4. The LMS100 Can Operate In Combined Cycle Mode
The LMS100 turbine itself can be operated in an approximate combined cycle mode. First, the LMS100 is available as a Steam Injection Cycle (STIG) turbine. This model is known as the “poor man’s combined cycle,” as it eliminates the steam turbine by taking waste heat from the gas turbine, converting water into steam and then injecting this steam into the gas turbine. This is a steam cycle, similar to combined cycle, without a steam turbine. Thus, it eliminates startup delays that the BACT analysis claims are required to protect the gas turbine. (Ap., Appx. B, p. 39.)
This option results in better full and part-load efficiency and lower GHG and other criteria pollutant emissions than the LMS100 model selected for the Project’s turbines and can meet all

31
of the Project’s goals. It can generate 112.2 MW with a heat rate of 6,845 BTU/kWh at an efficiency of 50%.84 See Table 1.
Second, the LMS100 can be used in a classic combined cycle mode.85 In this mode, it produces 120 MW at 53.8% efficiency. All of the quick start operational flexibility of the LMS100 is available in these combined-cycle configurations, though at a higher cost. These options are technically feasible and must be carried forward into step 3 of the BACT analysis.
C. Step 5 of the GHG Top-Down Analysis Is Flawed The only “feasible” electric generating option that remained by step 4 was reciprocating
internal combustion engines (RICE) and simple cycle turbines. The RICE units were the top ranked technology in terms of GHG emissions. (Ap., Appx. B, Table B6-8.) However, they were eliminated in step 4 based on significant adverse impacts, an alleged factor of five increase in PM10 emissions in a severe PM10 nonattainment area. (Ap., Appx. B, pp. 45-46.) This left only generic simple cycle gas turbines. Without explaining why the five LMS100 model PA – 60 Hz model turbine selected for the Project is the most efficient simple cycle option (which it is not, as explained elsewhere in these comments), the Applicant included an analysis to select the GHG BACT limit for the specific turbine model it pre-selected.
In step 5, rather than selecting the most efficient simple cycle turbine option based on its own analysis in step 1 -- 1,100 lb CO2/MWh gross (Ap., Appx. B, Tables B6-4, B6-8) -- APS conducts a different analysis patterned after EPA Region 9’s GHG BACT analysis in the Pio Pico case. This new analysis sets the BACT limit at a level achievable during the lowest load, worst-case “normal” operating conditions, asserted to be 25%, to ensure BACT is achieved at all times. See Pio Pico Energy Center, 16 E.A.D.___, 73-82 (2013). The Ocotillo analysis is fundamentally flawed for the reasons discussed below.
1. The County Improperly Based the GHG BACT Limit on 25% Load
The Applicant admits in its application that the LMS100 turbines are capable of achieving much better GHG emission rates than the proposed limit of 1,690 lb CO2/MWh. In Table B6-9 of the BACT analysis, the Applicant provides a table showing that the LMS100 units can achieve a rate of 1,090 lb CO2/MWh at 100% load averaged across a temperature average. (Ap., Appx. B, p.48.) However, Applicant and the County justified the GHG BACT limit of 1,690 lb CO2/MWh based on the Applicant’s assertion that it needed to be able to operate the facility at 25% of the maximum load. The 1,690 lb CO2/MWh limit was calculated as the average over the ambient dry bulb temperature operating range of 20 F to 120 F. The 25% load point was characterized as “the lowest load, ‘worst-case’ normal operating conditions.” (Ap., Appx. B, p. 49 & Table B6-9.) This assumption is completely inappropriate because there is no support in the record that
84 See: Advanced Gas Turbine Power Cycles, pdf 28 at http://www.britishflame.org.uk/calendar/New2008/CH.pdf and Gas Turbine Technology, pdf 18 at http://www.ae.metu.edu.tr/seminar/2008/sanzlecture/sanz-day2.pdf; GE Power Systems, GE’s New Gas Turbine System: Designed to Change the Game in Power Generation, 2003, Available at: http://www.dec.ny.gov/docs/permits_ej_operations_pdf/atechspecs.pdf and GE Energy, New High Efficiency Simple Cycle Gas Turbine – GE’s LMS1000, June 2004, Available at: http://site.ge-energy.com/prod_serv/products/tech_docs/en/downloads/ger4222a.pdf. 85 Exhibit 24, Reale, Michael J., LMS100 Platform Manager, General Electric Company, New High Efficiency Simple Cycle Gas Turbine – GE LMS100. http://site.ge-energy.com/prod_serv/products/tech_docs/en/downloads/ger4222a.pdf, June 2004., GE Spec for LMS100.

32
operating at 25% load is necessary. Further, as discussed above, there are several technology alternatives that could eliminate the need to operate at such low loads for any significant period of time.
The Application asserted that “…these GTs will be designed to meet the proposed air emission limits at steady state loads as low as 25% of the maximum output capability of the turbines.” (Ap., p. 2); “…the Ocotillo GTs must operate over a wide range of loads from 25% to 100% of the rated turbine capacity..” (Ap., p. 15); “These GTs will be designed to meet air emission limits at steady state loads as low as 25% of the maximum output capability of the turbines.” (Ap., p. 33, et. seq.) The County accepts this argument, without any independent analysis, parroting that “[t]he new units need the ability to start quickly, change load quickly, and idle at low speed…To achieve these requirements, these GTs will be designed to meet the proposed air emission limits at steady state loads as low as 25% of the maximum output capability of the turbines”. (TSD, pp. 4, 30.)
The assumption made by both the Applicant and the County that the GHG BACT limit must be set at the “worst case” scenario to allow the Ocotillo plant to operate at 25% load is improper. As discussed elsewhere, operation at 25% of the LMS100 design load, or about 25 MW, could be achieved by either using hybrid battery or other storage options, or smaller gas turbines, (e.g. 25-MW gas turbines) operated more efficiently at 100% load. This type of configuration or operational parameters would eliminate the need to operate the LMS100 units at 25% loads for any extended periods of time. For this reason alone, the County should not base the GHG BACT limit on the assumption that Ocotillo will need to operate year-round on 25% load.
Furthermore, the Applicant’s own documents contradict its claims that the Ocotillo plant is even capable of operating at 25% load for an extended period of time. In another section of the Application, the Applicant asserts that the plant cannot operate at 25% load: “[i]t is important to note that neither DLN combustors nor water injection can operate at loads below approximately 50% of the maximum rated load. Because these are peaking GTs, these units will not be operated at loads below 50% of rated load, except during periods of startup and shutdown.” (Ap., Appx. B, p. 25.) Thus, the County improperly set the GHG BACT limit at an instantaneous point through which the turbines pass during startup and shutdown, rather than a normal operating load.
Water injection is used on the Ocotillo LSM100 gas turbines to control NOx during startup before the SCR catalyst comes on line. (Ap., p. 19.) Water injection cannot operate at loads below 50% as it adversely impacts flame stability and combustion dynamics, increasing CO emissions to unacceptable levels. (Ap., Appx. B, p. 51; Ap. p. 19.) Thus, the proposed 25% load basis for setting the GHG BACT limit would occur at an operating point at which the NOx startup limits would be exceeded, i.e., before water injection can be used. Further, if water injection were used below 50% load, contrary to good operating practice, the CO startup limit also would be exceeded. Further, operating at less than 50% load would violate “good air pollution control practices for minimizing emissions at all times including during startup, shutdown, and malfunction”, in violation of Permit Condition 20. (Draft Permit, p. 19.) Thus, normal operation at 25% load is a misnomer and would not occur. Further, it can be eliminated based on adverse collateral impacts.

33
The Applicant and the County attempt to justify the GHG BACT limit by extrapolating the methodology applied by EPA Region 9 to its permitting of the Pio Pico facility. Notably, the Region set the Pio Pico GHG limit at 1,328 lb CO2/MWh based on the “worst-case” assumption that Pio Pico would require operation at 50% load. The limit for Pio Pico is also calculated on a rolling average during 720 operating hours.
The Pio Pico process, developed by Region 9, and upheld by the EAB, is “set at a level achievable during the ‘worst-case’ of normal operating conditions” within the averaging period. Pio Pico Energy Center, 16 E.A.D.___, 77-78 (2013). The EAB deferred to the Region’s decision to “set a limit somewhat lower than optimal efficiency to ensure continued compliance.” Id. at 82. The EAB therefore declined to overturn the Region’s decision to allow a “somewhat lower” emissions rate so that the Pio Pico facility could ensure that it would continually meet its BACT limit during the 720 hour averaging period.
With the Ocotillo Draft Permit, the County and the Applicant extrapolate the Region’s reasoning with regard to Pio Pico to an illogical extreme. Rather than setting a BACT limit based on 50% load, which would have resulted in a limit of 1,300 lb CO2/MWh, the Applicant asserts without support that it must operate at 25% load. However, operating at 25% load point is not part of “normal operation.” To the contrary, as noted above, 25% load operation is only part of startup and shutdown; a load point through which the turbines pass reaching and descending from normal operation. If Ocotillo actually operated below 50% load for any significant period of time during its 12-month averaging period, it would not be capable of operating the water injection, and therefore it would exceed its permitted limits for CO.86 It is therefore not the case with Ocotillo that a limit of 1,690 lb CO2/MWh is necessary to meet a level “achievable during the ‘worst-case’ of normal operating conditions.” The operating assumption of 25% load is “worse than worst-case;” it is impossible given other permit limitations at Ocotillo.
It is similarly not the case that the proposed operating limit for Ocotillo is “somewhat lower” than the optimal efficiency. In Pio Pico Energy Center, the EAB noted that the GHG limit for Pio Pico at 50% load was 18% lower than optimal efficiency at 100% load. 16 E.A.D.___ at 81. In contrast, the proposed limit at Ocotillo is 36% lower than “optimal efficiency.”87 This deterioration of the permitted GHG limit is twice as severe as the case with Pio Pico. Sierra Club is not suggesting that EAB was attempting to set a bright-line definition of “somewhat lower” at 18%; however, the County’s assumption that a two-fold drop in efficiency compared to optimal operation is within the contemplation of the Pio Pico decision strains the presumed tolerance of EAB’s deference to permitting authorities.
2. GHG BACT Limit Based On Improper Averaging Time
The Ocotillo Draft Permit is also distinguishable from the Pio Pico limit based on the averaging period used by the permitting authority. For Pio Pico, Region 9 used a shorter averaging period of 720 operating hours; therefore, it was more plausible that the units could conceivably operate at low loads for a long enough portion of the 720-hour averaging period to impact the unit’s ability to meet an average GHG limit based on higher efficiency. However, in
86 The start of normal operation for a water-injected, LMS100 gas turbine, is 50% load. Thus, otherwise using APS’s analysis, the 50% load GHG limit would be 1,300 lb CO2/MWh. (Ap., Appx. B, Table B6-9.) 87 [1,090 @ 100%] / [1,690 @ 50%] = 0.64. See Ap., Appx. B at p.48.

34
the case of the Ocotillo Draft Permit, the County proposed a 12-month rolling average. This longer averaging period would allow any spikes in GHG emission to be smoothed out over the year, which would avoid the concern noted by EAB in Pio Pico that a permitting agency should be allowed to set an emission limit that ensures “continued compliance” over the averaging period.
In reviewing the Pio Pico permit, the EAB has confirmed that the permitting authority had the discretion to set a BACT limit that ensured continued compliance during the averaging period. This raises the question of the proper averaging time to use in setting such a limit. EPA had, in that case, justified setting a less stringent BACT limit on the grounds that “EPA must ensure BACT is achieved at all times.” Pio Pico Energy Center, 16 E.A.D.___ at 77. “At all times” means exactly that: essentially instantaneously, every second and minute and hour of the day. Thus, a GHG BACT limit based on the “at-all-times” rationale should be based on a short-term average. In the Pio Pico case, the GHG BACT limit of 1,328 lb/MWh gross output was based on a 720 rolling operating-hour limit.88
However, the Applicant chose, and the County accepted without any further inquiry, a 12-month rolling average. (Ap., Appx. B, p. 49; Draft Permit, p. 17, Table 4.) A 12-month rolling average is not consistent with the "at all times" rationale because it allows very high, non-BACT spikes to be averaged out. This long averaging time means that even when operating at 25% load, the plant could emit at rates far greater than 1,690 lb CO2/MWh for long periods of time because those periods would be averaged out with many more hours at higher load, when GHG emissions are lower. If the County insists on such a long averaging time, then it should set the GHG BACT limit at a level that recognizes that any aberrant spikes in GHG emission will be smoothed out over the year.
In other words, the Applicant cannot have it both ways. The County must either (i) set a strict BACT limit near the optimal efficiency of the plant and allow a long averaging period, or (ii) set a weak BACT limit and require a short averaging period to avoid spikes in emissions. The Ocotillo permit takes the weakest aspects of both options: it sets a weak BACT limit and allows averaging over a 12-month period. As a result, the Draft Permit is essentially meaningless as a control on GHG emission rates.
For example, the emission calculations assume there will be 730 startups and shutdowns per turbine per year. The 25% load point occurs during these periods. Conservatively assuming the turbines sit at the 25% load point for 5 minutes during each startup and 1 minute during each shutdown, each turbine will operate at 25% load for up to 73 hr/yr.89 As the proposed GHG limit is based on a 12-month rolling average, a special type of annual average, if a turbine operated at 100% load during the balance of the hours (8760-73=8687), meeting the 100% GHG emission level of 1,090 lb/MWh (Ap., Appx. B, Table B6-9), the GHG emissions during the 25% load portion of the year could be as high as 73,022 lb/MWh,90 a gross violation of GHG BACT. Thus, to avoid this type of egregious violation of the GHG BACT limit, any limit set to be met “at all times” must be based on a very short averaging time, no more than one hour. Further, to assure
88 PSD Permit No: SD 11-01, Pio Pico Energy Center, LLC, February 28, 2014, p.7, Condition B.1 89 The number of hours at 25% load: [730x5+730x1]/60=73 hrs. 90 (73/8760)x + (8687/8760)(1090) = 1690. Thus, x = (1690 – 1081)/0.00834 = 73,022 lb/MWh.

35
that BACT for GHG is met at other loads, an annual emissions cap should be established based on the anticipated operating mode of the plant.
GHG emissions endanger public health and welfare over the long-term by driving climate change. However, Sierra Club recognizes that, unlike criteria pollutants such as SO2, PM, NOx or ozone, GHGs do not pose direct human health risks when emitted in short spikes (although high concentrations of methane can stimulate the development of ozone).91 Therefore, Sierra Club does not oppose a permit term that permits a source to average its non-methane GHG emissions over a 12-month period. However, such a long averaging period is only acceptable if it is paired with a strict GHG limit that is at or near the plant’s optimal efficiency.
3. The BACT Limit Improperly Excludes Startup/Shutdown GHG
The Draft Permit improperly exempts periods of startup and shutdown. BACT applies continuously during all operating conditions. In re RockGen Energy Ctr., 8 E.A.D. 536, 553-55 (EAB 1999) (holding that PSD permits may not contain blanket exemptions allowing emissions in excess of BACT limits during startup and shutdown); In re Tallmadge Energy Center, Order Denying Review in Part and Remanding in Part, PSD Appeal No. 02-12 (EAB May 21, 2003)(“BACT requirements cannot be waived or otherwise ignored during periods of startup and shutdown”). Thus, Ocotillo’s GHG limit must apply during periods of startup and shutdown. The proposed Ocotillo Permit explicitly excludes periods of startup and shutdown from the GHG BACT limit of 1,690 lbs CO2/MWh. (Draft Permit, p. 17, Table 4.)
The Draft Permit also does not include separate BACT or any separate limits for GHG emissions during the exempted periods of startup and shutdown, while separate limits are set for NOx and CO. (Draft Permit, Tables 2 & 34.) Thus, GHG emissions from the periods when they would be highest are virtually unlimited and would not even be included in averaging the emissions to determine compliance with the 12-month rolling average GHG BACT limit. This is contrary to BACT. The permit must be revised to require that GHG emissions during startup and shutdown be included in the 12-month averaging period.
The Draft Permit also improperly incorporates an affirmative defense provision that purports to limit civil penalties for violating an emissions limit under certain conditions. The DC Circuit invalidated this type of provision in Natural Res. Def. Council v. E.P.A., 749 F.3d 1055, 1063 (D.C. Cir. 2014). The Court held that Clean Air Act Section 304(a) clearly vests authority over private suits in the courts, and an administrative body does not have the authority to strip away any potential civil penalties.
4. Setting the GHG Limit Based on Worst Case Conditions Conflicts with the Definition of BACT
The EAB concluded in the Pio Pico case that a BACT limit must be achieved “at all times,” to allow permittees to achieve compliance on a consistent basis. However, this does not excuse the permitting agency from complying with the statutory definition of BACT and the applicant from designing its project to meet BACT.
91 Spikes in GHG emissions are, however, often linked to spikes in other harmful local pollutants. Therefore, permitting limits and averaging times for those harmful pollutants should be set at levels and with averaging times sufficient to protect public health.

36
BACT is an emissions limit based on the maximum degree of reduction achievable through, among other options, cleaner production processes. 42 U.S.C. § 7479(3) (“best available control technology” means an emissions limitation based on the maximum degree of reduction of each pollutant… achievable for such facility through application of production processes”); accord 40 C.F.R. § 52.21(b)(12) (similar regulatory definition of BACT). “BACT emission limits or conditions must be met on a continual basis at all levels operation…” NSR Manual, p. B.56. The proposed BACT limit in the Draft Permit is inconsistent with this definition and legally flawed.
The worst-case “normal” operating conditions at Ocotillo do not correspond to the maximum degree of reduction achievable and are not based on cleaner production processes. The Draft Permit’s weak limit therefore ensures that the source is not subject to BACT-level emission limits during most operating hours. Specifically, the CO2 BACT limit in the final permit is based on the high heat rate and low efficiency that occur when the combustion turbines operate at 25% load. This point represents the minimum degree of reduction achievable over the normal operating range, providing a BACT off-ramp. Although the plant will operate at rates above 25% load during many, if not most, of its operating hours, the final permit establishes a BACT-level emission rate for only those hours when the unit operates at 25% load.
The dilemma that led the County to set the BACT limit at a low load, corresponding to the minimum degree of reduction, is created by the “load penalty” experienced by aeroderivative turbines such as the LMS100. This issue should have been, but was not, considered in the GHG BACT analysis. These turbines suffer a greater reduction in power and efficiency at high temperatures and part load operation than frame-based or RICE units.92 There are three solutions to this problem, which should have been evaluated in the BACT analysis and selected as BACT.
First, the County could set the limit based on a combined cycle configuration. Performance data included in the Ocotillo BACT analysis indicates that at 20 F, the heat rate (LHV) declines from 7,815 BTU/kWh at 100% load, to 9,305 BTU/kWh at 50% load, and to 12,053 BTU/kWh at 25% load. (Ap., Appx. B, Table B6-7, p. 44.) In contrast, the Alstom KA 24 combined cycle turbine has a full load efficiency of approximately 59% and its heat rate is 5,783 BTU/kWh. It maintains that heat rate to below 80% load and at 50% load its heat rate is less than 6,130 BTU/kWh.93 At full load, the Alstom KA 24 enjoys a heat rate advantage of 2,032 BTU/kWh (7,815-5,783 = 2,032) compared to the LMS100. At 50% load, the Alstom advantage rises to over 3,175 BTU/kWh (9,305-6,130=3,175).94
Thus, by using combined cycle units that were improperly eliminated in step 2, the load dilemma, providing the BACT off-ramp, could be resolved. The Alstom KA 24 turbine, in this example, satisfies the BACT definition of the maximum degree of reduction achievable through, among other options, cleaner production processes, as it maintains a high efficiency at low loads. Thus, even assuming arguendo that the “at all times” test applies, the BACT limit would be a lot
92 See, generally, 2013 GTW Handbook. 93 http://www.energiaadebate.com/alstom/Turbina%20de%20Gas%20GT24/GT24%20-%20Technical%20Paper.pdf See also, Alstom’s discussion of its low load operation and fast response options and its ability to support the spinning reserve market. 94 GHG emissions are proportional to the heat rate. The Alstom 24/26 series of turbines have been installed in a number of facilities worldwide, including at the Lake Road, CT generating station (2002). Exhibit 25, Alstom Gas Turbine Brochure, Available at: http://www.alstom.com/Global/Power/Resources/Documents/Brochures/gt24-and-gt26-gas-turbines.pdf

37
lower if it were established based on this (or other similar) combined cycle turbines because they do not experience the same increase in heat rate (and thus emissions) as loads decline.
Second, as discussed at length above, energy storage coupled with fewer LMS100 turbines could eliminate or reduce the need for low load operation and ramping requirements, thereby improving the efficiency of the LMS100 units by avoiding low load operation.
Third, the Project goals could be met with a different mix of simple cycle gas turbines, sized to provide power at different output levels. For example, if APS anticipated extended operation at 25 MW (or 25% load on a single LMS100), rather than operating one of its 100 MW turbines at 25% load, where GHG emissions are very high, it could employ one or more 25+ MW simple cycle turbine(s) operated at 100% load. These would include: the SwiftPac 25 (25.5 MW 8960 BTU/kWh); the PGT25+ (30.2MW, 8610 BTU/kWh); and the LM2500 PR (30.5 MW, 8854 BTU/kWh). Including a mix of these and many other smaller turbines95 with the proposed LMS100 turbines would allow Ocotillo to avoid the heat rate penalty.
5. The County’s Proposed GHG BACT Limit is Worse than Any Other Similar Facility in the Country
If nothing else, the County failed to consider the degree of GHG emission reductions that are achievable by other similarly configured facilities. Ocotillo’s proposed GHG emission rate of 1,690 lb CO2/MWh (gross) based on a 12-month rolling average would be, to Sierra Club’s knowledge, the worst GHG emission rate for any permitted simple-cycle natural gas facility in the United States. The Applicant’s own analysis included a table of recent GHG BACT limits for natural gas-fired simple-cycle turbines. (Ap. Appx. B, Table B6-4, p.35.) All of the facilities identified by the Applicant with rate-based limits had lower GHG emission limits than the proposed Ocotillo facility. The following is a list of the facilities with lb/MWh emission limits provided by the Applicant, as well as additional permitted natural gas-fired simple-cycle facilities that the Applicant did not include in its list:
95 Gas Turbine World 2013 GTW Handbook, vol. 30, vol. 30, p. 43.
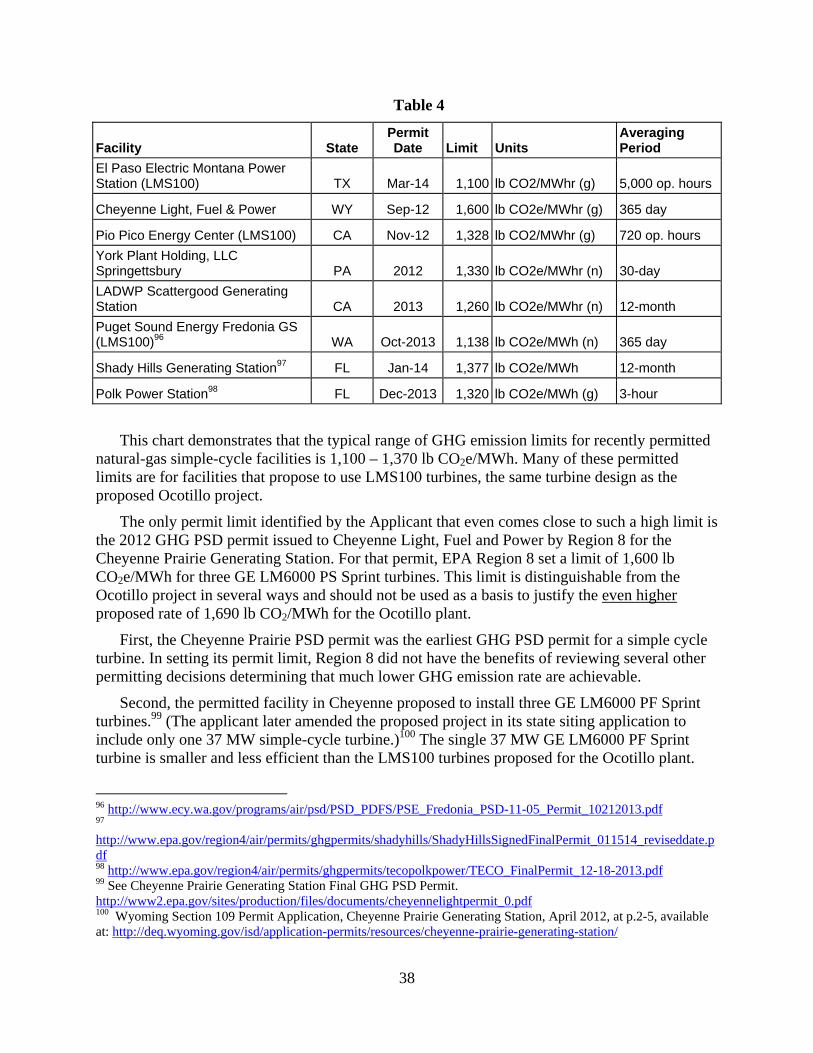
38
Table 4
Facility State Permit Date Limit Units
Averaging Period
El Paso Electric Montana Power Station (LMS100) TX Mar-14 1,100 lb CO2/MWhr (g) 5,000 op. hours
Cheyenne Light, Fuel & Power WY Sep-12 1,600 lb CO2e/MWhr (g) 365 day
Pio Pico Energy Center (LMS100) CA Nov-12 1,328 lb CO2/MWhr (g) 720 op. hours
York Plant Holding, LLC Springettsbury PA 2012 1,330 lb CO2e/MWhr (n) 30-day
LADWP Scattergood Generating Station CA 2013 1,260 lb CO2e/MWhr (n) 12-month
Puget Sound Energy Fredonia GS (LMS100)96 WA Oct-2013 1,138 lb CO2e/MWh (n) 365 day
Shady Hills Generating Station97 FL Jan-14 1,377 lb CO2e/MWh 12-month
Polk Power Station98 FL Dec-2013 1,320 lb CO2e/MWh (g) 3-hour
This chart demonstrates that the typical range of GHG emission limits for recently permitted natural-gas simple-cycle facilities is 1,100 – 1,370 lb CO2e/MWh. Many of these permitted limits are for facilities that propose to use LMS100 turbines, the same turbine design as the proposed Ocotillo project.
The only permit limit identified by the Applicant that even comes close to such a high limit is the 2012 GHG PSD permit issued to Cheyenne Light, Fuel and Power by Region 8 for the Cheyenne Prairie Generating Station. For that permit, EPA Region 8 set a limit of 1,600 lb CO2e/MWh for three GE LM6000 PS Sprint turbines. This limit is distinguishable from the Ocotillo project in several ways and should not be used as a basis to justify the even higher proposed rate of 1,690 lb CO2/MWh for the Ocotillo plant.
First, the Cheyenne Prairie PSD permit was the earliest GHG PSD permit for a simple cycle turbine. In setting its permit limit, Region 8 did not have the benefits of reviewing several other permitting decisions determining that much lower GHG emission rate are achievable.
Second, the permitted facility in Cheyenne proposed to install three GE LM6000 PF Sprint turbines.99 (The applicant later amended the proposed project in its state siting application to include only one 37 MW simple-cycle turbine.)100 The single 37 MW GE LM6000 PF Sprint turbine is smaller and less efficient than the LMS100 turbines proposed for the Ocotillo plant.
96 http://www.ecy.wa.gov/programs/air/psd/PSD_PDFS/PSE_Fredonia_PSD-11-05_Permit_10212013.pdf 97 http://www.epa.gov/region4/air/permits/ghgpermits/shadyhills/ShadyHillsSignedFinalPermit_011514_reviseddate.pdf 98 http://www.epa.gov/region4/air/permits/ghgpermits/tecopolkpower/TECO_FinalPermit_12-18-2013.pdf 99 See Cheyenne Prairie Generating Station Final GHG PSD Permit. http://www2.epa.gov/sites/production/files/documents/cheyennelightpermit_0.pdf 100 Wyoming Section 109 Permit Application, Cheyenne Prairie Generating Station, April 2012, at p.2-5, available at: http://deq.wyoming.gov/isd/application-permits/resources/cheyenne-prairie-generating-station/

39
After adjusting for site-specific influences, Region 8 determined that the Cheyenne Prairie CTs could reach an efficiency of only 36.8% in simple cycle mode.101 In contrast, the Applicant’s own documents rate the LMS100 at 43% efficiency. (Ap., p.14.)
Third, Region 8 included a dual limit of emission rate and total tons-per-year. The simple-cycle turbine at the Cheyenne facility is allowed to emit only 187,318 tons of CO2e per year. In contrast, the Ocotillo permit set an annual GHG emission limit of 1,100,640 tons-per-year based on the Applicant’s assertion that each LMS100 turbine had the potential to emit up to 497,498 tons-per-year. (Ap. Appx. B at p.34.) The lower annual limit at the Cheyenne facility would serve as a backstop to excessive emissions permissible from the high lb/MWh rate. Overall, the Cheyenne Prairie Generating Station permit is for a much smaller project using a less efficient turbine. The other projects identified in the table above, particularly those using LMS100 turbines, provide much better examples.
Even if the Cheyenne project were comparable, which it is not, BACT does not allow the permitting authority to scour the permitting record to find the furthest outlier to justify a weak limit.102 To the contrary, BACT requires the County to set the GHG emission limit “based on the maximum degree of reduction of each pollutant… achievable for such facility…” 42 U.S.C. § 7479(3). The existing BACT limits set for other facilities comparable to the Ocotillo facility does not provide a sufficient basis for the County to conclude that the proposed GHG limit of 1,690 lb CO2/MWh “reflects the maximum degree of reduction achievable.”103 The County’s justification for such a poor GHG limit is particularly disconcerting given the 12-month averaging period for the GHG limit. Even if the facility is required to run from time to time at low loads, the overall GHG emissions of the facility over time would smooth out any GHG emission spikes over the 12-month period. As demonstrated by the permit limits above, as well as the Applicant’s own documents showing the LMS100 units can meet an emission rate of 1,090 lb CO2/MWh,104 the County must at a minimum revise its GHG BACT limit to at least 1,090 lb CO2/MWh.
Furthermore, the County must revise its entire top-down BACT analysis to include the options discussed in these comments and to assure that BACT is required for GHG emissions. Such an analysis must include consideration of combined cycle turbines, energy storage, operation using a mix of turbine sizes and operation using a mix turbine sizes combined with storage.
II. THE DRAFT PERMIT IS LESS STRINGENT THAN THE PROPOSED GHG NSPS FOR NEW
ELECTRIC GENERATING UNITS.
On September 20, 2013, EPA issued a signed notice of its Proposed Rule for Standards of Performance for Greenhouse Gas Emissions from New Stationary Sources: Electric Utility Generating Units, EPA-HQ-OAR-2013-0495 (GHG NSPS). The GHG NSPS will apply to any
101 Statement of Basis, Greenhouse Gas Prevention of Significant Deterioration Pre-Construction Permit for the Black Hills Corporation/Cheyenne Light Fuel & Power, Cheyenne Prairie Generating Station Permit Number: PSD-WY-000001-2011.001 May 21, 2012, p.14. 102 NSR Manual, p.B.24 (“The evaluation of an alternative control level can also be considered where the applicant can demonstrate to the satisfaction of the permit agency that other considerations show the need to evaluate the control technology at a lower level of effectiveness”). 103 NSR Manual, p.B.2. 104 Ap., Appx. B, Table B6-9, p.48.

40
new electric generating unit that “actually supplies more than one-third of its potential electric output to the grid.”105 For those EGUs that supply more than one-third of their potential electric output to the grid, EPA determined that the “best system of emission reduction” is natural gas combined-cycle (NGCC) technology because it is technically feasible, relatively inexpensive, its emission profile is acceptably low, and it would not adversely affect the structure of the electric power sector.106 The proposed standard for stationary combustion turbines between 73 MW and 250 MW is 1,100 lb CO2/MWh (gross).
Section 111(a)(2) of the Clean Air Act defines a “new source” as any stationary source that commences construction or modification after publication of proposed new standards of performance under section 111 that will be applicable to the source. 42 U.S.C. § 7411(a)(2). Under this definition, any new fossil fuel‐fired EGU greater than 25 MW that commences construction after September 20, 2013 is a “new source” and will be subject to the CO2 standard that EPA ultimately promulgates when the source begins operating. United States v. City of Painesville, 644 F.2d 1186, 1191 (6th Cir. 1981) (CAA §111(a)(2) “plainly provides that new sources are those whose construction is commenced after the publication of the particular standards of performance in question.”). The statute uses the date a standard is proposed to define which sources are subject to the standard. The Ocotillo Project would therefore be considered a “new source” subject to the NSPS because it had not commenced construction of the new turbines prior to September 20, 2013.
The Ocotillo Power Plant would consist of five new 102 MW simple-cycle turbines with a permissible operating limit of more than 4,000 hours on a 12-month rolling basis per turbine. This means that the GHG NSPS, if finalized, would apply to the Ocotillo Power Plant. It also means that the County’s proposed BACT limit of 1,690 lb CO2/MWh (gross) is higher than the limit of 1,100 lb CO2/MWh in the proposed GHG NSPS. This difference fundamentally contradicts the purpose of BACT. The Clean Air Act expressly provides: “In no event shall application of “best available control technology” result in emissions of any pollutants which will exceed the emissions allowed by any applicable standard established pursuant to section [111 or 112 of the Clean Air Act].”107
The County acknowledged the proposed NSPS standard in the TSD, but it dismissed the issue because the rule is not final. (TSD at p.18.). Sierra Club agrees that the NSPS would not apply to Ocotillo unless and until the rule is finalized. However, the County must at least consider the level of GHG emissions contemplated by the proposed rule. Ocotillo’s proposed GHG limit of 1,690 lb CO2/MWh is more than 50% greater than the proposed limit of 1,100 lb CO2/MWh. Clearly the drafters of the proposed rule considered lower emission rates for comparably sized natural gas units achievable. The County must at a minimum take that information into consideration as it sets the BACT limit for the Ocotillo permit.
105 Id. at p.82. 106 Id. at p.287. 107 Clean Air Act § 169(3), 42 USC § 7479(3).

41
III. THE PERMIT DOES NOT REQUIRE A PROPER BACT LIMIT FOR NOX EMISSIONS FROM
THE GAS TURBINES
The TSD concluded (erroneously) that the Project is not a major modification for NOx emissions and thus is not subject to BACT under the PSD program. However, Maricopa County Rule 241 requires BACT at any new stationary source that emits more than 150 lb/day or 25 ton/yr of NOx. The new gas turbines would emit 688 lb/day or 125.5 ton/yr of NOx. (TSD, Table 15) Thus, the new gas turbines are subject to NOx BACT under Rule 241, Section 301.1. Further, as discussed in Section 7, below, the net increase in NOx emissions triggers non-attainment new source review (NNSR). Thus, federal Lowest Achievable Emission Rate (LAER) is required for NOx.
Maricopa County guidance allows sources that select control technology for the same or a similar source category accepted by air quality management districts in California to opt out of the top-down BACT analysis process required under federal PSD regulations.108 The Applicant opted out and relied on California BACT determinations. (Ap., Appx. B, Chapter 3, p.16.) Thus, the Application does not contain a top-down BACT analysis for NOx.
The applicant tabulated 19 “recent” BACT NOx limits (2001 – Sept. 2013) for simple-cycle, natural gas fired turbines, which show NOx BACT limits ranging from 2.5 ppm to 5.0 ppm at 15% O2, based on 1-hour to 3-hour averages. (Ap., Appx. B, Table B3-1.) Based on this summary, the Applicant concluded that BACT for NOx is use of water injection in combination with SCR, designed to achieve an emission limit not to exceed 2.5 ppmdv at 15% O2, based on a 3-hour average. (Ap, Appx. B, p. 3.) The County apparently disagreed, and it set the final NOx limit in the proposed Permit at 2.5 ppmdv at 15% O2 based on a 1-hour average. (Draft Permit, p.17, Table 4.) This analysis is fundamentally flawed. As explained below, NOx BACT for these gas turbines is dry low NOx combusters and SCR, designed to achieve a NOx emission limit not to exceed 2.0 ppmdv at 15% O2, based on a 1-hour average.
First, the applicant limited its selection of “similar” facilities to simple cycle gas turbines, excluding all combined-cycle gas turbines because they “cannot be used for the quick start requirements of the Ocotillo Modernization Project.” (Ap., Appx. B, p. 17.) This is clear error, as explained in Section I.B.2. Combined cycle turbines can meet all of the Project specifications. Thus, NOx BACT permit limits for combined cycle plants should have been included in the Ocotillo BACT analysis.
Second, the most common reason used to justify a higher NOx emission limit for simple cycle turbines is elevated exhaust gas temperatures compared to combined cycle plants, where heat is recovered to produce steam in the heat recovery steam generator (HSRG). There is some basis for this on standard simple cycle units that have an exhaust gas temperature of at least 800 oF, and over 1,000 oF on some models.109 Special high temperature SCR catalyst formulations may be necessary for these relatively high exhaust gas temperatures.
108 Maricopa County Air Quality Management District, Requirements, Procedures and Guidance in Selecting BACT and RACT , July 2010, http://www.maricopa.gov/aq/divisions/permit_engineering/docs/pdf/BACT%20Guidance.pdf 109 Environmental Administrative Decisions: September 1998 to February 2000, p. 18; J. T. Langaker, S. Voss, and R. Johnson, Take the Heat: Nitrogen Oxide (NOx) Removal in High Exhaust Gas Temperatures, Burns & McDonnell TechBriefs, no. 4, 2003,

42
However, the LMS100 turbines are not standard simple cycle turbines. The use of an intercooler on the LMS100 turbines results in significantly lower exhaust gas temperatures than typically encountered on simple cycle gas turbines. The exhaust gas temperature of the LMS100 PA model, the water-injected model specified for Ocotillo, is 760 oF.110 The relatively low exhaust gas temperature of this turbine means that a standard SCR, similar to those routinely used on combined cycle units and limited to 2.0 ppm NOx, can also be utilized on the LMS100 without any reduction in performance, regardless of the simple cycle v. combined cycle issue. Thus, the Applicant should have considered NOx limits for combined cycle gas turbines, regardless of whether it meets all Project specifications.
Third, many gas turbines, including simple cycle gas turbines, have been permitted and are operating with a NOx emission limit of 2.0 ppmvd at 15% O2, based on a 1-hour average. These include the following:
Table 5
Tracy Substation Expansion Project NV‐0035 2.0 ppm (3‐hour)
Langley Gulch Power Plant ID‐0018 2.0 ppm (3‐hour)
Palomar Escondido – SDG&E 2001‐AFC‐24 2.0 ppm (1‐hour); 2.0 ppm (3‐hour) with duct burners or transient hour of +25 MW
Warren County Facility VA‐0308 2.0 ppm with or without duct burners
Ivanpah Energy Center, L.P. NV‐0038 2.0 ppm (1‐hour) without duct burners; 13.96 lb/hr with duct burners
Gila Bend Power Generating Station AZ‐0038 2.0 ppm (1‐hour)
Duke Energy Arlington Valley AZ‐0043 2.0 ppm (1‐hour)
Colusa II Generation Station 2006‐AFC‐9 2.0 ppm (1‐hour)
Avenal Energy – Avenal Power Center, LLC 2008‐AFC‐1 2.0 ppm (1‐hour)
Russell City Energy Center 2001‐AFC‐7 2.0 ppm (1‐hour)
CPV Warren VA‐0291 2.0 ppm (1‐hour)
IDC Bellingham CA‐1050 2.0 ppm/1.5 ppm ( h )
Oakley Generating Station 2009‐AFC‐4 2.0 ppm (1‐hour)
GWF Tracy Combined‐cycle Project 2008‐AFC‐7 2.0 ppm (1‐hour)
Watson Cogeneration Project 2009‐AFC‐1 2.0 ppm (1‐hour)
This table includes many gas turbines permitted in California, specifically within air districts that the County’s BACT guidance indicates can be relied on for establishing BACT. This information indicates that BACT for NOx emissions from the Ocotillo gas turbines should require a NOx emission limit of 2.0 ppmvd at 15% O2, based on a 1-hr average.
http://www.burnsmcd.com/Resource_/Article/5668/PdfFile/article-takingtheheat-034.pdf; I. Morita and others, Latest NOx Removal Technology for Simple Cycle Power Plants, Power-Gen International, 2002, http://www.burnsmcd.com/Resource_/Article/5668/PdfFile/article-takingtheheat-034.pdf 110 Gas Turbine World, 2012 Performance Specs – 28th Edition, January – February 2012, Volume 42, No. 1, p. 12.

43
IV. THE PERMIT DOES NOT REQUIRE BACT FOR PM/PM2.5 EMISSIONS FROM THE GAS
TURBINES The net increase in PM (55.4 ton/yr) and PM2.5 (51.3 ton/yr) from the Project exceeds the
respective PSD significance thresholds of 25 ton/yr and 10 ton/yr. (TSD, Table 24.) Thus, BACT must be required for both PM and PM2.5 from the gas turbines, which are the major source of these emissions. The Application contains a top-down BACT analysis, but it is severely flawed.
A. Step 1 of the PM/PM2.5 Top-Down Analysis Is Flawed The Applicant conducted a conventional five-step, top-down BACT analysis for PM and
PM2.5. In step 1, all control technologies must be identified.111 The Applicant identified the following control technologies for PM, PM10, and PM2.5 (Ap., Appx. B, p. 22):
1. Good Combustion Practices:
a. Dry Low NOx (DLN) Combustion b. Water Injection (WI)
2. Low Ash/Low Sulfur Fuel (i.e., natural gas)
This list is incomplete for the same reasons previously discussed for GHG emissions. It excludes other good combustion practices commercially available for the LMS100 turbine. These practices include the LMS100 turbine with: (1) steam injection and (2) STIG.112,113 Either of these configurations would improve the PM/ PM2.5 emission rate, and the County must consider those control technologies in its BACT analysis.
B. Step 2 of the PM/PM2.5 Top-Down Analysis Is Flawed In step 2, technically infeasible control technologies are eliminated.114 In this step, the
Applicant makes two arguments for eliminating DLN combustion and choosing water injection: (1) DLN cannot meet similar peak power capabilities and (2) the emissions are the same. (Ap., Appx. B, pp.24-25.) Neither of these arguments demonstrates technical infeasibility. The NSR Manual notes that “A demonstration of technical infeasibility should be clearly documented and should show, based on physical, chemical, and engineering principles, that technical difficulties would preclude the successful use of the control option on the emissions unit under review.” (NSR Manual, p. B.6.) This test is not met for eliminating DLN combustion, steam injection, or even STIG, which is a feasible option that the County failed to identify.
111 NSR Manual, p. B.5. 112 The Steam Inject cycle (STIG) takes waste heat from the gas turbine, converts water into steam and then injects this steam into the gas turbine. This is a steam cycle, similar to combined cycle, without a steam turbine. This option results in better part-load efficiency and NOx emissions. See: Advanced Gas Turbine Power Cycles, pdf 28 at http://www.britishflame.org.uk/calendar/New2008/CH.pdf and Gas Turbine Technology, pdf 18 at http://www.ae.metu.edu.tr/seminar/2008/sanzlecture/sanz-day2.pdf. 113 GE Power Systems, GE’s New Gas Turbine System: Designed to Change the Game in Power Generation, 2003, Available at: http://www.dec.ny.gov/docs/permits_ej_operations_pdf/atechspecs.pdf and GE Energy, New High Efficiency Simple Cycle Gas Turbine – GE’s LMS1000, June 2004, Available at: http://site.ge-energy.com/prod_serv/products/tech_docs/en/downloads/ger4222a.pdf. 114 NSR Manual, p. B.6.
44
1. Peak Power Argument Is Invalid The Applicant asserts that it selected water injection over DLN due to water injection’s
“ability to achieve higher peak power output levels…” (Ap. Appx. B, p. 24.) However, the BACT analysis is silent as to why it eliminated steam injection and STIG.
The BACT analysis for NOx emissions from the gas turbines makes a similar peak power argument, asserting that water injection was selected due to its ability to achieve higher peak power output than steam injection or DLN combustors. The Applicant argues that the use of water injection increases the mass flow through the turbine, increasing power output, especially at higher ambient temperatures when peak power is often required. The use of LMS100 gas turbines with DLN combustors was reported to have a maximum gross electric output of 99 MW, versus 103 MW for water-injected combustors. (Ap., Appx. B, pp. 24-25.)
The peak power output used in both the PM/PM2.5 and NOx BACT analyses is misleading. As an initial matter, the Applicant’s claim that water injection allows a capacity of 103 MW is suspect. Chapter 4 of the BACT analysis argues water injection would allow up to 103 MW output; however, both the CEC Application (CEC Ap., pp. ES-1/2) and Draft Permit list the LMS100s as 102 MW turbines. (Draft Permit, p.33.) There is therefore almost no difference in peak capacity between water injection and, for example, steam injection, which achieves a maximum power output of 102.1 MWe. In fact, STIG would achieve an even greater peak capacity of 112.2 MWe.115 Thus, the peak power goal of the facility could be easily met by selecting other LMS100 options that are more efficient and thus have lower PM/PM2.5 emissions. If the lower capacity of DLN combustors is truly an impediment to the design of the facility, there are other LMS100 options that could be selected with lower emission rates, improved energy efficiency, and reduced environmental impacts, while meeting the stipulated peak power. In any case, a slight decrease in peak capacity is not sufficient justification to eliminate a control technology as technically infeasible.
2. PM/PM2.5 Emissions Are Not the Same for Water Injection The Applicant’s Step 2 BACT analysis further asserts that “…emissions data does not
indicate that PM emissions are substantially different whether DLN or water injection is used. Therefore, for PM emissions, the maximum PM emission rate would be the same for either water injection or DLN combustion.” (Ap., Appx. B, p. 25.) This argument would normally be made in step 3, not step 2.
Regardless, this statement is not supported with test data and is not credible. The meaning,
for example, of the Applicant’s use of the term “substantially different” is not evident and suggests that there is, in fact, a difference. However, the Applicant does not identify how big a differential there is. A small difference in an hourly emission rate could result in a large increase in PM, PM10, and PM2.5 emissions over a year. Further, most of the PM is actually PM10, a severe nonattainment pollutant. Small differences are highly significant in severe nonattainment areas. Water injection, for example, increases PM, PM10, and PM2.5 emissions compared to DLN combustion for two reasons:
115 GE Energy, New High Efficiency Simple Cycle Gas Turbine – GE’s LMS1000, 2004, Table 2.

45
First, dissolved solids are present in the injected water. These dissolved solids would be emitted as particulate matter in the exhaust gas. Although reverse osmosis will be used to treat the injection water, the Application and TSD are silent on the design total dissolved solid (TDS) level for the injection water.
Second, water-injected LMS100 turbines are less efficient than DLN and other LMS100 turbines, resulting in higher emissions of GHG, PM, PM10, PM2.5, CO, and NOx per unit of electricity generated. The Project will use LMS100 PA 60 Hz turbines. (Ap., Table 2-1.) The efficiency of this LMS100 turbine model increases from 43% for water injection to 46% when DLE combustors are used, to 48% with steam, and finally to 50% with STIG.116 Higher efficiency means lower emissions, as less natural gas has to be combusted to produce the same MW output. Thus, the Applicant has chosen the lowest efficiency option with the highest emissions of all pollutants.
The BACT analysis claims that water injection and DLN have the same particulate matter emissions. (TSD, Appx. A, p. 25). However, this claim is unsupported and likely incorrect, due to the solids content of the injected water and the efficiency differences. Further, this claim just applies to DLN versus water injection and ignores the other two turbine options – steam and STIG.
C. Step 3 of the Top Down Analysis Is Missing Step 3 requires that all feasible control technologies be ranked by control effectiveness.117
This step is missing from the County’s BACT analysis, and in its place is an unsupported assertion by the Applicant that BACT is satisfied by the use of natural gas and water injection, without justification. (Ap., Appx. B, p. 25.) There is no discussion of control effectiveness, expected emission rates or reductions, energy impacts, environmental impacts, or economic impacts, which are all factors that must be considered in selecting BACT.118 Rather, the selection of water injection was made in step 2 based on an erroneous and irrelevant peak power argument, without considering steam injection or STIG.
B. Step 4 of the Top Down Analysis Is Flawed In step 4 of its BACT analysis, the Applicant asserts that it has selected the best available
control technology and thus further evaluation is not required. (Ap., Appx. B, p. 25.) However, the BACT analysis did not even identify the most effective control. The use of steam injection and STIG, which both meet peak power and have lower emissions, was not considered in the BACT analyses for any pollutant. In fact, the Applicant selected the LMS100 option with the highest PM/PM2.5, GHG, CO, and NOx emissions, turning the top down BACT process on its head. Further, the selected option, water injection, has significant adverse environmental impacts that were not identified. In particular, water injection requires the use of large amounts of water, which for Ocotillo implicates a desert environment with overdrafted groundwater aquifers.
The top-ranked, technically feasible technology in a top-down BACT analysis can only be rejected if adverse energy, environmental, or economic impacts are demonstrated.119 The 116 GE Power Systems, GE’s New Gas Turbine System: Designed to Change the Game in Power Generation, 2003, Available at: 117 NSR Manual at B-7. 118 NSR Manual, p. B.8. 119 NSR Manual, p. B.8.

46
County’s BACT analysis accepted whole-sale the Applicant’s analysis, which does not identify any adverse impacts of other more efficient and less polluting options. Instead, the Applicant argues only that water injection is preferable because it can achieve higher peak power output levels. (Ap., Appx. B, p. 24.) This is not a sufficient justification for evaluating the most effective pollution control.
C. Step 5 of the BACT Analysis Is Flawed The Applicant concluded (Ap., p. 26) and the County agreed (TSD, Table 25) that BACT for
PM and PM2.5 is 5.4 lb/hr, combined filterable plus condensable. The draft Permit limits PM10 total and PM2.5 total to 5.4 lb/hr, 1-hr average, each. (Draft Permit, p. 17.) Compliance with the PM10 limit is by calculation using monitored fuel flow and emission factors from the most recent performance test for each unit. (Draft Permit, p. 17.)
However, this limit was derived without considering the combustion method. As discussed above, the emissions from an LMS100 turbine depend upon the type of combustion system used. The electrical generation efficiency ranges from 43% for water injection, erroneously chosen as BACT in this case, to 50% for STIG. Thus, PM and PM10 emissions would vary, depending on the type of combustor and could be as much as 16% lower for an LMS100 turbine running in STIG mode, compared to water injection assumed in the BACT analysis. Alternatively, if DLN were chosen as BACT, the efficiency would improve and PM/PM2.5 emissions from water injection would be eliminated. Thus, there are clear distinctions in PM/PM2.5 emissions, based on the combustion option. Step 5 relies solely on EPA’s revised Pio Pico analysis, which did not consider combustion options, but rather only looked at permit limits and stack tests based on the same model turbine.
The Applicant concluded 5.4 lb/hr is BACT for each LMS100 turbine, based on EPA’s revised BACT analysis for Pio Pico, which concluded that BACT for PM emissions from the same LMS100 turbines is 0.0053 lb/MMBtu. As the rated heat input of each Ocotillo gas turbine is 970 MMBtu/hr, the resulting PM emissions rate is 0.0053 lb/MMBtu x 970 MMBtu/hr = 5.1 lb/hr. The Applicant increased the PM emission rate by 6% to account for potential unspecified differences in the sulfur content of the natural gas. (Ap., Appx. B, p. 26.)
However, the Application fails to explain how the sulfur content of natural gas affects PM and PM2.5 emissions and fails to present any basis for raising the Pio Pico PM BACT limit by 6%, rather than some other value. The Application also fails to present any information on the natural gas sulfur content used in the SCAQMD BACT determination compared to the natural gas sulfur content used at Ocotillo. Thus, the upward adjustment is unsupported.
Further, the revised Pio Pico BACT analysis that the Applicant relies on was not based on a
top-down BACT analysis in which all good combustion options were considered, but rather only revised step 5, in which stack test data and permit limits were reviewed, without any consideration of the type of combustion controls used at the various facilities. Thus, the Pio Pico analysis did not consider the impact of LMS100 combustor options – DLN, water injection, steam injection, and STIG – on PM/PM10/PM2.5 emissions. Therefore, the underlying EPA analysis is fundamentally flawed and cannot be relied on here to establish BACT for Ocotillo.

47
V. THE PERMIT DOES NOT REQUIRE BACT FOR PM/PM2.5 EMISSIONS FROM THE
COOLING TOWER
The LMS100 gas turbines use an intercooler between the low pressure compressor and the high pressure compressor to improve the overall efficiency.120 The cooling tower provides water cooling for the intercooler. (TSD, p. 6.) The BACT analysis for PM/PM2.5 emissions from the cooling towers concludes that BACT for total PM and total PM2.5 is satisfied by using drift eliminators designed for a drift loss of no more than 0.0005% of the total circulating water flow and total dissolved solids (TDS) in the circulating water of no more than 12,000 parts per million (ppm) on a weight basis. (Ap., Appx. B, p. 56; Draft Permit, p. 17.)
The Project includes a new “hybrid” partial dry cooling system, which includes a new mechanical draft cooling tower with a circulating water flow rate of 6,500 gpm. (Ap., pp. 10, 23.) In this application, hot water from the intercooler is introduced into the top of the tower and moves down through the tower countercurrent to an upward moving air stream. An inducted draft fan blows air up through the stream of hot water. Some of the hot water evaporates, cooling the water. A small amount of water is entrained as droplets or mist in the air stream, passes through a mist eliminator, and the remaining droplets are emitted to the atmosphere. When the droplets evaporate, dissolved solids in the droplets, which originate from the original water supply, become particulate matter, including PM, PM10, and PM2.5. Thus, a mechanical draft cooling tower is a source of particulate matter and is subject to BACT.
The Application includes a BACT analysis for this cooling tower, which was adopted by the County without comment. (TSD, pp. 15-16.) The BACT analysis accepted the “hybrid” cooling system as BACT and only evaluated the effect of one cooling tower operating variable, drift loss, on particulate matter emissions. There are two major flaws in this analysis in step 1 which invalidate the BACT decision: (1) it fails to consider other cooling methods with much lower PM/PM2.5 emissions; and (2) it fails to consider the concentration of total dissolved solids (TDS) in the circulating water on PM, PM2.5, and PM10 emission rates.
A. The Analysis Fails To Evaluate Other Cooling Methods The top down BACT analysis for the cooling tower is fundamentally flawed in step 1 of the
top down process because it failed to identify all available control technologies for heat rejection from the gas turbines. Rather, it assumes a hybrid cooling system as the starting point and only looks at drift losses established as BACT for similar systems.
The Project claims it will use a “hybrid” cooling system, which combines a conventional
Marley wet tower with an indirect dry tower. (Ap., p.15.) However, PM, PM2.5, and PM10 emissions from the cooling tower could be almost completely eliminated by selecting a dry tower for the LMS100 turbines. A dry tower uses an air-cooled condenser with a misting system at the ACC fan inlet(s) to saturate the inlet air with moisture to drop the dry bulb temperature to near the wet bulb temperature on hot days. In this configuration, there would be no need for a Marley cooling tower.
120 Exhibit 26, GE Energy, New High Efficiency Simple Cycle Gas Turbine – GE’s LMS100TM, Available at: http://site.ge-energy.com/prod_serv/products/tech_docs/en/downloads/ger4222a.pdf.

48
General Electric, manufacturer of the LMS100, offers an air-cooled option to the LMS100. The first LMS100 unit built, in 2006 at Groton Station in South Dakota, was air-cooled. The second LMS100 added at Groton Station is also air-cooled.121 Many others have followed, including at Astoria in New York122 and Haynes Generating Station in Long Beach, California, which recently started up six air-cooled LMS100. Air cooling, referred to as the “air-to-air intercooler” in General Electric literature, is a standard option offered by GE on the LMS100, just as DLE combustion is a standard option offered by GE on the LMS100.123 As explained by GE:
“In locations where water is scarce or very expensive, the basic LMS100 power plant will contain a highly reliable air-to-air intercooler. This unit will be a tube and fin style heat exchanger in an A-frame configuration which is the same as typical steam condensing units in general conformance with API 661 standards. Similar units are in service in the oil and gas industry today.”
Water scarcity is an important collateral impact in Arizona that should have been considered in step 4 of the BACT analysis. However, the County never considered the merits here because it never considered or evaluated alternate cooling options. The CEC Application, for example, acknowledges that “[l]ong-term groundwater use [which is the supply for the cooling tower] is a major concern for APS, as well as the State of Arizona, because of the arid climate and minimal natural recharge in the Phoenix area.” (CEC Ap., Exhibit B2, p.B2-1 287.) An air-cooled LMS100, equipped with a water misting system that uses a relatively small amount of water for tempering inlet air on hot days, has an efficiency equivalent to a LMS100 equipped with a cooling tower.124
B. The Analysis Fails To Evaluate Makeup Water Treatment The PM, PM2.5, and PM10 emissions from a cooling tower are directly related to the amount
of total dissolved solids (TDS) in the makeup water supply and the drift loss. (Ap., Appx. B, p. 53, Eq. 1.) The cooling tower BACT analysis evaluated drift loss by compiling losses required in permits for other similar cooling towers. (Ap., Appx. B, Table B8-3.)
However, the BACT analysis did not consider variations in the makeup water supply’s TDS concentration in the cooling tower BACT analysis. Rather, the analysis assumes without support or any discussion, a circulating water TDS of 12,000 ppm. The cooling tower will be designed to operate at seven cycles of concentration (COC). (CEC Ap., Exhibit B2, p. B2-7.) Thus, the assumed TDS in the makeup water is 12,000/7 = 1,740 ppm.
The CEC Application indicates that existing groundwater wells will supply makeup water to the cooling tower. (CEC Ap. p. Application-8.) It further reports the raw well water has a
121 CH2MHILL, Basin Electric LMS100-Unit 1 Project, http://www.ch2m.com/corporate/markets/power/assets/ProjectPortfolio/GE_Basin_1.pdf; Groton Generation Station: Record Heat Tests First LMS100 Immediately After COD, Combined Cycle Journal, Fourth Quarter 2006, http://www.artec-machine.com/wp-content/news/basin_electric_130MW_sychronous_clutch.pdf 122 NYDEC, Permit Review Report, Permit ID: 2-6102-00116/00021, Modification 2, October 16, 2009. 123 GE Power Systems, November 2003; GE Energy 2004. 124 GE Energy 2004.

49
conductivity of 1200 uS/cm and a pH of 8.3. (CEC Ap., Exhibit B2, Table B2-2.) This is equal to a TDS concentration of about 800 ppm.125 Thus, at seven cycles of concentration, the circulating water TDS should be no more than 5,600 ppm (800x7=5,600), or half that assumed in setting BACT emission limits. BACT is defined as “the maximum degree of reduction for each pollutant.” 42 USC 7479(3). Setting the PM/PM2.5 BACT limits based on an untreated water supply with twice as much TDS than is actually present is inconsistent with this definition. The makeup water TDS could be significantly reduced, by more than 95%, by treating the local groundwater using reverse osmosis. Reverse osmosis is proposed to treat the water injected into the combustor to control air emissions. (CEC Ap., Exhibit B2, p.B2-5.) Thus, it is clearly feasible at the site. Removing 95% of the TDS from the cooling tower makeup water would reduce PM, PM2.5, and PM10 emissions from the cooling tower by an equivalent amount. Thus, clearly, the Draft Permit does not require BACT for PM and PM2.5 emissions from the cooling towers because the selected limits were based on a fixed circulating water TDS of 12,000 ppm.
C. The PM10The Analysis Fails To Evaluate Lower Drift Rates The BACT analysis summarized drift loss control requirements for eight cooling towers,
reporting a range of 0.0005% to 0.002%. (Ap., Table B8-3). The lower end of the range, 0.0005% was selected as BACT. However, lower drift losses have been selected as BACT, including for Longview Power: 0.0002%.126
VI. THE PM10 CAP IS NOT ENFORCEABLE The Facility is located in an area designated as a serious nonattainment area for particulate
matter less than 10 microns (PM10). (TSD, pp. 20, 21.) Under Maricopa County Rule 240, Section 210.1, if PM10 emissions exceed 70 ton/yr, Nonattainment New Source Review (NNSR) applies and Ocotillo must install LAER for PM10. (TSD, pp. 21-22.)
To avoid this classification and the attendant requirements, APS is proposing a plant-wide PM10 emission cap of 63.0 ton/yr based on a rolling 12-month average to reclassify Ocotillo as a minor source of PM10 emissions under County Rule 201. Thus, the Applicant asserts that Ocotillo would not be subject to NNSR or PSD programs for PM10 emissions. (TSD, pp. 7, 22.)
However, as demonstrated below, the County cannot rely on this plant-wide emission cap to exempt Ocotillo from NNSR because the cap is not enforceable and does not include all sources of PM10 emissions. The sources of PM10 emissions due to the Project are identified in the TSD, Table 11 as follows:
Normal operation GT3-GT7: 48.2 ton/yr Startup/Shutdown GT3-GT7: 6.7 ton/yr GC Cooling Tower: 2.5 ton/yr Emergency Generators: 0.1 ton/yr
These identified new PM10 emission sources total to 57.5 ton/yr. In addition, Ocotillo will
continue to operate gas turbine units 1 and 2 (GT1, GT2) and a GENRAC 125 hp propane-fired emergency generator (Ap., p 7), which emit an undisclosed amount of PM10. The existing gas 125 TDS (ppm) = Conductivity uS/cm x 0.67. http://www.stevenswater.com/water_quality_sensors/conductivity_info.html 126 Longview Power, LLC, Cooling Tower, RBLC ID: WV-0023.

50
turbines are GE 501-AA, 55 MW, 915 MMBtu/hr gas turbines installed in 1972. (Draft Permit, p. 33.) The GENRAC generator is not even listed in the Draft Permit.
Thus, to determine compliance with the cap, PM10 emissions from each of these sources,
including existing sources, must be measured and summed. The proposed permit does not require any testing of PM10 emissions from some of these sources and requires inadequate testing from others. Further, the facility will emit PM10 from sources that were not included in the PM10 cap and are not identified in the draft Permit.
A. The Proposed Cap Is Unsupported and Facially Exceeded
The draft Permit, Table 1, identified the emission units that contribute to the PM10 cap as: GT3-GT7, EG1-EG2, GTCG, and GT1-GT2. The record in this case does not explain how the cap of 63 ton/yr was determined. The record discloses the calculation of PM10 emissions from Project sources, GT3-GT7, EG1-EG2, GTCG, which total to 57.5 ton/yr, but not the assumed contribution to the cap from existing sources GT1-GT2 at the facility.
The additional potential contribution to PM10 emissions from existing gas turbines GT1 and GT2, which would continue to operate, calculated using the method proposed in the Draft Permit, is 9.7 ton/yr. Thus, total PM10 emissions from all sources identified in the Draft Permit as part of the cap sum to 67.2 ton/yr (57.5+9.7=67.2), which exceeds the proposed cap. Thus, on its face, it appears that the cap is not plausibly achievable. This is a key concern because the Draft Permit does not require any monitoring for several sources. Thus, it is facially plausible that the cap will be exceeded.
B. GT1 and GT2 PM10 Emissions Are Not Enforceable
The PM10 emissions from GT1 and GT2 will be calculated using monitored fuel flow data and emission factors from AP-42, unless an alternative emission factor is demonstrated. (Draft Permit, p. 17, Table 4, note (f).) The Draft Permit does not require any testing at all of PM10 emissions from these turbines. Further, the Draft Permit does not require that emissions from startups, shutdowns and malfunction of GT1 and GT2 be included in the emissions. Thus, the contribution of PM10 emissions from the existing gas turbines to the PM10 cap is unenforceable.
Sierra Club attempted to calculate the expected emissions from the two existing turbines. AP-42, EPA’s Compilation of Air Pollutant Emission Factors, has been published since 1972 as the primary compilation of EPA's emission factor information. It contains emission factors and process information for more than 200 air pollution source categories. The emissions factors in the publication are numerous - AP-42 contains 15 chapters.127 The Draft Permit should therefore specify which AP-42 section and which emission factor(s) are applicable. Presumably, Section 3.1, Stationary Gas Turbines, applies. This section reports a total PM emission factor of 0.0066 (6.6E-03) lb/MMBtu for natural gas-fired turbines.128 Although not stated in AP-42, essentially 100% of the particulate matter from gas-fired turbines is PM10. The Draft Permit also limits
127 EPA, Compilation of Air Pollutant Emission Factors, Volume I: Stationary Sources and Area Sources, Available at: http://www.epa.gov/ttnchie1/ap42/. 128 AP-42, Table 3.1-2a.

51
combined annual fuel use across gas turbines GT1 and GT2 to 2,928,000 MMBtu/yr (HHV). (Draft Permit, p. 19.) Thus, the total PM10 emissions from these two existing turbines is 9.66 ton/yr.129
Elsewhere, the Application conducted a netting analysis for PM/PM10/PM2.5. The baseline emissions for all three of these particulate matter pollutants are based on a constant emission factor of 0.0075 lb/MMBtu from the two existing steam turbines. (Ap. Tables E-8/10.) Thus, based on the PM10 emission factor for these turbines assumed in the Application, the potential to emit PM10 from these turbines during normal operation is at least 11.0 ton/yr.130 Most of the PM/PM10/PM2.5 is from the cooling towers, whose baseline emissions are presented in Table E-29 without explanation.
GT1 and GT2 contribute to the total PM10 emissions. When calculated as required in the Draft Permit, those units tip the total PM10 over the proposed cap of 63 ton/yr. The Draft Permit must be revised to require periodic stack testing of PM10 emissions from GT1 and GT2 and include emissions from startup, shutdown and malfunctions at these existing gas turbines.
C. Gas Turbine GT3 – GT7 PM10 Emissions Are Not Enforceable
The potential to emit PM10 from GT3 to GT7 consists of emissions from two sources: normal operations (48.2 ton/yr) and startup and shutdown (6.7 ton/yr) emissions. Malfunction emissions were inexplicably excluded.
1. Startup, Shutdown, and Malfunction Emissions
The Draft Permit does not require the facility to include startup, shutdown, and malfunction emissions in the PM10 cap and does not require any testing to assure that these emissions plus those from other sources comply with the cap. The Draft Permit requires annual stack testing of PM10 “under representative operating conditions…Operations during periods of startup, shutdown, and equipment malfunction shall not constitute representative conditions for performance tests unless otherwise specified in the applicable standard or permit conditions.” (Draft Permit, p. 24-25, Table 6, note (c).) Proposed Condition 21(b) does not even require that malfunction hours be recorded. Thus, startup, shutdown, and malfunction emissions are explicitly excluded from testing, and the draft Permit does not even require that malfunction hours be identified. (Draft Permit, p. 21, Condition 21(b).) This exclusion is also contrary to BACT requirements. In re RockGen Energy Ctr., 8 E.A.D. 536, 553-55 (EAB 1999)(holding that PSD permits may not contain blanket exemptions allowing emissions in excess of BACT limits during startup and shutdown); In re Tallmadge Energy Center, Order Denying Review in Part and Remanding in Part, PSD Appeal No. 02-12 (EAB May 21, 2003)(“BACT requirements cannot be waived or otherwise ignored during periods of startup and shutdown”). The County should require continuous monitoring during startup, shutdown and malfunction to ensure that Ocotillo does not exceed the PM10 cap.
129 PM10 emissions from GT1 and GT2: (2,928,000 MMBtu/yr)( 6.6E-03 lb/MMBtu)/2000 lb/ton = 9.66 ton/yr. 130 PM10 emissions from GT1 and GT2: (2,928,000 MMBtu/yr)( 7.5E-03 lb/MMBtu)/2000 lb/ton = 10.98 ton/yr.

52
2. Normal Operation PM10 testing of gas turbine emissions during normal operation is also inadequate to assure
compliance with the PM10 cap. The draft Permit stipulates that PM10 emissions from new units GT3 to GT7 “shall be calculated using monitored fuel flow and emission factors from the most recent performance test for each unit, unless an alternative emission factor can be demonstrated to the satisfaction of the Control Officer and the Administrator to be more representative of emissions.” (Draft Permit, p. 17, Table 4, Note (e).) Elsewhere, the Draft Permit indicates performance tests will only be conducted on all five gas turbines every three years and on only two gas turbines during intervening years (Draft Permit, p. 25, Table 6, note 3):
Initial PM10 and VOC tests shall be performed on all 5 GTs. Subsequent annual PM10 and VOC tests shall be performed on at least 2 GTs. The same GT may not be tested in consecutive years and all 5 GTs shall be tested at least once every 3 years. The higher emission rate from the 2 annual PM10 and VOC performance tests shall be applied to all 5 GTs until a new emission rate is established by the next annual performance tests.
The cap, designed to avoid NNSR, must be continuously enforceable and can only be enforced through appropriate monitoring, testing and reporting of emissions. An appropriate hierarchy for specifying monitoring to determine compliance is: (1) continuous direct measurement where feasible; (2) initial and periodic direct measurement where continuous monitoring is not feasible; (3) use of indirect monitoring, e.g. surrogate monitoring, where direct monitoring is not feasible; and (4) equipment and work practice standards where direct and indirect monitoring are not feasible.131 The Draft Permit monitoring provisions for the PM10 emissions from the gas turbines during normal operation does not comport with this guidance.
The Draft Permit requires CEMS to determine compliance with limits on NOx and CO. CEMS are available for PM, but are not required. While the PM CEMS measures PM, rather than PM10, essentially 100% of the particulate matter from gas turbines is PM10. Thus, a conventional PM CEMS is appropriate in this application. Alternatively, a surrogate, such as opacity, should be considered to assure continuous compliance.
A stack test normally lasts only a few hours (3-6 hours)132 and is conducted under ideal, prearranged conditions, typically at maximum load. Staged annual or other periodic testing tells one nothing about emissions during routine operation or startups and shutdowns on the other 364 days of the year, or 8,750 plus hours. One 3-hour test per year over a 30-year facility life at 46% capacity (see Comment I.B.1) amounts to testing only about 0.1% of the operating hours. This is a long way from demonstrating continuous compliance with the PM10 emission cap.
Further, annual stack testing does not capture spikes caused by normal process operations. Some routine process operations that occur only periodically, from daily to monthly, emit large amounts of PM10. Emissions of PM10, for example, substantially increase during SCR catalyst cleaning or during wind storms that increase particulate matter in inlet air. The annual or less
131 NSR Manual, pp. H.10, I.3. 132 The Draft Permit, pdf 30, Table 6, note (g), requires three test run with each run lasting at least one hour.

53
frequent PM10 stack tests are, therefore, likely to significantly underestimate emissions and are not sufficient to assure PM10 emissions remain below the cap.
Finally, it is well known that “[m]anual stack tests are generally performed under optimum operating conditions, and as such, do not reflect the full-time emission conditions from a source.”133 A widely-used handbook on Continuous Emissions Monitoring (“CEMs”) notes, with respect to PM10 source tests, that: “Due to the planning and preparations necessary for these manual methods, the source is usually notified prior to the actual testing. This lead time allows the source to optimize both operations and control equipment performance in order to pass the tests.”134
An annual stack test does not provide an adequate method to assure that the PM10 cap is met on “continual basis” year in and year out. This issue is particularly relevant in this case because Ocotillo is avoiding NNSR review only because the Applicant has asserted that it will cap PM10 emissions. Without the ability to verify that cap, there is a high likelihood that Ocotillo will emit PM10 at a rate that would trigger NNSR. The Permit should be revised to require the use of a PM CEMS, include more frequent stack testing for PM10 at all turbines, or include continuous indicator monitoring, e.g., opacity, to address those periods when direct stack testing is not conducted.
D. Cooling Tower PM10 Emissions Are Not Enforceable
The Application and TSD estimated PM10 emissions from the cooling tower, using an equation from AP-42. (Ap., Appx. B, p. 53; TSD, p. 15.) This equation requires four inputs: (1) circulating water flow rate; (2) drift loss; (3) circulating water TDS; and (4) particle size multiplier, i.e., fraction of total particulate matter that is PM10.
The proposed permit allows the cooling tower contribution to be calculated, using exactly the same inputs for these parameters as assumed in the initial emission calculations, namely, a circulating water flow rate of 61,500 gpm, a TDS of 12,000 ppm, a drift loss of 0.0005%, and a particle size multiplier of 0.315. (Draft Permit, p. 18.) To be enforceable, the Permit should be modified to require the facility to confirm cooling tower emissions at least annually using stack testing method.135 At all other times, PM10 emissions should be calculated using the formulae in Condition 18(e) and actual measurements of drift rate, circulating water flow rate, and circulating water TDS.
The compliance method in the Draft Permit is nothing more than a calculation, using all of the same inputs as assumed in developing the PM10 cap. Cooling tower PM10 emissions are therefore not enforceable. In order to assure that the cooling tower contribution to the PM10 cap is enforceable, each of these inputs must be measured and the actual measured values used in the subject equation to confirm that the calculations are representative of actual operations.
133 40 Fed. Reg. 46,241 (Oct. 6, 1975). 134 James A. Jahnke, Continuous Emission Monitoring, 2nd Ed., John Wiley & Sons, Inc., New York, 2000, at p. 241. 135 See Pio Pico Permit, pdf 11, Condition G.1.ii. Available at: http://www.epa.gov/region9/air/permit/pdf/piopico/final-permit-pio-pico-2012-02.pdf
54
TDS Concentration a)
The proposed Permit requires daily monitoring of conductivity and monthly monitoring of TDS. (Draft Permit, p. 22.) The Permit should be revised to require that this measured data be used in the cooling tower equation to estimate cooling tower PM10 emissions.
Circulating Flow Rate b)
The Draft Permit does not require that the circulating water flow rate be monitored. The Permit must be modified to require monitoring of the circulating water flow rate and the actual monitored flows must be used to calculate cooling tower PM10 emissions.
Drift Loss c)
The Draft Permit, Condition 20(b) requires that the cooling tower vendor certify the drift eliminators to achieve less than or equal to 0.005% drift. (Draft Permit, p. 19.) However, the Draft Permit does not require monitoring to confirm that this standard is met and is continued to be met over the operational life of the facility. Drift can be measured using Modified Method 306 or Cooling Technology Institute Acceptance Test Code (ATC 140) – Isokinetic Drift Measurement Test Code for Water Cooling Tower. Drift testing is commonly required for cooling tower permits.136
Particle Multiplier d)
The particles multiplier is the fraction of the total emitted particulate matter that is PM10. As explained elsewhere in these comments, the particle size multiplier assumed in the TSD calculations is inconsistent with test data and represents a significant underestimate of PM10 emissions from cooling towers. This factor can and should be measured with standard tests.
E. PM10 Emissions From The Cooling Tower Underestimated
The Applicant estimated PM10 emissions from the new cooling tower assuming that 31.5% of the cooling tower PM emissions is PM10, “consistent with the majority of power plants in Maricopa County.” (TSD, pp. 15, 16.) This 31.5% is the “k factor” in the equation in the Draft Permit specified to estimate cooling tower PM10 emissions. (Draft Permit, p. 18.) This factor is required to calculate PM10 emissions from the cooling tower, but the draft Permit does not require that it be measured.
The use of 31.5% substantially underestimates PM10 emissions from the cooling tower. A Cooling Tower Institute (CTI) study demonstrates scientifically that all particulate matter exiting cooling towers is PM10.
137 The California Energy Commission (“CEC”), the agency responsible for all environmental impact evaluation and permitting of power plants in California, has adopted a regulatory assumption that all cooling tower particular emissions are PM10.
138
136 Pio Pico Energy Center PSD Permit November 2012, p. 11, Condition G.1.c.v. 137 Weast, T.E., Stich, N.M., Israelson, G., Reduction of Cooling Tower PM10 Emissions Due to Drift Eliminator Modifications at a Chemical Refining Plant, CTI Paper No. TP92-10, Cooling Technology Institute Annual Meeting, Houston, TX, February 1992. 138 California Energy Commission, Preliminary Staff Assessment, Palomar Energy Project, Application For Certification (01-AFC-24) San Diego County, August 27, 2002, Air Quality Table 10, pg. 4.1-22.

55
F. PM10 From Ammonia Emissions Excluded
The NOx emissions from the six new gas turbines will be controlled with selective catalytic reduction (SCR). SCR emits ammonia, known as “ammonia slip”. The Applicant has proposed an ammonia slip limit of 10 ppm. The ammonia is converted into particulate matter, including PM10 in both the gas stream and in the atmosphere. In fact, elsewhere, the Applicant admits that SCR is a potential source of PM emissions. (Ap., Appx. B, p. 22.) Thus, PM10 emissions from ammonia slip must be included in the PM10 cap. The County did not include these emissions.
Excess residual ammonia downstream of the SCR system can react with SO3, NO2, and water vapor in the stack gases and downwind in the atmosphere to form ammonium sulfate, ammonium bisulfate, and ammonium nitrate according to the following reactions.139 140 141
SO3 + 2 NH3 (NH4)2SO4 (1) SO3 + NH3 NH4HSO4 (2) NO2 + OH + NH3 NH4NO3 (3)
These equations can be used to estimate secondary PM10 formation from ammonia slip.
Secondary PM10 can be formed by reaction of ammonia with SO3 and NO2 emitted by the gas turbines and present in the stack gases and plume as well as additional SO3 and NO2 that are present downwind in the atmosphere. Additional ammonium nitrate could form from the reaction of NO2 in the atmosphere with any emitted ammonia.
VII. NOX EMISSION CAP IS NOT ENFORCEABLE
The Project area is designated nonattainment for the 2008 8-hour ozone standard, classified as marginal. (TSD, p. 20.) The NNSR significance threshold for NOx is 40 ton/yr. (TSD, Tables 18 & 24.) If NOx emissions equal or exceed 40 ton/yr, NNSR is triggered, which would require LAER for NOx and VOC emissions. Thus, to avoid NNSR review for NOx, the Applicant is proposing a NOx emission cap of 125.5 ton/yr across the proposed new gas turbines and emergency generator so that Ocotillo does not exceed the NNSR significance threshold of 40 ton/yr. (TSD, p. 7 and Tables 18 & 24; Draft Permit, Table 1.)
A. The Increase In NOx Emissions Due to the Project Were Not Properly Rounded
The net increase in NOx emissions is reported as 39.5 ton/yr in the TSD (Table 24, p. 27) and as 39.6 ton/yr in the CEC Application. (CEC Ap., Exhibit B1, Table B1-3, p.B1-3.) In either case, the net increase in NOx emissions rounds up to 40 tons/yr, the significance threshold for
139 John H. Seinfeld and Spyros N. Pandis, Atmospheric Chemistry and Physics, John Wiley & Sons, Inc., New York, 1998 (Seinfeld and Pandis 1998), pp. 529-534;. 140 S. Matsuda, T. Kamo, A. Kato, and F. Nakajima, Deposition of Ammonium Bisulfate in the Selective Catalytic Reduction of Nitrogen Oxides with Ammonia, Ind. Eng. Chem. Prod. Res. Dev., v. 21, 1982, pp. 48-52 (Matsuda et al. 1982). See also South Coast AQMD 6/12/98, p. 3-3. 141 J.M. Burke and K.L. Johnson, Ammonium Sulfate and Bisulfate Formation in Air Preheaters, Report EPA-600/7-82-025a, April 1982 (Burke and Johnson 1982).

56
NNSR and PSD. If emissions equal or exceed 40 ton/yr, NNSR is triggered. In this case, using just the Applicant’s calculations, NOx emissions equal 40 ton/yr, which triggers both PSD and NNSR.
The NOx NNSR significance threshold of 40 ton/yr is reported to two significant figures, or arguably, one.. Further, the NOx netting calculations (TSD, Table 24) that derived the net increase in NOx emissions include factors and calculations based on only two significant figures. (Ap., Appx. E.) Thus, the results of the netting calculations should be reported to no more than two significant figures, not three significant figures (39.5 or 39.6 ton/yr). The County has ignored standard engineering procedures for reporting results of calculations, taught in basic math, statistics and science courses, in EPA air pollution courses, and in air district guidance. The number of significant figures is simply the number of figures that are known with some degree of reliability. It is well established among professional engineers and scientists that the result of a calculation should be written with no more than the smallest number of significant figures of any of the factors included in the calculation. “The product often has a different precision than the factors, but the significant figures must not increase.”142 This is standard practice throughout the engineering and scientific professions.143 This rule is taught in EPA air pollution training courses.144 The EPA Manual instructs: "When approximate numbers are multiplied or divided, the result is expressed as a number having the same number of significant digits as the expression in the problem having the least number of significant digits. In other words, if you multiply a number having four significant digits by a number having two significant digits, the correct answer will be expressed to two significant digits."145 The San Joaquin Valley Air Pollution District’s (SJVAPCD) Guidance APR 1105, Guidelines for the Use of Significant Figures In Engineering Calculations is in accord. The Guidance instructs that “Rounding off is accomplished by dropping the digits that are not significant. The digits 0, 1, 2, 3, and 4 are dropped without altering the preceding digit. The preceding digit is increased by one when a 5, 6, 7, 8, or 9 is dropped.”
Thus, the results of the multiplications and additions used in the County’s emission calculations should have been rounded off to the same number of significant figures as the factor with the least number of significant figures in the underlying calculations, which is two. Further, the significance threshold itself is reported to just two significant figures (and perhaps just one). Therefore, the results of the NOx netting analysis in TSD Table 24 should have been reported to no more than two significant figures, corresponding to the number of significant figures in the underlying factors used in the calculations, not to three significant figures, or 39.5 or 39.6 ton/yr,
142 E.A. Avallone and T. Baumeister III (Eds.), Marks’ Standard Handbook for Mechanical Engineers, 10th Ed., McGraw-Hill, New York, 1996, p. 2-4. 143 See, e.g., Philip R. Bevington, Data Reduction and Error Analysis for the Physical Sciences, McGraw-Hill, Inc., 1969, pp. 4, 9; Lothar Sachs, Applied Statistics. A Handbook of Techniques, 2nd Ed., Springer-Verlag, New York, 1984, p. 21. 144 U.S. EPA, APTI Virtual Classroom, Course SI 100: Mathematics Review for Air Pollution Control, Available at: Lesson 2 Significant Figures and Rounding off, Available at: http://yosemite.epa.gov/oaqps/EOGtrain.nsf/DisplayView/SI_100_0-5?OpenDocument and Lesson 2, Available at: http://yosemite.epa.gov/oaqps/EOGtrain.nsf/fabbfcfe2fc93dac85256afe00483cc4/4939717614a0227e85256f400062252e/$FILE/Lesson2.pdf. 145 EPA Manual, p. 2-5/2-6.

57
in an attempt to avoid NNSR review. Rounding of 39.5 or 39.6 to two significant figures yields 40 ton/yr. This equals the NNSR significance threshold, requiring NNSR review for NOx.
Further, we note that the netting analysis in the TSD is based on Project NOx net emission increases of 125.4 ton/yr. (TSD, Table 24.) However, the proposed NOx cap in the Draft Permit is based on 125.5 ton/yr. Assuming, arguendo, that the claimed creditable decrease are accurate, the net increase in NOx emissions allowed by the draft Permit is 125.5 – 85.9 = 39.6 ton/yr, consistent with the CEC Application.
B. Compliance Provisions Exclude Gas Turbine Malfunction and Emergency Generator Emissions
The NOx cap of 125.5 ton/yr includes all new NOx emissions from GT3 – GT7 plus EG1
and EG2. (Draft Permit, p. 16, Table 1.) Note (c) to this table indicates that compliance would be determined using CEMS for normal operations, startup/shutdown periods, and tuning/testing periods for GT3 to GT7. However, the Draft Permit does not require that NOx emissions from malfunctions or from the emergency generators be measured and included in the NOx cap emission summary. Thus, there is no assurance that NOx emissions will remain below the cap.
Sierra Club appreciates the opportunity to provide these comments.
Sincerely,
____Original signed by:_____ Travis Ritchie Associate Attorney Sierra Club 85 Second Street, Second floor San Francisco, CA 94105 (415) 977-5727 [email protected]