heterodyne frequency measurements on the 1 i .6-~m band …
TRANSCRIPT

Reprinted from Applied Optics, Vol. 20, page 1676, May 1,1981 Copyright 0 1981 by the Optical Society of America and reprinted by permission of the copyright owner.
Heterodyne frequency measurements on the 1 I . 6 - ~ m band of OCS: new frequency/wavelength calibration tables for 11.6- and 5.8-pm OCS bands
J. S. Wells, F. R. Petersen, A. G. Maki, and D. J. Sukle
Heterodyne difference frequency measurements between a I3CO2 laser and a diode laser tuned (and in most cases locked) to the peaks of OCS absorption lines have been used to improve frequency calibration tables in the 860-cm-' region by factors of 20-50. Measurements have been made on the vibrational transitions 10°O-OO('0, 1l1O-01'O, and 2OoO-1Oo0 for OCS. The measurements on the 10°O-OOoO and 20°0-10°O transi- tions are also used to provide frequency calibration tables for the 20°0-OOoO band of OCS near 1700 cm-'.
1. Introduction In an earlier paper1 heterodyne measurements were
reported for some of the frequency differences between the 2u2 absorption band of OCS (carbonyl sulfide) near 1050 cm-l and the nearby CO2 laser transitions. Since the frequencies of the COn laser transitions have been measured with high accuracy,2 such heterodyne mea- surements give very accurate frequencies for the OCS absorption lines. Even more recent measurements by Sattler et al. on higher rotational transitions give fur- ther improvements in the accuracy of the OCS ab- sorption lines near 1050 cm-I. Such measurements are needed to provide convenient and accurate absorption frequency standards for the calibration of tunable laser devices, such as tunable diode lasers.
This paper reports the results of similar difference frequency measurements between l3C02 laser lines and the ul OCS absorption lines near 870 cm-l. Intensity measurements also have been made for two U I OCS absorption lines. From these measurements a table of intensities and recommended frequencies (with the estimated uncertainties) is given for use in the calibra- tion of the frequencies of tunable laser devices.
D. J. Sukle is with Community College of Denver, Division of Science, Westminister, Colorado 80030; A. G. Maki is with U.S. Na- tional Bureau of Standards, Molecular Spectroscopy Division, Washington, D.C. 20234; the other authors are with U.S. National Bureau of Standards, Time & Frequency Division, Boulder, Colorado 80303.
Received 4 December 1980.
This work also gives heterodyne measurements and conventional diode laser measurements for a number of hot band absorption lines. Measurements on the 2O0O-1O00 hot band yield constants which have been used to provide improved calibration tables for the 2O0O-0O00 band of OCS near 1710 cm-l.
An earlier paper4 reported the results of grating and diode laser measurements on the u1 and 2vl bands of OCS. That paper gave preliminary wave numbers for OCS lines from 825 to 885 cm-l and from 1655 to 1737 cm-l. While those tables are still useful for indicating the relative positions and intensities of some of the hot bands and isotopic species, this paper presents tables of line frequencies (and wave numbers) that are more than an order of magnitude more accurate.
II. Description of Experimental Details Since a detailed account of our heterodyne mea-
surement technique was presented earlier,l we will give only a recapitulation and indicate some recent changes. A block diagram of the experimental arrangement for our frequency measurement procedure is shown in Fig. 1. The tunable diode laser (TDL) is operated in a liquid helium Dewar which can accommodate three such de- vices. The chopped tunable diode laser beam goes through a monochromator, and a portion of the emerging beam is split off and goes through an OCS cell to a detector. The signal from the detector is phase detected a t the chopper frequency and displayed on a recorder. In addition to the obvious functions of mode rejection and coarse calibration, the monochromator is also used to level the transmitted power as a function of frequency as the TDL scans in the vicinity of the OCS line to be measured. A flat background level allows one to use a first derivative (instead of a third derivative lock) to stabilize the diode laser to the OCS line.
1676 APPLIED OPTICS / Vol. 20, No. 9 / 1 May 1981
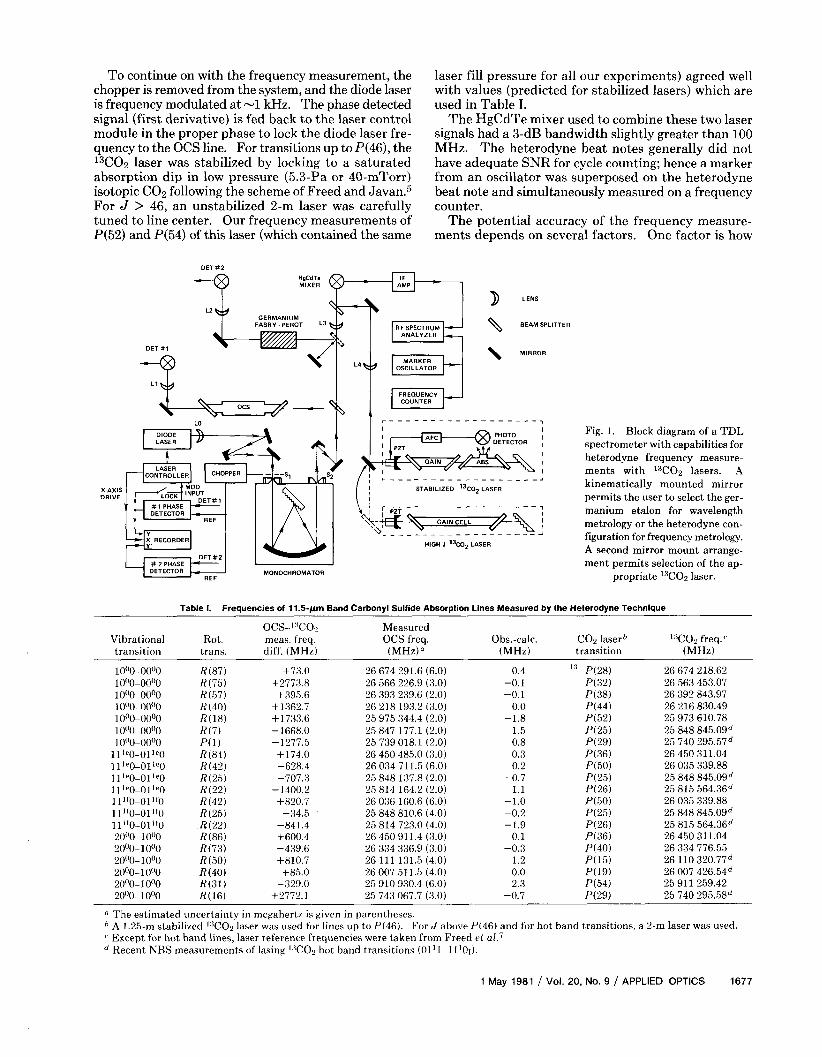
To continue on with the frequency measurement, the chopper is removed from the system, and the diode laser is frequency modulated a t -1 kHz. The phase detected signal (first derivative) is fed back to the laser control module in the proper phase to lock the diode laser fre- quency to the OCS line. For transitions up to P(46), the l3CO2 laser was stabilized by locking to a saturated absorption dip in low pressure (5.3-Pa or 40-mTorr) isotopic COz following the scheme of Freed and Javan.5 For J > 46, an unstabilized 2-m laser was carefully tuned to line center. Our frequency measurements of P(52) and P(54) of this laser (which contained the same
laser fill pressure for all our experiments) agreed well with values (predicted for stabilized lasers) which are used in Table I.
The HgCdTe mixer used to combine these two laser signals had a 3-dB bandwidth slightly greater than 100 MHz. The heterodyne beat notes generally did not have adequate SNR for cycle counting; hence a marker from an oscillator was superposed on the heterodyne beat note and simultaneously measured on a frequency counter.
The potential accuracy of the frequency measure- ments depends on several factors. One factor is how
DET#P
HgCdTe MIXER
I
DET I t 1
9
GERMANIUM FABRY PEROT L3
MARKER a, OSCILLATOR
ANALYZER
LENS
BEAM SPLITTER
MIRROR
X AXIS DRIVE
HIGH J 1 3 ~ 0 ~ LASER
Fig. 1. Block diagram of a TDL spectrometer with capabilities for heterodyne frequency measure- ments with I3CO2 lasers. A kinematically mounted mirror permits the user to select the ger- manium etalon for wavelength metrology or the heterodyne con- figuration for frequency metrology. A second mirror mount arrange- ment permits selection of the ap-
propriate 13C02 laser.
Table 1. Frequencies of 11.5-um Band Carbonyl Sulfide Absorption Lines Measured by the Heterodyne Technique
ocs-- ' : 'Cor Measured Vibrational Rot. meas. f'req. OCS freq. 0bs.-calc. COn laserh '"COZ freq."
(MHz) transition transition trans. dit'f. (MHz) (MHz)" (MHz)
+73.0 +2773.8
+395.6 +1:362.7 + 1733.6 - 1668.0 - 1277.5 +174.0 -628.4 -707.3
-1400.2 +820.7
-34.5
+600.4 -439.6 +810.7 +85.0
+2772.1
-841.4
-329.0
26 674 291.6 (6.0) 26 566 226.9 (3.0) 26 393 239.6 (2.0) 26 218 193.2 (3.0)
25 847 177.1 (2.0)
26 450 485.0 (3.0) 26 034 711.5 (6.0) 25 848 137.8 (2.0) 25 814 164.2 (2.0) 26 036 160.6 (6.0) 25 848 810.6 (4.0) 25 814 723.0 (4.0) 26 450 911.4 (3.0) 26 334 336.9 (3.0) 26 111 131.5 (4.0) 26 007 51 1.5 (4.0) 25 910 930.4 (6.0) 25 743 067.7 (3.0)
25 975 344.4 (2.0)
25 739 018.1 (2.0)
0.4 -0.1 -0.1
0.0 -1.8
1.5 0.8 0.3 0.2
-0.7 1.1
-1.0 -0.2 -1.9
0.1 -0.3
1.2 0.0 2.3
-0.7
26 674 218.62 26 563 453.07 26 392 843.97 26 216 830.49 25 973 610.78 25 848 845.0gd 25 740 295.57d 26 450 311.04 26 035 339.88 25 848 845.0gd 25 815 564.36d 26 035 339.88 25 848 845.0gd 25 815 564.36d 26 450 311.04 26 334 776.55 26 110 320.77d 26 007 426.54d 25 911 259.42 25 740 295.58d
0 The estimated uncertainty in megahertz is given in parentheses. A 1.25-m st.abilized ':'COZ laser was used for lines up to P(46). For J above P(46) and for hot band transitions, a 2-m laser was used. Except for hot band lines, laser reference frequencies were taken from Freed et aL7 Recent NBS measurements of lasing ':'C02 hot band transitions (O1'l-lllO1).
1 May 1981 / Vol. 20, No. 9 / APPLIED OPTICS 1677
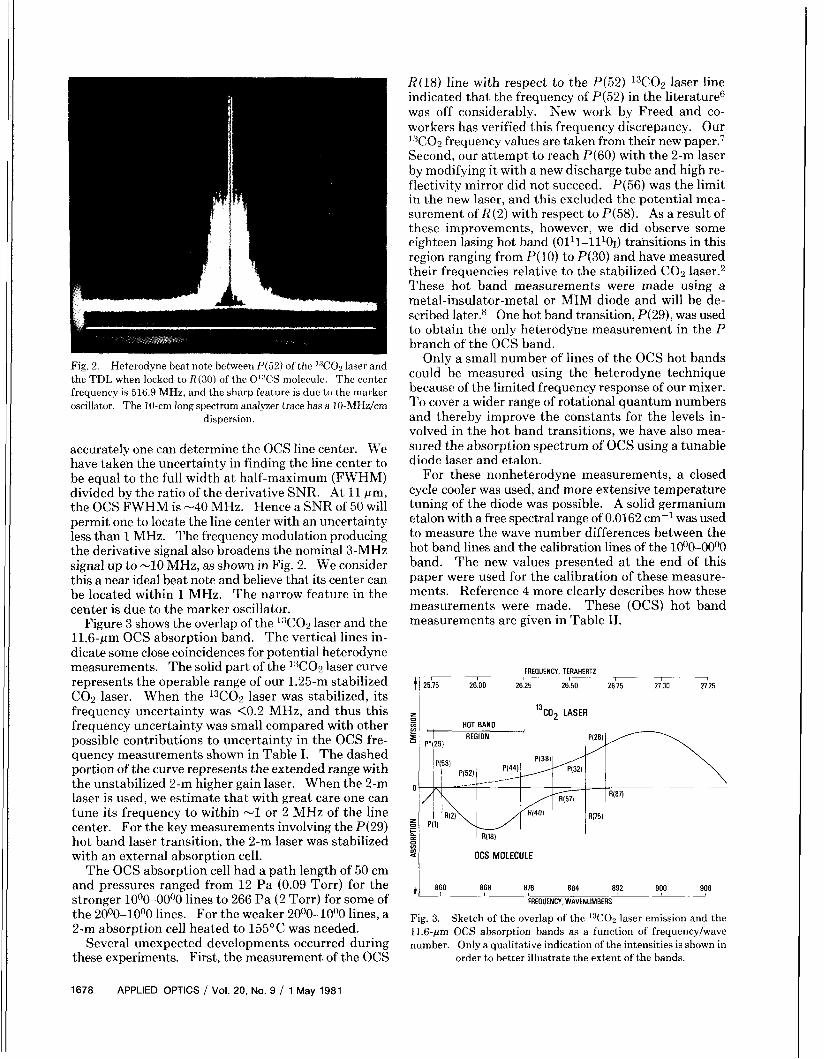
Fig. 2. Heterodyne beat note between P(52) of the I3COz laser and the TDL when locked to R(30) of the O':lCS molecule. The center frequency is 516.9 MHz, and the sharp feature is due to the marker oscillator. The 10-cm long spectrum analyzer trace has a lO-MHz/cm
dispersion.
accurately one can determine the OCS line center. We have taken the uncertainty in finding the line center to be equal to the full width at half-maximum (FWHM) divided by the ratio of the derivative SNR. At 11 pm, the OCS FWHM is -40 MHz. Hence a SNR of 50 will permit one to locate the line center with an uncertainty less than 1 MHz. The frequency modulation producing the derivative signal also broadens the nominal 3-MHz signal up to -10 MHz, as shown in Fig. 2. We consider this a near ideal beat note and believe that its center can be located within 1 MHz. The narrow feature in the center is due to the marker oscillator.
Figure 3 shows the overlap of the 13C02 laser and the 11.6-pm OCS absorption band. The vertical lines in- dicate some close coincidences for potential heterodyne measurements. The solid part of the 13C02 laser curve represents the operable range of our 1.25-m stabilized CO2 laser. When the 13C02 laser was stabilized, its frequency uncertainty was <0.2 MHz, and thus this frequency uncertainty was small compared with other possible contributions to uncertainty in the OCS fre- quency measurements shown in Table I. The dashed portion of the curve represents the extended range with the unstabilized 2-m higher gain laser. When the 2-m laser is used, we estimate that with great care one can tune its frequency to within -1 or 2 MHz of the line center. For the key measurements involving the P(29) hot band laser transition, the 2-m laser was stabilized with an external absorption cell.
The OCS absorption cell had a path length of 50 cm and pressures ranged from 12 Pa (0.09 Torr) for the stronger 10°O-OOoO lines to 266 Pa (2 Torr) for some of the 20°0-10°O lines. For the weaker 20°0-10°O lines, a 2-m absorption cell heated to 155°C was needed.
Several unexpected developments occurred during these experiments. First, the measurement of the OCS
R(18) line with respect to the P(52) 13C02 laser line indicated that the frequency of P(52) in the literature6 was off considerably. New work by Freed and co- workers has verified this frequency discrepancy. Our 1W02 frequency values are taken from their new paper.7 Second, our attempt to reach P(60) with the 2-m laser by modifying it with a new discharge tube and high re- flectivity mirror did not succeed. P(56) was the limit in the new laser, and this excluded the potential mea- surement of R(2) with respect to P(58). As a result of these improvements, however, we did observe some eighteen lasing hot band (Ol11- l l1O~) transitions in this region ranging from P(l0) to P(30) and have measured their frequencies relative to the stabilized CO2 laser.2 These hot band measurements were made using a metal-insulator-metal or MIM diode and will be de- scribed later.8 One hot band transition, P(29), was used to obtain the only heterodyne measurement in the P branch of the OCS band.
Only a small number of lines of the OCS hot bands could be measured using the heterodyne technique because of the limited frequency response of our mixer. To cover a wider range of rotational quantum numbers and thereby improve the constants for the levels in- volved in the hot band transitions, we have also mea- sured the absorption spectrum of OCS using a tunable diode laser and etalon.
For these nonheterodyne measurements, a closed cycle cooler was used, and more extensive temperature tuning of the diode was possible. A solid germanium etalon with a free spectral range of 0.0162 cm-l was used to measure the wave number differences between the hot band lines and the calibration lines of the 10°O-OOoO band. The new values presented at the end of this paper were used for the calibration of these measure- ments. Reference 4 more clearly describes how these measurements were made. These (OCS) hot band measurements are given in Table 11.
FREDUENCY TERAHERTZ I I -7
26 25 2650 2675 27 00 27 25
' I %o, LASER
! ' i HOT BAND
REGION I
\
868 876 884 892 900 908 I I
FREDUENCY. WAVENUMBERS
Fig. 3. Sketch of the overlap of the 13C02 laser emission and the 11.6-pm OCS absorption bands as a function of frequencylwave number. Only a qualitative indication of the intensities is shown in
order to better illustrate the extent of the bands.
1678 APPLIED OPTICS / Vol. 20, No. 9 / 1 May 1981

111.
Table I gives the results of the present heterodyne measurements. In addition to the measured frequency differences and the derived frequencies of the OCS lines, Table I also gives the frequencies for the 13C02 laser transitions determined by the most recent ~ o r k . ~ J
The assignment of the measured OCS lines was fairly straightforward. The mode selecting monochromator was calibrated so that the central frequency of a given diode scan was known to within about fO.10 cm-'. The tables given in Ref. 4 and also calculations provided by Faytg were extremely useful for assigning lines through pattern recognition, i.e., by taking into account fre- quency separations and relative intensities. When needed for line identification, solid germanium etalons with fringe spacings (free spectral ranges) of 0.017 or 0.05 cm-l were used to measure approximate frequency differences.
When it was suspected that an absorption line was
1s012C34S), the spectrum of an enriched sample was
Results and Analysis of the Data
due to one of the isotopes (1s012C"2S, 1s013C32S 1 or
recorded to verify the assignment. In this way a few measured lines were shown to be due to 1s013Cc3"Sl al- though the vibrational assignment could not always be determined (further measurements on isotopic species will be the subject of a future paper).
To analyze the two 1 = 0 vibrational transitions, 10°O-OOOO and 2O0O-1O0O1 we used the term value ex- pression:
T(u ,J) = F ( u ) + B"J(J + 1) - D " J W + 1 1 2
+ H J W + 113, (1)
( 2 )
In addition to the heterodyne measurements reported in Table I, the analysis included appropriate microwave measurements taken from Refs. 10 and 11. The anal- ysis of the 2O00-1Oo0 band also included diode mea- surements calibrated against the 10°O-OOOO lines (using Table 111) and given in Table 11. A least squares anal- ysis of the data was performed with each datum given a weight inversely proportional to the square of the es- timated uncertainty. The uncertainties assigned to each measurement are given in Tables I and 11.
Y&' - u " ) = F(u') - F(u") .
Table It . Hot Band Transitions for OCS Calibrated Against the 10°O-00'0 Frequencies
1 l'"0-0 1 ' e 0 11 '~0-01"0 2000-1 0"0 Hotat ional Obs. freq. 0 - C h Rotationa! Ohs. freq. 0-C Rotational Obs. freq. 0 - C b transition (unc.)ll (MHz) (MHz) transition (unc.)" (MHz) (MHz) transition lunc.)" (MHz) (MH7.1
25 016 835 (18) 5 25 1x3 957 (24) 2 25 150 399 (34) -8 25 369 904 (1 2 ) 8 25 445 056 (72) -15 25 457 473 (50) -10 25 482 221 (56) 1 3 25 567 720 (50) 3 3 25 60:1 835 (20) 19 25 756 864 (50) 18 25 768 376 (40) -2 '5 779 882 (40) 6 25 791 337 (32) -:1 25 80' 774 ( 2 8 ) 5 25 870 620 (1 2) 5 25 881 796 (12) -5 25 980 890 (48) -7 26 066 567 ( 12 ) -4 26 077 132 (20) 1 :3 26 087 634 (20) 3 26 240 939 ( 7 2 ) 9 26 250 847 ( 1 2 ) -7 26 260 731 (20) -10 26 270 567 ( 2 0 ) -24 26 280 400 ( 3 5 ) -:1 26 290 177 (12) 0 26 299 914 ( 2 0 ) 1 26 309 618 ( 2 2 ) 6
25 017 087 (18) 25 124 041 (24) 25 150 435 (34) 25 444 996 (72) 25 457 428 (50) 25 482 167 (56) 25 567 748 (50) 25 603 886 (20) 25 757 254 (50)
25 780 352 (40) 25 791 832 (36) 25 803 299 (32) 25 837 502 (20) 25 871 367 (12) 25 982 092 (40) 26 046 877 (64) 26 057 532 (64) 26068174(20) 26 078 790 (16) 26 243 601 (SO) 26 2.553 584 (28) 26 263 537 (20) 26 273 460 (20) 26 283 345 (35) 26 303 002 (12) 26 312 748 (12)
25 768,80" (4U)
-10 -7
-29 -1 13 13 32 -9 1%
-4 -4 -1
3 19 1 0 6
-13 -10
2 10 1
-2 :I 7
12 -11
25 015 363 (12) 25 123 049 (32) 25 149 580 (41) 25 356 839 (12) 25 369 499 (30) 25 444 543 (68) 25 456 940 (50) 25 469 294 (58) 25 481 612 (52) 25 566 77' ('0) 25 590 728 (12) 25 754 538 (72) 25765927(20) 25 777 313 (16) 25 788 678 (12) 25 799 968 (12) 25 811 240 (20) 25 833 656 (12) 25 878 044 (60) 25 986 322 (12) 26 049 428 (40) 26 059 810 (48) 26 070 147 (36) 26 080 469 (28) 26 239 922 (80) 26 259 124 (30) 26 268 673 (16) 26 278 161 (50) 26 287 652 (32) 26 297 051 (40) 26 306 443 (48)
-15 -8
-34 6
24 - 10
3 9
16 30 -8 14
-15 - 10
1 3 -2
3 -1
:3 3
-1 -1 -6 12 7
-2 3
-13 16
-8 3
The estimated uncertainty (primarily associated with temperature instability in the etalon which we believe is the major source of error in these experiments) is given in parentheses in megahertz.
I , Ohserved frequencies minus frequencies calculated with the constants given in Table 111. The separation o f t h e c and f components h r P ( 5 ) and R(1) was estimated, and the unresolved measurements were corrected for this
splitting.
1 May 1981 / Vol. 20, No. 9 / APPLIED OPTICS 1679

Table 111. Wave Numbers, Frequencies, and Intensities (at 296 K ) of Spectral Lines of the 10°O-OOoO Band of OCS from 815 IO 892 ."' Intensity Intensity
(m-2 dap'.]-l) ( n - 2 da1'a-I) Wave iium1)er Frequency Tran- o r Wave numlier Frequency Tran- or
(cn1-l) (MHz) sition (ctn-' atm-1)" (c111-I) ( M H z ) sition (cm-2
0.000:11 0.000:37 0.00044 0.0005' 0.000fi1 0.0007:1 0.0008~; 0.00101 0.001 19 0.00140 0.00 1 ti:! 0.00391 0.0022:1 0.00'59 0.00:301 0.00:149 0.00404 0.004(;(; 0.005:3(; 0.006 I (i 0.00707 0.0080!) 0.00924 0.01 052 0.01 19C 0.01:357 0.01 5;Hj 0.01 7:35 0.0195(i 0.02200 0.02469 0.0'764 o.o:Io8x 0.03443 0.0:3829 0.04250 0.0470(; 0.05199 0.057:11 0.0(;:304 0.069 I7 0.0757:1 0.08272 0.09014 0.09800 0.106BO 0. I 1 50:1 0.12417 0 . I ?):!I7 2 o.I4:36(; 0.15:396 0.16459 0.17552 0.1867 1 0.1981 1 0.20966 0.22131
0.24465 0.25619 0.26754 0.27862 0.%39:3:1 0.299511 0.30930 0.31 836 0.:32668 0.:3:141(i 0.34070
848.0'784(4) 848.46352(4) 848.89801 (4 ) 849.;3:31:10(4) 849.76341(4) 850.194:12(4) 850.(;2404(4) 851.05257(4) 851.47990(4) 85 1.90604(4) 85".3133098(4) 852.75473(4) 85:1.177'8(4) 85,31.598633(4) 854.01879(4) 854.4:3775(4) 854.85550( 4)
855.68742(4) 856.10 157(4 856.51452(4)
857.7461 5(4) 858.15428(41 858.561 20(4) 859.:37142(4) 859.77471 (4) 860.17679(4) 860.57766(4) 860.977:31(4) 861.:17575(4) 86l.77297(4) 862.16898(4) 862.563376(4) 862.957333(4) 86:1.:34967(4) 86:1.74079(4) 864.1 :3069( 4) 864.5 1 9 3 3 4 ) 864 .')0680(4) 865.299:102( 4 ) 865.67801 (4) 866.061 76(4) 866.44428(4) 86(i.82557(4) 867.2056,3(4) 867.58445( 4) 867.9620:3(4) 868.:1:38:37(4) 868.7 1:146(4) 86!1.08782(4) 869.45993(4) 869.83 129( 4) 870.20141(4) 870.57027(4) 870.93789(4) 871.:10425(4)
872.:<9580( 4) 872.7571:3(4) 87:j.I 1720(4)
874.18982(4) 874.5448:1(4)
2546231 1.9( 12) 25475266.0( 12) 254881843 12) 255010(i7.'( 12) 2551:1914.1(12) 25526725.2( 12) 255319.500.5( 12) 25552240.0( 13) 2556494:3.6( 13) 2557761 1.4(13)
2S(iO28:19.2( 13) 25615399.2( 13) 2562792:1.:3( 13) 2564041 1.4(13) 25T,(i5'864.4( 13) 25665279.4( 13) 25677659.4(13) 2569000:1.:3( 13) 257O2311.0( 1:3) 257 14582,6( 13) 25726818.0( 13) 257:39Ol7.:1( 13) 257633306.11( 13) 2577.5:397.4( 1 3 ) 25787451.4(133) 25799469.1( 13) "81 1450.5( 13) 2,582:3:395,:1( 13)
25847175.6( 13) 2585901 1.0( 13) 25870809.8( 13) 25882571.9(1:3) 25894297.4( 13) 25905986.2( 13) 259176:38.:1( 13) 2592925X.6( 1 :3) 259408:32.1( 12)
25986777.0(12) 259981 70.7( 12) 26009527.4(12) 260X)846.9( 12) 260:32129.:1( 12) 2604:1:374.5( 12) 26054582.:1( 12) 26065752.9( 12) 26076886.1 ( 12) 26087981.9( 12) 26099040.3(12) 261 l00Gl. 1 (12) 26121044.3(12) 26131990.0(12) 26142897.9( 12) 26153768.2(11) 26164600.6(11) 26175:395.2( I 1 ) 26186152.0(11) 26196870.8(11) 26207551.6( 11) 26218194.;1( 11)
0.34621 0.:3.5059 0.35377 0.35565 0.3561(; 0.35524 035282 0.34884 0.:34:128
0.:31684 0.30456 0.2910fi 0.27579 0.25900 0.24074 0.221 I O 0.20016 0.17801 0.15478 0.13059 0.10556 0.07984 0.05357 0.02690 0.02698 0.05:189 0.08055 0.10682 0.1:3255 0.15757 0.181 76 0.20498 0.22710 0.24802 0.26762 0.28582 0.:30255 0,:3177:1 0.33 13 1 0.:;4326 0.:35:355 0.362 18 0.:36914 0 . :3 7 4 4 (i 0.378 15 0.:38027
0.:37997 0.37768 037407 0.369'1 0.:36:120 0.:3561:1
o.:38oa5
0.30829 0.29692 0.26517 0. 2773 1 :1 0.26090 0.24855
continued
1680 APPLIED OPTICS / Vol. 20, No. 9 / 1 May 1981

Table 111, conlinued
Intensity (m-? daPa-')
(c") (MHz) sition (cm-' atin-')" Wave numher Frequency Tran- or
26228798.9( 1 1) 262:39:365.4( 11 ) 2624989:3.6( 11 ) 2626038:1.5( 1 J ) 262708:15.0( 12) 26281248.2( 12) 26291622.9(12) 26301959.0( 12) 26:312256.5(1:1) 26:122515.4( 13) 26332735.6( 13) 26342916.9( 14) 26353059.4( 14) 26:36:316:i.o( 15) 263742'7.(i( 15) 2638:325:1.2( 16) 26:39:1289.6( 16) 2640B186.8(17) 2641:3094.8( 17) 2642296x.q 17) 26432792.8( 18) 26442582.N 18) 26452332.9( 19) 2646204:1.6( 19) 26471 71 4.6( 19) 26481345.9(19) 26490937.3( 19) 26500488.9( 19) 26510000.5( 19) 26519472.1(19) 26528903.6( 19) 26538294.9( 19) 26547646.0(19) 26556956.7( 19) 26566227.0(20) 26575456.8( 20) 26584646.1(21) 26598794.8( 2 2 ) 26602902.7(24) 26611969.8(27) 26620996.1(29) 26629981.5(33) 26638926.8( 37) 26647829.0(42) 26656691.0(48) 2666551 1.8(54) 26674291.2(61) 2668:3029.2(68) 2669 1725.7 (77) 26700380.7(86) 2670899:1.9(96) 26717565.5(107) K(92) 26726095.1( 119) R(93) 26734582.9(131) R(94) 26743028.7(145) R(95)
0.21 157 0.19949 0.18762 0.17602 0.1647J 0.15380 0.14324 0.13308 0.12:3:15 0.11 407 0.1052:) 0.09685 0.08893 0.081 47 0.07447 Q.06791 0.06179 0.05609 0.05081 0.04591 0.04140 0.037 25 0.03344 0.02995 0.02677 0.02:388 0.02125 0.01887 0.01671 0.01478 0.01:104 0.01 148 0.01 008 0.00884 0.00773 0.00674 0.00587 0.0051 1 0.00443 0.00:18:3 0.00:131 0.00285 0.00245 0.0021 0 0.00180 0.00154 0.00131 0.00112 0.00095 0.00080 0.00068 0.00057 0.00048 0.00041 0.000:14
" To within the accuracy of the intensity data, 1 m-2 daPa-' is equal to 1 cm-2 atm-'.
Since the data span the range of rotational quantum numbers from J = 0 to J = 88, the H term was tenta- tively included in Eq. (1). In agreement with earlier conclusions,1° it was found that the ground state data could be fit quite well with Ho = 0. On the other hand, the data were fit somewhat better when H was included as a variable for the fits involving the 20°0 and 10°O states. Even though the uncertainty in the H term is very large, it was included in the analysis of transitioqs involving those states.
Since one goal of this work was to obtain data for the calculation of the 20°0-OOOO transitions near 1700 cm-l, the 10°O-OOOO and 20°0-10°O transitions were analyzed together. This analysis yielded the variance-covariance matrix elements needed to calculate the uncertainties for the calculated 2O00-0Oo0 transitions.
The constants given in Table IV and the variance- covariance matrix elements were used to calculate the frequency calibration data given as Tables 111 and V. In these tables, the calculated uncertainty in each transi- tion frequency is given in parentheses following each entry. This uncertainty is twice the estimated standard deviation obtained from the statistical analysis. This extra factor of 2 was used somewhat arbitrarily to give what we believe is a better estimate of the absolute uncertainty since the statistically determined uncer- tainty is always less than the absolute uncertainty in the frequency because of systematic errors.
One possible source of systematic error could be due to a pressure shifting of the OCS absorption lines. The magnitude of the pressure shift is probably about a tenth of the pressure broadening effect which is <75 kHz/Pa (10 MHzITorr). Since the measurements on the 10°O-OOOO band were made with OCS pressures smaller than 66 Pa (0.5 Torr), the pressure shift is ex- pected to be <0.5 MHz. Since the 20°0-10°O band measurements were made at pressures as high as 266 Pa (2 Torr), frequency shifts as large as 2 MHz might affect those measurements. However, since the weaker high J transitions are the ones most likely to have smaller pressure shifts, we expect that the errors due to pressure shifts will be smaller than the standard deviations given by the random errors in the measurements. Unfortu- nately, we are unable to quantify more precisely the sources of systematic error which might affect our re- sults.
The reader is cautioned not to use the constants given in Table IV to calculate transitions beyond the J = 95 cutoff that was used for making Tables 111 and V. Such extrapolations beyond the range of measured transitions are unreliable.
In the analysis of the data for the 1 = 1 vibrational transition ( 1l1O-0l1O), the following term value equa- tions were used:
T(u,J) = F ( u ) + B,J(J + 1) f 0.5qUJ(5 + 1) - D, [J(J + 1) - 11' 7 0.5q,~J'(J + 1)2, (3)
(4) vo(u' - u " ) = F(u') - F(u''1.
1 May 1981 / Vol. 20, No. 9 / APPLIED OPTICS 1681
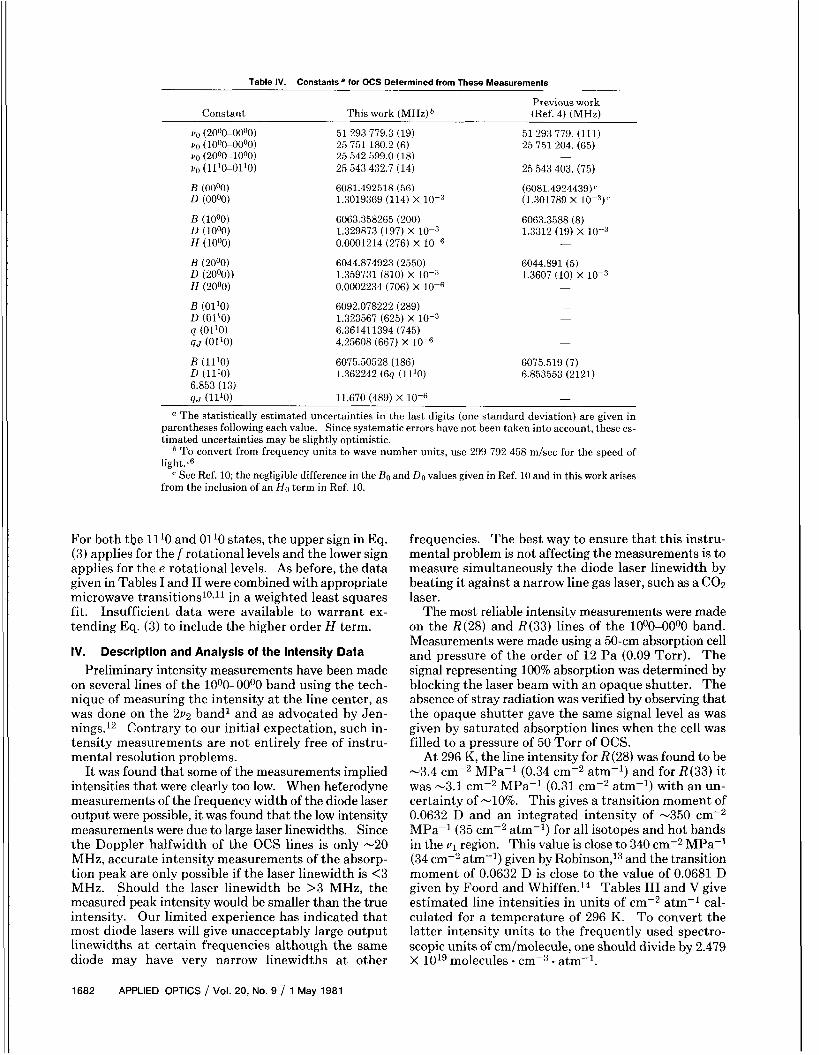
Table IV. Constants a for OCS Determined from These Measurements
Previous work Constant This work ( M H z ) ~ (Ref. 4) (MHz)
vo (2000-0000) uo (1000-0000) uo (2000-1000) vo (1110-01'0)
B (00OO) D (00O0)
B ( 1O00) D ( 10OO) H (10O0)
I3 (2000) D (20O0)) H ( 20OO)
B (01'0) D (01'0) q (01'0) q J (01'0)
B (11'0) D (11'0) 6.853 (13) 0.1 (11'0)
51 293 779.3 (19) 25 751 180.2 (6) 25 542 599.0 (18) 25 543 432.7 (14)
6081.492518 (56) 1.3019369 (114) X
1.329873 (197) X 0.0001214 (276) X
1.359731 (810) X 0.0002234 (706) X
6092.078222 (289) 1.323567 (625) x 6.361411394 (745) 4.25608 (667) X
6075.50528 (186) 1.362242 (6q (11'0)
11.670 (489) x
6063.358265 (200)
6044.874923 (2550)
51 293 779. (111) 25 751 204. (65)
25 543 403. (75)
(1.301789 X 10⁻³)c
6063.3588 (8) 1.3312 (19) X
~
(6081.4924439)
6044.891 (5) 1.3607 (10) X
-
6075.519 (7) 6.853553 (2121)
~
a The statistically estimated uncertainties in the last digits (one standard deviation) are given in parentheses following each value. Since systematic errors have not been taken into account, these es- timated uncertainties may be slightly optimistic.
To convert from frequency units to wave number units, use 299 792 458 m/sec for the speed of light.I6
See Ref. 10; the negligible difference in the Bo and DO values given in Ref. 10 and in this work arises from the inclusion of an Ho term in Ref. 10.
For both the 1l10 and 0l1O states, the upper sign in Eq. (3) applies for the f rotational levels and the lower sign applies for the e rotational levels. As before, the data given in Tables I and I1 were combined with appropriate microwave transitionslOJ1 in a weighted least squares fit. Insufficient data were available to warrant ex- tending Eq. (3) to include the higher order H term.
IV. Description and Analysis of the Intensity Data Preliminary intensity measurements have been made
on several lines of the 1000-OOoO band using the tech- nique of measuring the intensity a t the line center, as was done on the 219 bandl and as advocated by Jen- nings.12 Contrary to our initial expectation, such in- tensity measurements are not entirely free of instru- mental resolution problems.
It was found that some of the measurements implied intensities that were clearly too low. When heterodyne measurements of the frequency width of the diode laser output were possible, it was found that the low intensity measurements were due to large laser linewidths. Since the Doppler halfwidth of the OCS lines is only -20 MHz, accurate intensity measurements of the absorp- tion peak are only possible if the laser linewidth is <3 MHz. Should the laser linewidth be >3 MHz, the measured peak intensity would be smaller than the true intensity. Our limited experience has indicated that most diode lasers will give unacceptably large output linewidths a t certain frequencies although the same diode may have very narrow linewidths a t other
frequencies. The best way to ensure that this instru- mental problem is not affecting the measurements is to measure simultaneously the diode laser linewidth by beating it against a narrow line gas laser, such as a COz laser.
The most reliable intensity measurements were made on the R(28) and R(33) lines of the 10°O-OOOO band. Measurements were made using a 50-cm absorption cell and pressure of the order of 12 Pa (0.09 Torr). The signal representing 100% absorption was determined by blocking the laser beam with an opaque shutter. The absence of stray radiation was verified by observing that the opaque shutter gave the same signal level as was given by saturated absorption lines when the cell was filled to a pressure of 50 Torr of OCS.
At 296 K, the line intensity for R(28) was found to be -3.4 cmP2 MPa-l (0.34 cm-2 atm-') and for R(33) it was -3.1 cmP2 MPa-l (0.31 cm-2 atm-') with an un- certainty of -10%. This gives a transition moment of 0.0632 D and an integrated intensity of -350 cm-2 MPac'(35 cm-2 atm-') for all isotopes and hot bands in the v l region. This value is close to 340 cme2 MPa-' (34 cm-2 atm-l) given by Robin~on,'~ and the transition moment of 0.0632 D is close to the value of 0.0681 D given by Foord and Whiffen.14 Tables I11 and V give estimated line intensities in units of cm-2 atm-I cal- culated for a temperature of 296 K. To convert the latter intensity units to the frequently used spectro- scopic units of cm/molecule, one should divide by 2.479 x ioi9 molecules - cm-3 - atm-1.
1682 APPLIED OPTICS / Vol. 20, No. 9 / 1 May 1981

Table V. Wave Numbers, Frequencies, and Intensities (at 296 K ) of Spectral Lines of the 20°0-00'0 Band of OCS from 1662 to 1738 cm-'
Intensity Intensity Wave number Frequency Tran- (m-2 daPa-') or Wave number Frequency Tran- (m-2 daPa-') or
(cm-') WHz) sition (cm-2 atm-l)a (cm-') (MHz) sition (cm-2 atm-l)=
1661.52665(49) 1662.16342(43) 1662.79765( 38) 1663.42936(33) 1664.05854( 29) 1664.68520( 25) 1665.30934(22) 1665.93096(19) 1666.55007( 17) 1667.16667(15) 1667.78075( 14) 1668.39233( 13) 1669.00140( 13) 1669.60797( 12) 1670.21203( 12) 1670.81360( 12) 1671.41267(12) 1672.00925( 12) 1672.60333(12) 1673.19492( 12) 1673.78403( 12) 1674.37064( 12) 1674.95478( 12) 1675.53643( 12) 1676.11560( 12) 1676.69230( 12) 1677.26651( 12) 1677.83826(12) 1678.40753( 12) 1678.97432( 11) 1679.53865(11) 1680.10052( 11) 1680.65991( 11) 1681.21684(11) 1681.77131(11) 1682.323320 1) 1682.87287( 11) 1683.41996( 11) 1683.96460(11) 1684.506780 1) 1685.04650( 11) 1685.58378( 11) 1686.11860(11) 1686.65097( 10) 1687.18090( IO) 1687.70838( 10) 1688.23341(10) 1688.75599(10) 1689.27614(10) 1689.79384( 10) 1690.30909( 10) 1690.82191(10) 1691.33229( 10) 1691.84023( 10) 1692.34573(10) 1692.84879(9) 1693.34941(9) 1693.84760(9) 1694.34336(9) 1694.83668(9) 1695.32756(9) 1695.81601(8) 1696.30203(8) 1696.78562(8) 1697.26677(8) 1697.74549(8) 1698.22178(8) 1698.69564(8) 1699.16707(8)
49811315.8(148) 49830405.6( 130) 49849419.5( 114) 49868357.6(99) 49887220.0(86) 49906006.8(75) 499247 18.1(66)
49961914.3(51) 49980399.3(46) 49998809.1(42) 50017143.7(40) 50035403.2(38) 50053587.6(37) 50071697.1(37) 5008973 1.6( 37) 50107691.3(37) 50125576.1(37) 50143386.3(37) 50161121.8(37) 50178782.7(37) 50196369.1 (37) 50213881.0(37) 50231318.5(37) 50248681.6(37) 50265970.5( 36) 50283185.1(36) 50300325.5(35) 50317391.8(35) 50334384.0(34) 50351302.1(34) 50368146.3(33) 50384916.6( 33) 50401613.0(33) 50418235.6(32) 50434784.4(32) 50451259.5(32) 50467660.9( 32) 50483988.6(32) 50500242.7(32) 50516423.3(32) 50532530.4(32) 50548564.0(32) 50564524.1(31) 50580410.9(31) 50596224.2( 31) 50611964.3(31) 50627631.0(31) 50643224.5(31) 50658744.8(30) 50674191.8(30) 50689565.7( 30) 50704866.4(29) 50720094.0( 29) 50735248.5(29) 50750329.9(28) 50765338.3(28) 50780273.6( 27) 50795136.0(27) 50809925.3(26) 50824641.7(26) 50839285.1(25) 50853855.5( 25) 50868353.1(25) 50882777.7(24) 50897 129.4( 24) 50911408.2(24) 50925614.2(24) 50939747.2( 24)
49943353.9(57)
0.00005 0.00006 0.00008 0.00009 0.00011 0.00013 0.00015 0.000 18 0.00021 0.00024 0.00028 0.00033 0.00039 0.00045 0.00052 0.00061 0.00070 0.00081 0.00093 0.00107 0.00122 0.00140 0.00160 0.00182 0.00207 0.00235 0.00266 0.00300 0.00338 0.00380 0.00426 0.00477 0.00533 0.00594 0.00660 0.00733 0.00811 0.00896 0.00987 0.01085 0.01191 0.01303 0.01423 0.01550 0.01685 0.01827 0.01977 0.02133 0.02297 0.02467 0.02643 0.02825 0.03011 0.03202 0.03397 0.03594 0.03793 0.03992 0.04190 0.04387 0.04580 0.04768 0.04950 0.05124 0.05289 0.05442 0.05583 0.05709 0.05820
1699.63607(8) 1700.10263(8) 1700.56677(8) 1701.02847(9) 1701.48775(9) 1701.94459(9) 1702.39900(9) 1702.85099(9) 1703.30054( 10) 1703.74766( 10) 1704.19235( 10) 1704.63460( 11) 1705.07443(11) 1705.51182(11) 1705.94678( 11) 1706.37931(12) 1706.80940( 12) 1707.23706( 12) 1707.66228( 12) 1708.08507( 12) 1708.50542( 12) 1708.92333(13) 1709.33881 (13) 1709.75184( 13) 1710.16244(13) 1710.57059( 13) 1711.37958(13) 171 1.78040(13) 1712.17879(13) 1712.57472(13) 1712.96821(12) 1713.35925( 12) 1713.74784(12) 1714.13397( 12) 1714.51766(12) 1714.89889( 12) 1715.27766(11) 1715.65398( 11) 1716.02784(11) 1716.39923( 11) 1716.76817( 10) 1717.13464(10) 1717.49864( 10) 1717.86018(9) 1718.21925(9) 1718.57585(9) 1718.92997(9) 1719.28162(9) 1719.63079(8) 1719.97748(8) 1720.32169(8) 1720.66341(8) 1721.00265(8) 1721.33940(8) 1721.67366(8) 1722.00543(8) 1722.33470(8) 1722.66147(8) 1722.98575(8) 1723.30752(9) 1723.62678(9) 1723.94354(9) 1724.25778(9) 1724.56952(9) 1724.87873(9) 1725.18543( 10) 1725.48960( 10) 1725.79126( 10)
50953807.4( 24) 50967794.7(25) 50981709.1(25) 50995550.7(26) 51009319.4(26) 51023015.2(27) 51036638.2(28) 51050188.3(28) 51063665.5(29) 51077069.8(30) 51090401.3(31) 51103659.8(32) 51116845.4(32) 51129958.1(33) 51142997.9(34) 51155964.7(35) 51168858.6(35) 51181679.4(36) 51194427.3(36) 51207102.1(37) 51219703.9(37) 51232232.6(38) 51 244688.2 (38) 51257070.7(38) 51 269380.1(38) 51281616.3(39) 51305869.0(38) 51317885.5(38) 51329828.7(38) 51341698.5(38) 51353495.0(37) 51365218.0(37) 51376867.6(36) 51388443.7(36) 51399946.3(35) 51411375.3(35) 51422730.6(34) 51434012.3(33) 51445220.3(32) 51456354.5(32) 51467414.9(31) 51478401.4(30) 51489314.0(29) 51500152.7(28) 51510917.2(28) 51521607.7(27) 51532224.1(26) 51542766.2(26) 51553234.1(25) 51563627.6(25) 51573946.7(24) 5 1584191.4( 24) 51594361.5(24) 51604457.0(24) 51614477.9(24) 51624424.0(24) 51634295.3(24) 51644091.8( 25) 51653813.2(25) 51663459.7(26) 51673031.0(26) 51682527.1(27) 51691948.0(27) 51701293.4(28) 51710563.5(28) 51719758.1(29) 51728877.0(29) 51737920.2(29)
0.05912 0.05985 0.06038 0.06068 0.06075 0.06058 0.06015 0.05946 0.05849 0.0 5 7 2 5 0.0 5 5 7 4 0.05394 0.05187 0.04953 0.04692 0.04405 0.04093 0.03758 0.03401 0.03024 0.02629 0.02217 0.01792 0.01355 0.00909 0.00456 0.00457 0.00913 0.01365 0.01810 0.02245 0.02668 0.03076 0.03469 0.03842 0.04195 0.04525 0.04831 0.05113 0.05368 0.05596 0.05796 0.05969 0.06113 0.06228 0.06317 0.06377 0.06411 0.06419 0.06403 0.06363 0.06300 0.06217 0.06114 0.05993 0.05857 0.05705 0.05541 0.05366 0.05182 0.04989 0.04791 0.04587 0.04381 0.04172 0.03963 0.03755 0.03549
continued

Table V, continued
Intensity (m-? daI’:l-’)
(cm-’1 (MHz) sition (cm-’ atin-’)o Wave number Frequency Tran- or
1726.09038(10) 51746887.7(30) R(42) 0.03345 1726.38697( 10) 1726.68103( 10) 1726.97255(10) 1727.26153( 10) 1727.54797(10) 1727.83186( 10) 1728.11 321(10) 1728.39200( 10) 1728.66823(11) 1728.94191( 11) 1729.21302(11) 1729.48157( 11) 1729.74755( 11) 1730.01095(11) 1730.27178(11) 1730.53003(11) 1730.78570( 11) 1731.03878(11) 1731.28926(11) 1731.53716(11) 1731.78245(11) 1732.02515( 11) 1732.26523( 12) 1732.50271( 12) 1732.73758( 12) 1732.96983( 12) 1733.19945( 12) 1733.42645( 12) 1733.65082( 12) 1733.87256( 12) 1734.09166( 12) 1734.30812( 12) 1734.52194( 12) 1734.73310( 12) 1734.94161(12) 1735.14746( 12) 1735.35065( 12) 1735.55117(12) 1735.74902( 13) 1735.94420( 13) 1736.13669( 14) 1736.32651( 15) 1736.51363( 17) 1736.69806( 19) 1736.87979(22) 1737.05882(25) 1737.23515(29) 1737.40876(33) 1737.57966(38) 1737.74783(43) 1737.91328(49) 1738.07601(56) 1738.23599(63)
51755779.3(30) 51764594.9(30) 51773334.5(31) 51781998.0(31) 51790585.2(31) 51799096.1(31) 51807530.6(31) 51815888.5(31) 51824169.8(32) 51832374.4(32) 51840502.2(32) 51848553.1(32) 51856526.9(32) 51864423.6( 32) 51872243.1(32) 51879985.2(32) 51887649.9( 32) 51895237.0(33) 51902746.4(33) 51910178.1(33) 51917531.8(34) 51924807.6(34) 51932005.3(35) 51939124.7(35) 51946165.7(36) 51953128.3(36) 51960012.4(37) 51966817.7(37) 51 973544.2 (37) 51980191.7(37) 51986760.2(37) 51993249.5(37) 51999659.4(37) 52005990.0( 37) 52012240.9(37) 52018412.2( 37) 52024503.7( 37) 52030515.2(37) 52036446.6( 38) 52042297.8(40) 52048068.7 (42) 52053759.1(46) 52059368.9(51) 52064898.0(57) 52070346.2( 66) 52075713.4(75) 52080999.5(86) 52086204.3(99) 52091327.6(114) 52096369.4(130) 52101329.5( 148) 52106207.8( 168) 5211 1004.1 (190) R (95)
0.03145 0.02950 0.02760 0.02576 0.02399 0.02228 0.02065 0,01909 0.01761 0.01620 0.01487 0.01362 0.01245 0.01135 0.01032 0.00937 0.00848 0.00766 0.00691 0.00622 0.00558 0.00500 0.00446 0.00398 0.00354 0.00314 0.00278 0.00246 0.00217 0.00191 0.00168 0.00147 0.00129 0.00112 0.00098 0.00085 0.00074 0.00064 0.00055 0.00047 0.00041 0.00035 0.00030 0.00026 0.00022 0.00019 0.00016 0.00013 0.00011 0.00010 0.00008 0.00007 0.00006
~~~ ~~ ~~
To within the accuracy of the intensity data, 1 m-2 daPa-1 is equal to 1 cm-2 atm-1.
The line intensities for the 2vl band given in Table V were based on a value of 61 cmP2 MPa-’ (6.1 cmP2 atm-l) for the integrated total band intensity as re- cently measured by Kagann.15 This value is equivalent to a transition moment of 0.0183 D, which is close to 0.021 D measured by Foord and Whiffen.14
We have measured frequencies of the OCS spectrum a t 11.6 pm using laser frequency metrology techniques which permit better than an order of magnitude im- provement in the constants used to calculate the frequencies. These predicted frequencies (for both the 10°O-00-00 and 2O00-OO00 bands) are presented here for immediate use as reference standards. The ultimate goal of this and subsequent heterodyne measurements on the other bands is to facilitate an exact analysis of OCS as a whole in order to provide the best OCS stan- dard frequencies possible.
We wish to ezpress our deep appreciation to Andre Fayt of the University of Louvain, Louvain-la-Neuve, Belgium, for providing us some of his calculations on OCS line positions. We are also grateful to the NASA Upper Atmosphere Research Office for partial support of this program.
References 1. J. S. Wells, F. R. Petersen, and A. G. Maki, Appl. Opt. 18,3567
(1979). 2. F. R. Petersen, D. G. McDonald, J. D. Capp, and B. L. Danielson,
in Laser Spectroscopy, R. G. Brewer and A. Mooradian, Eds. (Plenum, New York, 1974).
3. J. Sattler, Harry Diamond Laboratories, Adelphi, Md.; private communication.
4. A. G. Maki, W. B. Olson, and R. L. Sams, J. Mol. Spectrosc. 81, 122 (1980).
5. C. Freed and A. Javan, Appl. Phys. Lett. 17,53 (1970). 6. C. Freed, A. H. M. Ross, and R. G. O’Donnell, J. Mol. Spectrosc.
7. C. Freed, L. C. Bradley, and R. G. O’Donnell, IEEE. J. Quantum
8. F. R. Petersen, J. S. Wells, A. G. Maki, and K. Siemsen, (sub-
9. A. Fayt, U. Louvain, Louvain-la-Neuve, Belgium; private com-
49,439 (1974).
Electron 16, 1195 (1980).
mitted to Appl. Opt.)
munication. 10. A. G. Maki, J. Phys. Chem. Ref. Data 3,221 (1974). 11. N. W. Larsen and B. P. Winnewisser, Z. Naturforsch Teil A 29,
12. D. E. Jeniiings, Appl. Opt. 19,2695 (1980). 13. D. Z. Robinson, J. Chem. Phys. 19,881 (1951). 14. A. Foord and D. H. Whiffen, Mol. Phys. 26,959 (1973). 15. R. Kagann, NBS, Washington, D.C.; private communication. 16. J. Terrien, Metrologia 10,9 (1974).
1213 (1974).
1684 APPLIED OPTICS / Vol. 20, No. 9 / 1 May 1981

Reprinted from Applied Optics, Vol. 20, page 2874, September 1, 1981 Copyright 0 1981 by the Optical Society of America and reprinted by permission of the copyright owner
Heterodyne frequency measurements on the 11.6-pm band of OCS: new frequency/ wavelength calibration tables for 11.6- and 5.8-pm OCS bands: erratum
J. S. Wells, F. R. Petersen, A. G. Maki, and D. J. Sukle D. J. Sukle is with Community College of Denver, Divi- sion of Science, Westminister, Colorado 80030; A. G. Maki is with U.S. National Bureau of Standards, Molecu- lar Spectroscopy Division, Washington, D.C. 20234; the other authors are with U.S. National Bureau of Stan- dards, Time & Frequency Division, Boulder, Colorado 80303. Received 26 May 1981. The penultimate line in the body of Table IV of this
paper' was garbled in the printing process. I t is run below correctly.
Table IV. Constant a for OCS Determined from These Measurements
Constant Previous work4
This work (MHz) (MHd
vo (2000-0000) v0 (1000-0000) vo (2000-1000) vo (1110-0110)
R (0000) n (0000)
R (1000) D (10O0) H ( 10°0)
B (2000) D ( 2OoO) H (20°0)
R (01'0) D (01'0) y (01'0)
H (11'0) D (11'0) 9 (11'0) 0.1 (1 1'0)
qJ (01'0)
51 293 779.3 (19) 25 751 180.2 (6) 25 542 599.0 (18) 25 543 432.7 (14)
6081.492518 (56) 1.3019369 (114) X
6063.358265 (200) 1.329873 (197) X 0.0001214 (276) X
6044.874923 (2550) 1.359731 (810) X 0.0002234 (706) X
6092.078222 (289) 1.323567 (625) X 6.361411394 (745) 4.25608 (667) X
6075.50528 (186) 1.362242 (679) X 6.853553 (2121) 11.670 (489) X
51 293 779. (111) 25 751 204. (65)
25 543 403. (75)
(6081.4924439) (1.301789 X lo-')'
6063.3588 (8) 1.3312 (19) X lV3
-
6044.891 (5) 1.3607 (10) X
- - -
-
6075.519 (7)
6.853 (13) -
-
The statistically estimated uncertainties in the last digits (one standard deviation) are given in parentheses following each value. Since systematic errors have not been taken into account, these es- timated uncertainties may he slightly optimistic.
To convert from frequency units to wave number units, use 299 792 458 m/sec for the speed of light.I6
See Ref. 10; the negligible difference in the Bo and DO values given in Ref. 10 and in this work arises from the inclusion of an H o term in Ref. 10.
Reference 1. J. S. Wells, F. R. Petersen, A. G. Maki, and D. J. Sukle, Appl Opt.
20, 1676 (1981).
2874 APPLIED OPTICS / Vol. 20, No. 17 / 1 September 1981