high temperature h2s adsorption using copper-titanate
TRANSCRIPT

High Temperature H2S Adsorption using Copper-Titanate Nanoparticles
by
Farzad Yazdanbakhsh
A thesis submitted in partial fulfillment of the requirements for the degree of
Doctor of Philosophy
in
Chemical Engineering
Department of Chemical and Materials Engineering University of Alberta
© Farzad Yazdanbakhsh, 2015

ii
Abstract
Direct desulfuization of syngas is an important measure to further increase the
efficiency of IGCC systems. Solid-phase, metal oxide adsorbents which sequester the sulfur by
converting H2S to a metal sulfide are the only desulfurization technology capable of
withstanding the combustion temperatures present at the outlet of the gasifier. Copper oxide is
of particular interest due to its favourable thermodynamics across a wide range of temperatures.
Cu-ETS-2 is a copper exchanged form of the sodium titanate ETS-2 and functions analogously
to CuO for the conversion of H2S into CuS at temperatures ranging from ambient to 950 °C.
The results of this study show that Cu-ETS-2 is capable of removing H2S from H2S/He mixture
to concentrations below a mass spectrometer’s detection limit at temperatures as high as 950°C.
Temperature is, however, only one of the challenges facing a direct-desulfurization adsorbent;
high concentrations of H2 and water vapour are present in the syngas stream which can
influence the oxidation state of the metal and the efficiency of H2S removal. In an attempt to
prevent reduction of CuO, Chromium was successfully used to stabilize the oxidation state of
copper oxide and maintain constant adsorption capacity throughout the whole temperature
range.
While several studies have examined the effect hydrogen in the feed, there are few studies
exploring the influence of water vapour on the efficiency of H2S removal and none that explore
the effect of water vapour at elevated temperatures. This study can be considered the only study
to investigate the influence of water vapour on the desulfurization of a dilute H2S stream at
temperatures between 350 and 950 °C using copper oxide-based adsorbents. The findings
demonstrate that the presence of water vapor promotes production of H2, resulting in faster
reduction of CuO to Cu2O and elemental copper, leading to less adsorption capacity.
In the final chapter, the ability of the adsorbent for regeneration and use as a multi-cycle
adsorbent was investigated. The results indicate that the adsorbent is capable of regeneration

iii
for at least four times with no sign of reduction in capacity. The results also indicate that the
exothermic nature of oxidation reaction results in temperatures up to ~1700°C causing the
partial melting of the quartz glass tube. However the adsorbent can withstand such high
temperatures and does not lose adsorption capacity after the first oxidation step. This
phenomenon is due to having nanotitanate ETS-2 as the support in the adsorbent.
iv
Preface
Some of the research conducted for this thesis forms part of an international
research collaboration, led by Professor Steven Kuznicki at the University of
Alberta, with Dr. Stefan Baumann being the lead collaborator at the
Forschunszentrum Jülich in Germany. The results of the experiments presented
in chapters 2 and 3 were done in the “Institute of Energy and Climate
Research-2 (IEK-2)” at the Forschunszentrum Jülich under supervision of Dr.
Michael Müller.
The technical apparatus referred to in chapter 2-5 was designed by the thesis
autor (Farzad Yazdanbakhsh), with the assistance of Dr. Marc Bläsing in
Forschungszentrum Jülich and Dr. Jim Sawada at the University of Alberta.
The data analysis and conclusion are Farzad Yazdanbakhsh’s work, as well as
the literature review in chapters 2-5.
Chapter 2 of this thesis has been published as F. Yazdanbakhsh, M. Bläsing, J.
Sawada, S. Rezaei, M. Müller, S. Baumann and S. m. Kuznicki “Copper
Exchanged Nanotitanate for High Temperature H2S adsorption” Journal of
Industrial and Engineering Chemistry Research, 2014, 53, 11734-11739. In
this paper, Farzad Yazdanbakhsh was responsible for the data collection and
analysis as well as the manuscript composition. Dr. Marc Bläsing assisted with
the data collection and Dr. Jim Sawada contributed to manuscript correction
and preparation. Dr. Steven. M. Kuznicki was the supervisory author and was
involved with concept formation and manuscript composition.
Chapter 3 of this thesis has been accepted for publication and at time of writing
this thesis is in proof for publication as: F. Yazdanbakhsh, M. Alizadehgiashi,
M. Bläsing, M. Müller, J. Sawada and S. m. Kuznicki “Cu-Cr-O
Functionalized ETS-2 Nanoparticles for Hot Gas Desulfurization” in Journal of
Nanoscience and Nanotechnology, 2015, 15. In this paper, Farzad

v
Yazdanbakhsh was responsible for the data collection and analysis as well as
the manuscript composition. Dr. Jim Sawada assisted with the data collection
and contributed to manuscript edits. Dr. Steven. M. Kuznicki was the
supervisory author and was involved with concept formation and manuscript
composition.
Chapter 4 of this thesis has been accepted for publication in the journal of
Industrial and Engineering Chemistry Research as: F. Yazdanbakhsh, J. A.
Sawada, M. Alizadehgiashi, M. Mohammadalipour, S.M. Kuznicki, “Effect of
Moisture oh High Temperature H2S Adsorption on Cu-ETS-2” Farzad
Yazdanbakhsh was responsible for the data collection and analysis as well as
the manuscript composition. Dr. Jim Sawada assisted with the data collection
and contributed to manuscript edits together with M. Alizadehsgiashi and Dr.
Mehdi Mohammadalipour. Dr. Steven. M. Kuznicki was the supervisory
author and was involved with concept formation and manuscript composition.

vi
To my beloved parents, my brother and my sister

vii
Acknowledgements
First and foremost I am grateful to my supervisor Professor Steven. M.
Kuznicki for his advice, patience, energy, guidance and above all, believing in
me. Dr. Kuznicki not only showed me the right approach during my Ph.D.
research, but he also taught me how to think creatively and look at problems
from a different angle. I am very much grateful to his unconditional support
and his vast knowledge to enrich my learning and professional development.
I am also thankful to Dr. James Sawada for helping me with every part of my
research and for enriching this thesis through his fruitful comments and
discussions. Since my first day in Dr. Kuznicki’s group, he never stopped
supporting me and gave me the energy to do my research in the best way I
could.
I would like to send special thanks to Dr. Marc Bläsing at the Institute of
Energy and Climate Research-2 (IEK-2) in Forschungszentrum Jülich,
Germany for his support and motivation during my stay in Germany as a
visiting researcher. Special thanks to Dr. Michael Müller, the head of
Thermochemistry department in IEK-2 for having me in his group and his
guidance during me stay in Germany and also Dr. Egbert Wessel for helping
me with TEM, SEM and EDX analysis in IEK-2.
I want to extend my appreciation to Peng Li and Gayle Hatchard from the
Nanofabrication and Characterization Facility (nanoFab) of the University of
Alberta for collecting SEM and EDX data and Mrs. Diane Caird in the
department of Earth and Atmospheric Sciences at the University of Alberta for
doing the XRD analysis.
Finally I would like to thank my beloved parents for their precious love and
support that giving me energy and inspiration.
viii
Table of Contents
1- Introduction 1
1-1 Hydrogen Sulfide and Power Generation………………………………… 2
1-1-1 Water-Gas Shift Reaction………………………………………… 4
1-2 What Does Success Look Like?…………………………………............. 5
1-3 Literature Review: Methods of H2S removal……………........................ 5
1-3-1 Liquid Adsorption Processes……………………………….. 6
1-3-2 Dry Adsorption Processes …………………………………... 7
1-3-2-1 Chemical Processes ………………………………. 7
1-3-2-2 Physical Processes ………………………………. 14
1-4 Motivation for the research …………………………………….............. 18
1-5 References ……………………………………………………………….. 19
2- Copper Exchanged Nanotitanate for High Temperature H2S Adsorption 24
2-1 Abstract ………………………………………………………………….. 25
2-2 Introduction ………………………………………………………………. 25
2-3 Materials Preparation …………………………………………………… 28
2-4 Characterization ………………………………………………………… 28
2-5 Experimental Setup ……………………………………………………… 28
2-6 Results and Discussion ………………………………………………….. 28
2-7 Conclusion ………………………………………………………………. 37
2-8 Acknowledgement ………………………………………………………. 37
2-9 References ………………………………………………………………. 38
3- Cu-Cr-O Functionalized ETS-2 Nanoparticles for Hot Gas Desulfurization 41
3-1 Abstract …………………………………………………………………….. 42
3-2 Introduction …………………………………………………………………. 42
3-3 Adsorbent Preparation ………………………………………………………. 45

ix
3-4 Characterization ………………………………………………………… 46
3-5 Experimental Setup ……………………………………………………… 47
3-6 Results and Discussion …………………………………………………… 47
3-6-1 Spinel Cu-Cr-O …………………………………………………. 48
3-6-2 CuCr-ETS-2 …………………………………………………….. 50
3-7 Conclusion ………………………………………………………………… 55
3-8 Acknowledgement …………………………………………………………. 56
3-9 References ………………………………………………………………….. 56
4- Effect of Moisture on High Temperature H2S Adsorption on Cu-ETS-2 60
4-1 Abstract …………………………………………………………………….. 61
4-2 Introduction ………………………………………………………………… 61
4-3 Materials Preparation ………………………………………………………. 63
4-4 Characterization …………………………………………………………….. 64
4-5 Humidification and Reactor Configuration …………………………………. 65
4-6 Results and Discussion ………………………………………………………. 66
4-7 Conclusion …………………………………………………………………… 75
4-8 Acknowledgement …………………………………………………………. 75
4-9 References …………………………………………………………………. 76
5- Cu-ETS-2 Regeneration 79
5-1 Introduction ………………………………………………………………… 80
5-1-1 Thermodynamics ………………………………………………….. 82
5-2 Materials Preparation ………………………………………………………. 83
5-3 Characterization ……………………………………………………………. 83
5-4 Experimental Setup …………………………………………………………. 84
5-5 Results and Dsicussion ……………………………………………………… 84
5-5-1 Thermodynamic Simulation ………………………………………… 90
5-5-2 Adiabatic Reaction Temperature ………………………………….. 92
5-5-3 SEM/ EDX analysis…………………………………………………. 93

x
5-5-4 H2S Thermal Dissociation and Adsorption Capacity …………….. 99
5-6 Conclusions ………………………………………………………………….. 102
5-7 References …………………………………………………………………… 103
6- Conclusion and Future Work 104
6-1 General conclusion …………………………………………………… 105
6-2 Recommendation for future work …………………………………….. 106

xi
List of Tables
Table 1-1 Detailed information of commercial active iron oxide sorbents
…………………………………………………………………………… 9
Table 2-1 Point-specific EDX analysis of Cu-ETS-2 for 3 randomly selected
points on the sample (values are in atomic %) …………………………… 30
Table 2-2 Equilibrium concentration of hydrogen in decomposition of
hydrogen sulfide under 1 atm (calculated) ………………………………. 35
Table 5-1 EDX analysis results for the selected points on Figure 11-A -
All data are in Wt% ……………………………………………………… 97
Table 5-2 – EDX analysis results for the selected points on Figure 12-A - All
data are in Wt%.......................................................................................... 97

xii
List of Figures
Figure 1-1 schematic flow diagram of an IGCC plant …………………. 3
Figure 1-2 – SEM image of activated carbon fibers ….………………… 13
Figure 1-3 - structure of Clinoptilolite, a naturally occurring zeolite ….. 14
Figure 1-4 – The structure of titanosilicate ETS-10 …………………… 16
Figure 1-5 – SEM images of ETS-2 particles…………………………. 17
Figure 1-6 - XRD pattern for ETS-2…………………………………… 17
Figure 1-7 – EDX analysis for ETS-2…………………………………. 18
Figure 2-1 a) TEM and b) SEM images of nanotitanate ETS-2 showing the
particle size and cluster structure ……………………………………… 30
Figure 2-2 XRD patterns of ETS-2 and Cu-ETS-2 ……………………. 31
Figure 2-3. Breakthrough curve for H2S adsorption by Cu-ETS-2 at 550 °C
…………............................................................................................. 31
Figure 2-4. Breakthrough curves for Cu-ETS-2…………………………. 32
Figure 2-5 Breakthrough capacities of Cu-ETS-2 at different temperatures
………………………………………………………………………….. 33
Figure 2-6. XRD patterns of Cu-ETS-2 after H2S adsorption at 350°C,
550°C and 750 °C…………………………………………………. ….. 34
Figure 2-7. SEM images of Cu-ETS-2 after adsorption at: a) 350 °C, b) 550
°C, c) 750 °C and d) 950 °C ……………………………………………… 36
Figure 3-1 SEM (a) and TEM (b) images of nanotitanate ETS-2 ………. 47

xiii
Figure 3-2 SEM images of CuCr -ETS-2 before adsorption …………… 48
Figure 3-3 Breakthrough curves for H2S adsorption on Cu-Cr-O adsorbent
from a 500 ppmv mixture of H2S and He with a flow rate of 500 ml/min at
different temperatures................................................................................ 49
Figure 3-4: Breakthrough capacities of Cu-Cr-O at different temperatures
as measured in 1ppmv H2S in the exit gas ………………………………. 50
Figure 3-5: Breakthrough curves for CuCr-ETS-2 from a 500 ppmv mixture
of H2S and He with a flow rate of 500 ml/min at different temperatures… 51
Figure 3-6: Breakthrough capacities of CuCr-ETS-2 at different temperatures
ranging from 350 to 1100°C ……………………………………………… 52
Figure 3-7. SEM images of CuCr-ETS-2 at: a) 350 °C, b) 550 °C, c) 750 °C
and d) 950 °C …………………………………………………………… 54
Figure 3- 8 SEM image of CuCr-ETS-2 at 1100 ⁰C ……………………. 54
Figure 3-9: XRD patterns of CuCr-ETS-2 after adsorption at different
temperatures ……………………………………………………………… 55
Figure 4-1 Schematic of the humidification and reactor system…………. 66
Figure 4-2 (a) TEM and (b) SEM images of ETS-2 together with (c) SEM
image of Cu-ETS-2 showing the particles cluster size and morphology… 67
Figure 4-3 Comparison between H2S breakthrough curves for dry
and humid stream at (a) 350 °C, (b) 550 °C and (c) 750 ºC ………… 69
Figure 4-4 XRD pattern of Cu-ETS-2 after H2S adsorption at (a)
550ºC and (b) 750°C for dry and humid streams…………………….. 71
Figure 4-5 Standardized and baseline-corrected H2 signal as a
function of temperature for humid and dry 500 ppm H2S in He ……. 73

xiv
Figure 5-1 Phase diagram of Cu-S-O system at 727°C ………………… 82
Figure 5-2 Schematic diagram of the experimental setup ……………… 84
Figure 5-3 Typical adsorption breakthrough curves for multiple adsorption
cycles on Cu-ETS-2. (the presented data are for experiments at 550 °C) 86
Figure 5-4 Breakthrough times (in minutes) for different adsorption cycles at
different temperatures……………………………………………………… 87
Figure 5-5 Change in SO2 concentration in the exit at (A) 350 and (B) 950 °C
…………………………………………………………………………….. 88
Figure 5-6 XRD analysis of the adsorbent after 4 adsorption and 3 oxidation
cycles ……………………………………………………………………… 89
Figure 5- 7 changes in solid phases versus the amount of oxygen entering the
system for oxidation process at 350°C …………………………………… 90
Figure 5-8 - change in solid phases versus the amount of oxygen entering the
system for oxidation process at 950°C……………………………………. 91
Figure 5-9 - change in gas phases versus the amount of oxygen entering the
system for oxidation process at 950°C …………………………………… 91
Figure 5-10 Temperature profile in Cu2S – O2 system versus the amount of
oxygen fed into the system for Cu-ETS-2 oxidation at 350°C assuming an
adiabatic system ………………………………………………………….. 92
Figure 5-11 Scanning electron micrographs of Cu-ETS-2 after: (A)
Adsorption and previously regeneration at 350°C, (B) Only 1 adsorption at
350°C and (C) Only 1 adsorption at 950°C ……………………………… 95
Figure 5-12 Scanning Electron Micrographs of Cu-ETS-2 after adsorption
and previously oxidation at 950°C ……………………………………….. 96
Figure 5-13 Needle like phases observed in a previous study after adsorption
of H2S on Cu-Cr-ETS-2 at 1100°C ……………………………………….. 97
Figure 5-14 – Needle like structures formed at CuCr-ETS-2 experiments at 1100°C
……………………………………………………………………. 99

xv
Figure 5-15 – EDX analysis for Cu-Cr-ETS2 at 1100°C …………………. 99

Chapter 1
Introduction

Chapter 1 Introduction
2
1-1 Hydrogen Sulfide and Power Generation
Hydrogen Sulfide (H2S) is a colorless, highly flammable and extremely toxic gas
with the characteristic odor of rotten eggs. The odor is so intense that the threshold
for humans is as low as 0.1 ppmv1. Just five minutes exposure to H2S with 1000
ppmv concentration is fatal to humans2. In nature it can be found in hot springs,
volcanic gases, crude oil and natural gas. It can also be naturally produced as a result
of bacteria digestion of organic matter and human or animal waste under anaerobic
conditions.
H2S can also be released into the atmosphere due to human activities. Burning coal
can be one of the major sources. Depending on the origin, coal can have between 0.1
to 6 wt% sulfur content, which is released in the form of H2S during coal
gasification and production of syngas for power generation3. Later, syngas should be
free of H2S in order to prevent serious corrosion of gas turbines and pipelines.
H2S can also be found in natural gas. Natural gas is considered “sour” if it contains
more than 5.7 milligrams per normal cubic meter. According to the Clean Air Act
(1989), pipeline and sales standard levels of H2S should be no more than 4 ppmv.
Necessity of H2S removal
In many different areas, hydrogen sulfide is an undesired and harmful gas and needs
to be removed. Among these areas, coal gasification process and the water-gas shift
reaction can be named.
Coal gasification process
Nowadays, the main usage of coal is in electricity generation. More than half of the
electricity in the U.S. is generated from coal4. As long as we rely on fossil fuels,
coal will play a more important role due to its low price.
The Integrated Gasification Combined Cycle (IGCC) is considered to be the most
efficient and environmentally acceptable technology for power generation from
coal. This advanced process is one of the cleanest and most efficient available

Chapter 1 Introduction
3
technologies for coal-based power generation, with emissions comparable to natural
gas-based power plants5. IGCC is a process in which syngas is produced by
gasification of coal and it is later used as a fuel for the gas turbine and electricity
generation. Figure 1-1 shows a schematic flow diagram of an IGCC plant.
Figure 1-1 Schematic flow diagram of an IGCC plant6
As the figure shows, the carbon source is crushed and mixed with water to form a
slurry and is pumped into the gasifier together with oxygen. The gasifier is operated
under pressure and gasification takes place rapidly at temperatures as high as
1200°C. The generated gas is mainly composed of H2, CO, CO2 and H2O. The sulfur
in coal is mostly converted to H2S and small amounts of COS. The raw fuel gas
leaves the gasifier together with molten ash and a small amount of unburned carbon.
The gas-molten solid mixture enters a radiant syngas cooler (RSC) and convective
syngas cooler (CSC) to cool down the gas to about 150°C (27 bars) by generating
additional steam. The gas stream is further cooled down through a gas scrubber and

Chapter 1 Introduction
4
a low temperature gas cooling section to reduce the raw fuel gas temperature to
40°C, prior to entering the sulfur removal unit.
Removing pollutants from fuel gas is required for effectively using this technology
not only to protect equipment from corrosion, but also to meet the environmental
legislation for sulfur emissions7. At the moment, H2S adsorption at most gasification
plats is done using MDEA (Methyl diethanolamine) solutions. The disadvantage of
this method for using in IGCC process and also water-gas shift reaction is that hot
coal gas (Generally, 500°C or above10
) must be cooled down for desulfurization by
MDEA solution and then preheated to high temperature before being fed into gas
turbine. As a result, the thermal efficiency of the system is significantly reduced.
Due to this reason, it is important to perform the desulfurization process at high
temperatures.
1-1-1 Water-gas shift reaction
There has been a huge demand for hydrogen in recent years due to its widely use in
chemical and petroleum industries and also as a new source of energy in proton
exchange membrane fuel cells. One way to produce hydrogen is through gasification
of fossil fuels or biomass and then, adding steam to convert carbon monoxide to a
mixture of carbon dioxide and hydrogen by the so-called water-gas shift reaction
(WGS) at temperatures around 350°C8 before feeding the gas to the gas turbine.
CO (g) + H2O (g) → CO2 (g) + H2 (g) ∆H= - 41.09 kJmol-1
, ∆G= -28.6 kJmol-1
(1-1)
To obtain pure hydrogen, further separation processes such as physical or chemical
sorption or membrane separation is needed to be done afterwards.
In order to increase hydrogen production while reducing carbon monoxide content,
it is necessary to run reaction (1-1) at low temperatures. However, in order to obtain
high reaction rates, higher temperatures are required. The high temperature reaction
is performed at 320-350°C using Fe-Cr oxides catalyst, while the low-temperature
shift reaction is conducted at 200-250°C and a Cu/ZnO/Al2O3 catalyst is commonly
used9.
Chapter 1 Introduction
5
Both of the above-mentioned catalysts can react with H2S and as a result, the
catalysts become inactive. In order to prevent inactivation, the gas stream should be
free of H2S prior to water gas shift unit.
Among the several desulfurization methods, adsorption of metal oxides has shown
great potential to be used as an efficient high temperature desulfurization process.
1-2 What does success look like?
In order to enable direct desulfurization of the syngas stream (prior to the WGS
beds) the desulfurization system needs to accept syngas at temperatures between
400-700°C depending on the process design, having a H2 concentration ranging
from 15 to 30 mole%, a water loading of 7-20 mole% and, ideally be regenerable for
many cycles11
. The desulfurization capacity should also be maximized to minimize
the size of the reactor needed for desulfurization.
1-3- Literature review: Methods of H2S removal
Prior to the early 1990’s sulfur recovery and acid gas flaring were the most
commonly used and most economic methods of handling the acid gas streams12
. Gas
streams containing less than 10 tons of sulfur a day used to be flared because at this
amount, running a sulfur recovery unit was not economically reasonable.
As a result of public concern over human health and negative environmental
impacts, flaring H2S-containing gases was restricted. On the other hand, a weak
sulfur market resulted in sulfur recovery units being uneconomical13
. As a result,
technologies for H2S conversion, long term storage of sulfur or H2S have gained
more attention in recent years.
There are several commercial treatment techniques that are commonly used to
remove H2S, such as absorption in liquids (alkaloamines, ammonia solution…),
biological processes, the Claus process, adsorption on activated carbon and metal
oxides, and also separation by molecular sieves.

Chapter 1 Introduction
6
Almost all the H2S removal processes can be categorized into liquid absorption
processes and dry processes.
1-3-1 Liquid adsorption processes
Alkanolamines
H2S is slightly soluble in water and once it is dissolved, makes the solution acidic:
𝐻2𝑆(𝑔) → 𝐻2𝑆(𝑎𝑞)↔𝐻+ + 𝐻𝑆− (1-2)
In order to increase the amount of dissolved H2S, a chemical should be added to the
solution that can consume either H+
or HS-. The easiest choice would be a source of
alkalinity that can consume H+ in the solution and increases the amount of H2S
absorbed.
The most commonly used sources of alkalinity for H2S absorption are alkanolamines
(monoethanolamine (MEA), diethanolamine, triethanolamine), among which,
(MEA) is more often used. It reacts with H2S to form amine sulfide and
hydrosulfide14
:
2𝐻𝑂𝐶𝐻2𝐶𝐻2𝑁𝐻2 + 𝐻2𝑆 ↔ (𝐻𝑂𝐶𝐻2𝐶𝐻2𝑁𝐻3)2𝑆 (1-3)
(𝐻𝑂𝐶𝐻2𝐶𝐻2𝑁𝐻3)2𝑆 + 𝐻2𝑆 ↔ 2𝐻𝑂𝐶𝐻2𝐶𝐻2𝑁𝐻3𝐻𝑆 (1-4)
Biological processes
Biological processes have also been used for reduction of H2S from gas streams. In
these processes H2S is converted to sulfuric acid under aerobic conditions:
𝐻2𝑆 + 2𝑂2𝐵𝑎𝑐𝑡𝑒𝑟𝑖𝑎→ 𝐻2𝑆𝑂4 (1-5)
In this process, the gas stream is passed through a packed bed biofilter where H2S is
absorbed into a liquid film and oxidized by bacteria. In such processes, it is possible
to reach 99% or even higher conversions for gas streams with up to 1000 ppm H2S
concentrations15
.

Chapter 1 Introduction
7
In some cases, H2S removal is done under anaerobic, inorganic acid gas
bioconversion through the photosynthetic van Niel reaction16
:
2 𝐻2𝑆 + 𝐶𝑂2𝐿𝑖𝑔ℎ𝑡,𝐵𝑎𝑐𝑡𝑒𝑟𝑖𝑎→ 2 𝑆 + (𝐶𝐻2𝑂) + 𝐻2𝑂 (1-6)
𝐻2𝑆 + 2 𝐶𝑂2 + 2 𝐻2𝑂 𝐿𝑖𝑔ℎ𝑡,𝐵𝑎𝑐𝑡𝑒𝑟𝑖𝑎→ 2(𝐶𝐻2𝑂) + 𝐻2𝑆𝑂4 (1-7)
In this process, photoautotrophic bacteria provide nearly 100% H2S removal.
The main problem with biological processes is that they are not flexible and rapid
enough on a large scale and much work related to the application of these processes
for treatment of H2S still needs to be done17
.
1-3-2 Dry adsorption processes
These processes involve using a dry adsorbent in a reactor that facilitates the flow of
the gas stream through the adsorbent. The adsorbent will eventually become
saturated with the contaminant and becomes inactive. In order to prevent the
interruption in the adsorption process, there are usually two reactors operating in
parallel so one vessel can be in service while the other one is offline for adsorbent
change or adsorbent regeneration.
Generally, dry adsorption processes are divided into two categories: chemical and
physical adsorption.
1-3-2-1 Chemical processes
Chemical adsorption processes are based on the reaction of an adsorbent with a
target molecule to form a new compound.
The Claus process
The Claus process is a technology that is able to remove H2S from a gas stream and
recover sulfur in elemental form18
. It was first developed over 100 years ago and is
suitable for gases with high H2S concentrations (above 20% v/v), on a large scale18
.

Chapter 1 Introduction
8
The process consists of two steps; thermal and catalytic. During the thermal step,
H2S reacts in a substoichiometric combustion above 850°C and at the downstream
process gas cooler, elemental sulfur is formed.
𝐻2𝑆 +3
2 𝑂2↔𝐻2𝑂 + 𝑆𝑂2 (1-8)
2𝐻2𝑆 + 𝑆𝑂2↔3𝑆 ↓ +2𝐻2𝑂 (1-9)
In the catalytic step, the process continues with activated Al2O3 or TiO2 in order to
boost the sulfur yield.
A single Claus reactor can usually achieve H2S conversions of up to 70%. In
industry, several stages are usually used to achieve conversions of about 95-97%.
The problem with the Claus process is that the exit gas still contains up to 2-3% of
H2S together with other gases such as COS, CS2 and CO2. These concentrations are
still above the current allowable standards and further treatments are required on the
gas stream before its release in the atmosphere19
.
Adsorption on metal oxides
For small scale desulfurization processes of less than 10 tons of sulfur per day,
adsorption by metal oxides is an effective and economical method of removing H2S
from gas streams. Metal oxide sorbents work by reacting with H2S to form metal
sulfides. Metal sulfides can later be converted back into metal oxide during an
oxidation (regeneration) process by exposing to air or oxygen.
Oxides of many metals such as Zn, Cu, Fe, Co, W, Mo, Ca, Ba, and Sr have been
reported to be efficient adsorbents even at high temperatures20
.
One of the first metal oxides to be used as a sulfur removing agent was iron oxide. It
was first used in the 19th
century21
. Once iron oxide is exposed to H2S, iron sulfide is
formed and after the adsorbent become inactive, it can be regenerated by air to
oxidize the iron sulfide and generate elemental sulfur. After several regeneration
cycles, the reactor will be clogged by sulfur and has to be shut down for sulfur
removal. Ferric oxide based sorbent, CG-4 has even been used in small scale natural

Chapter 1 Introduction
9
gas processing plants in Canada. The adsorbent is reported to have sulfur adsorption
capacity of 150 mg sulfur per gram of adsorbent12
. However, the adsorbent is
designed for low temperature processes and due to having porosity in its structure; it
is prone to pore blockage and severe loss of adsorption capacity when used in humid
gas streams. One of the significant drawbacks of the sorbent is that it is just
regenerable for just 2 or 3 cycles.
The reaction of H2S with iron oxide is as follows22
:
𝐻2𝑆(𝑔) +1
3𝐹𝑒2𝑂3(𝑠) →
1
3𝐹𝑒2𝑆3(𝑠) + 𝐻2𝑂(𝑙) (1-10)
One of the problems with using iron oxide as a high temperature H2S adsorbent is
that the adsorption reaction is best carried out at room temperature. If performed at
higher temperatures, iron oxide will become dehydrated and results in considerable
reduction in the rate of reaction22
.
Active iron oxide adsorbents are usually sold under several trademarks related to the
different support media, such as Iron sponge, Sulfa Treat, Sulfur-Rite, Media-G2,
and CG-4. Detailed information of these adsorbents is presented in table 2-1.
Table 1-1 – detailed information of commercial active iron oxide sorbents
Adsorbent Operating
Temperature Ability to regenerate Cons / Pros Manufacturers
Iron sponge 20-23 °C Max 2-3 times High labor cost Connely GMP,
Physichem, Verac
Sulfa Treat 20-23 °C No Easy to handle Sulfatreat
Sulfur Rite 20-23 °C No Prepackaged- forms
iron pyrite US Filter, Merichem
Media G-2 20-23 °C Up to 15 times
Requires multiple
regenerations for high
efficiency
ADI international
CG-4 20-23 °C Max 2-3 times High sulfur loading-
easy to handle
CLEAN Catalysis and
Purification Tech.

Chapter 1 Introduction
10
Zinc, copper and calcium oxides are also good H2S adsorbents. They have
spontaneous reactions with H2S at room temperature. The reactions are as follows:
𝑍𝑛𝑂(𝑠) + 𝐻2𝑆(𝑔) → 𝑍𝑛𝑆(𝑠) + 𝐻2𝑂(𝑙) (1-11)
𝐶𝑢𝑂(𝑠) + 𝐻2𝑆(𝑔) → 𝐶𝑢𝑆(𝑠) + 𝐻2𝑂(𝑙) (1-12)
𝐶𝑎𝑂(𝑠) + 𝐻2𝑆(𝑔) → 𝐶𝑎𝑆(𝑠) + 𝐻2𝑂(𝑙) (1-13)
Calcium oxide is believed to be a better choice for H2S adsorption at high
temperatures (250-500°C) and zinc oxide appears to have better adsorption capacity
at temperatures lower than 100°C23.
Rare metal elements include 15 lanthanides together with Sc and Y. Among them,
lanthanium and cerium(III) oxides have shown great H2S adsorption capacity
especially in realistic reformate gas compositions, such as steam reforming,
autothermal reforming, or partial oxidation of heavy oils, diesel, jet fuels or coal
gasification24
.
Li et al.25
investigated the catalytic oxidation of H2S to elemental sulfur on four rare
earth orthovanadates (Ce, Y, La and Sm) and three magnesium vanadates (MgV2O6,
Mg2V2O7 and Mg3V2O8). For the rare earth orthovanadates, it was found that sulfur
yield increased in the order LaVO4< SmVO4< YVO4< CeVO4.
Flytzani- Stephanopoulos et al.26
developed adsorbents based on cerium and
lanthanum oxide surfaces and capable of reversible adsorption of H2S for several
cycles at temperatures up to 800°C. They reported a very fast adsorption and
desorption process together with the ability to remove H2S to a sub-ppm level at
very short (millisecond) contact time. According to these authors any type of sulfur-
free gas, including water vapor, can be used to regenerate the adsorbent.
In order to improve the adsorptive performance of metal oxides, strategies such as
doping with other metals have also been used. As an example, zinc ferrite was used
as an adsorbent for H2S in coal gases at 538°C27. Mixed oxides of copper together
with Cr, Ce, Al, Mg, Mn and Ti have also been investigated and CuCr2O4 (CuO-

Chapter 1 Introduction
11
Cr2O3) and CuCeO2 were found to be the most efficient adsorbents at high
temperatures28
.
Hee Kwon et al.7 used a mixture of zinc oxide, titanium oxide, nickel oxide and
cobalt oxide together with an inorganic binder bentonite to prepare Zn-Ti based
adsorbents for H2S removal. Adsorbents showed very good sulfur removing capacity
even after 15 cycles of regeneration, while conventional Zn-Ti sorbents deactivate
much earlier. Nickel and cobalt worked as the active sites for desulfurization
reaction and they also helped to stabilize the structure of the adsorbent.
In 1997, Li et al.25
compared ZnO based adsorbents with copper oxides and realized
that CuO can be used at much higher temperatures than ZnO based adsorbents. They
also reported reduction of H2S from several thousand ppm to sub-ppm levels using
CuO and Cu2O sorbents. The disadvantage of their sorbent was that it reduced to
elemental copper by H2 and CO present in the gas stream.
Li25
also tested a CuO-CeO2 adsorbent and reported that H2S levels were reduced to
concentrations as low as 5-10 ppm from a gas stream containing several thousand
ppm at temperatures between 650-850°C.
Increasing the surface area of the adsorbent, results in an increase in the number of
active sites. In order to enhance the utilization of active chemicals (metals/metal
oxides) and their H2S breakthrough capacities, increasing the number of active sites
is required. This can be achieved by substituting the active compound on the surface
of different supports such as Al2O3, TiO2, SiO2 and zeolites. As a result, the surface
area and the number of active sites are increased and the structural stability is also
improved.
Lew et al.29
studied the adsorption of H2S on pure zinc oxide and zinc titanates. The
authors concluded that zinc titanate reduces more slowly to volatile zinc; therefore,
it can be used at higher temperatures. Ko et al.30
compared the H2S adsorption
capacity of Mn, Fe, Cu, Co, Ce and Zn when substituted on Al2O3 in syngas at 500-
700°C. They reported 100% utilization for copper and manganese. Another study31

Chapter 1 Introduction
12
showed that when Cu, Mo and Mn are supported on SP-115 zeolite, the mechanical
strength of the adsorbent is considerably increased.
Kyotani et al.32
investigated H2S adsorption of Cu supported on natural zeolites
(Mordenite and Clinoptilolite) and SiO2. They also compared the results with
adsorption on pure copper oxide. The conclusion was that the breakthrough capacity
is almost the same at 600°C for Cu on SiO2 (15wt% Cu) and zeolite (20 wt% Cu) as
for pure copper oxide.
The study also revealed the weaknesses of using pure copper oxide. It was observed
that it has the lowest reactivity for sulfidation due to formation of dense copper
sulfate on the adsorbent.
Adsorption on carbon-based materials
When molecules are adsorbed on the carbon surface, they are bound by Van der
Waals forces that work mostly in small pores. Moreover, the surface of activated
carbons promotes catalytic/ oxidative reactions due to the basic and acidic functional
groups, resulting in the adsorption and catalysis for H2S oxidation33
.
The wide application of activated carbons is mainly due to their large surface area
exceeding 1000 m3/g, high pore volume, high density of carbon atoms in graphite
layers and surface hydrophobicity.
Carbonaceous materials are usually made from different organic sources including
peat, wood, coconut shells, and polymers. In order to activate the carbonaceous
materials by physical activation, they are carbonized at temperatures ranging from
700-1000°C and then exposed to steam or carbon dioxide at temperatures ranging
from 800-1000°C. During the chemical activation process, different chemicals such
as phosphoric acid, zinc chloride or potassium hydroxide are mixed with the
material and then carbonized under various temperatures. Sometimes, in order to
improve the performance of the sorbents, carbons are impregnated with chemicals
such as KI, KMnO4, KOH or NaOH. Using different activation processes gives rise

Chapter 1 Introduction
13
to activated carbons with different features, including surface area, porosity and
surface chemistry34
.
Activated carbon sorbents can effectively remove H2S from gas streams. Carbons
impregnated with caustics can lead to fast and complete dissociation of H2S in the
basic environment and lead to its oxidation to elemental sulfur. A combination of
porosity and surface chemistry results in the oxidation of H2S mainly to sulfuric acid
which can later be removed by water washing35, 36
.
Bandosz et al.37
investigated the use of activated carbon as an H2S removing agent.
Results of the experiments showed that the surface functional groups (containing
oxygen and phosphorous) and the porosity of carbon significantly contribute to the
process of H2S removal. They also discovered that functional groups present on the
carbon surface act as a catalyst for H2S oxidation.
Activated carbon fibers have special advantages compared to the usual activated
carbons: (i) narrow pore size distribution, (ii) larger surface area and, (iii) faster
adsorption kinetics. Moreover, their adsorption capacity for sulfur can be increased
by the formation of suitable nitrogen-based surface groups through reaction with
ammonia gas at high temperature39
. Figure 1-2 shows a scanning electron
microscopy image of activated carbon fibers. As can be seen, activated carbon fibers
consist of long thin sheets of carbon. A single ACF filament is a thin tube with a
diameter of 5-8 micrometers.
Figure 1-2 – SEM image of activated carbon fibers (38)

Chapter 1 Introduction
14
1-3-2-2 Physical processes
Classical molecular sieves
Another approach to H2S removal is physisorption of H2S onto a solid surface.
Zeolites or molecular sieves are naturally occurring or synthetic silicates with a
highly uniform pore size and large surface area, making them ideal for adsorption
applications. They are commonly used in chemical industries as H2S adsorbents due
to the fact that polar compounds such as water, H2S, SO2 and NH3, are strongly
adsorbed.
Zeolites have three dimensional frameworks that bring about their unique
characteristics. They have crystalline, microporous hydrated aluminum silicate
structures of (SiO4)4-
and (AlO4)5-
linked together and forming pores with diameters
ranging from 2.5 to 10Ǻ. All AlO4 units in the framework have a negative charge
which is balanced by non-framework cations like Na+, K
+ or Ca
+. These cations can
be replaced by other cations through ion exchange. Figure 1-3 shows the structure of
a zeolite framework:
Figure 1-3 - structure of Clinoptilolite, a naturally occuring zeolite40
Since zeolites have high surface area and unique porous structure, molecules like
H2S can be adsorbed into their framework, resulting in the removal of the target
compound from a gas stream. One disadvantage of using zeolites is pore blockage
due to the presence of water in gas streams. Water can occupy the adsorption sites
and inhibit H2S from adsorbing. The presence of a very high amount of water can

Chapter 1 Introduction
15
flood the zeolite structure but even at low levels (50 ppm), the capacity for H2S can
be reduced to nearly zero. Normally, water is considered a poison for
aluminosilicate zeolites when the application is gas adsorption.
Mixed coordination molecular sieves, ETS-4 and ETS-10
Mixed octahedral/ tetrahedral titanium silicate molecular sieves consist of three
dimensional frameworks of interconnecting channels. In 1973 a natural molecular
sieve called Zorite with a titanosilicate framework was discovered in trace amounts
on the Siberian Tundra41
. A synthetic form of Zorite were later developed under the
commercial name of ETS-4 and patented at 198942
. They can be identified by the
following molecular ratio of the oxides:
1.0 ± 0.25 𝑀2/𝑛𝑂 ∶ 𝑇𝑖𝑂2 ∶ 𝑦 𝑆𝑖𝑂2 ∶ 𝑧 𝐻2𝑂
M is at least one cation having a balance of n, y ranges from 1.0 to 10.0 and z is
between 0 and 100. M is typically a mixture of alkali metal cations like sodium and
potassium. Later, another titanosilicate structure (ETS-10) with nearly the same
molecular ratio of the above mentioned oxides was also developed and patented by
Kuznicki41
. The structure of ETS-10 comprises corner-sharing SiO4 tetrahedra and
TiO6 octahedra linked through bridging oxygen atoms resulting in a 12-membered
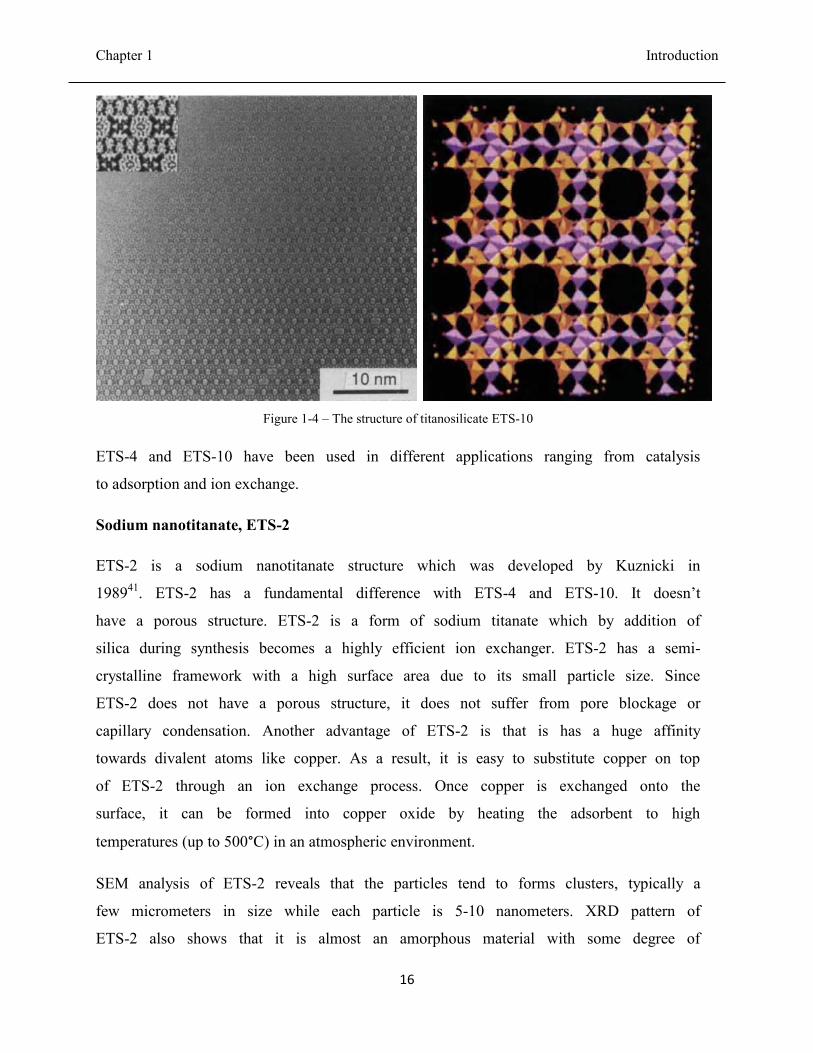
ring structure. Figure 1-4 shows a high-resolution transmission electron micrograph
of ETS-10 together with a computer simulation of the structure43
.
Chapter 1 Introduction
16
Figure 1-4 – The structure of titanosilicate ETS-10
ETS-4 and ETS-10 have been used in different applications ranging from catalysis
to adsorption and ion exchange.
Sodium nanotitanate, ETS-2
ETS-2 is a sodium nanotitanate structure which was developed by Kuznicki in
198941
. ETS-2 has a fundamental difference with ETS-4 and ETS-10. It doesn’t
have a porous structure. ETS-2 is a form of sodium titanate which by addition of
silica during synthesis becomes a highly efficient ion exchanger. ETS-2 has a semi-
crystalline framework with a high surface area due to its small particle size. Since
ETS-2 does not have a porous structure, it does not suffer from pore blockage or
capillary condensation. Another advantage of ETS-2 is that is has a huge affinity
towards divalent atoms like copper. As a result, it is easy to substitute copper on top
of ETS-2 through an ion exchange process. Once copper is exchanged onto the
surface, it can be formed into copper oxide by heating the adsorbent to high
temperatures (up to 500°C) in an atmospheric environment.
SEM analysis of ETS-2 reveals that the particles tend to forms clusters, typically a
few micrometers in size while each particle is 5-10 nanometers. XRD pattern of
ETS-2 also shows that it is almost an amorphous material with some degree of
Chapter 1 Introduction
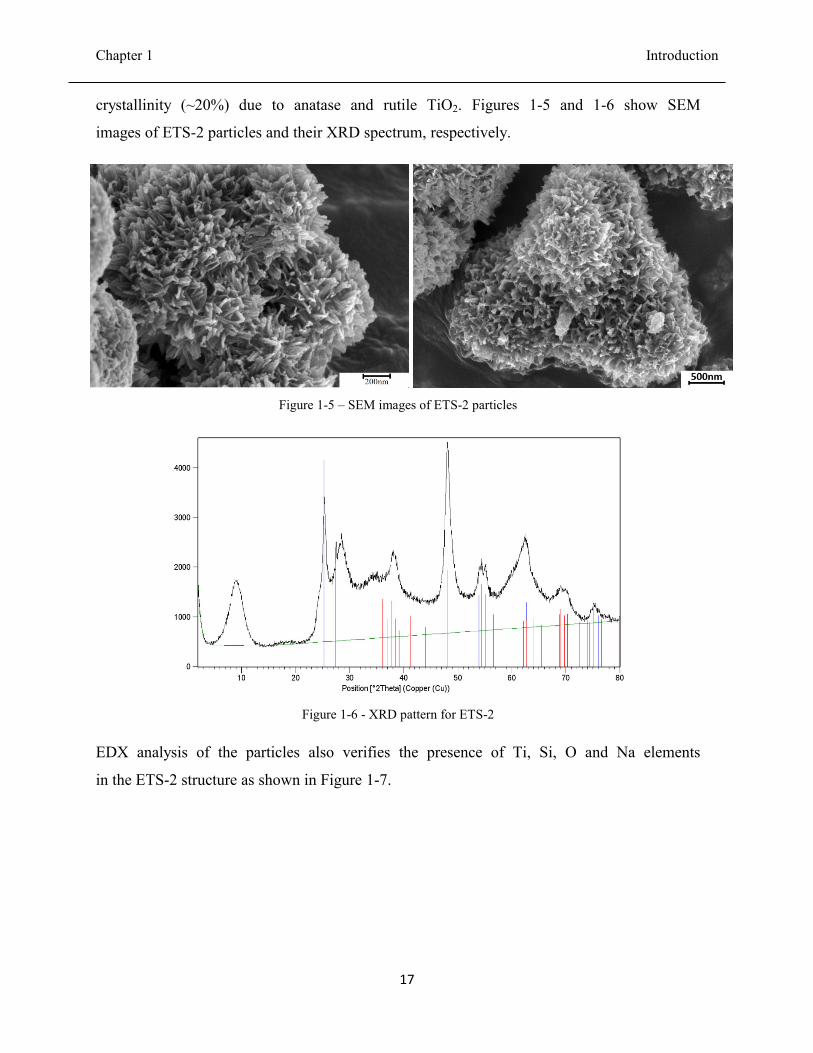
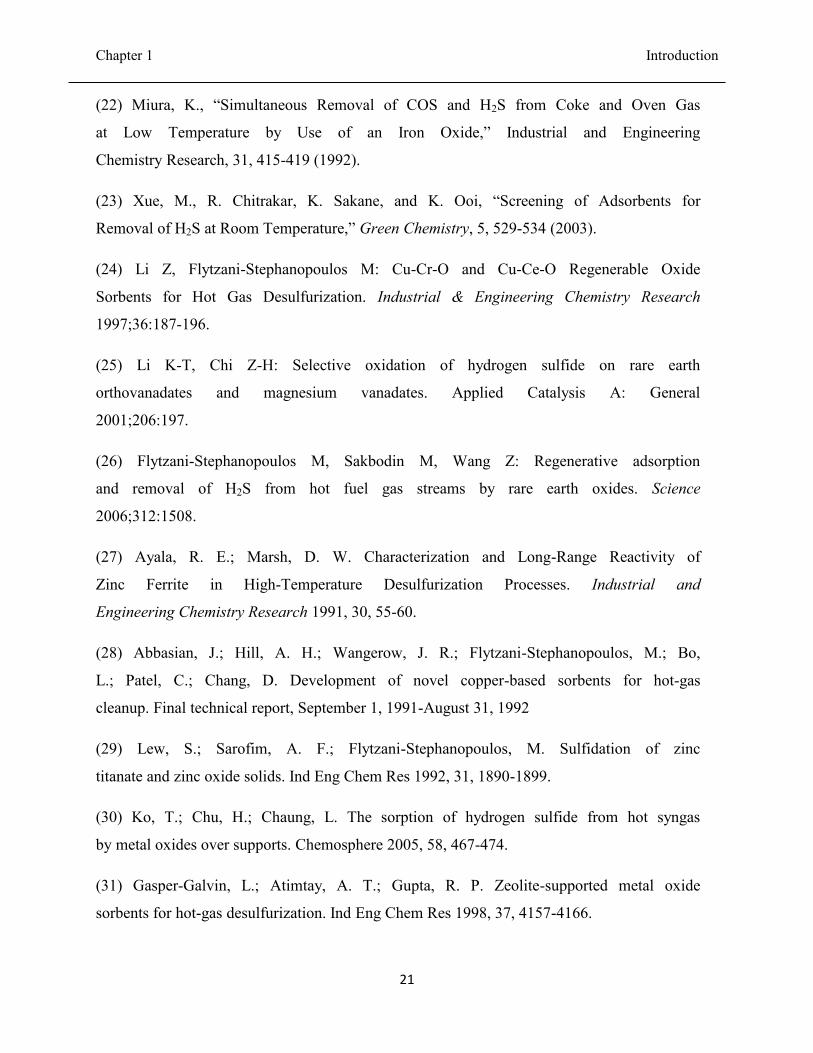
17
crystallinity (~20%) due to anatase and rutile TiO2. Figures 1-5 and 1-6 show SEM
images of ETS-2 particles and their XRD spectrum, respectively.
Figure 1-5 – SEM images of ETS-2 particles
Figure 1-6 - XRD pattern for ETS-2
EDX analysis of the particles also verifies the presence of Ti, Si, O and Na elements
in the ETS-2 structure as shown in Figure 1-7.

Chapter 1 Introduction
18
Figure 1-7 – EDX analysis for ETS-2
1-4 motivation for the research
Several chemical and physical separation methods are commonly used in industries
for this purpose such as reaction with alkaloamines, biological processes, Claus
process, adsorption on metal oxides, activated carbons, zeolites and molecular
sieves. The disadvantage of these techniques for using in the IGCC process and also
the water-gas shift reaction is that hot coal gas (generally, 500°C or above10
) must
be cooled down to around 40°C for desulfurization and then preheated to high
temperature before being fed into gas turbine. As a result, the thermal efficiency of
the system is significantly reduced. Due to this reason, it is economically important
to perform the desulfurization process at high temperatures. Among the several
desulfurization methods, adsorption of metal oxides has shown great potential to be
used as an efficient high temperature desulfurization process.

Chapter 1 Introduction
19
1-5- References
(1) Health and Safety Fact Sheet, Hydrogen Sulfide. http://cupe.ca/health-and-
safety/Hydrogen_Sulfide (Accessed November 1, 2011)
(2) Patnaik, P., “A Comprehensive Guide to the Hazardous Properties of Chemical
Substances,” 2nd ed., John Wiley, New York (1999), pp. 505-536.
(3) Stirling, D. Sulfur Problem - Cleaning up Industrial Feedstocks, 2000.
(4) U.S. DOE Topical Report # 21, Clean Coal Technology: Coproduction of Power,
Fuels, and Chemicals, p., September 2001.
(5) Chauk SS, Agnihotri R, Jadhav RA, Misro SK, Fan L-S: Kinetics of high-pressure
removal of hydrogen sulfide using calcium oxide powder. AIChE Journal
2000;46:1157.
(6) http://energy.gov/fe/how-coal-gasification-power-plants-work
(7) Hee Kwon J, Tae Jin L, Si Ok R, Jae Chang K: A study of Zn - Ti-based H2S
removal sorbents promoted with cobalt oxides. Industrial and Engineering
Chemistry Research 2001;40:3547.
(8) R. Kam, J. Scott, R. Amal, C. Selomulya, Pyrophoricity and stability of copper
and platinum based water–gas shift catalysts during oxidative shut-down/start-up
operation, Chem Eng Sci, 65 (24) (2010), pp. 6461–6470
(9) N.A. Koryabkina, A.A. Phatak, W.F. Ruettinger, R.J. Farrauto, F.H. Ribeiro, J.
Catal. 217 (2003) 233.
(10) Ko T-H, Chu H, Chaung L-K: The sorption of hydrogen sulfide from hot
syngas by metal oxides over supports. Chemosphere 2005;58:467.
(11) Prakash, A., On the effects of syngas composition and water-gas-shift reaction
rate on FT synthesis over iron based catalyst in a slurry reactor. Chem.
Eng.Commun. 1994, 128, (1), 143-158.

Chapter 1 Introduction
20
(12) Bachu, S., and W. D. Gunter, “Overview of Acid-Gas Injection Operations in
Western Canada”, Proceedings of 7th International Conference on Green House Gas
Control Technologies (2005).
(13) Wang, H., D. Fang, and K.T. Chuang, “A Sulfur Removal and Disposal Process
through H2S Adsorption and Regeneration: Ammonia Leaching Regeneration,”
Process Safety and Environment Protection, 8, 296-302 (2008).
(14) Wang, L. K., “Advanced Air and Noise Pollution Control,” Humana Press,
New York (2004), pp. 367-420.
(15) Sublette, K. L., and N. D. Sylvester, “Oxidation of Hydrogen Sulfide:
Desulfurization of Natural Gas,” Biotechnology and Bioengineering, 29, 595- 600
(1987).
(18) Sardesai, P., “Exploring the Gas Anaerobic Bioremoval of H2S for Coal
Gasification Fuel Cell Feed Streams,” Fuel Processing Technology, 87, 319-324
(2006).
(17) Jensen AB, Webb C: Treatment of H2S-containing gases: a review of
microbiological alternatives. Enzyme and Microbial Technology 1995;17:2.
(18) Wang, H., D. Fang, and K.T. Chuang, “A Sulfur Removal and Disposal Process
through H2S Adsorption and Regeneration: Ammonia Leaching Regeneration,”
Process Safety and Environment Protection, 8, 296-302 (2008).
(19) Eow JS: Recovery of sulfur from sour acid gas: A review of the technology.
Environmental Progress 2002, 21:143.
(20) Westmoreland, P. R.; Harrison, D. P. Evaluation of candidate solids for high-
temperature desulfurization of low-Btu gases. Environ. Sci. Technol. 1976, 10, 659.
(21) Crynes, B. L., “Chemical Reactions as a Means of Separation: Sulfur
Removal,” Marcel Dekker, New York (1977), pp. 212-223.
Chapter 1 Introduction
21
(22) Miura, K., “Simultaneous Removal of COS and H2S from Coke and Oven Gas
at Low Temperature by Use of an Iron Oxide,” Industrial and Engineering
Chemistry Research, 31, 415-419 (1992).
(23) Xue, M., R. Chitrakar, K. Sakane, and K. Ooi, “Screening of Adsorbents for
Removal of H2S at Room Temperature,” Green Chemistry, 5, 529-534 (2003).
(24) Li Z, Flytzani-Stephanopoulos M: Cu-Cr-O and Cu-Ce-O Regenerable Oxide
Sorbents for Hot Gas Desulfurization. Industrial & Engineering Chemistry Research
1997;36:187-196.
(25) Li K-T, Chi Z-H: Selective oxidation of hydrogen sulfide on rare earth
orthovanadates and magnesium vanadates. Applied Catalysis A: General
2001;206:197.
(26) Flytzani-Stephanopoulos M, Sakbodin M, Wang Z: Regenerative adsorption
and removal of H2S from hot fuel gas streams by rare earth oxides. Science
2006;312:1508.
(27) Ayala, R. E.; Marsh, D. W. Characterization and Long-Range Reactivity of
Zinc Ferrite in High-Temperature Desulfurization Processes. Industrial and
Engineering Chemistry Research 1991, 30, 55-60.
(28) Abbasian, J.; Hill, A. H.; Wangerow, J. R.; Flytzani-Stephanopoulos, M.; Bo,
L.; Patel, C.; Chang, D. Development of novel copper-based sorbents for hot-gas
cleanup. Final technical report, September 1, 1991-August 31, 1992
(29) Lew, S.; Sarofim, A. F.; Flytzani-Stephanopoulos, M. Sulfidation of zinc
titanate and zinc oxide solids. Ind Eng Chem Res 1992, 31, 1890-1899.
(30) Ko, T.; Chu, H.; Chaung, L. The sorption of hydrogen sulfide from hot syngas
by metal oxides over supports. Chemosphere 2005, 58, 467-474.
(31) Gasper-Galvin, L.; Atimtay, A. T.; Gupta, R. P. Zeolite-supported metal oxide
sorbents for hot-gas desulfurization. Ind Eng Chem Res 1998, 37, 4157-4166.

Chapter 1 Introduction
22
(32) Kyotani, T.; Kawashima, H.; Tomita, A.; Palmer, A.; Furimsky, E. Removal of
H2S from Hot Gas in the Presence of Cu-Containing Sorbents. Fuel 1989, 68, 74-80.
(33) Bagreev A, Bandosz TJ: A role of sodium hydroxide in the process of hydrogen
sulfide adsorption/oxidation on caustic-impregnated activated carbons. Industrial
and Engineering Chemistry Research 2002;41:672
(34) Bagreev A, Adib F, Bandosz TJ: pH of activated carbon surface as an
indication of its suitability for H2S removal from moist air streams. Carbon
2001;39:1897.
(35) Turk A, Sakalis E, Rago O, Karamitsos H. Activated carbon systems for
removal of light gases. Ann NY Acad Sci 1992;661:221–7.
(36) A, Mahmood K, Mozaffari J. Activated carbon for air purification in New York
City’s sewage treatment plants. Water Sci Techn 1993;27:121–6.
(37) Bandosz TJ: Effect of pore structure and surface chemistry of virgin activated
carbons on removal of hydrogen sulfide. Carbon 1999;37:483.
(38) Davini P: Flue gas desulphurization by activated carbon fibers obtained from
polyacrylonitrile by-product. Carbon 2003;41:277.
(39) Li, Huixing, Selective catalytic oxidation of hydrogen sulfide from syngas,
M.Sc theis, university of Pittsburg, June 2008
(40) http://www.bza.org/zeolites.html
(41) Mer'kov, A.N.; Bussen, I.V.; Goiko, E.A.; Kul'chitskaya, E.A.; Men'shikov,
Yu.P.; Nedorezova, A.P. Raite and zorite-new minerals from the Lovozero Tundra.
Zapiski Vsesoyuznogo Mineralogicheskogo Obshchestva, 1973, 102, 54-62 (in
Russian).
(42) Kuznicki, S. M. Large-Pored Crystalline Titanium Molecular Sieve Zeolites;
Patent US 4,853,202, 1989

Chapter 1 Introduction
23
(43) Anderson, M.W.; Terasaki, O. Structure of the microporous titanosilicate ETS-
10, Nature, 367, 347-351, 1994

24
Chapter 2
Copper Exchanged Nanotitanate for High Temperature
H2S Adsorption
This work was performed while the author was visiting Forschungszentrum Jülich, Institute of
Energy and Climate Research, Jülich, Germany and working under supervision of Dr. Michael
Müller, during May-July 2013
This chapter has been published in Industrial and Engineering Chemistry Research, 2014, 53, 11734-
11739

Chapter 2 Copper exchanged nanotitanate for high temperature H2S adsorption
25
2-1- Abstract:
The H2S breakthrough capacity of copper-exchanged Engelhard TitanoSilicate-2
(ETS-2) was measured at temperatures up to 950 °C and it was found that the
adsorbent efficiency remains unchanged across the entire temperature range. Below
750 °C, the adsorption capacity at breakthrough is 0.7 moles of H2S per mole of
copper while above 750 °C the capacity of the adsorbent is halved. The change in
H2S capacity is due to Cu2+
reduction by the H2 which is formed through the thermal
dissociation of H2S. The adsorbent shows good potential for use over a wide range
of operating temperatures in H2S scrubbing processes.
Keywords: H2S, ETS-2, High temperature, Desulfurization, Copper oxide,
Adsorption
2-2. Introduction
Hydrogen sulfide (H2S) is a highly odorous and toxic gas, which can be
found in the majority of coal gasification plants, petrochemical industries and
wastewater treatment plants.1 H2S is known to severely poison catalytic systems. It
takes ppm quantities of sulfur contaminants to reduce the lifetime of a supported
metal catalyst to a few months or even a few weeks.2
Depending on the origin, coal can have between 0.1- 6 wt% sulfur content,
which is released in the form of H2S during coal gasification processes and
production of syngas for power generation using IGCC process.3, 4
In IGCC syngas
is produced by gasification of coal and it is later used as a fuel for the gas turbine
and electricity generation. Syngas is also used to produce hydrogen in a process
called water-gas shift reaction at temperatures between 250°C and 350 °C. However,
to prevent serious poisoning of the water-gas shift catalyst and corrosion of the
pipelines and equipment in IGCC, syngas should be free of H2S.5
Several commercial treatment techniques are commonly used to remove H2S,
such as absorption in liquids (alkaloamines, ammonia solution, and alkaline salt
solution), biological processes,6 adsorption on activated carbon
7 and metal oxides,
8

Chapter 2 Copper exchanged nanotitanate for high temperature H2S adsorption
26
and separation by molecular sieves.9 The disadvantage of most of these processes is
the low operating temperatures which necessitates the cooling down and subsequent
reheating of the hot gas produced from coal gasification. The system efficiency
increases when high temperature desulfurization is used.10,11
Among different methods for H2S removal, adsorption on metal oxides has
shown good potential for use at temperatures as high as 1500 °C. Oxides of many
metals such as Fe, Cu, Zn, Co, W, Mo, Ca, Ba, and Sr are reported to be efficient
adsorbents at high temperatures.12
Iron oxide is one of the first metal oxides to be used for H2S removal since
19th
century.13
Iron oxide when exposed to H2S forms iron sulfide which can be
regenerated by air; the resulting SO2 can be used in the Claus process to produce
elemental sulfur.14
After several regeneration cycles, the reactor will clog and has to
be shut down for sulfur removal. Another disadvantage of using iron oxide
adsorbents is that they are not capable of removing H2S to an absolute concentration
below few hundreds parts per million and therefore, they have to be used in
combination with another adsorbent to reach a level of less than 10 ppm.15
Copper oxides have also been reported to reduce H2S from several thousand
ppm to sub ppm levels. However the disadvantage of copper oxide is that in the
presence of a reducing agent (like H2 and CO) in the gas stream Cu2+
reduces to
metallic copper lowering the sulfidation efficiency.16,17
In order to improve the adsorptive performance of metal oxides, strategies
such as doping with other metals have been used. Recently a Ca-Ba -based sorbent
was used to reach H2S concentration below 0.5 ppm at 800-900 °C.18
Zinc ferrite
was used as an adsorbent for H2S in coal gases at 538 °C.19
Mixed oxides of copper together with Cr, Ce, Al, Mg, Mn and Ti have also
been investigated with CuCr2O4 (CuO-Cr2O3) and CuCeO2 found to be the most
efficient adsorbents at temperatures as high as 850 °C.20
Li et al.21
tested an CuO-CeO2 adsorbent and reported an H2S reduction
down to 5-10 ppm from a gas stream containing several thousand ppm at
temperatures between 650-850 °C.

Chapter 2 Copper exchanged nanotitanate for high temperature H2S adsorption
27
In order to enhance the utilization of the adsorbents and their H2S
breakthrough capacities, the number of active sites has to increase. This can be
achieved by substituting the metal oxide on the surface of different supports such as
Al2O3, TiO2, SiO2 and zeolites. Ko et al.10
compared the H2S adsorption capacity of
Mn, Fe, Cu, Co, Ce and Zn when supported on Al2O3 in syngas at 500-700 °C. They
reported 100% utilization for Mn-Al2O3. A result of substitution is the increased
mechanical strength of the adsorbent, as reported by Gasper-Galvin et al.22
when Cu,
Mo and Mn were supported on SP-115 zeolite.
In this paper improvements were made to the support material using a high
surface area nanotitanate Engelhard TitanoSilicate-2 (ETS-2) as the support and
copper oxide as the active species. ETS-2 was first introduced by Kuznicki23
and is a
high surface area sodium nano-titanate with superior ion exchange capabilities
formed by the alkaline digestion of TiO2. The caustic digestion converts the surface
of the TiO2 particles into sodium titanate, which is an effective ion-exchanger;
particularly for transition metals.24
The material has no measurable microporosity
which makes it immune to pore blockage or capillary condensation.23,24
Having no
measurable microporosity, its surface area can be as high as 250 m2/g due to the
nano-scale platelets. ETS-2 particles are on the order of 50 - 100 nanometers long.
The core of these particles is presumed to be TiO2 while the surface titania species
carry a net negative charge which is offset by sodium ions.
ETS-2 has been demonstrated to be an effective support for transition metals
and for removing trace levels of H2S at ambient temperature. In our previous
study,24
copper was exchanged onto the surface of ETS-2 and the H2S removal
efficiency was measured at ambient temperature using a dynamic breakthrough
system. Samples were pre-conditioned at various temperatures before testing and it
was determined that at pre-treatment temperatures beyond 500 °C, the material
underwent a structural change and lost the majority of its H2S capacity. The
adsorption capacity of the samples, however, was always measured at ambient
temperature. In the present study, the adsorption capacity of Cu-ETS-2 was
measured at temperatures between 250 and 950 °C to understand whether the
structural changes that occur as the adsorbent is heated beyond 500 °C limit the H2S

Chapter 2 Copper exchanged nanotitanate for high temperature H2S adsorption
28
capacity of the adsorbent. Another goal was to understand the stability and the
performance of Cu-ETS-2 as high temperature H2S adsorbent in a non-reductive
environment at temperatures ranging from 250 to 950 °C.
2.3 Materials preparation
ETS-2 was hydrothermally synthesized according to a procedure published
elsewhere23
and was used as-made. ETS-2 is typically synthesized by addition of
sources of titanium, silica, alkalinity and water. Solid TiO2 is used as the source of
titanium and sodium silicate (29% SiO2, 9% NaOH) as the source of silica.
Cu-ETS-2 was prepared by mixing the as-made ETS-2 with a copper nitrate
solution. The weight proportion of adsorbent to copper salt and water was 1:2:100.
The copper salt was first dissolved in water and ETS-2 was added afterwards. The
amount of water used in our preparation is higher than the amount cited by Rezaei et
al.24
so that the suspension could be more easily stirred. The mixture was kept
mixing at 80 °C for approximately 1 day. In the next step, the ion-exchanged sample
was filtered and washed extensively with deionized water and dried in a vacuum
oven at 60°C overnight. Prior to sulfidation experiments, a 10 g sample of the
adsorbent was activated by heating to 500 °C under a static airflow in a furnace at 10
°C/min with an isothermal dwell of 2 hours.
2-4 Characterization
The crystal structure of the powders was analyzed by powder X-ray
diffraction (XRD) using a BRUKER D4 Endeavor diffractometer (Bruker-AXS,
Karlsruhe, Germany). The measurements were carried out with Cu Ka radiation, a
step size of 0.05° and a step time of 5 s. The acceleration voltage was 40 kV and the
emission current was 40 mA. The computer program HighScore Plus (PANalytical,
2004) was used for phase identification of the samples.
The microstructure of the adsorbents was investigated by Scanning Electron
Microscopy (SEM) using a Zeiss Ultra 55 device (Carl Zeiss NTS GmbH,
Oberkochem, Germany).

Chapter 2 Copper exchanged nanotitanate for high temperature H2S adsorption
29
High resolution TEM images were collected using Zeiss Libra (Fa. Carl Zeiss
Microscopy, Oberkochen, Germany) 200 Cs (200 KeV) combined with an objective Cs
corrector. The elemental analysis was carried out by energy-dispersive X-ray
spectroscopy (EDX) using an INCA energy-dispersive X-ray analysis system
(Oxford Instruments, Uedem, Germany). Point specific elemental analysis by the
EDX detector attached to the SEM instrument was used to estimate the amount of
copper atoms exchanged on the surface of ETS-2. Three separate spots (measuring a
few hundred nm in size) were analyzed. Data was collected for the elements Na, Ti,
Si, Cu, and O and the copper loading was calculated as the weight fraction of this
combination of elements. The measured copper loading was identical within the
sensitivity of the instrument for all spots measured.
For the mass spectrometry measurements a standard ABB Extrel mass
spectrometer (Questor QGP) capable of detecting down to 100 ppb concentrations
was used.
2-5 Experimental setup
The experimental setup consists of a gas mixing unit, an electrical heated
tube reactor furnace and mass spectrometer. To ensure the temperature uniformity,
the furnace has 3 temperature zones with a total length of 600 mm. 1g of adsorbent
was packed between plugs of quartz wool inside a heat resistant alumina tube with
internal diameter of 6 mm. The tube was then placed inside the furnace and was fed
by a continuous flow of 500 mL/min of He/ H2S mixture. The H2S concentration in
the feed gas stream was 500 ppmv. The flow rates were controlled by electronic
mass flow controllers.
The mass spectrometer was used to determine the H2S concentration at the
exit of the adsorbent bed. The H2S concentration was monitored continuously during
the experiment at 1 minute intervals. The breakthrough point was determined when
the H2S concentration exceeded 5 ppmv and the adsorption experiments were
stopped at exit concentration of 50 ppmv.
2-6. Results and discussion

Chapter 2 Copper exchanged nanotitanate for high temperature H2S adsorption
30
Figure 2-1 presents the electron microscopy graphs of ETS-2. It shows that
the particles tend to forms clusters. SEM analysis presented in Figure 2-1 a) shows
that each cluster is almost 1 micron in size. TEM analysis presented in Fig. 1 b)
shows each particle is typically between 50-100 nm long and almost 20 nm wide.
Figure 2-1. a) TEM and b) SEM images of nanotitanate ETS-2 showing the particle size and cluster structure.
The results of point specific EDX analysis (Table 1) indicated presence of
about 7.5 atomic% (equivalent to 17 wt%) of copper on the sample.
Table 2-1. Point-specific EDX analysis of Cu-ETS-2 for 3 randomly selected points on the sample (values are in
atomic%)
Elements
Point number
Si Ti Cu O
1 1.7 26.6 7.5 64.2
2 2.2 26.1 7.5 64.2
3 2 26.4 7.5 64.2
Figure 2-2 shows the XRD patterns of ETS-2 and Cu-ETS-2. ETS-2 pattern
consists of broad peaks, which are characteristic of nano-scale particles of anatase.25
The presence of these reflections is to be expected as only the surface of the particles
have been converted to sodium titanate and the bulk of the particle is TiO2.

Chapter 2 Copper exchanged nanotitanate for high temperature H2S adsorption
31
Figure 2-2. XRD patterns of ETS-2 and Cu-ETS-2.
The adsorbent was tested for H2S capacity at temperatures between 250 °C to
950 °C at 100 °C intervals. Figure 2-3 shows a typical adsorption breakthrough
curve for Cu-ETS-2 at 550 °C. The inlet concentration of 500 ppmv H2S is
effectively removed by the adsorbent as the concentration of H2S in the outlet is
maintained below the detection limit of the instrument (100 ppbv) for a significant
period of time. As time passes, the H2S concentration rises above baseline and the
curve inflects as H2S “breaks through”.
Figure 2-3. Breakthrough curve for H2S adsorption by Cu-ETS-2 at 550 °C.
0
5
10
15
20
25
30
35
40
45
50
0 20 40 60 80 100 120 140 160 180
H2S
co
mp
osi
tio
n (
pp
m)
Time (min)
550 C

Chapter 2 Copper exchanged nanotitanate for high temperature H2S adsorption
32
The concentration rises rapidly after breakthrough as a result of the
adsorbent becoming saturated and having fewer sites with which to react with H2S.
The capacity of the adsorbent is calculated by multiplying the mass flow rate of H2S
into the bed by the time it takes for the outlet to show a concentration of 5 ppmv
H2S. Figure 2-4 shows the breakthrough curves for different adsorption experiments
carried out at varying temperatures to understand how this variable affects the
capacity of the adsorbent.
Figure 2- 4. Breakthrough curves for Cu-ETS-2.
The capacity of the adsorbent for H2S at different temperatures is presented
in Figure 2-5. The H2S adsorption capacity is largely equivalent between 250 °C to
650 °C. As the temperature is increased to 750 °C, the adsorption capacity
undergoes a step change and the adsorbent loses about half of its capacity. The
capacity stays at nearly the same level up to 950 °C.
0
5
10
15
20
25
30
35
40
45
50
0 20 40 60 80 100 120 140 160 180
H2S
com
po
siti
on
(pp
m)
Time (min)
250 C 350 C 450 C
550 C 650 C 750 C
850 C 950 C

Chapter 2 Copper exchanged nanotitanate for high temperature H2S adsorption
33
Figure 2- 5. Breakthrough capacities of Cu-ETS-2 at different temperatures.
In order to understand the reason for the sudden change, the adsorbent was
characterized by XRD analysis after adsorption. The results are presented in Figure
2-6.
55 51
56 58
60
31 29
32
0
10
20
30
40
50
60
70
250 350 450 550 650 750 850 950
Ad
sorp
toin
cap
acit
y (m
g H
2S/
g ad
sorb
ent)
Testing Temperature (⁰C)

Chapter 2 Copper exchanged nanotitanate for high temperature H2S adsorption
34
Figure 2-6. XRD patterns of Cu-ETS-2 after H2S adsorption at 350 °C, 550 °C and 750 °C.
The analysis results show that titania in the adsorbent becomes more
crystalline at higher temperatures as evidenced by the growing intensity of the peaks
and the sharpness of the reflections. At 350 and 550°C, TiO2 is present in the form
of tetragonal anatase while at 750 °C TiO2 peaks are sharper still, and indicate a
phase transformation to rutile.
The XRD results indicate the presence of predominantly CuS crystals at 350
°C and Cu2S at 750 °C. At 550 °C, new crystal morphology is also observed which
indicates copper to sulfur ratios between 9:5 and 2:1 called digenite. According to
literature,26
digenite can be formed during copper sulfidations from temperatures as
low as 80 °C (low digenite) up to 775 °C (high digenite). In our study digenite is
presumed to have formed due to partial reduction of Cu2+
at the same temperature
range.

Chapter 2 Copper exchanged nanotitanate for high temperature H2S adsorption
35
The change in copper sulfide species seen in the XRD patterns can be
explained by a change in the oxidation state of copper and change in the adsorption
mechanism due to the presence of hydrogen introduced by thermal dissociation of
H2S. It has been established that at higher temperatures, H2S is dissociated into
hydrogen and sulfur as indicated by reaction (1)27
:
xH2S→xH2+Sx (2-1)
where Sx indicates different allotropes of sulfur. On the basis of thermodynamic
data, Barin and Knacke28
suggested that at temperatures above 627 °C the reaction
(1) can be written as:
2H2S→2H2+S2 (2-2)
According to Table 2, at temperatures up to 627°C, just a small amount of
H2S is dissociated to form H2. In this region CuO is the predominant active species
and adsorption is governed by the following reaction:
CuO + H2S CuS + H2O (2-3)
Table 2-2. Equilibrium concentration of hydrogen in decomposition of hydrogen sulfide under 1 atm
(calculated) (27).
Temperature, °C Equilibrium concentration, mol%
127 1.3×10⁻³
227 6.1×10⁻³
327 2.0×10⁻²
427 4.8×10⁻²
627 1.9
927 13.1
1127 25.6
As the temperature increases, the amount of hydrogen generated increases
significantly (estimated to be 7 mol%) which, with an incoming stream of 500 ppmv
H2S, must be enough to effectively reduce CuO to Cu as per equation (4)29
:
Chapter 2 Copper exchanged nanotitanate for high temperature H2S adsorption
36
CuO+ H2Cu+H2O (2-4)
Once in its metallic form, the copper sulfidation reaction proceeds as per equation
(5):
2Cu+H2SCu2S+H2 (2-5)
The copper to sulfur stoichiometry in Equation (5) is half that compared to Equation
(3). Thus, while the metal utilization may remain unchanged, the amount of sulfur
that will be adsorbed scales with the oxidation state of the metal.
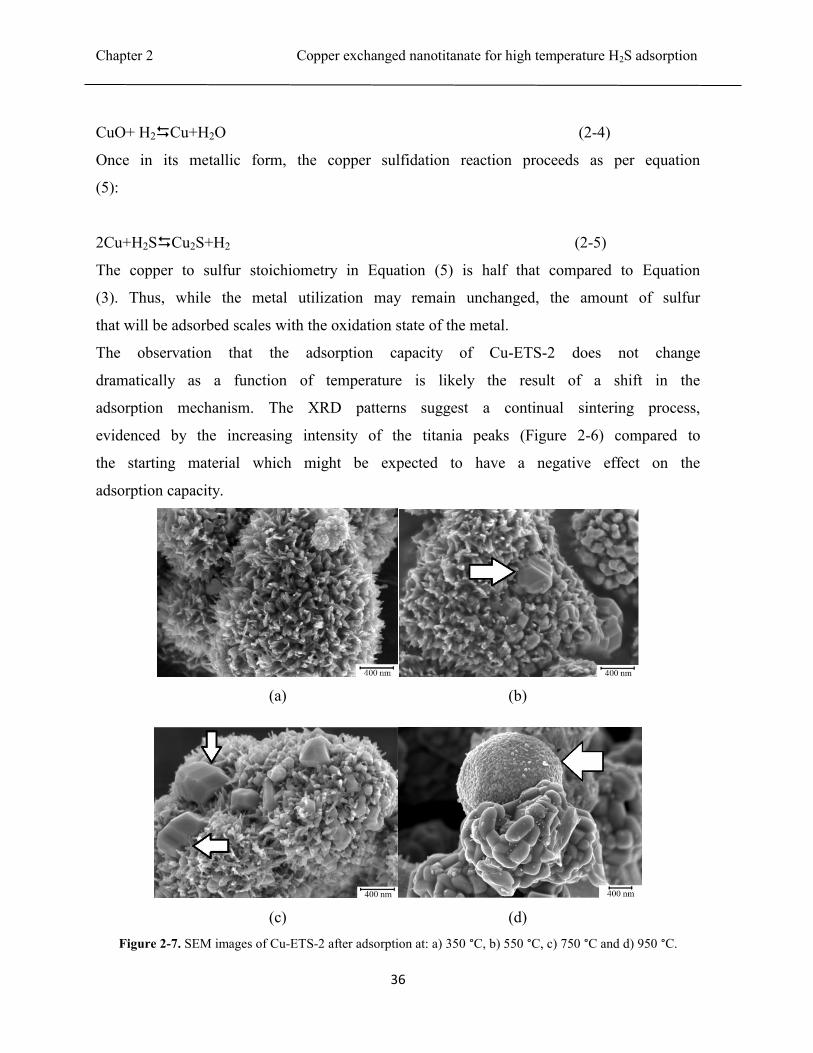
The observation that the adsorption capacity of Cu-ETS-2 does not change
dramatically as a function of temperature is likely the result of a shift in the
adsorption mechanism. The XRD patterns suggest a continual sintering process,
evidenced by the increasing intensity of the titania peaks (Figure 2-6) compared to
the starting material which might be expected to have a negative effect on the
adsorption capacity.
(a) (b)
(c) (d)
Figure 2-7. SEM images of Cu-ETS-2 after adsorption at: a) 350 °C, b) 550 °C, c) 750 °C and d) 950 °C.

Chapter 2 Copper exchanged nanotitanate for high temperature H2S adsorption
37
The SEM images in Figure 2-7, however, clearly show a growth in the size
of the copper sulfide crystals as the sulfiding temperature is increased. The growth
of these crystals as a function of temperature suggests that the cupper sulfide crystals
behave as an active adsorption site. While Cu-ETS-2 may progressively sinter,
which could lead to a loss of copper adsorption sites, the loss of these sites is
compensated for by the growth of the copper sulfide crystals. The two effects
apparently counter each other and provide for a relatively constant adsorption
capacity under our test conditions.
2-7. Conclusions
Cu-ETS-2 is found to be an efficient H2S adsorbent at temperatures suitable
for direct desulfurization of gas streams. Under our test conditions, the H2S capacity
for Cu-ETS-2 remains unchanged up to 650 °C after which a change in the oxidation
state of copper causes a reduction in capacity. At breakthrough, 99% of the H2S has
been removed and almost 0.7 moles of H2S per Cu is adsorbed below 750 °C, while
above this temperature close to 0.35 mole H2S is adsorbed per mole Cu. The
reduction in H2S adsorption capacity is due to the reduction of Cu2+
in the presence
of H2 generated from thermally dissociated H2S.
2-8 Acknowledgments
We thank Albana Zeko for her helpful comments on the manuscript, Dr.
Egbert Wessel, Dr. D. Grüner, and Mr. M. Ziegner from Forschungszentrum Jülich
GmbH for help in TEM, SEM, EDX, and XRD analyses. Financial support from the
Initiative and Networking Fund of the Helmholtz Association (HGF) through the
Helmholtz-Alberta Initiative is kindly acknowledged.

Chapter 2 Copper exchanged nanotitanate for high temperature H2S adsorption
38
2-9 References
(1) Gupta, R. P.; Turk, B. S.; Portzer, J. W.; Cicero, B. C. Desulfurization of Syngas
in a Transport Reactor. Environ. Prog. 2001, 20, 187.
(2) Bartholomew, C. H.; Agrawal, P. K.; Katzer, J. R. Sulfur Poisoning of Metals.
Adv. Catal. 1982, 31, 135-242.
(3) Stirling, D.; Clark, J. H.; Braithwaite, M. J. Sulfur Problem - Cleaning up
Industrial Feedstocks; The Royal Chemical Society: Cambridge, 2000.
(4) Bläsing, M., Müller, M. Release of Alkali Metal, Sulphur, and Chlorine Species
from High Temperature Gasification of High- And Low-Rank Coals. Fuel Process.
Technol. 2013, 106, 289.
(5) Koryabkina, N. A.; Phatak, A. A.; Ruettinger, W. F.; Farrauto, R. J.; Ribeiro,
F. H. Determination of Kinetic Parameters for the Water-Gas Shift Reaction on
Copper Catalysts under Realistic Conditions for Fuel Cell Applications. J. Catal.
2003, 217, 233.
(6) Jensen, A. B.; Webb, C. Treatment of H2S-Containing Gases: A Review of
Microbiological Alternatives. Enzyme Microb. Technol. 1995, 17, 2.
(7) Klein, J.; Henning, K. D. Catalytic Oxidation of Hydrogen Sulfide on Activated
Carbons. Fuel 1984, 63, 1064.
(8) Elseviers, W. F.; Verelst, H. Transition Metal Oxides for Hot Gas
Desulphurization. Fuel 1999, 78, 601.
(9) Melo, D. M. A.; De Souza, J. R.; Melo, M. A. F.; Martinelli, A. E.; Cachima, G.
H. B.; Cunha, J. D. Evaluation of the Zinox and Zeolite Materials as Adsorbents to
Remove H2S from Natural Gas. Colloids Surf., A: 2006, 272, 32.
(10) Ko T. H.; Chu, H.; Chaung, L. K. The Sorption of Hydrogen Sulfide from Hot
Syngas by Metal Oxides over Supports. Chemosphere 2005, 58, 467.

Chapter 2 Copper exchanged nanotitanate for high temperature H2S adsorption
39
(11) Müller, M. Integration of Hot Gas Cleaning at Temperatures above the Ash
Melting Point in IGCC. Fuel 2013, 108, 37.
(12) Westmoreland, P. R.; Harrison, D. P. Evaluation of Candidate Solids for High-
Temperature Desulfurization of Low-Btu Gases. Environ. Sci. Technol. 1976, 10,
659.
(13) Crynes, B. L. Chemical Reactions as a Means of Separation: Sulfur Removal;
Marcel Dekker: New York, 1977.
(14) Gollmer, H. A. in Chemistry of Coal Utilization; Lowry, H.H., Eds.; John Wiley
& Sons: New York, 1945; pp947-1007.
(15) Swisher, J. H.; Swerdtfeger, K.; Review of Metals and Binary Oxides as
Sorbents for Removing Sulfur from Coal-Derived Gases. JMEPEG 1992, 1, 399.
(16) Kyotani, T.; Kawashima, H.; Tomita, A. High Temperature Desulfurization
with Copper-Containing Sorbents. Environ. Sci. Technol. 1989, 23 (2), 218-223.
(17) Patrick, V.; Gavalas, G. R. Structure and Reduction of Mixed Copper-
Aluminum Oxide. J. Am. Ceram. Soc. 1990, 73 (2), 358-369
(18) Stemmler, M.; Tamburro, A.; Müller, M. Laboratory Investigations on
Chemical Hot Gas Cleaning of Inorganic Trace Elements for the “UNIQUE”
Process. Fuel 2013, 108, 31.
(19) Ayala, R. E.; Marsh, D. W. Characterization and Long-Range Reactivity of
Zinc Ferrite in High-Temperature Desulfurization Processes. Ind. Eng. Chem. Res.
1991, 30, 55.
(20) Abbasian, J.; Hill, A. H.; Wangerow, J. R.; Flytzani-Stephanopoulos, M.; Bo,
L.; Patel, C.; Chang, D. Development of Novel Copper-Based Sorbents for Hot-Gas
Cleanup. IGT-Final technical report to CRSC; IGT project No. 40330, 1992.
(21) Li, Z.; Flytzani-Stephanopoulos, M. Cu-Cr-O and Cu-Ce-O Regenerable Oxide
Sorbents for Hot Gas Desulfurization. Ind. Eng. Chem. Res. 1997, 36, 187.

Chapter 2 Copper exchanged nanotitanate for high temperature H2S adsorption
40
(22) Gasper-Galvin, L.; Atimtay, A. T.; Gupta, R. P. Zeolite-Supported Metal Oxide
Sorbents for Hot-Gas Desulfurization. Ind. Eng. Chem. Res. 1998, 37, 4157.
(23) Kuznicki, S. M. Large-Pored Crystalline Titanium Molecular Sieve Zeolites;
Patent US 4,853,202, 1989.
(24) Rezaei, S.; Tavana, A.; Sawada, J.; Junaid, A.; Kuznicki, S. M. Novel Copper-
Exchanged Titanosilicate Adsorbent for Low Temperature H2S Removal. Ind. Eng.
Chem. Res. 2012, 51, 12430.
(25) Yogamalar, R.; Srinivasan, R.; Vinu, A.; Ariga, K. X-ray Peak Broadening
analysis in ZnO Nanoparticles. Solid state Commun. 2009, 149, 1919–1923.
(26) Donnay, G.; Donnay, J. D. H.; Kullerud, G. Crystal Structure of Digenite,
Cu9S5. Am. Mineral. 1958, 43, 228-242.
(27) Fukuda, K.; Dokiya, M.; Kameyana, T.; Kotera, Y. Catalytic Decomposition of
Hydrogen Sulfide. Ind. Eng. Chem. Res. 1978, 17, 243-248.
(28) Barin, I.; Knacke, O. Thermochemical Properties of Inorganic Substances;
Springer-Verlag: Berlin, 1973.
(29) Patrick, V.; Gavalas, G. R.; Flytzani-Stephanopoulos, M.; Jothimurugesan, K.
High Temperature Sulfidation-Regeneration of Cuo-Al2O3 Sorbents. Ind. Eng.
Chem. Res. 1989, 28, 931-940.
41
Chapter 3
Cu-Cr-O Functionalized ETS-2 Nanoparticles for Hot
Gas Desulfurization
This work was performed while the author was visiting Forschungszentrum Jülich, Institute of
Energy and Climate Research, Jülich, Germany and working under supervision of Dr. Michael
Müller, during May-July 2013
This chapter has been published in Journal of Nanoscience and Nanotechnology, 2015, 15, xx-xx
Chapter 3 Cu-Cr-O Functionalized ETS-2 Nanoparticles for Hot Gas Desulfurization
42
3-1 Abstract
Engelhard Titanium Silicate -2 (ETS-2), a sodium nanotitanate, was surface
functionalized by ion exchanging the solid with copper and chromium ions. The
ability of this bi-metallic adsorbent to remove H2S at elevated temperatures was
assessed using a dynamic breakthrough system and contrasted against an analogous
mixed metal oxide, Cu-Cr-O. Unlike Cu-Cr-O, the H2S capacity for CuCr-ETS-2
remains unchanged from 350°C up to 950 °C. Using ETS-2 as a support for the
metals increased the adsorbents surface area and improved its sulfur capacity from
35 mg H2S/g for Cu-Cr-O to 61 mg H2S/g adsorbent for CuCr-ETS-2. The consistent
presence of Cu9S5 on the sulfided adsorbents suggests that chromium effectively
stabilizes the copper against reduction to metallic copper up to temperatures as high
as 950 °C.
Keywords: H2S, ETS-2, CuCr2O4, High temperature, Desulfurization, Adsorption
3-2. Introduction
Coal constitutes the largest portion of the world’s fossil fuel resources and,
each year, provides around one third of world’s electricity requirement.1 One of the
challenges in the energy conversion industry is to extract energy from coal with the
minimum environmental impact. Sulfur is a key contaminant that must be removed
in order to facilitate more efficient conversion processes.2,3
IGCC or Integrated
Gasification Combined Cycle is a clean and efficient process to lower the
environmental impact of using coal for the purpose of power generation.4 In an
IGCC system, carbonaceous feedstock is gasified to produce syngas.5 Depending on
the origin, coal may contain different amounts of sulfur components, which is
released in the form of H2S during gasification.6,7
The H2 content of the syngas is
increased through water-gas shift reaction at temperatures ranging from 200 °C up to
450 °C depending on the catalyst.8-10
The longevity of different catalysts in this
reaction is limited by their sensitivity to sulfur poisoning. As a result, production of
H2S free syngas is of high importance.11,12

Chapter 3 Cu-Cr-O Functionalized ETS-2 Nanoparticles for Hot Gas Desulfurization
43
Different treatment techniques are used for H2S removal, among which are
adsorption by activated carbon, incineration or catalytic combustion, condensation,
chemical oxidation and wet absorption.13,14
The disadvantage of most of these
processes is that they operate at, or near ambient temperature, which necessitates
cooling down the hot gas produced from coal gasification and subsequently re-
heating it prior to the water-gas shift process. 1,13,15
Activated carbon has low capacity for high temperature H2S adsorption from
gas streams, but using it as a support with certain metal oxides has increased the
capacity in hot gas cleanup in an IGCC system. The breakthrough time, when zinc
impregnated carbon is used, approached that of the best metal oxides. In addition, it
is cheaper and unlike CuO and ZnO it retains its activity in temperatures lower than
550°C.13,16,17
Metal oxide-based H2S adsorbents such as oxides of iron, copper, zinc,
manganese, cerium, calcium and tin have been studied for high temperature
applications.18-21
Among different metal oxides, zinc oxide was believed to possess
the best qualities like high diffusion rate and high H2S adsorption. Copper oxides
have attracted much attention to substitute zinc oxide adsorbents because they have
lower vapor pressure, making them non-volatile at high temperatures, and also
possess the highest sulfidation equilibrium constant.22
In the presence of a reducing
agent like H2, however, CuO reduces to Cu2O and eventually to elemental copper,
which increases the solid diffusion resistance due to sintering and sulfide formation
of onion-like dense layers. 23, 24
To avoid formation of onion-like sulfide structures different studies sought to
disperse the metals on a support material such as alumina (Al2O3), titania (TiO2),
silica (SiO2), and chromia (Cr2O3). Kyotani et al.25
studied different copper oxides
and showed that impregnation of CuO on zeolite and on SiO2 led to adsorbents
having higher copper utilization compared to when CuO was used as a pure metal
oxide. At sulfidation temperatures between 500–700°C Ko et al.24
studied metal
oxides including Zn, Cu, Fe, Mn, Co and Ce supported on -Al2O3 and investigated g

Chapter 3 Cu-Cr-O Functionalized ETS-2 Nanoparticles for Hot Gas Desulfurization
44
their H2S removal performance. They achieved an adsorption capacity as high as 29
mg sulfur/g adsorbent and the results showed Mn and Cu had the best performance.
In recent years, several studies exploring mixed metal oxides have showed
superior properties in comparison to single metal oxides. Studies of different copper
oxides such as Cr2O3-Al2O3, MgO- Al2O3, TiO2- Al2O3 and CuFe2O4 or CuAl2O4
have shown that the reduction of CuO at high temperatures was slower in
comparison to pure CuO in metal oxide compounds.26, 27
Other oxides, such as MgO,
TiO2, and CeO2 do not form compounds or oxide solid solutions with CuO due to
immiscibility of certain metal oxides at high temperatures. Instead, they might be
used as dispersants of copper.27, 28
Abbasian et al.29
evaluated several copper-based
mixed compounds and showed that the H2S removal capacity of Cu-Cr-O with
surface area of 3 m2/g exceeds that of elemental copper at temperatures around 650
°C.29
The work to date suggests that mixed copper and chromium oxides possess the
highest thermodynamic stability and the slowest reduction rate of all oxide
compounds of copper. Binary oxides of CuO-Cr2O3 and Cu-CeO2 have also been
studied. The presence of stable CuCr2O4 in CuO-Cr2O3 solids is believed to preserve
copper in Cu2+
or Cu+ oxidation form. Preserving the oxidation state of copper is
important for H2S removal because if the copper oxide reduces to elemental copper
the H2S adsorption will decrease, as sulfidation equilibrium constant for copper
oxide is ten orders of magnitude higher than that of metallic copper.22, 27
In this paper, a high surface area nanotitanate, Engelhard Titanium Silicate -2
(ETS-2) was used as a metal support to create an analogous metal titanate
comparable to the bi-metal oxide Cu-Cr-O. ETS-2 was first introduced by
Kuznicki30
and is a high surface area (up to 300 m2/g), non-porous sodium
nanotitanate formed by the alkaline digestion of titania. The caustic treatment
converts the surface of the titania nanoparticles to sodium titanate which is a
powerful ion exchanger, particularly for transition metals.31,32
The core of the ETS-2
particles is presumed to be TiO2 while the surface titania species carry a net negative
charge which is offset by sodium ions. The surface area of ETS-2 is derived entirely
from the scale of its nano-platelets. ETS-2 particles are on the order of 50-100

Chapter 3 Cu-Cr-O Functionalized ETS-2 Nanoparticles for Hot Gas Desulfurization
45
nanometers long and almost 20 nm wide. The lack of microporosity makes ETS-2
non- susceptible to pore blockage or capillary condensation.33,34
Cu-exchanged ETS-
2 has been demonstrated to be effective at removing trace levels of H2S at ambient
temperature. 31
3.3 Adsorbent preparation
Two adsorbents were prepared: ETS-2 functionalized with copper and
chrome, and the copper/chrome oxide CuCr2O4. Both adsorbents were tested for H2S
removal from an inert gas stream at temperatures ranging from 350 to 1100 °C.
ETS-2 was synthesized according to the literature.30, 31
It was hydrothermally
synthesized from a mixture of titanium and silica, a source of alkalinity and water.
Solid TiO2 was used as the source of titanium while sodium silicate (29% SiO2, 9%
NaOH) was the source of silica.
Copper (II) nitrate trihydrate (Cu(NO3)23H2O), chromium(III) nitrate
nonahydrate, (Cr(NO3)39H2O) and citric acid were all purchased from Sigma-
Aldrich and used as received. Spinel copper chromite (CuCr2O4) was synthesized
according to literature.35-37
Target masses of Cu(NO3)23H2O and Cr(NO3)39H2O
were dissolved in distilled water to achieve a stoichiometric ratio of Cu:Cr =1:2:
9Cu(NO3)2.3H2O +18Cr(NO3)3.9H2O + 20C6H8O7.H2O → 9CuCr2O4 + 36N2 + 120CO2 + 289H2O
(1)
Citric acid was added as an 18:5 molar ratio to nitrate ions. The temperature was
kept at 50 °C while stirring vigorously. Then the temperature was increased and
further kept at 80 °C until a transparent and viscous gel was attained. The remaining
viscous gel was heated up to 130 °C for 3 hours until a foamy dark powder was
formed. The powder was activated in air at 10 °C/min to 650 °C and held
isothermally for two hours.
To introduce copper and chromium to ETS-2, the same synthesis procedure
was followed. As the viscous gel was formed, ETS-2 was added to the gel and the

Chapter 3 Cu-Cr-O Functionalized ETS-2 Nanoparticles for Hot Gas Desulfurization
46
mixture was kept under mixing overnight at 80 °C. During this time the desired ions
substitute on the surface of ETS-2 through ion-exchange process. The ion-exchanged
ETS-2 was then filtered out of the mixture washed by deionized water and dried
overnight in a vacuum oven at 60 °C. The adsorbent was later heated in a furnace
under air atmosphere to 500 °C at a rate of 10 °C/min. The sample was maintained
at 500 °C for 2 hours.
3-4 Characterization
The crystal structure of the powders was analyzed by powder X-Ray
Diffraction (XRD) using a BRUKER D4 Endeavor Diffractometer (Bruker-AXS,
Karlsruhe, Germany). The measurements were carried out with Cu Ka radiation with
a step size of 0.01° and time interval of 0.5 s. The acceleration voltage and emission
current were equal to 40 kV and 40 mA, respectively. The computer program
HighScore Plus (PANalytical, 2004) was used to evaluate the composition of the
sample.
The microstructure of the adsorbents was investigated by Scanning Electron
Microscopy (SEM) using a Zeiss Ultra 55 device (Carl Zeiss NTS GmbH,
Oberkochem, Germany).
High-resolution Transmission Electron Microscope (TEM) images were
collected using Zeiss Liba (Fa. Carl Zeiss Microscopy, Oberkochen, Germany) 200
Cs (200 KeV) combined with an objective Cs corrector.
The elemental analysis was carried out by Energy-Dispersive X-ray
spectroscopy (EDX) using an INCA energy-dispersive X-ray analysis system
(Oxford Instruments, Uedem, Germany).
For the mass spectrometry measurements a standard ABB Extrel mass
spectrometer (Questor QGP) capable of detecting down to 100 ppb concentrations
was used.
3-5 Experimental Setup
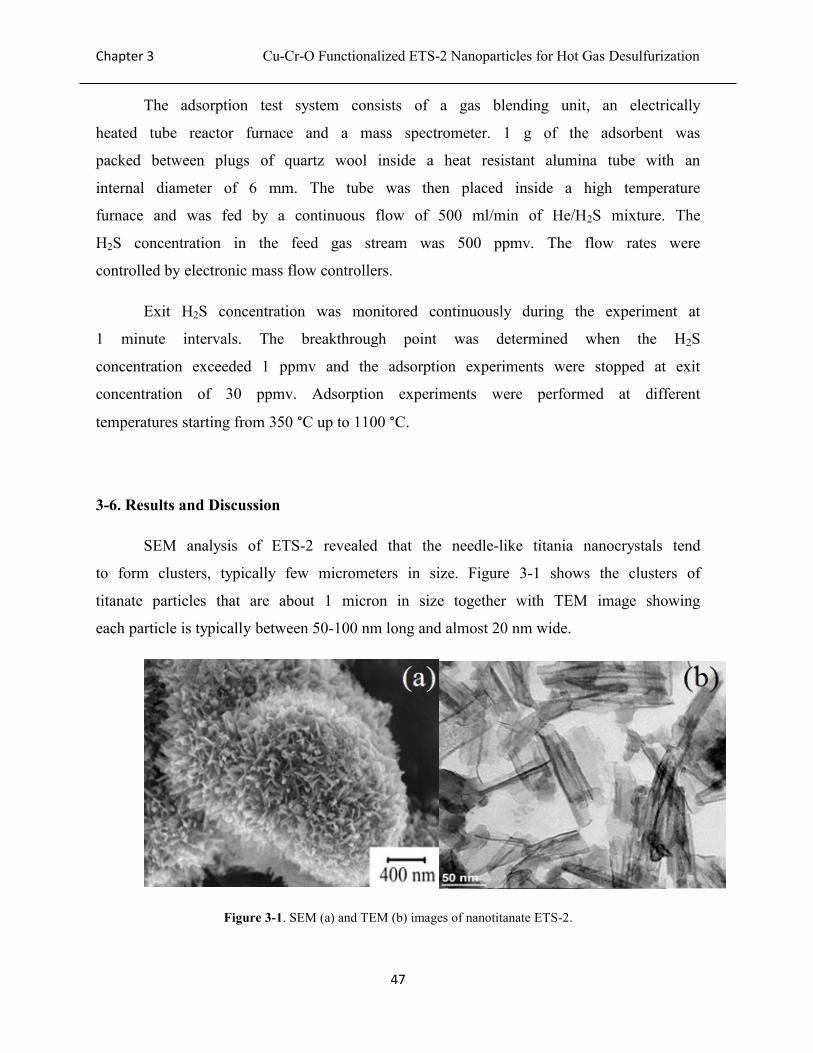
Chapter 3 Cu-Cr-O Functionalized ETS-2 Nanoparticles for Hot Gas Desulfurization
47
The adsorption test system consists of a gas blending unit, an electrically
heated tube reactor furnace and a mass spectrometer. 1 g of the adsorbent was
packed between plugs of quartz wool inside a heat resistant alumina tube with an
internal diameter of 6 mm. The tube was then placed inside a high temperature
furnace and was fed by a continuous flow of 500 ml/min of He/H2S mixture. The
H2S concentration in the feed gas stream was 500 ppmv. The flow rates were
controlled by electronic mass flow controllers.
Exit H2S concentration was monitored continuously during the experiment at
1 minute intervals. The breakthrough point was determined when the H2S
concentration exceeded 1 ppmv and the adsorption experiments were stopped at exit
concentration of 30 ppmv. Adsorption experiments were performed at different
temperatures starting from 350 °C up to 1100 °C.
3-6. Results and Discussion
SEM analysis of ETS-2 revealed that the needle-like titania nanocrystals tend
to form clusters, typically few micrometers in size. Figure 3-1 shows the clusters of
titanate particles that are about 1 micron in size together with TEM image showing
each particle is typically between 50-100 nm long and almost 20 nm wide.
Figure 3-1. SEM (a) and TEM (b) images of nanotitanate ETS-2.

Chapter 3 Cu-Cr-O Functionalized ETS-2 Nanoparticles for Hot Gas Desulfurization
48
SEM images of CuCr-ETS-2 in Figure 3-2 show no dramatic change in the
morphology of the nanotitanate particles after the ion exchange and activation
process.
Figure 3-2. SEM images of CuCr -ETS-2 before adsorption.
EDX analysis was performed on CuCr-ETS-2 before adsorption to observe
the elements on the adsorbent. The result demonstrates the existence of five
elements; titanium, chromium, copper, silicon and oxygen. TiO2 and SiO2 are base
components of ETS-2 while chromium and copper are ion exchanged on the surface.
3-6-1 Spinel Cu-Cr-O
Single adsorption experiments were performed on the adsorbent at
temperatures as low as 350 °C up to 1100 °C with 100 °C intervals. In a typical
adsorption experiment, the H2S concentration in the exit gas stream is almost zero
until a certain time, after which it starts to rise and then increases rapidly. The time
of the abrupt change of slope in the H2S concentration is called the breakthrough
time.
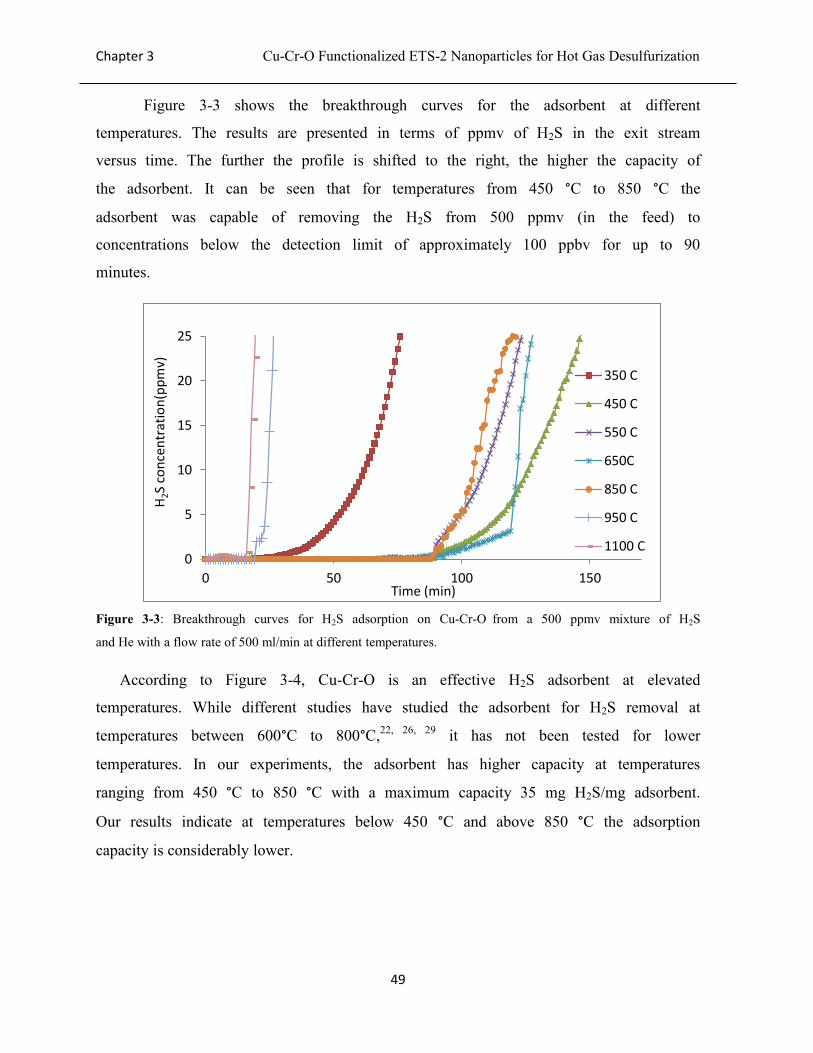
Chapter 3 Cu-Cr-O Functionalized ETS-2 Nanoparticles for Hot Gas Desulfurization
49
Figure 3-3 shows the breakthrough curves for the adsorbent at different
temperatures. The results are presented in terms of ppmv of H2S in the exit stream
versus time. The further the profile is shifted to the right, the higher the capacity of
the adsorbent. It can be seen that for temperatures from 450 °C to 850 °C the
adsorbent was capable of removing the H2S from 500 ppmv (in the feed) to
concentrations below the detection limit of approximately 100 ppbv for up to 90
minutes.
Figure 3-3: Breakthrough curves for H2S adsorption on Cu-Cr-O from a 500 ppmv mixture of H2S
and He with a flow rate of 500 ml/min at different temperatures.
According to Figure 3-4, Cu-Cr-O is an effective H2S adsorbent at elevated
temperatures. While different studies have studied the adsorbent for H2S removal at
temperatures between 600°C to 800°C,22, 26, 29
it has not been tested for lower
temperatures. In our experiments, the adsorbent has higher capacity at temperatures
ranging from 450 °C to 850 °C with a maximum capacity 35 mg H2S/mg adsorbent.
Our results indicate at temperatures below 450 °C and above 850 °C the adsorption
capacity is considerably lower.
0
5
10
15
20
25
0 50 100 150
H2S
con
cen
trat
ion
(pp
mv)
Time (min)
350 C
450 C
550 C
650C
850 C
950 C
1100 C

Chapter 3 Cu-Cr-O Functionalized ETS-2 Nanoparticles for Hot Gas Desulfurization
50
Figure 3-4: Breakthrough capacities of Cu-Cr-O at different temperatures as measured in 1 ppmv H2S in the exit
gas.
3-6-2 CuCr-ETS-2
The adsorption capacity and breakthrough times for CuCr-ETS-2 were
obtained using the same test system and under the same conditions as described in
the previous section. A stream of gas with 500 ppmv H2S content was used.
Adsorption tests were conducted at temperatures from 350 °C to 1100 °C. The
results are shown in Figure 3-5.
14
34 32
35 35
9 7
0
5
10
15
20
25
30
35
40
350 450 550 650 850 950 1100
Ad
sorp
tio
n c
apac
ity
(mg
S/gr
Ad
sorb
ent)
Temperature (°C)

Chapter 3 Cu-Cr-O Functionalized ETS-2 Nanoparticles for Hot Gas Desulfurization
51
Figure 3-5: Breakthrough curves for CuCr-ETS-2 from a 500 ppmv mixture of H2S and He with a flow rate of
500 ml/min at different temperatures.
Unlike Cu-Cr-O, CuCr-ETS-2 maintains the high adsorption capacity at
temperatures as low as 350 °C up to 950 °C. This behavior makes CuCr-ETS-2 a
good candidate for a wide range of desulfurization applications from low
temperature water-gas shift to near combustion-temperature gas streams. A
comparison between the two adsorbents shows an increase in the adsorption
capacities from 35 mg H2S/g adsorbent for the Cu-Cr-O to about 60 mg/g adsorbent
for Cu-Cr-ETS-2.
0
5
10
15
20
25
30
35
0 50 100 150 200
H2S
co
mp
osi
tio
n (
pp
m)
Time (min)
350 C
550 C
750 C
950 C
1100 C

Chapter 3 Cu-Cr-O Functionalized ETS-2 Nanoparticles for Hot Gas Desulfurization
52
Figure 3-6: Breakthrough capacities of CuCr-ETS-2 at different temperatures.
The reaction of our adsorbent with H2S in an inert atmosphere should follow one of
the following mechanisms. CuCr-ETS-2 may react directly with the H2S to form a
copper sulfide and water. The stability of the measured adsorption capacity of CuCr-
ETS-2 over a wide temperature range could be due to the ability of chromium to
stabilize copper against complete reduction by H2, which is formed through the
autothermal dissociation of H2S at high temperatures.38
It is also possible that the adsorbent undergoes a reaction with H2S given by reaction
(2).39
6CuO + 4H2S → 3Cu2S + 4H2O + SO2 (2)
The initial reaction in the sequence that combines to produce Eq. 2 has CuO reduced
to Cu2O with the production of SO2 and H2. The H2 produced in this reaction could
risk reducing the copper oxide to copper metal at elevated temperatures. The
stability of CuCr-ETS-2’s adsorption capacity suggests that the chromium in the
adsorbent stabilizes the oxidation state of copper and prevents its reduction to metal.
We have tested, under the same conditions, Cu-ETS-2 with no chromium and found
that the capacity of the adsorbent is not stable across as wide a temperature range as
when chromium is added.
55 57
51
61
14
0
10
20
30
40
50
60
70
350 550 750 950 1100
Ad
sorp
tio
n c
apac
ity
(mg
S/gr
Ad
sorb
en
t)
Temperature (°C)

Chapter 3 Cu-Cr-O Functionalized ETS-2 Nanoparticles for Hot Gas Desulfurization
53
According to Yasyerli and Flytzani22,38
different copper sulfides will form
during adsorption of H2S on Cu2O with copper to sulfur ratios between 1.8 (digenite)
to 2 (chalcocite). XRD analysis of the adsorbent after adsorption shows formation of
the same species. At lower temperatures (350 °C and 550 °C), Cu9S5 (digenite) with
a copper to sulfur ratio of 1.8 was the only detected copper sulfide species. As the
temperature increases to 750 °C, Cu2S starts to form together with Cu9S5 and at 950
°C and 1100 °C, Cu2S is the only detected copper sulfide species. XRD data,
showing almost the same copper to sulfur ratio, are in good agreement with the
calculated H2S adsorption capacity of the adsorbent (Figure 3-6), as the capacity
does not significantly change at different temperatures. Having comparable
adsorption capacities throughout the whole temperature range suggests the existence
of the same reaction stoichiometry at different temperatures. The presence of
chromium on the adsorbent is believed to be the reason, as it keeps copper in the
Cu2+
or Cu+ oxidation state.
22 In our experiments, taking into account the copper to
sulfur ratio indicated by XRD analysis, the oxidation state has been kept constant at
+1 throughout the whole temperature range, in good agreement with Eq. (2).
Figure 3-7 shows the SEM micrographs of CuCr-ETS-2 after adsorption
testing at 350, 550, 750, and 950 °C. As the images show, two visually different
crystals have been formed on the surface of adsorbent. At lower temperatures (e.g.
550 °C) almost all the copper sulfide crystals are pseudo hexagonal, which according
to XRD analysis are Cu9S5 (digenite). At 750 °C, both pseudo hexagonal and card-
like structures are observed. Card-like structures represent Cu2S (chalcocite). At 950
°C all the observed sulfides are card-like structures, which are Cu2S according to
XRD analysis. Figure 3-8 shows that at 1100 °C the adsorbent undergoes
widespread sintering which is believed to explain the dramatic loss in H2S capacity
observed at this temperature.

Chapter 3 Cu-Cr-O Functionalized ETS-2 Nanoparticles for Hot Gas Desulfurization
54
(a) (b)
(c) (d)
Figure 3-7. SEM images of CuCr -ETS-2 at: a) 350 °C, b) 550 °C, c) 750 °C and d) 950 °C.
Figure 3- 8. SEM image of CuCr-ETS-2 at 1100 ⁰C.

Chapter 3 Cu-Cr-O Functionalized ETS-2 Nanoparticles for Hot Gas Desulfurization
55
XRD analysis (Figure 3-9) also reveals a morphology change in the titania as
the temperature is increased. At lower temperatures, (350 °C), the dominant titania
phase is anatase while at 750 °C peaks of rutile appear. At 950 °C rutile is the only
form of TiO2 in the adsorbent. The change in morphology has no apparent effect on
the sulfur capacity of the adsorbent.
Figure 3-9: XRD patterns of CuCr-ETS-2 after adsorption at different temperatures.
3-7- Conclusions
H2S removal directly from a syngas stream is needed to maximize efficiency
of IGCC systems and for any process using metal catalysts susceptible to sulfur
poisoning. The Cu-Cr-O mixed-metal oxide adsorbent system was adapted by
dispersing copper and chromium oxides on the surface of ETS-2 via ion exchange.
The H2S breakthrough testing showed that CuCr-ETS-2 has twice the sulfur capacity
compared to Cu-Cr-O for temperatures between 450°C to 850°C. CuCr-ETS-2 also

Chapter 3 Cu-Cr-O Functionalized ETS-2 Nanoparticles for Hot Gas Desulfurization
56
has a wider temperature range and maintains its sulfur capacity between 350 and 950
°C making the same adsorbent equally good for both low and high temperature
desulfurization. The presence of Cu9S5 in the sulfided adsorbent strongly suggests
that the chromium is able to stabilize oxidation state of copper at +1.
3-8 Acknowledgments
We thank Albana Zeko for her helpful comments on the manuscript, Dr.
Egbert Wessel, Dr. D. Gruner, and Mr. M. Ziegner from Forschungszentrum Julich
GMBH for help in TEM, SEM, EDX and XRD analyses. Financial support from the
Canada research Chair in Molecular Sieve Nanomaterials, Helmholtz-Alberta
Initiative and network fund of the Helmholtz Association (HGF) is kindly
acknowledged.
3-9 References
(1) M. Müller, Fuel 108, 37 (2013)
(2) L. Fenouil, G. Towler and S. Lynn, Ind. Eng. Chem. Res. 33(2), 265 (1994)
(3) N. A. Khan, H. Zubair and H. J. Sung, Adv. Porous Mater. 1(1), 91 (2013)
(4) M. Müller, D. Pavone, M. Rieger and R. Abraham, 4th International Conference
on Clean Coal Technologies, Dresden, Germany, May (2009)
(5) J. W. Portzer, J. R. Albritton, C. C. Allen, R. P Gupta. Fuel process. Technol.
85(6), 621 (2004)
(6) D. Stirling, J. H. Clark and M. J. Braithwaite, Sulfur Problem - Cleaning up
Industrial Feedstock, The Royal Chemical Society, Cambridge, (2000)
(7) M. Bläsing and M. Müller, Fuel Process. Technol. 106, 289 (2013)
(8) D. S. Newsome, Catal. Rev. 21(2), 275 (1980)
(9) C. Rhodes, G. J. Hutchings and A. M. Ward, Catal. Today 23(1), 43 (1995)

Chapter 3 Cu-Cr-O Functionalized ETS-2 Nanoparticles for Hot Gas Desulfurization
57
(10) M. Stemmler and M. Müller, Biomass. Bioenerg. 35, S105 (2011)
(11) P. Hou, D. Meeker and H. Wise, J. Catal. 80(2), 280 (1983)
(12) G. Ma, Y.Hou, X. Han, and Z. Huang. Energy Environm. Focus. 3(1), 74
(2014)
(13) M. P. Cal, B. W. Strickler and A. A. Lizzio, Carbon 38(13), 1757 (2000)
(14) R. C Hansford, R. H. Hass and H. Hennig, U.S. Patent No. 4,088,743. 9 May
(1978)
(15) T. Ko, H. Chu and L. Chuang, Chemosphere. 58, 467 (2005)
(16) J. J. Park, C. G. Park, S. Y Jung, S. C. Lee, D. Ragupathy and J. C. Kim,
Nanoelectron. Optoelectron. 6(3), 306 (2011)
(17) J.J. Park, S.Y. Jung, C.Y. Ryu, C.G. Park, J.N. Kim, and J.C. Kim. J.
Nanoelectron. Optoelectron. 5(2), 222 (2010)
(18) Y. Motoo and E. Furimsky, Ind. Eng. Chem. Process. Des. Dev. 24(4), 1165
(1985)
(19) Y.Zeng, S. Zhang, F. R. Groves, and D. P. Harrison. Chem. Eng. Sci, 54(15),
3007 (1999)
(20) S. K. Gangwal, in Proceedings of the 3rd International Symposium and
Exhibition: High-Temperature Gas Cleaning, University of Karlsruhe, Karlsruhe,
Germany (1996), p. 489.
(21) J. S. Yong, S. C. Lee and J. C. Kim. J. Nanoelectron. Optoelectron. 7(5), 536
(2012)
(22) L. Zhijiang and M. Flytzani-Stephanopoulos, Ind. Eng. Chem. Res. 36(1), 187
(1997)
(23) M. Flytzani-Stephanopoulos, G. R. Gavalas, S. S. Tamhankar and P. K.
Sharma, Final Report to DOE, DOE/MC/ 20417-1898, (1985)

Chapter 3 Cu-Cr-O Functionalized ETS-2 Nanoparticles for Hot Gas Desulfurization
58
(24) G. Sick and K. Schwerdtfeger, Metall. Trans. B. 18(3), 603 (1987)
(25) T. Kyotani, H. Kawashima, A. Tomita, A. Palmer and E. Furimsky, Fuel. 68(1),
74 (1989)
(26) M. Flytzani-Stephanopoulos, G. R. Gavalas, and S. S. Tamhankar, U.S. Patent
No. 4,729,889 (1988)
(27) P. Valerle and G. Gavalas, J. Am. Ceram. Soc. 73(2). 358 (1990)
(28) A. T. Atimtay and D. P. Harrison, eds. Desulfurization of hot coal gas. No. 42.
Springer, (1998)
(29) J. Abbasian, A. H. Hill, J. R. Wangerow, M. Flytzani- Stephanopoulos, L. Bo,
C. Patel and D. Chang, IGT-Final Technical Report to CRSC; IGT Project No.
40330, (1992)
(30) S. M. Kuznicki, Patent US4853202, (1989)
(31) S. Rezaei, A. Tavana, J. A. Sawada, L. Wu, A.S. Junaid and S. M. Kuznicki,
Ind. Eng. Chem. Res. 51(38), 12430 (2010)
(32) M. Shi, C.C. Lin, L. Wu, C. Holt, D. Mitlin and S. M. Kuznicki. J. Nanosci.
Nanotechnol. 10(12), 8448 (2010)
(33) B. Tanchuk, J. A. Sawada and S. M. Kuznicki, AIChE J. 59(12), 4727 (2013)
(34) A. Tavana, Characterization of Copper Supported on Titanosilicates for Room
Temperature H2S Adsorption. MSc thesis, University of Alberta, Edmonton (2012)
(35) Q. Geng, X. Zhao, X. Gao, S. Yang and G. Liu, J. Sol-Gel. Sci. Techn. 61(1),
281 (2012)
(36) W. Li and H. Cheng, J. Cent. South Univ. T. 14, 291 (2007)
(37) A. M. Kawamoto, L. C. Pardini and L.C. Rezende. Aerosp. Sci. Technol. 8, 591
(2004)

Chapter 3 Cu-Cr-O Functionalized ETS-2 Nanoparticles for Hot Gas Desulfurization
59
(38) K. Fukuda, M. Dokiya, T. Kameyana, Y. Kotera, Ind. Eng. Chem. Res. 17, 243
(1978)
(39) S. Yasyerli, G. Dogu and I. Ar, Ind. Eng. Chem. Res. 40(23), 5206 (2001)

60
Chapter 4
Effect of moisture on high temperature H2S adsorption
on Cu-ETS-2
This chapter has been submitted for publication in Journal of Nanoscience and Nanotechnology
Chapter 4 Effect of Moisture on High Temperature H2S Adsorption on Cu-ETS-2
61
4-1 Abstract
The removal of H2S at combustion temperatures can be accomplished using
metal oxides which react and sequester H2S as a metal sulfide. Cu-ETS-2 is an ion-
exchangeable titanate which has been modified to hold about 17 wt% copper
supported on its surface. Cu-ETS-2 has previously been shown to be an effective
adsorbent for removing hydrogen sulfide from dry, inert gas streams at temperatures
as high as 950 °C. This study measured the influence of water vapor on the H2S
adsorption capacity of Cu-ETS-2 using an inert stream containing 500 ppm H2S and
10 vol% H2O. The results demonstrate that the presence of water vapor reduces the
capacity of the adsorbent at temperatures greater than 350 °C. The loss in capacity
can be explained by an unexpected increase in the amount of H2 present in the humid
gas stream at elevated temperatures.
Keywords: H2S adsorption; Hydrogen sulfide; ETS-2; High temperature; Copper
oxide; Desulfurization; Effect of water
4-2. Introduction
Integrated gasification combined cycle (IGCC) power systems are appealing
due to the potential to achieve higher efficiency and cleaner power from a variety of
fuel sources, including coal. The synthesis gas produced from gasification contains
CO, CO2, CH4 and H2 and, due to presence of sulfur in most coals, H2S is present in
quantities ranging from 0.1 to 6 wt% 1. The H2S generated during the gasification
reaction needs to be removed from the syngas to prevent corrosion concerns with the
system equipment and to protect catalysts downstream of the gasifier.
After exiting the gasifier, syngas typically undergoes a catalytic water-gas
shift (WGS) reaction at temperatures between 250 and 450°C to generate additional
hydrogen by using steam to convert CO to CO2. H2S can rapidly poison the WGS
catalysts and thus must be removed to a level below at least 20 ppmv before being
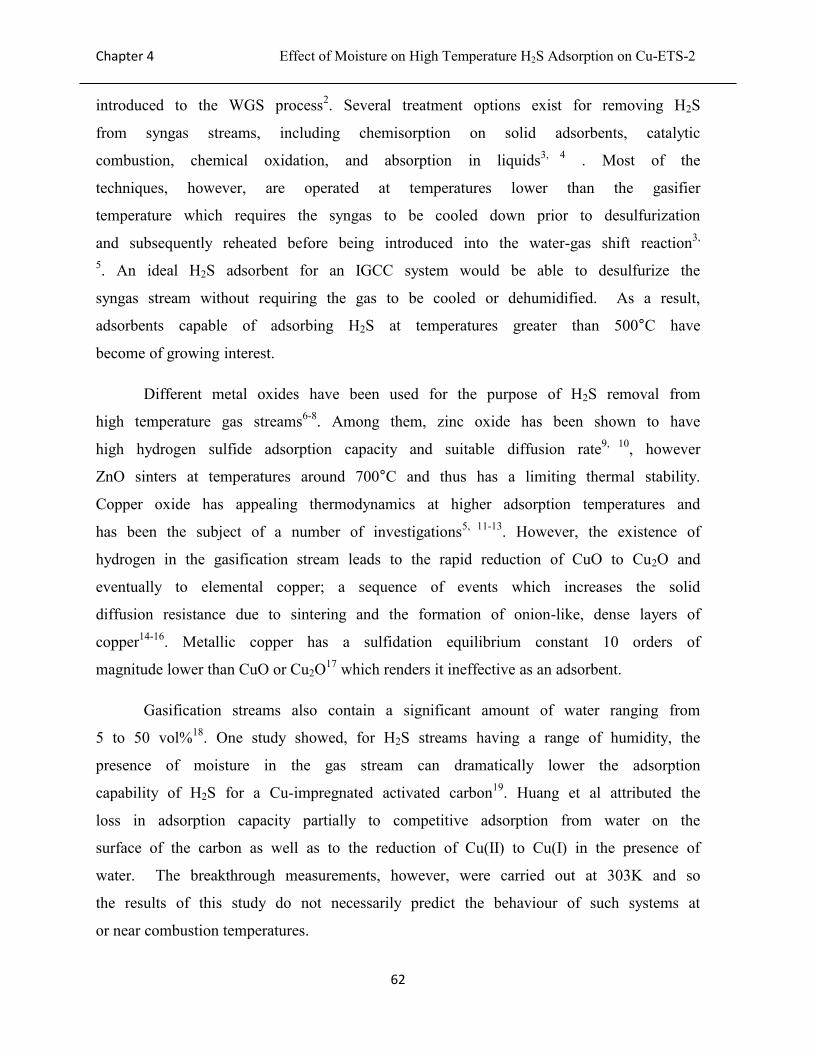
Chapter 4 Effect of Moisture on High Temperature H2S Adsorption on Cu-ETS-2
62
introduced to the WGS process2. Several treatment options exist for removing H2S
from syngas streams, including chemisorption on solid adsorbents, catalytic
combustion, chemical oxidation, and absorption in liquids3, 4
. Most of the
techniques, however, are operated at temperatures lower than the gasifier
temperature which requires the syngas to be cooled down prior to desulfurization
and subsequently reheated before being introduced into the water-gas shift reaction3,
5. An ideal H2S adsorbent for an IGCC system would be able to desulfurize the
syngas stream without requiring the gas to be cooled or dehumidified. As a result,
adsorbents capable of adsorbing H2S at temperatures greater than 500°C have
become of growing interest.
Different metal oxides have been used for the purpose of H2S removal from
high temperature gas streams6-8
. Among them, zinc oxide has been shown to have
high hydrogen sulfide adsorption capacity and suitable diffusion rate9, 10
, however
ZnO sinters at temperatures around 700°C and thus has a limiting thermal stability.
Copper oxide has appealing thermodynamics at higher adsorption temperatures and
has been the subject of a number of investigations5, 11-13
. However, the existence of
hydrogen in the gasification stream leads to the rapid reduction of CuO to Cu2O and
eventually to elemental copper; a sequence of events which increases the solid
diffusion resistance due to sintering and the formation of onion-like, dense layers of
copper14-16
. Metallic copper has a sulfidation equilibrium constant 10 orders of
magnitude lower than CuO or Cu2O17
which renders it ineffective as an adsorbent.
Gasification streams also contain a significant amount of water ranging from
5 to 50 vol%18
. One study showed, for H2S streams having a range of humidity, the
presence of moisture in the gas stream can dramatically lower the adsorption
capability of H2S for a Cu-impregnated activated carbon19
. Huang et al attributed the
loss in adsorption capacity partially to competitive adsorption from water on the
surface of the carbon as well as to the reduction of Cu(II) to Cu(I) in the presence of
water. The breakthrough measurements, however, were carried out at 303K and so
the results of this study do not necessarily predict the behaviour of such systems at
or near combustion temperatures.

Chapter 4 Effect of Moisture on High Temperature H2S Adsorption on Cu-ETS-2
63
Previous work by the authors examined copper-exchange ETS-2 (Cu-ETS-2)
for high temperature (250°C -950°C) H2S removal20
ETS-2 was first reported by
Kuznicki in 198921
and is prepared through the caustic digestion of TiO2, which
converts the surface titania groups to sodium titanate. ETS-2 is non-porous yet, due
to the size of the individual platelets, can have a BET surface area as high as
300m2/g. ETS-2 particles composed of a TiO2 core covered with charged, titanate
groups are on the order of 50-100 nm long and 20 nm wide22
. Cu-ETS-2 is prepared
through simple ion exchange of the substrate with an aqueous solution of a copper
salt. The previous testing used a dry stream containing 500 ppm H2S in He. The
results demonstrated that Cu- ETS-2 had a consistent sorption capacity of between
50 and 60 mg H2S/g(Cu-ETS-2) which was reduced by half at temperatures above 750
°C20
.
In this work Cu-ETS-2 was challenged by blending 11 vol% water with the
500 ppm H2S (balance He) stream. The water loading was selected as typical of the
syngas composition before the water gas shift reaction (WGSR)23
. Breakthrough
profiles for a number of gases were collected simultaneously at temperatures ranging
from 250°C to 950°C to understand the difference, if any, in H2S adsorption capacity
under dry and humid conditions. It was elected to explore pure Cu-ETS-2 as
opposed to a bi- or tri-metallic form of the adsorbent to isolate the influence of steam
on the reaction of H2S with copper oxide.
4-3 Materials preparation
ETS-2 was synthesized hydrothermally using an alkaline source, solid, nano-
particulate TiO2, and sodium silicate (29% SiO2, 9%NaOH) as based on the previous
methods reported in the literature20, 24
. Copper-exchanged ETS-2 was similarly
prepared as reported previously22
by ion-exchanging of slurry of solid ETS-2 mixed
with copper nitrate solution using the weight proportions of 1:2:100 for adsorbent to
salt and water respectively. The slurry was stirred at 80 °C for approximately 24
hours. Afterwards the ion exchanged sample was filtered and washed with deionized
water and dried in a vacuum oven overnight at 60 °C. Prior to the adsorption
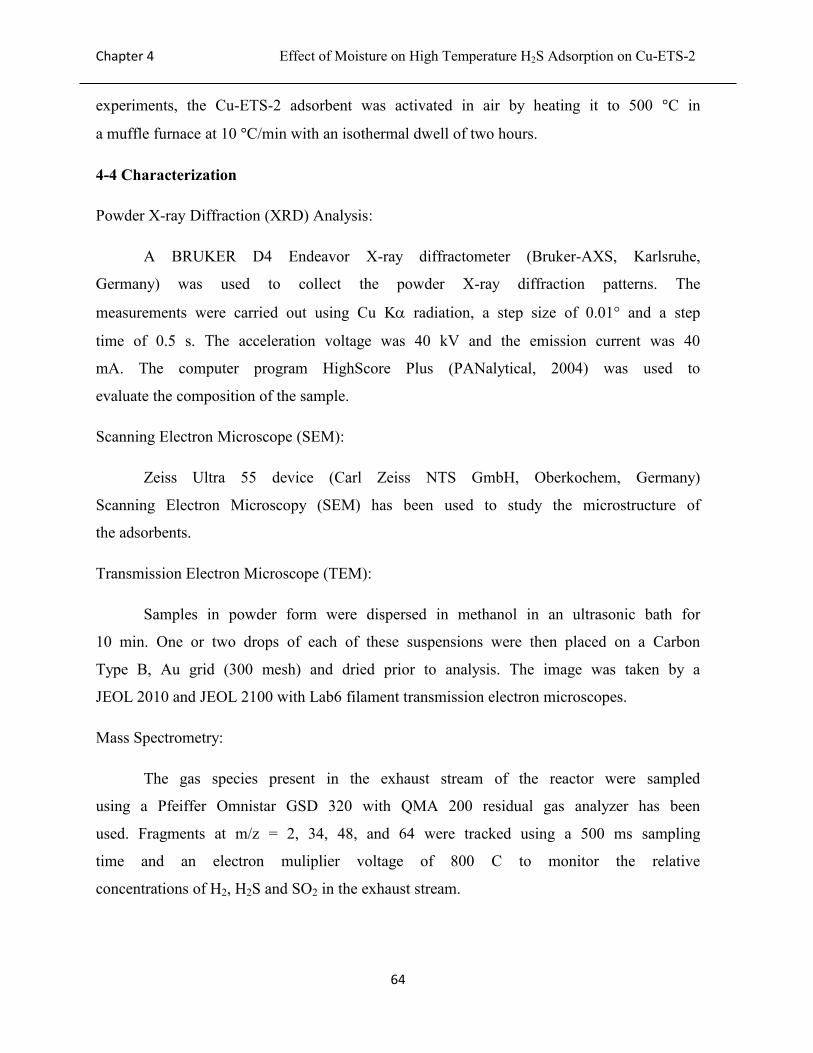
Chapter 4 Effect of Moisture on High Temperature H2S Adsorption on Cu-ETS-2
64
experiments, the Cu-ETS-2 adsorbent was activated in air by heating it to 500 °C in
a muffle furnace at 10 °C/min with an isothermal dwell of two hours.
4-4 Characterization
Powder X-ray Diffraction (XRD) Analysis:
A BRUKER D4 Endeavor X-ray diffractometer (Bruker-AXS, Karlsruhe,
Germany) was used to collect the powder X-ray diffraction patterns. The
measurements were carried out using Cu K radiation, a step size of 0.01° and a step
time of 0.5 s. The acceleration voltage was 40 kV and the emission current was 40
mA. The computer program HighScore Plus (PANalytical, 2004) was used to
evaluate the composition of the sample.
Scanning Electron Microscope (SEM):
Zeiss Ultra 55 device (Carl Zeiss NTS GmbH, Oberkochem, Germany)
Scanning Electron Microscopy (SEM) has been used to study the microstructure of
the adsorbents.
Transmission Electron Microscope (TEM):
Samples in powder form were dispersed in methanol in an ultrasonic bath for
10 min. One or two drops of each of these suspensions were then placed on a Carbon
Type B, Au grid (300 mesh) and dried prior to analysis. The image was taken by a
JEOL 2010 and JEOL 2100 with Lab6 filament transmission electron microscopes.
Mass Spectrometry:
The gas species present in the exhaust stream of the reactor were sampled
using a Pfeiffer Omnistar GSD 320 with QMA 200 residual gas analyzer has been
used. Fragments at m/z = 2, 34, 48, and 64 were tracked using a 500 ms sampling
time and an electron muliplier voltage of 800 C to monitor the relative
concentrations of H2, H2S and SO2 in the exhaust stream.

Chapter 4 Effect of Moisture on High Temperature H2S Adsorption on Cu-ETS-2
65
4-5 Humidification and Reactor Configuration
A Bronkhorst CEM (controlled evaporator mixer) system was used to
humidify the H2S stream. The CEM system uses separate gas flow and a liquid flow
controllers to meter specified amounts of each component into a heated evaporator-
mixer that was maintained at 110 °C. The humid stream exiting the CEM was fed
through a heat-traced tube (similarly maintained at 110 °C) to a quartz tube reactor
placed in an electrically heated furnace. The CEM system can provide both dry and
humidified gas and for the humidified experiments 500 sccm of gas was blended
with 0.052 ml/min of liquid water to generate a stream that was 11 vol% steam. This
water loading corresponds, roughly, to a gas stream at 50 °C and 100% relative
humidity.
Figure 4-1 shows a schematic of the reactor system used in the experiments.
For every run, 0.5 g of adsorbent was packed between two plugs of quartz wool in
the center of an 8 mm (ID) quartz tube. The sample was first equilibrated under 500
sccm helium for 5 minutes before the three-way valve was switched to the start an
equal flow of dilute H2S. The same sequence was used for the humidified
experiments where both He and H2S/He mixtures were humidified to the same level.
The gas stream exiting the adsorbent bed was passed through a condenser to knock
out excess water before being sampled by the quartz capillary connected to the mass
spectrometer to analyze the composition. The H2S concentration was determined at 3
second intervals and the breakthrough point was defined as when the concentration
of H2S exceeded 1% of its maximum concentration. When the concentration of the
gas approached the inlet gas concentration the experiments were stopped.

Chapter 4 Effect of Moisture on High Temperature H2S Adsorption on Cu-ETS-2
66
Figure 4-1. Schematic of the humidification and reactor system.
4-6. Results and Discussions
Figure 4-2 shows a transmission electron micrograph (TEM) of as-
synthesized ETS-2 and scanning electron micrographs (SEM) of ETS-2 and Cu-
ETS-2. As the TEM image in Figure 4-2a shows, each ETS-2 particle is typically 50
to 100nm in length and 20 nm wide. The SEM image in Figure 4-2b demonstrates
that particles tend to form aggregates or clusters. As reported in a previous study,
each cluster is, on average, about 1-2 µm in diameter22
. Figure 4-2c is an SEM
image of the copper-exchanged ETS-2 and this image indicates that, after ion
exchange with the copper solution, the morphology of the material does not change.

Chapter 4 Effect of Moisture on High Temperature H2S Adsorption on Cu-ETS-2
67
(a) (b)
(c)
Figure 4-2. (a) TEM and (b) SEM images of ETS-2 together with (c) SEM image of Cu-ETS-2 showing the
particles cluster size and morphology.
The adsorption experiments were performed both with and without the
presence of water at intervals of 100 °C ranging from 250 ºC to 950 ºC. Fresh
adsorbent was used for each experiment. Figure 4-3 shows typical H2S breakthrough
curves for humid and dry streams at three different temperatures ranging from 350
°C to 750 °C.

Chapter 4 Effect of Moisture on High Temperature H2S Adsorption on Cu-ETS-2
68
Chapter 4 Effect of Moisture on High Temperature H2S Adsorption on Cu-ETS-2
69
Figure 4-3 – Comparison between H2S breakthrough curves for dry and humid stream at (a) 350 °C,
(b) 550 °C and (c) 750 ºC
The curves related to dry H2S adsorption in Figure 4-3 show a progressive
reduction in breakthrough time and the roughly 50% reduction in capacity between
350 and 750 °C has been previously attributed to the thermal dissociation of H2S and
the associated formation of H2, which promotes the reduction of CuO to Cu2O and
elemental copper24
. Under our dynamic adsorption conditions metallic copper is
effectively non-adsorbing and thus does not contribute to the desulfurization
capacity of the adsorbent25
. Under humid conditions there is a measurable loss
(compared to the dry experiments) in H2S capacity at 350 and 500 °C but at 750 °C
the H2S capacity loss was, unexpectedly, almost absolute.
The samples exposed to humid H2S were measured using powder X-ray
diffraction to determine whether the products of reaction are changing with the
introduction of moisture. Figure 4-4 shows the diffraction patterns for samples of
Cu-ETS-2 that had been exposed to dry and humid H2S at 550 and 750 °C. The
measurable loss in H2S capacity seen in the breakthrough profiles at 550 °C is not
Chapter 4 Effect of Moisture on High Temperature H2S Adsorption on Cu-ETS-2
70
accompanied by any change in the crystalline phases present in the sample. At 750
°C, however, the XRD pattern for the sample exposed to humid H2S stream shows a
significant amount of metallic copper present in the sample which is not present in
the control sample exposed to dry H2S. The presence of a large amount of non-
adsorbing, metallic copper in the sample exposed to the humid stream explains the
abrupt loss in adsorption capacity for this sample. The presence of metallic copper in
the sample can only be reasonably explained by the presence of a higher H2
concentration in the feed stream.
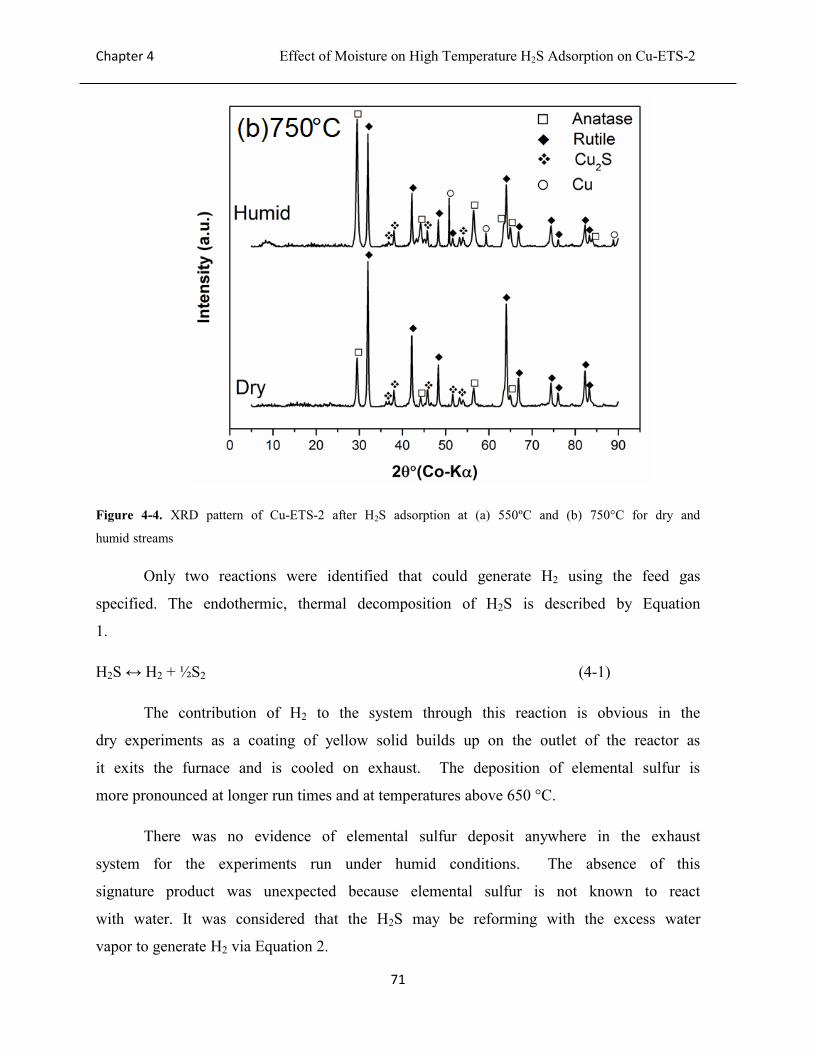
Chapter 4 Effect of Moisture on High Temperature H2S Adsorption on Cu-ETS-2
71
Figure 4-4. XRD pattern of Cu-ETS-2 after H2S adsorption at (a) 550ºC and (b) 750°C for dry and
humid streams
Only two reactions were identified that could generate H2 using the feed gas
specified. The endothermic, thermal decomposition of H2S is described by Equation
1.
H2S ↔ H2 + ½S2 (4-1)
The contribution of H2 to the system through this reaction is obvious in the
dry experiments as a coating of yellow solid builds up on the outlet of the reactor as
it exits the furnace and is cooled on exhaust. The deposition of elemental sulfur is
more pronounced at longer run times and at temperatures above 650 °C.
There was no evidence of elemental sulfur deposit anywhere in the exhaust
system for the experiments run under humid conditions. The absence of this
signature product was unexpected because elemental sulfur is not known to react
with water. It was considered that the H2S may be reforming with the excess water
vapor to generate H2 via Equation 2.
Chapter 4 Effect of Moisture on High Temperature H2S Adsorption on Cu-ETS-2
72
H2S + 2H2O ↔ SO2 + 3H2 (4-2)
Since both reactions are endothermic the reactor system was adapted to
sample the gases at high temperature to prevent the reactants from recombining as
the gas cools on exhaust. To study the high temperature gas phase species, the
exhaust system shown in Figure 4-1 was removed and a longer, stainless steel
capillary with a 5 micron ID was mounted to the mass spectrometer. The capillary
was inserted directly into the quartz reactor tube so that the inlet to the capillary for
the mass spectrometer was at the center of the furnace. In addition, the 60 cm long
10 mm OD quartz tube used for the adsorption reaction was replaced with 1.5 m of
0.25” OD, serpentine-folded quartz tubing. The additional length of tubing was
selected to encourage the reactions to reach equilibrium by extending their residence
time in the furnace. The inlet of the mass spectrometer was heated to 150 °C and the
capillary was heated to 200 °C to ensure liquid water did not condense in the
sampling system of the mass spectrometer.
The concentration of H2 as a function of temperature was measured under
both dry and humid conditions by ramping the furnace at 5 °C/min from 200 °C to
800 °C. The furnace was pre-heated to 200 °C to prevent water from condensing
anywhere in the reactor system and the ramp program was started once stable
baseline signals were achieved on the mass spectrometer. The difference in
sensitivity and total system pressure between experiments was accounted for by
dividing the H2S signal for the humid experiment by the H2S signal for the dry
experiment. The H2 signal for the humid experiment was then divided by this ratio.
Both the humid and dry traces were then baseline corrected so that the signal at 200
°C was reduced to zero. The baseline correction is valid, and effectively cosmetic,
because the amount of H2S converted at 200 °C is expected to be below the detection
threshold of the instrument.

Chapter 4 Effect of Moisture on High Temperature H2S Adsorption on Cu-ETS-2
73
Figure 4-5 Standardized and baseline-corrected H2 signal as a function of temperature for humid and
dry 500 ppm H2S in He
Figure 4-5 shows the H2 signal from the mass spectrometer as a function of
temperature for both the humid and dry gas experiments. The trend for the dry
stream in shows a series of inflections; the first at about 400 °C and again at about
600 °C before the H2 concentration trends steadily upward above 750 °C. This
behavior is not characteristic of an endothermic reaction where a steady exponential
trend is expected as a function of temperature. The lack of uniformity in the H2
profile for the dry experiment could be due to a combination of instrument
sensitivity and, potentially, adsorption/desorption effects on the stainless steel
capillary. The trend for the humid experiment, however, is more uniform and shows
the expected profile for an endothermic reaction. The cause of the difference in the
uniformity of the trends is not entirely clear though the water vapor is expected to
provide a passivating influence on the steel capillary.
The trends for the humid and dry streams diverge between 500 and 600 °C
where the H2 signal for the humid experiment consistently exceeds that of the dry
experiment. At 800 °C the H2 signal for the humid experiment is 2.5 times greater
than that for the dry experiment. The mass spectrometry data can be considered, at

Chapter 4 Effect of Moisture on High Temperature H2S Adsorption on Cu-ETS-2
74
best, semi-quantitative due to the challenges associated with maintaining the high
temperature equilibrium conditions for the gases sampled from the reactor. The
trends seen in Figure 4-5 do, however, clearly indicate the presence of larger
amounts of H2 in the humid stream, particularly at the highest temperatures.
The breakthrough data in Figure 4-3 demonstrated that the presence of water
vapor had no effect on the H2S capacity of Cu-ETS-2 at 350 °C, caused a modest
reduction in capacity at temperatures around 550 °C, and caused a virtually complete
reduction in capacity at 750 °C. The data in Figure 4-5 coupled with the XRD data in
Figure 4-4 suggest the explanation for this trend lies in an increase in H2
concentration and the associated reduction of copper oxide to copper metal brought
about by the presence of a greater amount of H2 in the feed stream.
The mechanism for the increase in H2 concentration was probed by looking
at the SO2 signal. If H2S is, indeed, reforming with water then the concentration of
SO2 should increase as the H2 concentration increases. In fact, the SO2 trend (not
shown) for both the dry and humid experiments as a function of temperature is
largely the same and shows no obvious trend except for a slight tapering reduction as
the temperature increases. The signals at m/z = 48 and 64 were compared to see if
the partial oxidation of sulfur was perhaps contributing in some way but the trend for
both fragments was identical. While it remains possible that H2 and SO2 might
combine in the capillary to reform H2O and H2S, the indications from the
experiments suggest that the generation of additional H2 is not associated with SO2
formation. As a result H2 generation via Equation 2 is an unlikely route to explain
the virtually complete reduction of copper at 750 °C under humid conditions.
The thermal cracking reaction described by Equation 1 is not facile and a
residence time of even 2 seconds is insufficient to approach equilibrium at
temperatures below 1000 °C26
. Using a flow rate of 500 ml/min, our serpentine
reactor allowed even shorter residence times; about 1.5 seconds at 200 °C and
dropping to about 650 ms at 850 °C. The short contact time afforded by our reactor
implies that the thermal cracking reaction described by Equation 1 is certainly far
from equilibrium. Accepting that H2 is the only reactant in our system capable of

Chapter 4 Effect of Moisture on High Temperature H2S Adsorption on Cu-ETS-2
75
reducing copper oxide to elemental copper - coupled with the observation SO2 is not
apparently a product of reaction - it remains that Equation 1 is likely the sole source
of the H2 in the system. Though speculative, and only partially supported by the
data, it appears that the presence of moisture may promote the thermal cracking
reaction by providing a diluting effect on the products in much the same way that it
does during an ethane cracking reaction27
.
4-7. Conclusions
The presence of water vapor in an inert gas stream containing 500 ppm H2S
promotes the reduction of copper on the surface of Cu-ETS-2. The influence of
moisture is most clearly seen in the breakthrough experiments carried out at
temperatures above 750 °C where the presence of moisture virtually eliminates the
H2S capacity for the adsorbent and the XRD for the reacted sample shows the
presence of elemental copper on the surface. Though the mechanism remains
somewhat ambiguous, the H2 responsible for reducing the copper appears to come,
not from the direct reaction of H2S and H2O, but through an apparent enhancement
in the degree of thermal cracking of the H2S.
4-8- Acknowledgements
Financial support from the Initiative and Networking Fund of the Helmholtz
Association (HGF) through the Helmholtz-Alberta Initiative is kindly
acknowledged.
Chapter 4 Effect of Moisture on High Temperature H2S Adsorption on Cu-ETS-2
76
4-9 References
(1) Stirling, D., The sulfur problem: cleaning up industrial feedstocks. Royal
Society of Chemistry: 2000.
(2) Boon, J.; van Dijk, E.; Pirgon-Galin, Ö.; Haije, W.; van den Brink, R.,
Water–gas shift kinetics over FeCr-based catalyst: effect of hydrogen sulphide.
Catal. Lett. 2009, 131, (3-4), 406-412.
(3) Cal, M.; Strickler, B.; Lizzio, A., High temperature hydrogen sulfide
adsorption on activated carbon: I. Effects of gas composition and metal addition.
Carbon 2000, 38, (13), 1757-1765.
(4) Hass, R. H.; Hansford, R. C.; Hennig, H., Catalytic incineration of hydrogen
sulfide from gas streams. In Google Patents: 1978.
(5) Ko, T.-H.; Chu, H.; Chaung, L.-K., The sorption of hydrogen sulfide from
hot syngas by metal oxides over supports. Chemosphere 2005, 58, (4), 467-474.
(6) Yumura, M.; Furimsky, E., Comparison of calcium oxide, zinc oxide, and
iron (III) oxide hydrogen sulfide adsorbents at high temperatures. Ind. Eng. Chem.
Proc. D. D. 1985, 24, (4), 1165-1168.
(7) Abbasian, J. Development of novel copper-based sorbents for hot-gas
cleanup; Institute of Gas Technology, Chicago, IL (United States): 1991.
(8) Tamhankar, S.; Garimella, S.; Wen, C., Kinetic study on the reactions
involved in hot gas desulfurization using a regenerable iron oxide sorbent—III.
Reactions of the sulfided sorbent with steam and steam-air mixtures. Chem. Eng.
Sci. 1985, 40, (6), 1019-1025.
(9) Rosso, I.; Galletti, C.; Bizzi, M.; Saracco, G.; Specchia, V., Zinc oxide
sorbents for the removal of hydrogen sulfide from syngas. Ind. Eng. Chem. Res.
2003, 42, (8), 1688-1697.
(10) Lew, S.; Jothimurugesan, K.; Flytzani-Stephanopoulos, M., High-
temperature hydrogen sulfide removal from fuel gases by regenerable zinc oxide-
titanium dioxide sorbents. Ind. Eng. Chem. Res. 1989, 28, (5), 535-541.
(11) Patrick, V.; Gavalas, G. R.; Flytzani-Stephanopoulos, M.; Jothimurugesan,
K., High-temperature sulfidation-regeneration of copper (II) oxide-alumina sorbents.
Ind. Eng. Chem. Res. 1989, 28, (7), 931-940.

Chapter 4 Effect of Moisture on High Temperature H2S Adsorption on Cu-ETS-2
77
(12) Slimane, R. B.; Abbasian, J., Copper-based sorbents for coal gas
desulfurization at moderate temperatures. Ind. Eng. Chem. Res. 2000, 39, (5), 1338-
1344.
(13) Kyotani, T.; Kawashima, H.; Tomita, A.; Palmer, A.; Furimsky, E., Removal
of H 2 S from hot gas in the presence of Cu-containing sorbents. Fuel 1989, 68, (1),
74-79.
(14) Yasyerli, S.; Dogu, G.; Ar, I.; Dogu, T., Activities of copper oxide and Cu-V
and Cu-Mo mixed oxides for H2S removal in the presence and absence of hydrogen
and predictions of a deactivation model. Ind. Eng. Chem. Res. 2001, 40, (23), 5206-
5214.
(15) Sick, G.; Schwerdtfeger, K., Hot desulfurization of coal gas with copper.
Metall. Trans. B 1987, 18, (3), 603-609.
(16) Flytzani-Stephanopoulos, M.; Gavalas, G. R.; Tamhankar, S. S.; Center, U.
S. D. o. E. M. E. T.; Laboratory, J. P., Novel Sorbents for High Temperature
Regenerative H2S Removal. United States Department of Energy: 1984.
(17) Li, Z.; Flytzani-Stephanopoulos, M., Cu-Cr-O and Cu-Ce-O regenerable
oxide sorbents for hot gas desulfurization. Ind. Eng. Chem. Res. 1997, 36, (1), 187-
196.
(18) Reddy, G. K.; Smirniotis, P. G., Chapter 1 - Introduction About WGS
Reaction. In Water Gas Shift Reaction, Smirniotis, G. K. R. G., Ed. Elsevier:
Amsterdam, 2015; pp 1-20.
(19) Huang, C.-C.; Chen, C.-H.; Chu, S.-M., Effect of moisture on H 2 S
adsorption by copper impregnated activated carbon. J. Hazard. Mater. 2006, 136,
(3), 866-873.
(20) Yazdanbakhsh, F.; Blasing, M.; Sawada, J. A.; Rezaei, S.; Müller, M.;
Baumann, S.; Kuznicki, S. M., Copper exchanged nanotitanate for high temperature
H2S adsorption. Ind. Eng. Chem. Res. 2014, 53, (29), 11734-11739.
(21) Kuznicki, S. M., Large-pored crystalline titanium molecular sieve zeolites. In
Google Patents: 1989.
(22) Tanchuk, B.; Sawada, J. A.; Kuznicki, S. M., Amine‐functionalization of
the nanotitanate ETS‐2. AIChE J. 2013, 59, (12), 4727-4734.
Chapter 4 Effect of Moisture on High Temperature H2S Adsorption on Cu-ETS-2
78
(23) Prakash, A., On the effects of syngas composition and water-gas-shift
reaction rate on FT synthesis over iron based catalyst in a slurry reactor. Chem.
Eng.Commun. 1994, 128, (1), 143-158.
(24) Yazdanbakhsh, F. A., M.; Sawada, J.A.; Kuznicki, Cu–Cr–O Functionalized
ETS-2 Nanoparticles for Hot Gas Desulfurization. J. Nanosci. Nanotechnol. 15.
(25) Alonso, L.; Palacios, J. M.; Garcıa, E.; Moliner, R., Characterization of Mn
and Cu oxides as regenerable sorbents for hot coal gas desulfurization. Fuel Proc.
Tech. 2000, 62, (1), 31-44.
(26) Karan, K.; Mehrotra, A. K.; Behie, L. A., On reaction kinetics for the thermal
decomposition of hydrogen sulfide. AIChE J. 1999, 45, (2), 383-389.
(27) Ranjan, P.; Kannan, P.; Al Shoaibi, A.; Srinivasakannan, C., Modeling of
Ethane Thermal Cracking Kinetics in a Pyrocracker. Chem. Eng. Tech. 2012, 35, (6),
1093-1097.

79
Chapter 5
Cu-ETS-2 Regeneration

Chapter 5 Cu-ETS-2 Regeneration
80
5-1 Introduction
In the previous chapters the reaction between Cu-ETS2 and H2S was discussed in
detail. In summary, CuO is consumed during adsorption to produce Cu2S. This step
can function as a stand alone unit, however due to economic reasons it is preferred to
avoid disposing of consumed adsorbent and replacing it with fresh materials.
A regeneration process is complementary to the adsorption process and can oxidize
Cu2S back to CuO. During this process SO2 is generated, which can also be further
oxidized to SO3. The generated SO3 can in turn be used to produce sulfuric acid1.
The objective of the experiments presented in this chapter is to investigate the ability
of Cu-ETS2 to be regenerated and present the reactions that can occur during the
oxidation of copper sulfide. The result presented in this chapter together with the
detailed understanding of copper oxide sulfidation presented in the previous chapters
can be used to enable an optimal design of an adsorption/regeneration process for
H2S separation.
The concept of copper sulfide oxidation has been widely investigated due to its use
in refining naturally occurring copper sulfides. It has been found that during
oxidation, CuS is first converted into Cu2S and generates elemental (gaseous)
sulfur2. The formed Cu2S is then oxidized further into Cu2O and eventually into
CuO. At temperatures above 663 °C CuO was the only observed final product; at
temperatures below 663 °C copper sulfate was also found.
Lewis et al.3 studied the oxidation of Cu2S (powder with a particle size between
0.149 -0.074 mm) in both air and in pure oxygen at temperatures between 250 and
700 °C. The main objective of the study was to determine the amount of water
soluble components formed. They found the optimum temperature for the formation
of water soluble copper components (CuSO4) to be 450 °C, when using air or
oxygen as the reaction gas. When using pure oxygen as oxidizing agent only 8% of
the Cu2S was converted into water soluble copper components.

Chapter 5 Cu-ETS-2 Regeneration
81
In a study conducted by Ganguly and Mukherjee4, it was found that once CuS is
subject to oxidation, the first step in the overall reaction is the decomposition of CuS
to Cu2S and elemental sulfur. The formed elemental sulfur immediately reacts with
oxygen to form SO2.
Asaki et al.5 studied the oxidation of a pellet of Cu2S at atmospheric pressure, under
various temperatures and oxygen concentrations. The reaction temperature was
varied between 750 and 850 °C. The oxygen concentration was varied between 5
and 20 vol%. They used pellets with an approximate diameter of 6 mm. The
oxidation of Cu2S appeared to be a two stage process. First Cu2S was oxidized to
Cu2O, which was then oxidized further to CuO. The results were supported by the
intersection of a partly oxidized pellet. This pellet showed a layered structure with
the core being unreacted Cu2S, the inner layer being Cu2O, and the outer layer
consisting of CuO. Under the experimental conditions the rate of the reaction was
determined by the gas phase mass transfer resistance. As the reaction proceeded,
diffusion through the product layer was assumed to become rate determining. At a
temperature of 850 °C the pellets were partially melted due to the exothermic
reaction. The time needed for complete conversion of a single pellet of Cu2S to CuO
was estimated to be 3 hours.
Shah and Khalafallah6 studied the oxidation of covellite, CuS, in detail to determine
the sequence of reactions and intermediate phases during its roasting. They studied
the reaction under different conditions using DTA (differential thermal analysis),
TGA, and XRD of the reaction products. They reported that tenorite, CuO, and
dolerophenite, CuO.CuSO4, form prior to the formation of the copper sulfate phase
and that they are physically located below the CuSO4 layer. Their proposed sequence
was7:
CuS → Cu9S5 → Cu2O → CuO.CuSO4 → CuSO4 → CuO.CuSO4 → CuO

Chapter 5 Cu-ETS-2 Regeneration
82
5-1-1 Thermodynamics
Figure 5-1 shows the phase diagram of Cu-S-O system as a function of oxygen and
sulfur dioxide partial pressures at 727 °C plotted using the thermodynamic data
given by Brian8.
Figure 5-1- Phase diagram of Cu-S-O system at 727°C
As Figure 5-1 indicates, CuO is the most stable component when a copper- sulfur
component is brought in contact at 727°C with partial pressure of O2 being more
than 10-4
and a partial pressure of SO2 less than 10-2
. As Figure 5-1 shows higher
partial pressures of oxygen and lower partial pressures of SO2 favor formation of
CuO.
Chapter 5 Cu-ETS-2 Regeneration
83
Considering the aim of this study to be the first investigation on the ability of Cu-
ETS-2 to be regenerated, oxygen was used as the oxidizing agent for our
experiments instead of air, which is commonly used in industries. Having negligible
amount of SO2 in the feed also ensures formation of CuO after the regeneration
process and enables us to have a better understanding of the regeneration behavior of
Cu-ETS-2.
5-2 Materials preparation:
ETS2 was prepared according to the same procedure described in chapters 1- 4 and
later ion exchanged with copper nitrate solution. During ion exchange, the weight
proportion of ETS-2 to copper salt to water was 1:2:100. The mixture was kept at
80°C and stirred for 1 day. Copper exchanged ETS-2 was later filtered and washed
extensively with deionized water and dried in a vacuum oven at 60°C overnight.
Prior to adsorption experiments, the adsorbent was activated by heating at 500°C
under static air flow in a furnace for two hours.
5-3 Characterization
Powder X-ray Diffraction (XRD) Analysis
The crystalline structures of the adsorbents were examined by XRD measurements
using a Rigaku Geigerflex model 2173 diffractometer equipped with a cobalt (λ =
1.790 21 Å) rotating anode source and a graphite monochromator for filtering the
Kbeta wavelengths.
Mass spectrometry
The gas species present in the exhaust stream of the reactor were sampled using a
Pfeiffer Omnistar GSD 320 with QMA 200 residual gas analyzer. Different gas
fragments were tracked using a one second sampling time to monitor the relative
concentrations of H2S and SO2 in the exhaust stream.
Scanning Electron Microscope (SEM):

Chapter 5 Cu-ETS-2 Regeneration
84
Zeiss Ultra 55 device (Carl Zeiss NTS GmbH, Oberkochem, Germany)
scanning electron microscopy (SEM) has been used to study the microstructure of
the adsorbents.
5-4 Experimental setup
The experiments were performed in the same setup used in the previous experiments
and described in previous chapters. For every run, 0.5 g of adsorbent was packed in
the center of an 8 mm (ID) quartz tube between two plugs of quartz wool.
The setup was equipped with an oxygen stream and a three way valve to switch
between a He-H2S stream for adsorption and O2 for oxidation cycles. Figure 5-2
shows a schematic of the reactor system used in the experiments.
Figure 5-2- Schematic diagram of the experimental setup
5-5 Results and discussion
The adsorbent was tested for several adsorption and regeneration cycles at 350, 550,
750 and 950°C.
A typical adsorption breakthrough curve for adsorption experiment is presented in
Figure 5-3. The inlet concentration of 470 ppmv H2S is effectively removed by the
adsorbent as the concentration of H2S in the outlet is maintained below the detection
limit of the instrument. As time passes, the H2S concentration rises above the
baseline and the curve inflects as H2S “breaks though”. The concentration rises

Chapter 5 Cu-ETS-2 Regeneration
85
rapidly after breakthrough as a result of the adsorbent becoming saturated and
having fewer sites which can react with H2S.
As the figure shows, the adsorbent shows almost the same breakthrough time for
different adsorption cycles. During adsorption CuO reacts with H2S to from Cu2S
and SO2 as per reaction 19.
6CuO + 4H2S → 3Cu2S + 4 H2O + SO2 (5-1)
Reaction (1) is the overall reaction of four sub reactions (2-6) (7):
4CuO + H2S → 2Cu2O + SO2 + H2 (5-2)
2Cu2O + 2H2S → 2 Cu2S + 2H2O (5-3)
Hydrogen generated in reaction (1) can further react with CuO to reduce it to Cu2O.
Cu2O later react with H2S to form Cu2S:
2CuO + H2 →Cu2O +H2O (5-4)
Cu2O + H2S → Cu2S + H2O (5-5)

Chapter 5 Cu-ETS-2 Regeneration
86
Figure 5-3 – Typical adsorption breakthrough curves for multiple adsorption cycles on Cu-ETS-2. (the presented
data are for experiments at 550 °C)
Figure 5-4 shows the breakthrough times for adsorption experiments at different
temperatures and different adsorption cycles. It is worth mentioning that
breakthrough time has been chosen to be the time in which H2S concentration in the
exit reaches 10% of the amount in the feed stream.
0
0.1
0.2
0.3
0.4
0.5
0.6
0 10 20 30 40 50 60 70 80 90 100
C H
2S o
ut/
C H
2Sin
Time (min)
1st 2nd 3rd 4th

Chapter 5 Cu-ETS-2 Regeneration
87
Figure 5-4 - Breakthrough times (in minutes) for different adsorption cycles at different temperatures
As Figure 5-4 shows, average adsorption breakthrough times are in agreement with
the results for the previous experiments presented in chapter 1 with the reduction of
breakthrough time to almost a half after 750°C. In this section and unlike chapter 1,
the results are presented in breakthrough time instead of adsorption capacity because
we developed a better understanding on the adsorption capacity and H2S stability at
higher temperatures compared to chapter 1. For 350, 550 and 950°C experiments,
the adsorbent underwent 4 adsorption and 3 regeneration processes. Terminating the
experiments with an adsorption cycle enabled us to investigate the morphology and
surface chemistry of the adsorbent after desulfurization. At 750°C, the experiments
were terminated by an oxidation (regeneration) step in order to investigate the
adsorbent after consumption by H2S.
During oxidation (regeneration) process, copper sulfide reacts with oxygen to form
copper oxide and sulfur dioxide. The reaction happens in two steps. Oxidation of
copper sulfide to Cu2O and then further oxidation of Cu2O to CuO:
Cu2S + 3/2 O2 → Cu2O+SO2 (5-6)
0
10
20
30
40
50
60
70
80
90
350 550 750 950
Bre
akth
rou
gh t
ime
(min
)
Experiment Temperature (°C)
1st 2nd 3rd 4th

Chapter 5 Cu-ETS-2 Regeneration
88
Cu2O + 1/2 O2 → 2 CuO (5-7)
Figure 5-5 shows a typical SO2 concentration change versus time during the
oxidation process at different oxidation cycles. As the figure shows, a considerable
amount of SO2 is generated at the very early stages of the oxidation process,
indicating a fast reaction rate. Having considerable higher superficial feed gas
velocity in the tube at higher temperatures, results in a different SO2 profile for low
and high temperature experiments. Figures 5-5-A and 5-5-B show SO2 concentration
changes at 350 and 950°C respectively. As Figure 5-5-A show, SO2 concentration
increases as the oxidation reaction proceeds and after a few minutes, plateaus before
decaying to almost zero at 350°C while at 950°C, the maximum is observed almost
instantaneously in the beginning of the process followed by a decay to zero.
(A)
(B)
Figure 5-5 – Change in SO2 concentration in the exit at (A) 350 and (B) 950 °C
0
0.2
0.4
0.6
0.8
1
1.2
0 5 10 15 20 25 30
C S
O2
/ C
SO2
max
Time (min)
1st 2nd 3rd
0
0.2
0.4
0.6
0.8
1
1.2
0 5 10 15 20 25 30
CSO
2/ C
SO2
max
Time (min)
1st 2nd 3rd

Chapter 5 Cu-ETS-2 Regeneration
89
As reported in the literature (3), other products can also be formed during the
oxidation process such as CuO.CuSO4. It is formed through the reaction of SO2
produced by reaction (6) with Cu2O and oxygen:
Cu2O + 1/2 O2 + SO2 → CuO.CuSO4 (5-8)
Since CuO.CuSO4 is stable between 450 and 600 °C (10), it is expected to be
present on the adsorbent for oxidation processes of 350 and 550°C resulting in lower
adsorption capacities for the 2nd
, 3rd
and 4th
cycles. However as Figure 5-4 shows,
adsorption breakthrough times are almost constant for all four cycles and no decline
is observed.
In order to understand the reason behind a rather constant adsorption breakthrough
time, XRD analysis was performed on the samples. The results revealed an
interesting phase change in the adsorbent. As reported in chapter 1, the TiO2 in
ETS-2 is in the form of anatase. However once it is heated above 700°C, it
transforms into rutile. The results of XRD analysis for the sample regenerated at
350°C is presented in Figure 5-6. As the figure shows, the only detectable phase on
the sample other than Cu2S is TiO2 in the form of rutile.
Figure 5-6 – XRD analysis of the adsorbent after 4 adsorption and 3 oxidation cycles at 350°C

Chapter 5 Cu-ETS-2 Regeneration
90
The presence of rutile indicates that the heat of the exothermic oxidation reactions
(reactions 6 and 7) are so high than the adsorbent heats up to at least 700°C.
Massive heat generation during the oxidation process and exceeding temperatures
above 700°C was discovered to be the reason behind having no CuO.CuSO4 at the
end of the oxidation process and as a result formation of fresh adsorbent at the end
of each oxidation cycle.
5-5-1 Thermodynamic simulation
To investigate the adiabatic reaction temperature and also possible phases that can
formed during regeneration, FactSage® thermodynamics software was used to model
the process. The same amount of sorbent, gas concentration and temperature range
used in the experiments was used as inputs for the simulation. The software uses an
incremental Gibbs free energy minimization algorithm to calculate the stability of
solid and gas species in the presence of a constant flow of a specified gas stream.
The results of each step are then used to calculate the next stage until equilibrium in
the solid composition is obtained. Figure 5-7 shows the change in the solid phases
(in mol) during oxidation process versus the amount of oxygen (in mmol).
Figure 5- 7 – change in solid phases versus the amount of oxygen entering the system for oxidation process at
350°C
As the figure shows, once oxygen is in contact with Cu2S, it oxidizes and forms
Cu2O as per reaction 6. Cu2O further reacts with oxygen and forms CuO as per
0
0.2
0.4
0.6
0.8
1
1.2
1.4
1.6
0 0.2 0.4 0.6 0.8 1 1.2 1.4 1.6 1.8 2
mm
ol
mmol Oxygen
CuO Cu2O Cu2S
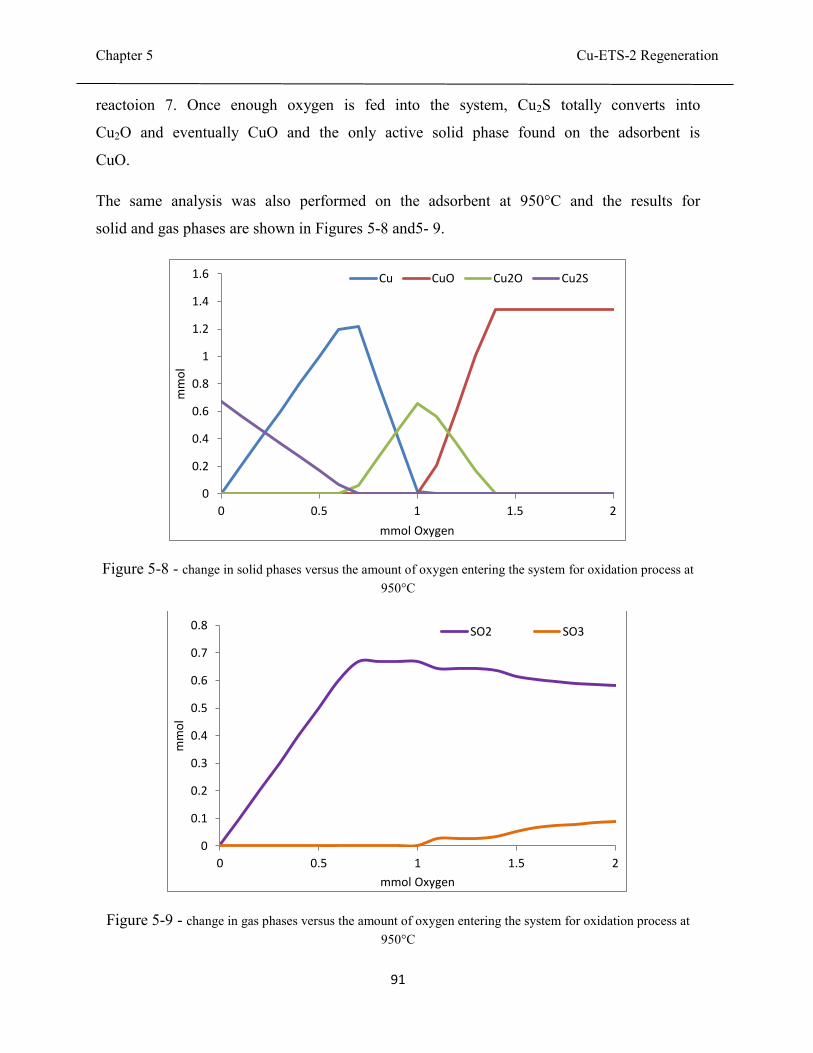
Chapter 5 Cu-ETS-2 Regeneration
91
reactoion 7. Once enough oxygen is fed into the system, Cu2S totally converts into
Cu2O and eventually CuO and the only active solid phase found on the adsorbent is
CuO.
The same analysis was also performed on the adsorbent at 950°C and the results for
solid and gas phases are shown in Figures 5-8 and5- 9.
Figure 5-8 - change in solid phases versus the amount of oxygen entering the system for oxidation process at
950°C
Figure 5-9 - change in gas phases versus the amount of oxygen entering the system for oxidation process at
950°C
0
0.2
0.4
0.6
0.8
1
1.2
1.4
1.6
0 0.5 1 1.5 2
mm
ol
mmol Oxygen
Cu CuO Cu2O Cu2S
0
0.1
0.2
0.3
0.4
0.5
0.6
0.7
0.8
0 0.5 1 1.5 2
mm
ol
mmol Oxygen
SO2 SO3

Chapter 5 Cu-ETS-2 Regeneration
92
Interestingly at 950°C, thermodynamic simulations indicate that Cu2S reduces to
elemental copper at the early stages of oxidation and later oxidizes to Cu2O and
eventually CuO in the presence of oxygen. The reason behind initial formation of
elemental copper in believed to be the massive heat generated through the early
stages of the oxidation reaction at 950°C. Also, according to Figure 5-9 and as
reported in the literature1, the SO2 generated by reaction (6) partially oxidizes and
forms SO3.
5-5-2 Adiabatic reaction temperature
The result of the simulation on adiabatic reaction temperature for oxidation at 350°C
is presented in Figure 5-10. As the figure shows, the temperature of the system can
increase up to 1100°C (assuming adiabatic process) in the early stages of oxidation
and cools down to the furnace temperature over time.
Figure 5-10 – Temperature profile in Cu2S – O2 system versus the amount of oxygen fed into the system for Cu-
ETS-2 oxidation at 350°C assuming an adiabatic system
0
200
400
600
800
1000
1200
0 0.05 0.1 0.15 0.2
Tem
per
atu
re (
°C)
mmol O2
Temperature(°C)
Chapter 5 Cu-ETS-2 Regeneration
93
Due to the high temperature of the system, CuO.CuSO4 that could possibly form
during oxidation at constant temperature of 450 °C decomposes and forms CuO and
SO3:
CuO.CuSO4 → 2 CuO + SO3 (5-9)
At the highest experiment temperature of 950°C, an enormous amount of heat can be
generated by reactions 6 and 7. Adiabatic simulation of the process predicts the
temperature can reach temperatures as high as 2200°C. However, due to the flow of
the gas over the adsorbent and higher rates of heat transfer at elevated temperatures,
the system will probably not see such high temperatures and stays below TiO2’s
melting point of 1843°C. However, SEM analysis suggests that elemental copper
formed at the early stages of oxidation (Figure 5-8) has possibly been in liquid state
during oxidation.
5-5-3 SEM/ EDX analysis
SEM analysis:
In order to investigate the effect of heat of the oxidation reaction and to understand
the surface chemistry of the adsorbent SEM/ EDX analysis was also performed on
the adsorbent. As mentioned in section 5-5 at 350, 550 and 950°C the process was
terminated with an adsorbent cycle and at 750°C, the final process was chosen to be
an oxidation process in order to enable us to study the properties of the adsorbent
after the adsorption and the oxidation process.
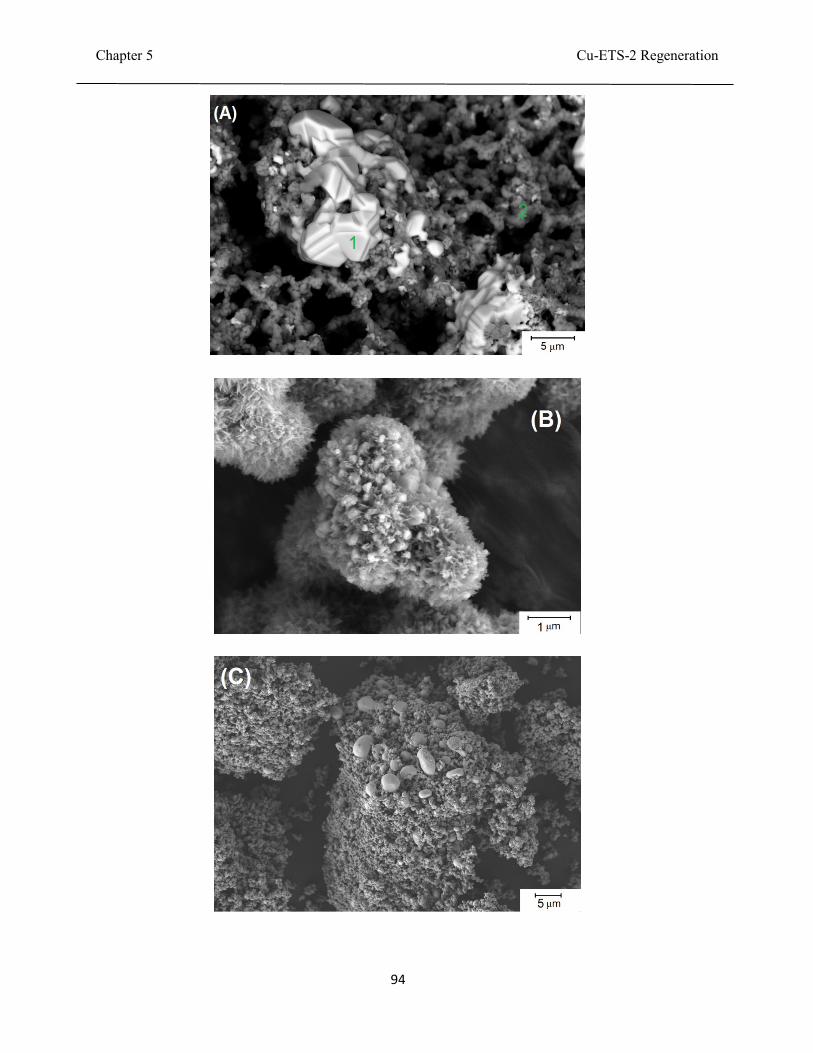
Chapter 5 Cu-ETS-2 Regeneration
94
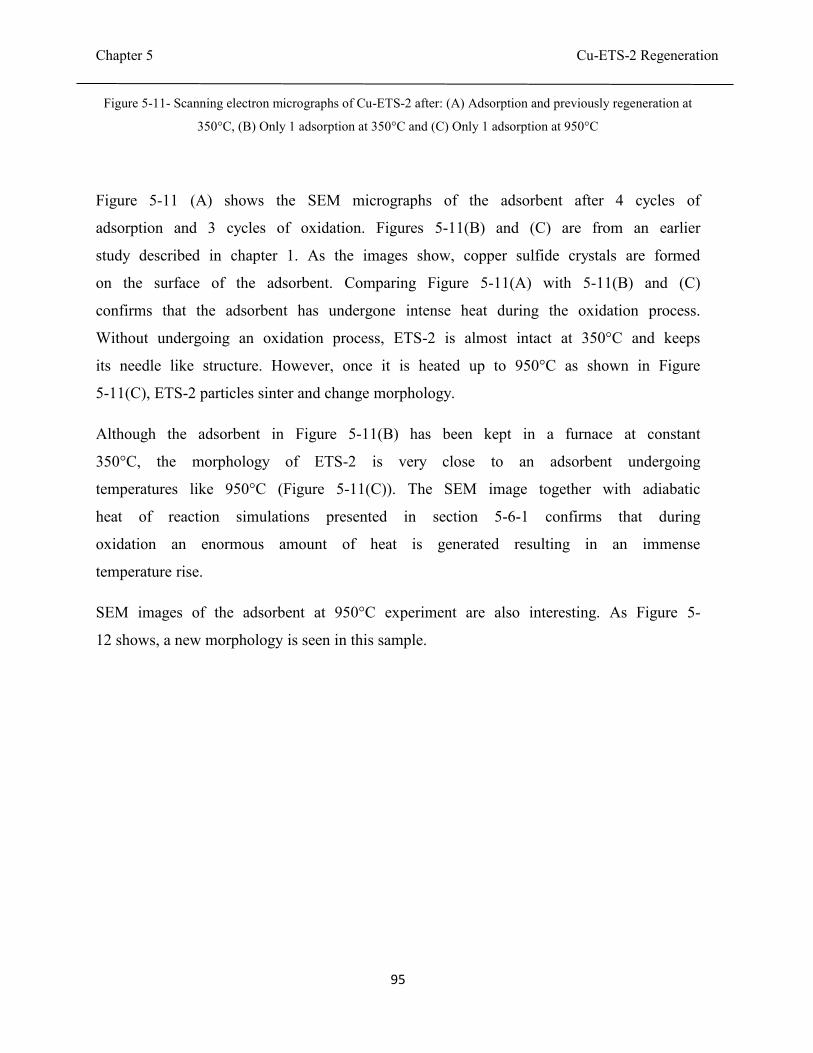
Chapter 5 Cu-ETS-2 Regeneration
95
Figure 5-11- Scanning electron micrographs of Cu-ETS-2 after: (A) Adsorption and previously regeneration at
350°C, (B) Only 1 adsorption at 350°C and (C) Only 1 adsorption at 950°C
Figure 5-11 (A) shows the SEM micrographs of the adsorbent after 4 cycles of
adsorption and 3 cycles of oxidation. Figures 5-11(B) and (C) are from an earlier
study described in chapter 1. As the images show, copper sulfide crystals are formed
on the surface of the adsorbent. Comparing Figure 5-11(A) with 5-11(B) and (C)
confirms that the adsorbent has undergone intense heat during the oxidation process.
Without undergoing an oxidation process, ETS-2 is almost intact at 350°C and keeps
its needle like structure. However, once it is heated up to 950°C as shown in Figure
5-11(C), ETS-2 particles sinter and change morphology.
Although the adsorbent in Figure 5-11(B) has been kept in a furnace at constant
350°C, the morphology of ETS-2 is very close to an adsorbent undergoing
temperatures like 950°C (Figure 5-11(C)). The SEM image together with adiabatic
heat of reaction simulations presented in section 5-6-1 confirms that during
oxidation an enormous amount of heat is generated resulting in an immense
temperature rise.
SEM images of the adsorbent at 950°C experiment are also interesting. As Figure 5-
12 shows, a new morphology is seen in this sample.

Chapter 5 Cu-ETS-2 Regeneration
96
Figure 5-12 – Scanning electron micrographs of Cu-ETS-2 after adsorption and previous oxidation at 950°C
Big, needle like particles seen in Figure 5-12 are most probably formed due to
recrystallization of TiO2 particles present in ETS-2 at very high temperatures
because ETS-2 particles are on the average 100nm in length; however, these
particles are almost 5 μm each. The exact nature of the needle like phases are not

Chapter 5 Cu-ETS-2 Regeneration
97
clear to us; however, we had previously seen formation of such phases in Cu-Cr-
ETS-2 (chapter 2) experiments at 1100°C.
Figure 5-13 – Needle like phases observed in a previous study after adsorption of H2S on Cu-Cr-ETS-2 at
1100°C
EDX analysis
In order to further investigate the nature of the phases formed on the adsorbent at
different temperatures, energy-dispersive X-ray spectroscopy was performed on the
samples.
Different regions in Figures 5-11-A and 5-12-A are marked with numbers. Tables 5-
1 and 5-2 show the composition of the phases mentioned in both images.
Table 5-1 – EDX analysis results for the selected points on Figure 5-11-A. (All data are in atomic%)
Point 1
Cu Ti Si S O
60.32 4.44 0.67 29.20 5.37
Point 2
Cu Ti Si S O
0.69 20.19 5.17 0.44 73.51
Table 5-2 – EDX analysis results for the selected points on Figure 5-12-A. (All data are in atomic%)

Chapter 5 Cu-ETS-2 Regeneration
98
Point 1
Cu Ti Si S O
20.27 0.68 0.26 16.58 62.22
Point 2
Cu Ti Si S O
67.72 1.28 1.79 10.72 17.07
Point 3
Cu Ti Si S O
2.81 46.07 2.26 4.13 44.74
As the data show, in Figure 5-11-A, the brighter phase (point 1) is copper sulfide
(with atomic ratio of Cu:S being 2) and the darker phase being ETS-2. However in
Figure 5-12-A, there are three major phases. Phase 1 being the needle like phase
mostly containing copper, oxygen and sulfur. Phase 2 mostly consists of the reduced
elemental copper formed during adsorption in the presence of hydrogen and phase 3
is the sintered ETS-2 particles with a little copper sulfide formed on the surface.
As mentioned earlier, the needle like structures formed on Cu-ETS-2 after
adsorption and regeneration at 950°C had previously been observed during Cu-Cr-
ETS-2 experiments at 1100°C. The nature of the needle like phase seems to be the
same in both experiments as they present almost the same EDX pattern. We believe
that at very high temperatures, TiO2 and CuO might form a copper titanate. Figures
5-14 and 5-15 show an SEM image of the needle line structure in Cu-Cr-ETS-2
experiments together with the EDX pattern showing a qualitative elemental
composition of the selected phase. As Figure 5-15 shows, similar to the composition
of the needle like structure in Figure 5-12, the needle like phase formed at Cu-Cr-
ETS-2 experiments mostly consists of Cu, O and S.

Chapter 5 Cu-ETS-2 Regeneration
99
Figure 5-14 – Needle like structures formed at Cu-Cr-ETS-2 experiments at 1100°C
Figure 5-15 – EDX analysis for Cu-Cr-ETS2 at 1100°C
5-5-4 H2S Thermal Dissociation and Adsorption Capacity
H2S thermal dissociation
In chapters 1 and 2 we discussed the effect of thermal dissociation of H2S on
generation of hydrogen and consequently reduction of CuO to Cu2O and Cu.
However, adsorption capacity results that are presented in chapters 1 and 2 are based
on the presence of 500ppm H2S in the feed gas. In order to measure the exact
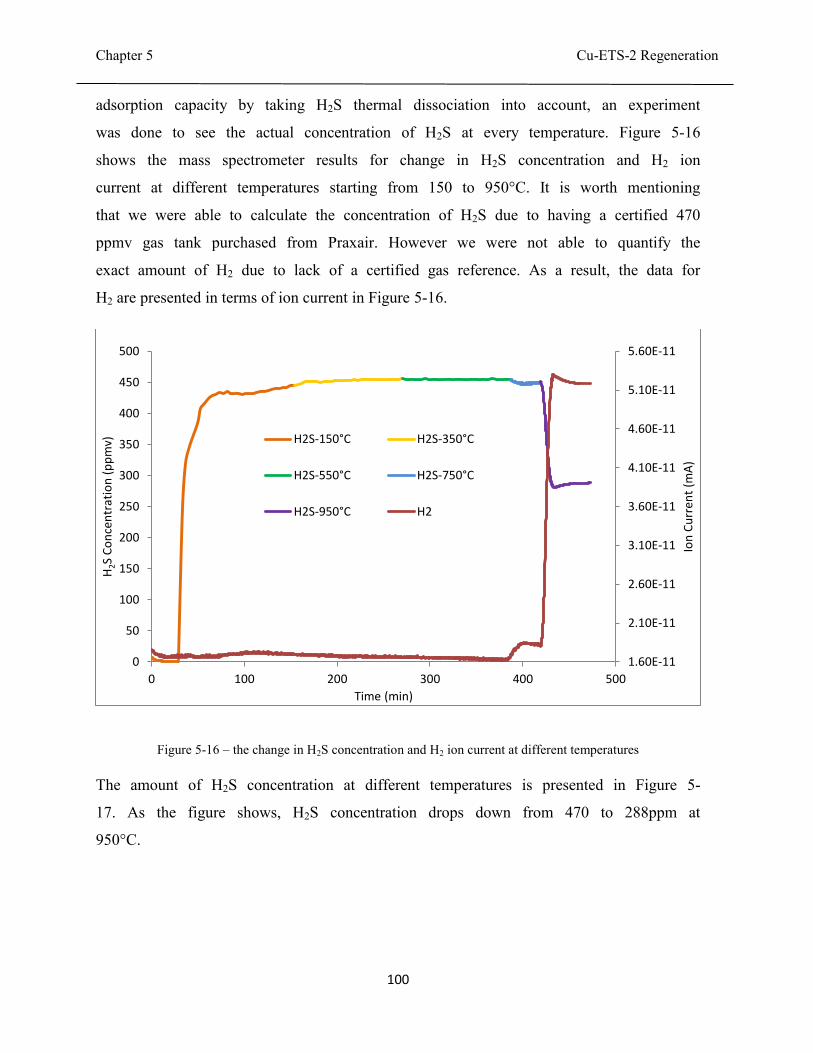
Chapter 5 Cu-ETS-2 Regeneration
100
adsorption capacity by taking H2S thermal dissociation into account, an experiment
was done to see the actual concentration of H2S at every temperature. Figure 5-16
shows the mass spectrometer results for change in H2S concentration and H2 ion
current at different temperatures starting from 150 to 950°C. It is worth mentioning
that we were able to calculate the concentration of H2S due to having a certified 470
ppmv gas tank purchased from Praxair. However we were not able to quantify the
exact amount of H2 due to lack of a certified gas reference. As a result, the data for
H2 are presented in terms of ion current in Figure 5-16.
Figure 5-16 – the change in H2S concentration and H2 ion current at different temperatures
The amount of H2S concentration at different temperatures is presented in Figure 5-
17. As the figure shows, H2S concentration drops down from 470 to 288ppm at
950°C.
1.60E-11
2.10E-11
2.60E-11
3.10E-11
3.60E-11
4.10E-11
4.60E-11
5.10E-11
5.60E-11
0
50
100
150
200
250
300
350
400
450
500
0 100 200 300 400 500Io
n C
urr
ent
(mA
)
H2S
Co
nce
ntr
atio
n (
pp
mv)
Time (min)
H2S-150°C H2S-350°C
H2S-550°C H2S-750°C
H2S-950°C H2

Chapter 5 Cu-ETS-2 Regeneration
101
Figure 5-17 – Change in H2S inlet concentration at different temperatures due to thermal dissociation
Based on the experimental data presented in Figure 5-17, and based on the same
procedure for adsorption capacity calculation, the capacity of Cu-ETS-2 at different
temperatures and adsorption cycles was calculated. The results are presented in
Figure 5- 18.
Figure 5-18- Adsorption capacity of Cu-ETS-2 in mg H2S/g adsorbent at different temperatures and adsorption
cycles
470
457
288
200
250
300
350
400
450
500
550
600
250 350 450 550 650 750 850 950 1050
inle
t C
on
c. (
pp
m)
Temperature (° C)
0
10
20
30
40
50
60
70
350 550 750 950
cap
acit
y (m
g H
2S/g
)
Temperature (°C)
1st
2nd
3rd
4th

Chapter 5 Cu-ETS-2 Regeneration
102
5-6 Conclusions
A series of experiments were performed to investigate the regenerability of sulfided
Cu-ETS-2. Experiments were carried out to collect data for four adsorption/
regeneration cycles at a series of temperatures. For each experiment the adsorption
and regeneration temperature were the same. The results indicated that the adsorbent
is completely regenerable. This result was unexpected for the lower adsorption
temperatures as the sulfate formed at lower temperature (CuO.CuSO4) cannot be
easily removed due to it thermal stability. However due to the immense heat
generated through oxidation of copper sulfides, CuO.CuSO4 also decomposes and
forms CuO at furnace temperatures as low as 350°C, making Cu-ETS-2 a fully
regenerable H2S adsorbent.

Chapter 5 Cu-ETS-2 Regeneration
103
5-7 References:
(1) T. Arnold , J. chem. Phys. 101, 7399 (1994),doi: 10.1063
(2) E.A. Peretti, Disc. Faraday Soc. 4 (1948) 174–179
(3) J.R. Lewis, J.H. Hamilton, J.C. Nixon, C.L. Graversen, TMS–AIME 182 (1949)
177–185
(4) N.D. Ganguly, S.K. Mukherjee, Chem. Eng. Sci. 22 (1967) 1091–1105
(5) Z. Asaki, A. Ueguchi, T. Tanabe, Y. Kondo, Oxidation of Cu2S pellet, Trans.
Jpn.Instit. Met. 27 (1986) 361–371.
(6) S.E. Khalafalla, I.D. Shah, Metallurgical Transactions, 1 (1970) 2151-2156
(7) H.Y. Sohn, M.E. Wadsworth, Rate Processes of extractive metallurgy, Springer,
New York, 1979
(8) I. Barin, Thermochemical Data of Pure Substances, VCH, Weinheim, 1993
(9) S. Yasyerli, G. Dogu, I. Ar, T. Dogu, Ind. Eng. Chem. Res. 40 (2001) 5206–5214
(10) J. Madarasz, P. Bombicz, M. Okuya, S. Kaneko, Solid State Ionics, 141-142
(2001) 439-446

104
Chapter 6
Conclusion and Future Work

Chapter 6 Conclusion and Future work
105
6-1 Conclusions
The results in chapter 2 indicated that Cu-ETS-2 has a high adsorption
capacity for H2S in non-reducing environments and is capable of removing H2S to
levels below our detection limit (ca. 0.1 ppm) at temperatures ranging from 250 up
to 950°C. The results, however, indicated that the adsorption capacity is sensitive to
the presence of hydrogen in the system. Even small amounts of hydrogen in the
system can reduce CuO to Cu2O and elemental copper, resulting in lower adsorption
capacity. The H2 present in the otherwise inert gas was determined to be due to the
thermal dissociation of H2S into H2 and S2 at temperatures above 750°C. This
judgement was based on the presence of elemental sulfur at the cold exhaust of the
reactor tube.
In order to combat the problem associated with copper reduction, chromium
oxide was combined with copper oxide to stabilize the oxidation state of copper. A
previously reported Cu-Cr-O adsorbent was prepared according to the literature and
its capacity for H2S adsorption was measured. As reported in the literature, Cu-Cr-O
performs best at a narrow temperature range of 450 to 850°C with the highest
adsorption capacity being 35 milligram sulfur per gram of adsorbent. The results for
the bimetallic copper-chromium oxide prepared for this work showed no reduction
in adsorption capacity at temperatures as high as 950°C.
The presence of chromium has the same benefit for bimetallic, Cu-Cr-ETS-2
adsorbents. Adsorption experiments indicated that once copper and chromium
oxides are functionalized on ETS-2, the adsorbent develops a rather uniform
adsorption capacity of ~55 milligram sulfur per gram of adsorbent at a wider
temperature range of 350 to 950°C. Adsorption results for Cu-Cr-O and Cr-Cr-ETS-
2 shows that ETS-2 functions as a great support for the active adsorbent and results
in considerable improvement in adsorption capacity.
This study was the first to advance an understanding of the effect of water
vapor of the adsorption characteristics of copper-based H2S adsorbents. Our results
indicate that 10 vol% water has little influence on the H2S capacity of Cu-ETS-2 at

Chapter 6 Conclusion and Future work
106
temperatures 350 °C and below. At temperatures around 550°C, under 10%
humidity, Cu-ETS-2 is capable of removing H2S to concentrations below detection
limit for a considerable amount of time (breakthrough time found to be almost 70%
of dry gas experiments). The negative effect of water on the H2S adsorption capacity
continued at higher temperature until, at 750 °C, virtually all of the copper on the
adsorbent was reduced to non-adsorbing metal (verified by XRD). It was found that
the presence of water vapor promotes the thermal dissociation of H2S which
increases the amount of H2 in the feed stream. The additional H2 promotes metal
reduction and explains the observations made in the study. This study established
that the presence of water vapor in a syngas stream does not create a special problem
because the amount of H2 generated by the thermal dissociation of H2S will be
negligible compared to the H2 present in a typical syngas stream.
One of the desired features of an adsorbent is the ability to regenerate it
multiple times. A series of experiments were performed to investigate the
regenerability of sulfided Cu-ETS-2. Experiments were carried out to collect data for
four adsorption/regeneration cycles at a series of temperatures. For each experiment
the adsorption and regeneration temperature were the same. The results indicated
that the adsorbent is completely regenerable. This result was unexpected for the
lower adsorption temperatures because thermodynamics suggests that the sulfate
formed at lower temperature cannot be easily removed. It was determined that, due
to the use of pure O2 as the regenerating gas, the heat of reaction during regeneration
resulted in a massive increase in temperature. The adsorbent, therefore, experienced
temperatures much higher than the adsorption temperature and perhaps as high at
1800°C. The heat generated during oxidation thus allowed complete regeneration of
the adsorbent. The ability to maintain the same adsorption capacity even after
experiencing such high temperatures shows one of the best benefits of ETS-2 as a
support for adsorbent materials used in high temperature applications.
Chapter 6 Conclusion and Future work
107
6-2 Recommendations for Future Work
Knowing that water simply promoted H2 generation via H2S dissociation, the next
logical step would be to gain an understanding of the effect of other species in
syngas such as carbon monoxide. It is recommended for the future researchers to
investigate the effect of H2:CO ratio on adsorption capacity of Cu-ETS-2 and Cu-Cr-
ETS-2. Ideally, any composition that stabilizes CuO against reduction should be able
to limit the effects of negative effects of water and other reducing gases on the
capacity of the adsorbent.
Once the effect of independent operating parameters (temperature, pressure, gas
composition) has been established on Cu-ETS-2 and Cu-Cr-ETS-2, the adsorbents
should be tested under actual gasification conditions. Establishing that the adsorbent
works under conditions that reflect the total process complexity is the final proof that
the adsorbent should be ready for pilot trials.
Rare earth metal oxides such as cerium oxide have also been reported in the
literature to have good H2S adsorption capacity. It is also interesting to compare the
adsorption results for Cu-ETS-2 and Ce-ETS-2 under the same operating conditions.
Such alternate compositions may have higher adsorption capacity or may be more
resistant to reduction.
Understanding the influence of the exotherm on the regeneration of Cu-ETS-2
requires further investigation. Using air (a lower partial pressure of O2) should be
investigated. The lower temperature limit to completely regenerate sulfide Cu-ETS-
2 (or Cu-Cr-ETS-2) in air should also be determined. Lower temperatures and
ambient gas mixtures would improve the economics of implementing the adsorbent.

108
Complete List of References

Complete List of References
109
Chapter 1:
(1) Health and Safety Fact Sheet, Hydrogen Sulfide. http://cupe.ca/health-and-
safety/Hydrogen_Sulfide (Accessed November 1, 2011)
(2) Patnaik, P., “A Comprehensive Guide to the Hazardous Properties of
Chemical Substances,” 2nd ed., John Wiley, New York (1999), pp. 505-536.
(3) Stirling, D. Sulfur Problem - Cleaning up Industrial Feedstocks, 2000.
(4) U.S. DOE Topical Report # 21, Clean Coal Technology: Coproduction of
Power,
Fuels, and Chemicals, p., September 2001.
(5) Chauk SS, Agnihotri R, Jadhav RA, Misro SK, Fan L-S: Kinetics of high-
pressure removal of hydrogen sulfide using calcium oxide powder. AIChE Journal
2000;46:1157.
(6) http://energy.gov/fe/how-coal-gasification-power-plants-work
(7) Hee Kwon J, Tae Jin L, Si Ok R, Jae Chang K: A study of Zn - Ti-based H2S
removal sorbents promoted with cobalt oxides. Industrial and Engineering
Chemistry Research 2001;40:3547.
(8) R. Kam, J. Scott, R. Amal, C. Selomulya, Pyrophoricity and stability of
copper and platinum based water–gas shift catalysts during oxidative shut-
down/start-up operation, Chem Eng Sci, 65 (24) (2010), pp. 6461–6470
(9) N.A. Koryabkina, A.A. Phatak, W.F. Ruettinger, R.J. Farrauto, F.H. Ribeiro,
J. Catal. 217 (2003) 233.
(10) Ko T-H, Chu H, Chaung L-K: The sorption of hydrogen sulfide from hot
syngas by metal oxides over supports. Chemosphere 2005;58:467.
(11) Prakash, A., On the effects of syngas composition and water-gas-shift
reaction rate on FT synthesis over iron based catalyst in a slurry reactor. Chem.
Eng.Commun. 1994, 128, (1), 143-158.

Complete List of References
110
(12) Bachu, S., and W. D. Gunter, “Overview of Acid-Gas Injection Operations in
Western Canada”, Proceedings of 7th International Conference on Green House
Gas Control Technologies (2005).
(13) Wang, H., D. Fang, and K.T. Chuang, “A Sulfur Removal and Disposal
Process through H2S Adsorption and Regeneration: Ammonia Leaching
Regeneration,” Process Safety and Environment Protection, 8, 296-302 (2008).
(14) Wang, L. K., “Advanced Air and Noise Pollution Control,” Humana Press,
New York (2004), pp. 367-420.
(15) Sublette, K. L., and N. D. Sylvester, “Oxidation of Hydrogen Sulfide:
Desulfurization of Natural Gas,” Biotechnology and Bioengineering, 29, 595- 600
(1987).
(18) Sardesai, P., “Exploring the Gas Anaerobic Bioremoval of H2S for Coal
Gasification Fuel Cell Feed Streams,” Fuel Processing Technology, 87, 319-324
(2006).
(17) Jensen AB, Webb C: Treatment of H2S-containing gases: a review of
microbiological alternatives. Enzyme and Microbial Technology 1995;17:2.
(18) Wang, H., D. Fang, and K.T. Chuang, “A Sulfur Removal and Disposal
Process through H2S Adsorption and Regeneration: Ammonia Leaching
Regeneration,” Process Safety and Environment Protection, 8, 296-302 (2008).
(19) Eow JS: Recovery of sulfur from sour acid gas: A review of the technology.
Environmental Progress 2002, 21:143.
(20) Westmoreland, P. R.; Harrison, D. P. Evaluation of candidate solids for high-
temperature desulfurization of low-Btu gases. Environ. Sci. Technol. 1976, 10,
659.
(21) Crynes, B. L., “Chemical Reactions as a Means of Separation: Sulfur
Removal,” Marcel Dekker, New York (1977), pp. 212-223.

Complete List of References
111
(22) Miura, K., “Simultaneous Removal of COS and H2S from Coke and Oven
Gas at Low Temperature by Use of an Iron Oxide,” Industrial and Engineering
Chemistry Research, 31, 415-419 (1992).
(23) Xue, M., R. Chitrakar, K. Sakane, and K. Ooi, “Screening of Adsorbents for
Removal of H2S at Room Temperature,” Green Chemistry, 5, 529-534 (2003).
(24) Li Z, Flytzani-Stephanopoulos M: Cu-Cr-O and Cu-Ce-O Regenerable Oxide
Sorbents for Hot Gas Desulfurization. Industrial & Engineering Chemistry
Research 1997;36:187-196.
(25) Li K-T, Chi Z-H: Selective oxidation of hydrogen sulfide on rare earth
orthovanadates and magnesium vanadates. Applied Catalysis A: General
2001;206:197.
(26) Flytzani-Stephanopoulos M, Sakbodin M, Wang Z: Regenerative adsorption
and removal of H2S from hot fuel gas streams by rare earth oxides. Science
2006;312:1508.
(27) Ayala, R. E.; Marsh, D. W. Characterization and Long-Range Reactivity of
Zinc Ferrite in High-Temperature Desulfurization Processes. Industrial and
Engineering Chemistry Research 1991, 30, 55-60.
(28) Abbasian, J.; Hill, A. H.; Wangerow, J. R.; Flytzani-Stephanopoulos, M.; Bo,
L.; Patel, C.; Chang, D. Development of novel copper-based sorbents for hot-gas
cleanup. Final technical report, September 1, 1991-August 31, 1992
(29) Lew, S.; Sarofim, A. F.; Flytzani-Stephanopoulos, M. Sulfidation of zinc
titanate and zinc oxide solids. Ind Eng Chem Res 1992, 31, 1890-1899.
(30) Ko, T.; Chu, H.; Chaung, L. The sorption of hydrogen sulfide from hot
syngas by metal oxides over supports. Chemosphere 2005, 58, 467-474.
(31) Gasper-Galvin, L.; Atimtay, A. T.; Gupta, R. P. Zeolite-supported metal
oxide sorbents for hot-gas desulfurization. Ind Eng Chem Res 1998, 37, 4157-
4166.

Complete List of References
112
(32) Kyotani, T.; Kawashima, H.; Tomita, A.; Palmer, A.; Furimsky, E. Removal
of H2S from Hot Gas in the Presence of Cu-Containing Sorbents. Fuel 1989, 68,
74-80.
(33) Bagreev A, Bandosz TJ: A role of sodium hydroxide in the process of
hydrogen sulfide adsorption/oxidation on caustic-impregnated activated carbons.
Industrial and Engineering Chemistry Research 2002;41:672
(34) Bagreev A, Adib F, Bandosz TJ: pH of activated carbon surface as an
indication of its suitability for H2S removal from moist air streams. Carbon
2001;39:1897.
(35) Turk A, Sakalis E, Rago O, Karamitsos H. Activated carbon systems for
removal of light gases. Ann NY Acad Sci 1992;661:221–7.
(36) A, Mahmood K, Mozaffari J. Activated carbon for air purification in New
York City’s sewage treatment plants. Water Sci Techn 1993;27:121–6.
(37) Bandosz TJ: Effect of pore structure and surface chemistry of virgin
activated carbons on removal of hydrogen sulfide. Carbon 1999;37:483.
(38) Davini P: Flue gas desulphurization by activated carbon fibers obtained from
polyacrylonitrile by-product. Carbon 2003;41:277.
(39) Li, Huixing, Selective catalytic oxidation of hydrogen sulfide from syngas,
M.Sc theis, university of Pittsburg, June 2008
(40) http://www.bza.org/zeolites.html
(41) Mer'kov, A.N.; Bussen, I.V.; Goiko, E.A.; Kul'chitskaya, E.A.; Men'shikov,
Yu.P.; Nedorezova, A.P. Raite and zorite-new minerals from the Lovozero
Tundra. Zapiski Vsesoyuznogo Mineralogicheskogo Obshchestva, 1973, 102, 54-
62 (in Russian).
(42) Kuznicki, S. M. Large-Pored Crystalline Titanium Molecular Sieve Zeolites;
Patent US 4,853,202, 1989
Complete List of References
113
(43) Anderson, M.W.; Terasaki, O. Structure of the microporous titanosilicate
ETS-10, Nature, 367, 347-351, 1994
Chapter 2
(1) Gupta, R. P.; Turk, B. S.; Portzer, J. W.; Cicero, B. C. Desulfurization of Syngas
in a Transport Reactor. Environ. Prog. 2001, 20, 187.
(2) Bartholomew, C. H.; Agrawal, P. K.; Katzer, J. R. Sulfur Poisoning of Metals.
Adv. Catal. 1982, 31, 135-242.
(3) Stirling, D.; Clark, J. H.; Braithwaite, M. J. Sulfur Problem - Cleaning up
Industrial Feedstocks; The Royal Chemical Society: Cambridge, 2000.
(4) Bläsing, M., Müller, M. Release of Alkali Metal, Sulphur, and Chlorine Species
from High Temperature Gasification of High- And Low-Rank Coals. Fuel Process.
Technol. 2013, 106, 289.
(5) Koryabkina, N. A.; Phatak, A. A.; Ruettinger, W. F.; Farrauto, R. J.; Ribeiro,
F. H. Determination of Kinetic Parameters for the Water-Gas Shift Reaction on
Copper Catalysts under Realistic Conditions for Fuel Cell Applications. J. Catal.
2003, 217, 233.
(6) Jensen, A. B.; Webb, C. Treatment of H2S-Containing Gases: A Review of
Microbiological Alternatives. Enzyme Microb. Technol. 1995, 17, 2.
(7) Klein, J.; Henning, K. D. Catalytic Oxidation of Hydrogen Sulfide on Activated
Carbons. Fuel 1984, 63, 1064.
(8) Elseviers, W. F.; Verelst, H. Transition Metal Oxides for Hot Gas
Desulphurization. Fuel 1999, 78, 601.
(9) Melo, D. M. A.; De Souza, J. R.; Melo, M. A. F.; Martinelli, A. E.; Cachima, G.
H. B.; Cunha, J. D. Evaluation of the Zinox and Zeolite Materials as Adsorbents to
Remove H2S from Natural Gas. Colloids Surf., A: 2006, 272, 32.
Complete List of References
114
(10) Ko T. H.; Chu, H.; Chaung, L. K. The Sorption of Hydrogen Sulfide from Hot
Syngas by Metal Oxides over Supports. Chemosphere 2005, 58, 467.
(11) Müller, M. Integration of Hot Gas Cleaning at Temperatures above the Ash
Melting Point in IGCC. Fuel 2013, 108, 37.
(12) Westmoreland, P. R.; Harrison, D. P. Evaluation of Candidate Solids for High-
Temperature Desulfurization of Low-Btu Gases. Environ. Sci. Technol. 1976, 10,
659.
(13) Crynes, B. L. Chemical Reactions as a Means of Separation: Sulfur Removal;
Marcel Dekker: New York, 1977.
(14) Gollmer, H. A. in Chemistry of Coal Utilization; Lowry, H.H., Eds.; John Wiley
& Sons: New York, 1945; pp947-1007.
(15) Swisher, J. H.; Swerdtfeger, K.; Review of Metals and Binary Oxides as
Sorbents for Removing Sulfur from Coal-Derived Gases. JMEPEG 1992, 1, 399.
(16) Kyotani, T.; Kawashima, H.; Tomita, A. High Temperature Desulfurization
with Copper-Containing Sorbents. Environ. Sci. Technol. 1989, 23 (2), 218-223.
(17) Patrick, V.; Gavalas, G. R. Structure and Reduction of Mixed Copper-
Aluminum Oxide. J. Am. Ceram. Soc. 1990, 73 (2), 358-369
(18) Stemmler, M.; Tamburro, A.; Müller, M. Laboratory Investigations on
Chemical Hot Gas Cleaning of Inorganic Trace Elements for the “UNIQUE”
Process. Fuel 2013, 108, 31.
(19) Ayala, R. E.; Marsh, D. W. Characterization and Long-Range Reactivity of
Zinc Ferrite in High-Temperature Desulfurization Processes. Ind. Eng. Chem. Res.
1991, 30, 55.
(20) Abbasian, J.; Hill, A. H.; Wangerow, J. R.; Flytzani-Stephanopoulos, M.; Bo,
L.; Patel, C.; Chang, D. Development of Novel Copper-Based Sorbents for Hot-Gas
Cleanup. IGT-Final technical report to CRSC; IGT project No. 40330, 1992.

Complete List of References
115
(21) Li, Z.; Flytzani-Stephanopoulos, M. Cu-Cr-O and Cu-Ce-O Regenerable Oxide
Sorbents for Hot Gas Desulfurization. Ind. Eng. Chem. Res. 1997, 36, 187.
(22) Gasper-Galvin, L.; Atimtay, A. T.; Gupta, R. P. Zeolite-Supported Metal Oxide
Sorbents for Hot-Gas Desulfurization. Ind. Eng. Chem. Res. 1998, 37, 4157.
(23) Kuznicki, S. M. Large-Pored Crystalline Titanium Molecular Sieve Zeolites;
Patent US 4,853,202, 1989.
(24) Rezaei, S.; Tavana, A.; Sawada, J.; Junaid, A.; Kuznicki, S. M. Novel Copper-
Exchanged Titanosilicate Adsorbent for Low Temperature H2S Removal. Ind. Eng.
Chem. Res. 2012, 51, 12430.
(25) Yogamalar, R.; Srinivasan, R.; Vinu, A.; Ariga, K. X-ray Peak Broadening
analysis in ZnO Nanoparticles. Solid state Commun. 2009, 149, 1919–1923.
(26) Donnay, G.; Donnay, J. D. H.; Kullerud, G. Crystal Structure of Digenite,
Cu9S5. Am. Mineral. 1958, 43, 228-242.
(27) Fukuda, K.; Dokiya, M.; Kameyana, T.; Kotera, Y. Catalytic Decomposition of
Hydrogen Sulfide. Ind. Eng. Chem. Res. 1978, 17, 243-248.
(28) Barin, I.; Knacke, O. Thermochemical Properties of Inorganic Substances;
Springer-Verlag: Berlin, 1973.
(29) Patrick, V.; Gavalas, G. R.; Flytzani-Stephanopoulos, M.; Jothimurugesan, K.
High Temperature Sulfidation-Regeneration of Cuo-Al2O3 Sorbents. Ind. Eng.
Chem. Res. 1989, 28, 931-940.
Chapter 3:
(1) M. Müller, Fuel 108, 37 (2013)
(2) L. Fenouil, G. Towler and S. Lynn, Ind. Eng. Chem. Res. 33(2), 265 (1994)
(3) N. A. Khan, H. Zubair and H. J. Sung, Adv. Porous Mater. 1(1), 91 (2013)

Complete List of References
116
(4) M. Müller, D. Pavone, M. Rieger and R. Abraham, 4th International Conference
on Clean Coal Technologies, Dresden, Germany, May (2009)
(5) J. W. Portzer, J. R. Albritton, C. C. Allen, R. P Gupta. Fuel process. Technol.
85(6), 621 (2004)
(6) D. Stirling, J. H. Clark and M. J. Braithwaite, Sulfur Problem - Cleaning up
Industrial Feedstock, The Royal Chemical Society, Cambridge, (2000)
(7) M. Bläsing and M. Müller, Fuel Process. Technol. 106, 289 (2013)
(8) D. S. Newsome, Catal. Rev. 21(2), 275 (1980)
(9) C. Rhodes, G. J. Hutchings and A. M. Ward, Catal. Today 23(1), 43 (1995)
(10) M. Stemmler and M. Müller, Biomass. Bioenerg. 35, S105 (2011)
(11) P. Hou, D. Meeker and H. Wise, J. Catal. 80(2), 280 (1983)
(12) G. Ma, Y.Hou, X. Han, and Z. Huang. Energy Environm. Focus. 3(1), 74
(2014)
(13) M. P. Cal, B. W. Strickler and A. A. Lizzio, Carbon 38(13), 1757 (2000)
(14) R. C Hansford, R. H. Hass and H. Hennig, U.S. Patent No. 4,088,743. 9 May
(1978)
(15) T. Ko, H. Chu and L. Chuang, Chemosphere. 58, 467 (2005)
(16) J. J. Park, C. G. Park, S. Y Jung, S. C. Lee, D. Ragupathy and J. C. Kim,
Nanoelectron. Optoelectron. 6(3), 306 (2011)
(17) J.J. Park, S.Y. Jung, C.Y. Ryu, C.G. Park, J.N. Kim, and J.C. Kim. J.
Nanoelectron. Optoelectron. 5(2), 222 (2010)
(18) Y. Motoo and E. Furimsky, Ind. Eng. Chem. Process. Des. Dev. 24(4), 1165
(1985)
(19) Y.Zeng, S. Zhang, F. R. Groves, and D. P. Harrison. Chem. Eng. Sci, 54(15),

Complete List of References
117
3007 (1999)
(20) S. K. Gangwal, in Proceedings of the 3rd International Symposium and
Exhibition: High-Temperature Gas Cleaning, University of Karlsruhe, Karlsruhe,
Germany (1996), p. 489.
(21) J. S. Yong, S. C. Lee and J. C. Kim. J. Nanoelectron. Optoelectron. 7(5), 536
(2012)
(22) L. Zhijiang and M. Flytzani-Stephanopoulos, Ind. Eng. Chem. Res. 36(1), 187
(1997)
(23) M. Flytzani-Stephanopoulos, G. R. Gavalas, S. S. Tamhankar and P. K.
Sharma, Final Report to DOE, DOE/MC/ 20417-1898, (1985)
(24) G. Sick and K. Schwerdtfeger, Metall. Trans. B. 18(3), 603 (1987)
(25) T. Kyotani, H. Kawashima, A. Tomita, A. Palmer and E. Furimsky, Fuel. 68(1),
74 (1989)
(26) M. Flytzani-Stephanopoulos, G. R. Gavalas, and S. S. Tamhankar, U.S. Patent
No. 4,729,889 (1988)
(27) P. Valerle and G. Gavalas, J. Am. Ceram. Soc. 73(2). 358 (1990)
(28) A. T. Atimtay and D. P. Harrison, eds. Desulfurization of hot coal gas. No. 42.
Springer, (1998)
(29) J. Abbasian, A. H. Hill, J. R. Wangerow, M. Flytzani- Stephanopoulos, L. Bo,
C. Patel and D. Chang, IGT-Final Technical Report to CRSC; IGT Project No.
40330, (1992)
(30) S. M. Kuznicki, Patent US4853202, (1989)
(31) S. Rezaei, A. Tavana, J. A. Sawada, L. Wu, A.S. Junaid and S. M. Kuznicki,
Ind. Eng. Chem. Res. 51(38), 12430 (2010)

Complete List of References
118
(32) M. Shi, C.C. Lin, L. Wu, C. Holt, D. Mitlin and S. M. Kuznicki. J. Nanosci.
Nanotechnol. 10(12), 8448 (2010)
(33) B. Tanchuk, J. A. Sawada and S. M. Kuznicki, AIChE J. 59(12), 4727 (2013)
(34) A. Tavana, Characterization of Copper Supported on Titanosilicates for Room
Temperature H2S Adsorption. MSc thesis, University of Alberta, Edmonton (2012)
(35) Q. Geng, X. Zhao, X. Gao, S. Yang and G. Liu, J. Sol-Gel. Sci. Techn. 61(1),
281 (2012)
(36) W. Li and H. Cheng, J. Cent. South Univ. T. 14, 291 (2007)
(37) A. M. Kawamoto, L. C. Pardini and L.C. Rezende. Aerosp. Sci. Technol. 8, 591
(2004)
(38) K. Fukuda, M. Dokiya, T. Kameyana, Y. Kotera, Ind. Eng. Chem. Res. 17, 243
(1978)
(39) S. Yasyerli, G. Dogu and I. Ar, Ind. Eng. Chem. Res. 40(23), 5206 (2001)
Chapter 4:
(1) Stirling, D., The sulfur problem: cleaning up industrial feedstocks. Royal
Society of Chemistry: 2000.
(2) Boon, J.; van Dijk, E.; Pirgon-Galin, Ö.; Haije, W.; van den Brink, R.,
Water–gas shift kinetics over FeCr-based catalyst: effect of hydrogen sulphide.
Catal. Lett. 2009, 131, (3-4), 406-412.
(3) Cal, M.; Strickler, B.; Lizzio, A., High temperature hydrogen sulfide
adsorption on activated carbon: I. Effects of gas composition and metal addition.
Carbon 2000, 38, (13), 1757-1765.

Complete List of References
119
(4) Hass, R. H.; Hansford, R. C.; Hennig, H., Catalytic incineration of hydrogen
sulfide from gas streams. In Google Patents: 1978.
(5) Ko, T.-H.; Chu, H.; Chaung, L.-K., The sorption of hydrogen sulfide from
hot syngas by metal oxides over supports. Chemosphere 2005, 58, (4), 467-474.
(6) Yumura, M.; Furimsky, E., Comparison of calcium oxide, zinc oxide, and
iron (III) oxide hydrogen sulfide adsorbents at high temperatures. Ind. Eng. Chem.
Proc. D. D. 1985, 24, (4), 1165-1168.
(7) Abbasian, J. Development of novel copper-based sorbents for hot-gas
cleanup; Institute of Gas Technology, Chicago, IL (United States): 1991.
(8) Tamhankar, S.; Garimella, S.; Wen, C., Kinetic study on the reactions
involved in hot gas desulfurization using a regenerable iron oxide sorbent—III.
Reactions of the sulfided sorbent with steam and steam-air mixtures. Chem. Eng.
Sci. 1985, 40, (6), 1019-1025.
(9) Rosso, I.; Galletti, C.; Bizzi, M.; Saracco, G.; Specchia, V., Zinc oxide
sorbents for the removal of hydrogen sulfide from syngas. Ind. Eng. Chem. Res.
2003, 42, (8), 1688-1697.
(10) Lew, S.; Jothimurugesan, K.; Flytzani-Stephanopoulos, M., High-
temperature hydrogen sulfide removal from fuel gases by regenerable zinc oxide-
titanium dioxide sorbents. Ind. Eng. Chem. Res. 1989, 28, (5), 535-541.
(11) Patrick, V.; Gavalas, G. R.; Flytzani-Stephanopoulos, M.; Jothimurugesan,
K., High-temperature sulfidation-regeneration of copper (II) oxide-alumina sorbents.
Ind. Eng. Chem. Res. 1989, 28, (7), 931-940.
(12) Slimane, R. B.; Abbasian, J., Copper-based sorbents for coal gas
desulfurization at moderate temperatures. Ind. Eng. Chem. Res. 2000, 39, (5), 1338-
1344.

Complete List of References
120
(13) Kyotani, T.; Kawashima, H.; Tomita, A.; Palmer, A.; Furimsky, E., Removal
of H 2 S from hot gas in the presence of Cu-containing sorbents. Fuel 1989, 68, (1),
74-79.
(14) Yasyerli, S.; Dogu, G.; Ar, I.; Dogu, T., Activities of copper oxide and Cu-V
and Cu-Mo mixed oxides for H2S removal in the presence and absence of hydrogen
and predictions of a deactivation model. Ind. Eng. Chem. Res. 2001, 40, (23), 5206-
5214.
(15) Sick, G.; Schwerdtfeger, K., Hot desulfurization of coal gas with copper.
Metall. Trans. B 1987, 18, (3), 603-609.
(16) Flytzani-Stephanopoulos, M.; Gavalas, G. R.; Tamhankar, S. S.; Center, U.
S. D. o. E. M. E. T.; Laboratory, J. P., Novel Sorbents for High Temperature
Regenerative H2S Removal. United States Department of Energy: 1984.
(17) Li, Z.; Flytzani-Stephanopoulos, M., Cu-Cr-O and Cu-Ce-O regenerable
oxide sorbents for hot gas desulfurization. Ind. Eng. Chem. Res. 1997, 36, (1), 187-
196.
(18) Reddy, G. K.; Smirniotis, P. G., Chapter 1 - Introduction About WGS
Reaction. In Water Gas Shift Reaction, Smirniotis, G. K. R. G., Ed. Elsevier:
Amsterdam, 2015; pp 1-20.
(19) Huang, C.-C.; Chen, C.-H.; Chu, S.-M., Effect of moisture on H 2 S
adsorption by copper impregnated activated carbon. J. Hazard. Mater. 2006, 136,
(3), 866-873.
(20) Yazdanbakhsh, F.; Blasing, M.; Sawada, J. A.; Rezaei, S.; Müller, M.;
Baumann, S.; Kuznicki, S. M., Copper exchanged nanotitanate for high temperature
H2S adsorption. Ind. Eng. Chem. Res. 2014, 53, (29), 11734-11739.
(21) Kuznicki, S. M., Large-pored crystalline titanium molecular sieve zeolites. In
Google Patents: 1989.

Complete List of References
121
(22) Tanchuk, B.; Sawada, J. A.; Kuznicki, S. M., Amine‐functionalization of
the nanotitanate ETS‐2. AIChE J. 2013, 59, (12), 4727-4734.
(23) Prakash, A., On the effects of syngas composition and water-gas-shift
reaction rate on FT synthesis over iron based catalyst in a slurry reactor. Chem.
Eng.Commun. 1994, 128, (1), 143-158.
(24) Yazdanbakhsh, F. A., M.; Sawada, J.A.; Kuznicki, Cu–Cr–O Functionalized
ETS-2 Nanoparticles for Hot Gas Desulfurization. J. Nanosci. Nanotechnol. 15.
(25) Alonso, L.; Palacios, J. M.; Garcıa, E.; Moliner, R., Characterization of Mn
and Cu oxides as regenerable sorbents for hot coal gas desulfurization. Fuel Proc.
Tech. 2000, 62, (1), 31-44.
(26) Karan, K.; Mehrotra, A. K.; Behie, L. A., On reaction kinetics for the thermal
decomposition of hydrogen sulfide. AIChE J. 1999, 45, (2), 383-389.
(27) Ranjan, P.; Kannan, P.; Al Shoaibi, A.; Srinivasakannan, C., Modeling of
Ethane Thermal Cracking Kinetics in a Pyrocracker. Chem. Eng. Tech. 2012, 35, (6),
1093-1097.
Chapter 5:
(1) T. Arnold , J. chem. Phys. 101, 7399 (1994),doi: 10.1063
(2) E.A. Peretti, Disc. Faraday Soc. 4 (1948) 174–179
(3) J.R. Lewis, J.H. Hamilton, J.C. Nixon, C.L. Graversen, TMS–AIME 182 (1949)
177–185
(4) N.D. Ganguly, S.K. Mukherjee, Chem. Eng. Sci. 22 (1967) 1091–1105
(5) Z. Asaki, A. Ueguchi, T. Tanabe, Y. Kondo, Oxidation of Cu2S pellet, Trans.
Jpn.Instit. Met. 27 (1986) 361–371.
(6) S.E. Khalafalla, I.D. Shah, Metallurgical Transactions, 1 (1970) 2151-2156

Complete List of References
122
(7) H.Y. Sohn, M.E. Wadsworth, Rate Processes of extractive metallurgy, Springer,
New York, 1979
(8) I. Barin, Thermochemical Data of Pure Substances, VCH, Weinheim, 1993
(9) S. Yasyerli, G. Dogu, I. Ar, T. Dogu, Ind. Eng. Chem. Res. 40 (2001) 5206–5214
(10) J. Madarasz, P. Bombicz, M. Okuya, S. Kaneko, Solid State Ionics, 141-142
(2001) 439-446