highs and lows on the road to high quality data american evaluation association anaheim, ca...
Post on 19-Dec-2015
219 views
TRANSCRIPT

Highs and Lows on the Road to High Quality Data
American Evaluation Association Anaheim, CA
November, 2011
Kathy Hebbeler and Lynne Kahn
ECO at SRI International and ECO at UNC

What we will cover
• Review of the timeline for national reporting
• Share the national data• Describe how the national data were
computed• Discuss the quality of the national data• Discuss the meaning of the numbers
2Early Childhood Outcomes Center

Timeline
3Early Childhood Outcomes Center
When Critical Event
January 2004 – January 2005 Stakeholder input gathered on 3 child outcomes
July 2005 (revised September 2006) OSEP releases reporting requirements for state programs
February 2008 States submit first data on 5 progress categories: Children who exited between July 1, 2006 to June 30, 2007
February 2010 States establish baseline and set targets on the Summary Statements for first time.
February 2011 States submit data on 5 categories for the 4th time.

Request from the U.S. Department of Education
• Analyze the data for possible inclusion as a GPRA indicator.
• Also, to use in President’s budget justification for Part C and Preschool 619 funding.
• Initial request received in 2010, repeated in 2011.
4Early Childhood Outcomes Center

The Dilemma
• Variations in quality of state data– Some states started earlier– Some states had devoted more attention to
improving quality• What would be the impact of state
variation in data quality on the national number?
5Early Childhood Outcomes Center

Our Response
• Compute the analyses several ways1. Identify the states with the highest quality
data and use only their data. Stratify by number of children served and weight data to produce national estimate.
2. Use data from all states. Weight data to represent the nation.
• Weighting necessary because a few states are sampling. Also, many states not reporting data on all children.
6Early Childhood Outcomes Center

Early Childhood Outcomes Center 7
Note: Based on 29 States with highest quality data
Social relationships Knowledge and skills Action to meet needs
a 0.0165481765021159 0.0148974177446063 0.0145225115393538
b 0.179791044501508 0.199542744006336 0.174681665026758
c 0.185932320590047 0.247993957138401 0.214074779812331
d 0.294138593838746 0.369311305766878 0.370708975497373
e 0.323587775084596 0.168236271568793 0.22601676946091
3%
8%
13%
18%
23%
28%
33%
38%
Estimated Data for Part C, 2009-10

8Early Childhood Outcomes Center
OSEP Reporting Categories
Percentage of children who: a. Did not improve functioningb. Improved functioning, but not sufficient to move nearer
to functioning comparable to same-aged peers c. Improved functioning to a level nearer to same-aged
peers but did not reach itd. Improved functioning to reach a level comparable to
same-aged peerse. Maintained functioning at a level comparable to same-
aged peers
3 outcomes x 5 “measures” = 15 numbers

Illustration of 5 Possible Paths
0
10
20
30
40
50
60
70
1 6 11 16 21 26 31 36 41 46 51 56
Age in Months
Sco
re
Maintained functioning comparable to age peers
Achieved functioning comparable to age peers
Moved nearer functioning comparable to age peers
Made progress; no change in trajectory
Did not make progress

Early Childhood Outcomes Center 10
Note: Based on 29 States with highest quality data
Social relationships Knowledge and skills Action to meet needs
SS1 0.70973347275746 0.742180533377054 0.755546347980436
SS2 0.61772636892334 0.537547577335669 0.596725744958282
5%
15%
25%
35%
45%
55%
65%
75%
Estimated Summary Statement Data for Part C, 2009-10

The Summary Statements
1. Of those children who entered the program below
age expectations in each outcome, the percent who
substantially increased their rate of growth by the
time they turned 3 [6] years of age or exited the
program.
2. The percent of children who were functioning within
age expectations in each outcome by the time they
turned 3 [6] years of age or exited the program.
11Early Childhood Outcomes Center

Early Childhood Outcomes Center 12
Social relationships Knowledge and skills Action to meet needs
a 0.0173423475321513 0.0182367034048671 0.0164717096861928
b 0.114520004403404 0.133727833654954 0.108153036923834
c 0.281561785450637 0.32470410889358 0.208844242808853
d 0.343437919521324 0.34397760817479 0.356458315050575
e 0.243152978902516 0.179335862613809 0.310081127789363
3%
8%
13%
18%
23%
28%
33%
38%
Estimated National Data for Early Childhood Special Education, 2009-2010
Note: Based on 33 States with highest quality data

Early Childhood Outcomes Center 13
Note: Based on 33 States with highest quality data
Social relationships Knowledge and skills Action to meet needs
SS1 0.825777563121165 0.814823334298579 0.819365394291995
SS2 0.586590898423841 0.523313470788598 0.666539442839937
10%
30%
50%
70%
90%
Estimated National Summary Statements for Early Childhood Special Education, 2009-2010

Criteria for States with Quality Data
1. Low percentage of missing data
2. No odd patterns in “a” or “e” categories
3. Did not use questionable data collection methods
14Early Childhood Outcomes Center

Calculating Missing Data for Part C
Proxy for missing data =
Number with data for C3/
Exiting Data (618)
15Early Childhood Outcomes Center
• Do not expect this number to be 100%
• ..but we don’t expect it to be 10% either

Part C: Percent of Exiters included in Outcomes Data
08-09<10% = 10*
10- 20% = 4
20- 30% = 8
30- 40% = 11
40- 50% = 8
50- 60% = 8
60- 70% = 4
70- 80% = 2
>80% = 1
09-10<10% = 5*
10- 20% = 4
20- 30% = 6
30- 40% = 8
40- 50% = 5
50- 60% = 11
60- 70% = 9
70- 80% = 1
>80% = 0
*3 states are sampling for Part C. Cut off was > 27%.

Calculating Missing Data for 619
Proxy for missing data =
Number with data for B7/
Child count
17Early Childhood Outcomes Center
• Do not expect this number to be 100%
• ..but we don’t expect it to be 10% either

Percent of Child Count included in Outcomes Data for ECSE
08-09<10= 11*
10- 20%= 15
20- 30%= 12
30- 40%= 12
40-50% =1
>50% = 2
09-10<10= 6*
10- 20%= 11
20- 30%= 12
30- 40%= 16
40-50% =4
>50%= 0
*4 States are sampling for 619Cutoff was > 11%.

Odd Patterns in a or e
• a = % of children who show no new skills– Except this to be very small.
• e = % of children who maintained functioning comparable to age expectations.– Don’t expect this to be large.
• Quality defined as <10% in a and <65% in e.
19Early Childhood Outcomes Center

Early Childhood Outcomes Center 20
1 2 3 4 5 6 7 8 9 10 11 12 13 14 15 16 17 18 19 20 21 22 23 24 25 26 27 28 29 30 31 32 33 34 35 36 37 38 39 40 41 42 43 44 45 46 47 48 49
0%
2%
4%
6%
8%
10%
12%
14%
16%
Percent Reported in "a“ for Knowledge and Skills for ECSE by State

Can we trust these data?
21Early Childhood Outcomes Center

Pattern checking for validity
• Checking across years– How do the 2009-10 data compare to the
data for 2008-09?• Checking across methods
– How do the data for all states compare to states with highest quality data?
22Early Childhood Outcomes Center

All states 19 best All states 29 bestFFY 08-09 FFY 09-10
0
20
40
60
80
64.570.2
64
71
SS1: % who IncreasedGrowth Rates
Part C, Outcome A: Social Relationships
All states 19 best All states 29 bestFFY 08-09 FFY 09-10
0
20
40
60
80
6761.3
64.761.8
SS2: % who Exited at Age Expectations

Part C, Outcome B: Knowledge and Skills
All states 19 best All states 29 bestFFY 08-09 FFY 09-10
0
20
40
60
8070.4
76.6
68.1
74.2
SS1: % who Increased Growth Rates
All states 19 best All states 29 bestFFY 08-09 FFY 09-10
0
20
40
60
80
5953.9 55.8 53.8
SS2: % who Exited at Age Expectations

Part C, Outcome C: Meets Needs
All states 19 best All states 29 bestFFY 08-09 FFY 09-10
0
10
20
30
40
50
60
70
80
69.7
76
68.1
75.6
SS1: % who Increased Growth Rates
All states 19 best All states 29 bestFFY 08-09 FFY 09-10
0
10
20
30
40
50
60
70
80
64.660.5 61.5 59.7
SS2: % who Exited at Age Expectations

Part B Preschool: Social Relationships
All states 15 best All states 33 bestFFY 08-09 FFY 09-10
0
10
20
30
40
50
60
70
80
90
77.282.7
79.7 82.6
SS1: % who Increased Growth Rates
All states 15 best All states 33 bestFFY 08-09 FFY 09-10
0
10
20
30
40
50
60
70
80
90
61.758.7
62.158.7
SS2: % who Exited at Age Expectations
Part B Preschool: Knowledge and Skills
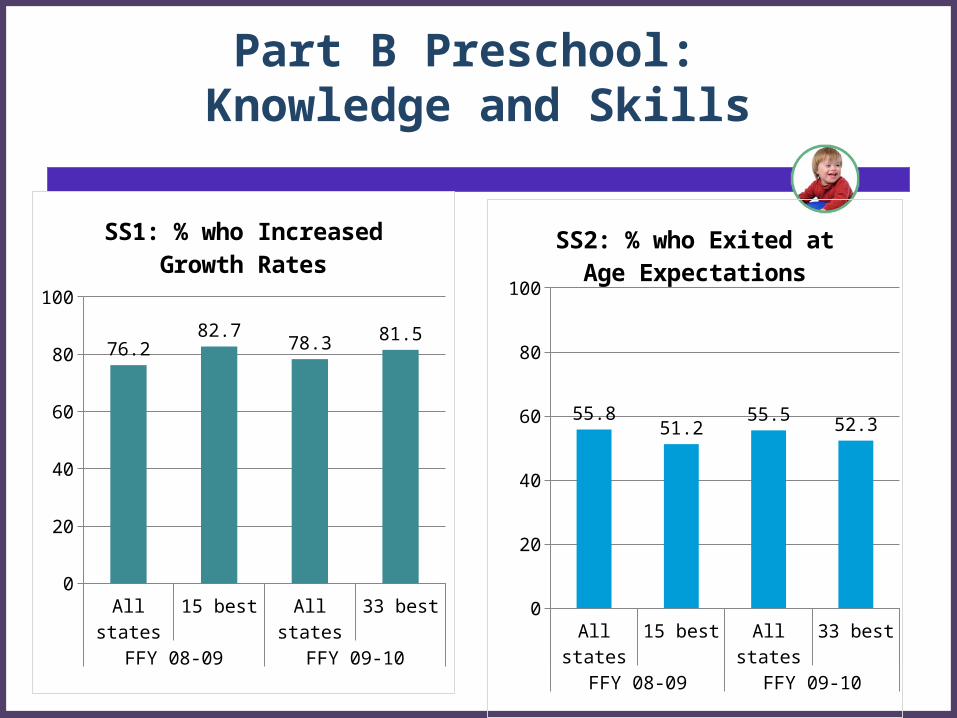
All states 15 best All states 33 bestFFY 08-09 FFY 09-10
0
20
40
60
80
100
76.282.7
78.381.5
SS1: % who Increased Growth Rates
All states 15 best All states 33 bestFFY 08-09 FFY 09-10
0
20
40
60
80
100
55.851.2
55.5 52.3
SS2: % who Exited at Age Expectations

Part B Preschool: Meets Needs
All states 15 best All states 33 bestFFY 08-09 FFY 09-10
0
20
40
60
80
100
75.381.6
78.181.9
SS1: % who Increased Growth Rates
All states 15 best All states 33 bestFFY 08-09 FFY 09-10
0
20
40
60
80
100
67.8 67.2 66.7 66.7
SS2: % who Exited at Age Expectations
Possible interpretation of the data
• Nationally, a high proportion of children who receive Part C and ECSE services are showing greater than expected progress
• Nationally, many (over half) are exiting the program functioning like same age peers in at least one of the outcomes.
29Early Childhood Outcomes Center

Would you agree?
30Early Childhood Outcomes Center

Should each state’s data look like the national data?
• Probably not• More important that each state continue to
focus on the quality of its own data– Getting outcomes data on all children who exit– Working with programs whose data look
unusual to address possible data quality issues
31Early Childhood Outcomes Center

Additional information
For information on state activities related to improving data quality and using data for program improvement
www.the-eco-center.org
32Early Childhood Outcomes Center