household energy use and co2 emission: differentials and...
TRANSCRIPT

1
Household Energy Use and CO2 Emission: Differentials and Determinant in India
Kaveri Patil1 ([email protected])and Aparajita Chattopadhyay
2
Introduction: India is the second most populous country after china in the world, with
population 1210 million by census 2011. This causes considerable burden on the environment
and on energy resources. Global primary energy demand is projected to increase by 50 per
cent between 2005 and 2030. Almost 45 per cent of this increase will be in China and India
alone (IEA, 2007). Delivery of clean and affordable energy for poor household in developing
countries is an important requirement in the fight against poverty. Still, even though their
economic growth, poverty and a lack of access to sufficient amount of clean and efficient
energy sources to meet demand in full remain serious concerns and a challenge in India
(Pachauri S. and Jiang L., 2008). In India the domestic sector is one of the largest consumers
of energy accounting for 40% to 50% of the total energy consumption (TEDDY, 2002/03). In
household, energy is mainly used for cooking, water and space heating and lighting.
Residential energy use in developing countries varies mostly by rural and urban areas and
high and low income groups (Ruijven et al., 2008). Of the world’s estimated 1.6 billion
people without access to electricity (IEA, 2004), over a billion reside in India and China,
most of them in India. Rural household often have an easy access to traditional forms of
energy like firewood, charcoal and agricultural residues to fulfil their needs. These fuels carry
adverse effects, such as emission of particulate matter that are harmful to health,
deforestation and environmental degradation.
Many studies have shown that consumption of energy in the rural areas is mostly inefficient
and unscientific causing pollution and health related diseases in rural area (Balakrishnan, k
(2000), Parikh J (2001), (Mishra V, 2005) and Saha A et al, 2005). Hence, the rural energy
scenario in India is low energy intensity, high domestic energy consumption, heavy
dependence on solid biomass fuel and rapid environmental degradation. Thus, there is need to
fix the present energy consumption pattern and make it more efficient and environment
friendly.
As household become more rich, they tend to switch to more suitable, cleaner fuels for
cooking, and for India this flows like, switching from biomass to kerosene and then liquefied
petroleum gas (LPG) (Viswanathan and Kumar, 2005; Farsi et al.,2007). Both the choice of
1 Doctoral Student of International Institute for Population Sciences, Mumbai, India
2 Assistant Professor, Intternational Institute for population Sciences, Mumbai, India

2
fuel and the amount consumed influence exposure to indoor air pollution (IAP) and the total
emission to the atmosphere, thus influencing the environment locally and climate globally
(Staff Mestl, H.E and Eskeland, G.S., 2009). , CO2 emissions by various sectors need to be
estimated so that measures can be undertaken to reduce the emissions as far as possible
without negotiating economic growth. Carbon dioxide (CO2) emitted by combustion of solid
cooking fuels that is, household sector contributing very less among the various sectors in
India. CO2 emission due to direct use of fossils fuels in running private cars, cooking and use
of kerosene in lighting etc., by all households accounts for about 7 per cent of total emission
in the economy (Parikh J et al., 2009). With this environmental degradation, the greater time
needed for gathering, transporting and using these fuels also reduces the ability for using this
time in more fruitful work or education. In addition, as women and children are more likely
to suffer from many of these adverse effects, the issue has an important gender and equity
aspect (Pachauri, 2004a).
Review of Literature: while the literature on household level energy use and resultant
pollution is rich and vast, the review here focuses on two relevant strands for this study: 1)
determinants of choice of household energy; 2) household energy use and CO2 emission
Determinants of choice of household energy: Literature on household energy need in
developing countries, primarily for the case of India, is extensive. The past view on fuel
choice has been the ‘energy ladder’ attitude (Leach, 1992), agreeing to which households
switch to more suitable energy forms as their income increases. A partial appraisal of this
approach has been given by Masera et al. (2000), who notice from data of rural Mexican
energy consumption, that household do not go up a ‘ladder’ but slightly follow a ‘stacking’
procedure, that is traditional fuels are not totally rejected with rising income, but relatively
used in combination with modern fuels due to cultural preferences. The importance of income
as a factor affecting fuel use is, still, apparent, even in the case where the switch to modern
fuels is not always complete. In India, Pachauri (2004b) found that the statistically most
significant factors determining households’ energy consumption were income and place.
Mekonnen (2004), probing in his study conducted at seven major cities of Ethiopia
association between demographic indicator and fuel use pattern reveals that, households with
a more educated member were more likely to have non-solid fuels as their main fuel.
Secondly female-headed households were having more chances to choose either solid fuel
only or a mix of solid and non-solid fuels as their main fuel and older household heads were
more likely to choose solid fuels only as their main fuel. Pachauri S (2008) carried out a

3
comparative and descriptive analysis of household energy transitions in India and China and
found that the most important drivers of the household energy transition are income,
urbanisation, energy access, and energy prices.
Household energy use and CO2 emission: there have been several studies on the emissions
of greenhouse gases (GHGs) in India, and some of them deal with sectoral emissions in the
country. Parikh and Gokarn (1993) is one of the earliest attempts at estimating emission
levels in various sectors of the economy for the year 1983-84. Murthy et al (1997) made a
detailed study of interactions among the economic growth, energy demand and carbon
emissions for the Indian economy using Input-Output (IO) table for 1989-90 and projected
emission for 2004-05. Sharma et al. (2006) analysed the total greenhouse gas emission from
India for broad sectors such as energy, industrial processes, agriculture activities, land use,
land use change and forestry and waste management practices for 1990, 1994 and 2000.
Among the all specified literature, it covers very broad issue of GHG emission at national
level by sectors. Very few literatures highlight the specific issue of household fuel use and
CO2 emission in India. Mestl et al. (2009) analysed GHG emissions and health through three
policy scenarios for household energy. In policy scenario called Business as Usual (BAU),
improved health, and green future, projected per capita household GHG emission in 2026
increased by 169%, 164%, and 139% respectively, compare to 2001.whereas household
mortality rates decrease by 45%, 67%, and 45% respectively. Venkataraman et al, (2005)
showed that use of wood and other biofuels in South Asia has resulted in release of black
carbon to the tune of 172 gigagrams/year (Gg/year) in the year 1995 and almost similar
amount (160 Gg/year) a decade earlier. This study also established that these emissions
contributed significantly to atmospheric concentration of GHGs from region. Pollution-
income relationship among the urban household is monotonically decreasing for local
pollution. The global pollution, on the other hand, is monotonically increasing among both
rural and urban households reflecting carbon intensive energy use. Kavi Kumar (2011) also
given per capita household CO2 emission that is, 140 kg per year for rural and 350 kg per
year for urban.
Objectives:
It is important to analyse household energy consumption patterns in order to formulate
policies for promotion of sustainable energy use. This paper aims to do so by quantitatively

4
analysing determinants of energy consumption of household and CO2 emission; the main
objectives are as follows,
To understand the differentials of household energy use pattern by fuel type for cooking
and lighting
To determine the influencing factors for choosing household fuels for cooking and
lighting
To understand environmental impact of household energy use in terms of CO2
emission.
Data and Methodology: This paper is constructed on a vital consumer survey, carried out by
National Sample Survey Organisation (NSSO) of Government of India between July 2009
and June 2010 (66th Round NSSO, 2010). Total 100855 number of sampled household were
surveyed for NSS 66th round, out of which the sample size was 59119 and 41736 for rural
and urban households respectively. In the survey the respondents were asked to state their
energy consumption for different energy types and also included home grown fuel sources for
traditional fuels in energy for expenditure terms in the past 30 days. The NSSO survey
involves the energy questionnaire every five years. It was the eighth survey, the seventh
having been conducted during 2004-05. The energy consumption data from previous surveys
have already been evaluated widely in a number of papers (Ekholm (2010); Pachuri (2007);
Bhattacharyya (2006); and Gangopadhyay et al. (2005)), and a more comprehensive analysis
can be noted. Here we used the most recent data i.e 2009-10 to understand the household
energy consumption in India. In order to know the level of inequality in living standards of
population or proportion living in poverty, NSSO survey data calculate monthly per capita
expenditure (MPCE) by using consumption expenditure of goods and services. So splitting
this data into 20 consumer groups- labelled: R1-R10 for rural and U1-U10 for urban
population, with expenditure rising with the group number-consisting of expenditure deciles
for the urban and rural populations are being done. Cross tabulation as statistical tool is
applied for the analysis.
The emission coefficients are sourced from Venkataraman et al. (2010), Mestl and Eskeland
(2009) and Parikh J. et al. (2009). The emission coefficients by fuel type used in this paper
are 1.614 and 3.102 tons of CO2 per tons of coal and petroleum products, respectively, and
0.0021 tons of CO2 per cubic metre of natural gas. These coefficients are arrived by
considering emission by fuel type in tons per Giga joule (tons/GJ) after adjusting for the
calorific value of the fuel types used in India. For the emissions only one GHG are

5
considered namely, carbon dioxide (CO2). While calculating the GHG emission from
firewood it is the common practice to consider it as a carbon-neutral fuel. However, given the
significant supply-demand gap reported for firewood in various wood-balance studies, the
present study assumes a non-renewability factor of 10% for firewood and hence treat it as a
net emitter of CO2. A similar approach is followed by other studies (Venkataraman et al.,
2010). Coal based electricity production in India had emission factor of approximately
1214gCO2/KWh at generation in 2003-05 (IEA, 2007). However, not all electricity is from
coal, and the average for India in 2003-05 was 929gCO2/kWh. By considering distribution
losses, we use 1068gCO2/kWh delivered electricity.
Patterns of household energy use:
There are many pull factors of India’s development; one important factor is energy use. Per
capita energy consumption in India is far less as compare to other countries around the world
(World Bank 2006). Furthermore, there are large differences in energy use between urban
and rural areas. Following graphs and tables highlights India’s current patterns of household
energy use.
Biomass is used as the primary cooking
fuel in 58.68 % of the household. As seen
from fig. 1, 82% of rural household use
biomass for cooking (biomass76%
firewood and chips, 6 % dung cake). LPG
id used by 12% and kerosene 0.79%. In the
urban areas the situation is different. LPG
is the most widely cooking fuel used by
64.6% of households, followed by biomass
19% and kerosene 6.4%.
Of all the households in India, 74% have access to electricity, 66% of the rural household and
94% of the urban. Lighting is with electricity in household with access to electricity, and
primarily with kerosene for those without electricity.
In India, households are not completely depends on one type of energy for their daily cooking
and lighting purpose. If we see the urban area, most of the households are using LPG for their
0%
10%
20%
30%
40%
50%
60%
70%
80%
90%
100%
Rural Urban
no cookingarrangementothers
electricity
kerosene
charcoal
dung cake
gobar gas
LPG
firewood andchipscoke, coal
Figure 1: Cooking fuels used in rural and urban India, 2009-10

6
1.4
17.1
40.7
29.3
9.7
1.6 0.2 0.0
one two three four five six seven eight
cooking and electricity for lighting. On the
other side in the rural area, poor households are
using firewood for daily cooking and water heating, but if any guest comes to their home they
use kerosene stove to serve tea to guest and electricity for their lighting house. Figure 2
represents the household response for types of energy use for cooking and lighting. Most of
the households around 87 per cent replied two-
four types of energy are using. Highest
numbers of households, 40.7 per cent are using
three types of energy. 11.5 Per cent households
are using five or more types of energy for
cooking and lighting.
Though the households are using more than
one type of fuels but mostly prefer only one cooking fuel that showed in figure 3. It shows
that, primary source of cooking dominated by location that is, household situated in rural or
urban areas; rural area dominated by biomass and urban area by LPG fuel for cooking.
Among the states, in Chhattisgarh, Gujarat, Madhya Pradesh, Orissa and Rajasthan around 90
per cent rural households are using biomass for fulfil their need of the cooking. On the other
hand in urban areas Himachal Pradesh, Jammu and Kashmir and Maharashtra, around 80 per
cent households are using LPG for cooking.
Figure 3. Distribution of source of primary cooking fuels across states: 2009-10
0%
20%
40%
60%
80%
100%
AP Asm Bih Chtg Guj Har HP J&K Jhr Kar Ker MH MP NE* Ori Pun Raj TN UP Utrn WB
electricity LPG kerosene other fuel biomass
Rural
Figure 2: Percentage of households by number of types energy use for cooking and lighting in India, 2009-10

7
Table 1, in urban India, penetration of LPG has been very impressive with all the regions
having 60 or more than 60 percent of the households consuming clean fuel for cooking in the
year 2009-10. Among the region, urban 38 percent household from east region using unclean
fuel followed central (33%), west region using lowest 12.6 percent. Further, in all the regions
in rural areas, around 80 percent household using unclean fuel for cooking.
Table1: Distribution of source of primary cooking fuels by region: 2009-10
Rural (%) Urban (%)
Rural Unclean
fuel
Clean fuel Others Unclean
fuel
Clean fuel Others
South 77.6 22.4 .1 21.1 78.7 .2
West 79.3 20.4 .3 12.6 85.6 1.7
North 80.2 19.5 .3 16.3 83.5 .1
North east 83.5 16.5 .0 21.8 78.1 .1
Central 91.2 6.3 2.5 32.9 66.5 .6
Cast 88.0 4.6 7.4 37.9 58.9 3.2
Unclean fuels: firewood, charcoal, dunk cake, coke/coal
Clean fuels: LPG, kerosene, gobar gas, electricity
Relationship between fuel use and Income:
Here we consider monthly expenditure is a proxy of income. Figure 5 shows that, rural area is
dominated by solid fuel for cooking. Around 80 per cent households belonging from first
seven expenditure class (R1-R7) from rural area are using solid fuel (fire chips, dung cake,
charcoal, etc) for their cooking. Only 40 per cent households of highest expenditure class
using LPG as their primary cooking fuel. If we see urban trend by expenditure classes more
than 60 per cent of households are using solid fuel for their cooking in lowest (U1 and U2)
classes. Around 80 percent of households of expenditure classes (U7-U10) using clean fuel
0%
20%
40%
60%
80%
100%
AP Asm Bih Chtg Guj Har HP J&K Jhr Kar Ker MH MP NE* Ori Pun Raj TN UP Utrn WB
electricity LPG kerosene other fuel biomass
Urban

8
for cooking. An expenditure classes and use of clean fuel is positively associated with each
other. As expenditure increases use of clean fuel for cooking is also increases. Here one thing
have to write that, most of the biomass consumed in rural areas is non-cash, i.e., collected for
free. This is independent of income deciles. Monthly per capita expenditure on fuel also
varies by expenditure classes that shown in figure 6. In rural area majority of the household
of first seven classes spend 50-100 rupees per month per individual on fuel. Highest three
classes (R8-R10) spend more than 100 rupees on fuel. In urban areas more than 150 rupees
spend on fuel by more than 60 per cent household in higher expenditure classes (U8-U10).
Very few households of urban expenditure classes spend less than 50 rupees.
Figure 4. The share of different forms of primary cooking fuel in household energy consumption for expenditure
classes, 2009-10
Figure 5. Proportion of households by monthly per capita expenditure on fuel, 2009-10
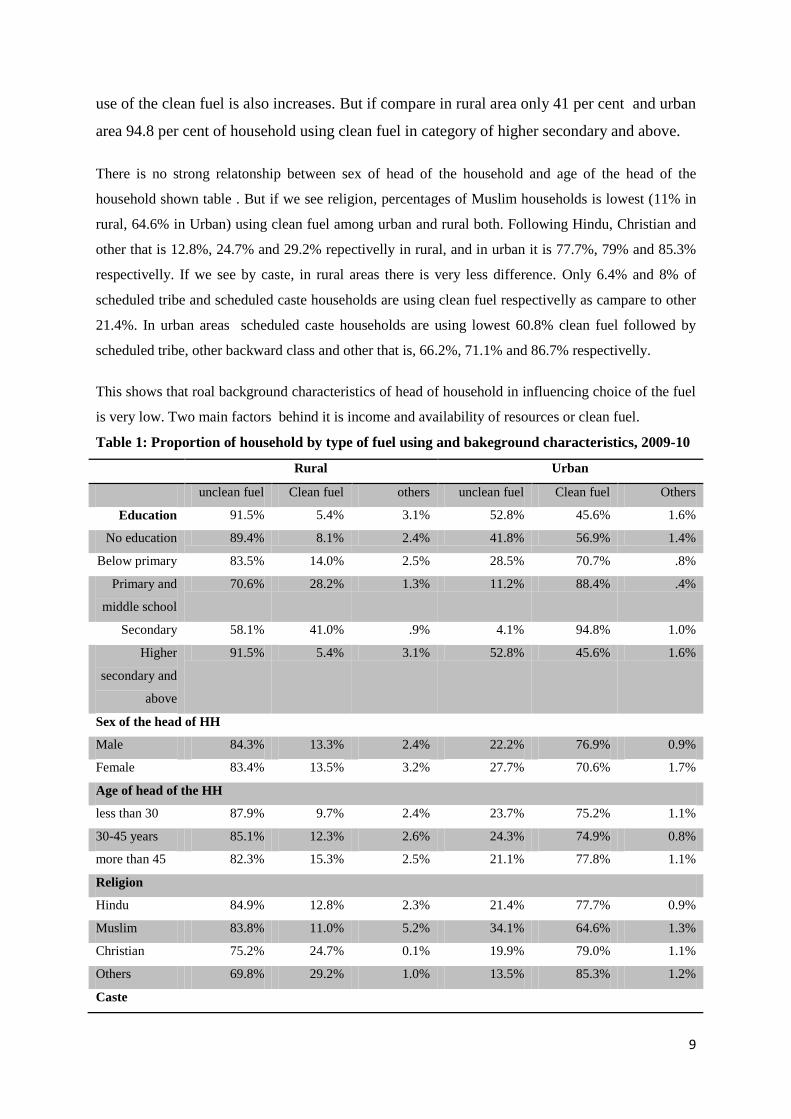
Background characteristics type of fuel use:
Table 2 represent the relationship between various background characteristics and household
fuel choices. Education of head of the household and type of fuel use is positively associated
with each other. Both in rural and urban area, as education of head of the household increases
0%10%20%30%40%50%60%70%80%90%
100%
R1 R2 R3 R4 R5 R6 R7 R8 R9 R10
Axi
s Ti
tle
Expenditure Class
Rural
no cooking arragement otherelectricity kerosenecharcoal dung cakegobar Gas LPGfirewood and chips coke,coal
0%10%20%30%40%50%60%70%80%90%
100%
U1 U2 U3 U4 U5 U6 U7 U8 U9 U10
Axi
s Ti
tle
Expenditure class
Urban
no cooking arragement otherelectricity kerosenecharcoal dung cakegobar Gas LPGfirewood and chips coke,coal
0%
20%
40%
60%
80%
100%
R1 R2 R3 R4 R5 R6 R7 R8 R9 R10less than Rs.50 Rs.50-Rs.100
Rs.100-Rs.150 more than Rs.150
Rural
0%
20%
40%
60%
80%
100%
U1
U2
U3
U4
U5
U6
U7
U8
U9
U1
0
less than Rs.50 Rs.50-Rs.100
Rs.100-Rs.150 more than Rs.150
Urban
9
use of the clean fuel is also increases. But if compare in rural area only 41 per cent and urban
area 94.8 per cent of household using clean fuel in category of higher secondary and above.
There is no strong relatonship between sex of head of the household and age of the head of the
household shown table . But if we see religion, percentages of Muslim households is lowest (11% in
rural, 64.6% in Urban) using clean fuel among urban and rural both. Following Hindu, Christian and
other that is 12.8%, 24.7% and 29.2% repectivelly in rural, and in urban it is 77.7%, 79% and 85.3%
respectivelly. If we see by caste, in rural areas there is very less difference. Only 6.4% and 8% of
scheduled tribe and scheduled caste households are using clean fuel respectivelly as campare to other
21.4%. In urban areas scheduled caste households are using lowest 60.8% clean fuel followed by
scheduled tribe, other backward class and other that is, 66.2%, 71.1% and 86.7% respectivelly.
This shows that roal background characteristics of head of household in influencing choice of the fuel
is very low. Two main factors behind it is income and availability of resources or clean fuel.
Table 1: Proportion of household by type of fuel using and bakeground characteristics, 2009-10
Rural Urban
unclean fuel Clean fuel others unclean fuel Clean fuel Others
Education 91.5% 5.4% 3.1% 52.8% 45.6% 1.6%
No education 89.4% 8.1% 2.4% 41.8% 56.9% 1.4%
Below primary 83.5% 14.0% 2.5% 28.5% 70.7% .8%
Primary and
middle school
70.6% 28.2% 1.3% 11.2% 88.4% .4%
Secondary 58.1% 41.0% .9% 4.1% 94.8% 1.0%
Higher
secondary and
above
91.5% 5.4% 3.1% 52.8% 45.6% 1.6%
Sex of the head of HH
Male 84.3% 13.3% 2.4% 22.2% 76.9% 0.9%
Female 83.4% 13.5% 3.2% 27.7% 70.6% 1.7%
Age of head of the HH
less than 30 87.9% 9.7% 2.4% 23.7% 75.2% 1.1%
30-45 years 85.1% 12.3% 2.6% 24.3% 74.9% 0.8%
more than 45 82.3% 15.3% 2.5% 21.1% 77.8% 1.1%
Religion
Hindu 84.9% 12.8% 2.3% 21.4% 77.7% 0.9%
Muslim 83.8% 11.0% 5.2% 34.1% 64.6% 1.3%
Christian 75.2% 24.7% 0.1% 19.9% 79.0% 1.1%
Others 69.8% 29.2% 1.0% 13.5% 85.3% 1.2%
Caste

10
Scheduled
Tribes
93.0% 6.4% 0.6% 33.3% 66.2% 0.4%
Scheduled
Castes
89.4% 8.0% 2.6% 38.1% 60.8% 1.0%
OBC 84.7% 13.3% 2.0% 28.4% 71.1% 0.5%
Others 74.6% 21.4% 4.0% 11.8% 86.7% 1.4%
Per capita energy consumption:
It is essential to note, however, that for biomass, kerosene, and LPG, our estimates record
total energy input, not useful energy, whereas electricity is given as useful energy. In
emission calculations for electricity, however, loss of energy in power production and
transmission is accounted for. Thus, when we discuss GHG’s the CO2 emission are from
production, i.e., before efficiency and transmission losses.
Fig 7 shows the amount of energy consumed per capita per month in rural and urban India by
income deciles. From the figure we see that biomass consumption increases as the population
get richer in the rural areas, whereas biomass consumption in urban areas decreases with
wealth. We the overall monthly per capita fuel consumption in rural areas much higher than
in the urban areas, with the exception of the 10 per cent richest of the urban population. This
is probably because rural energy consumption is dominated by low-cost biomass, combusted
in stoves with low combustion efficiency. Hence, the amount of energy needed for cooking
the same meal is much higher for biomass users than for the kerosene or LPG users.
There is no much variation in consumption of the kerosene among the expenditure deciles in
urban and rural areas. LPG is the fuel of choice by the well off, the consumption is increases
monotonically with increasing wealth. In the urban areas, the consumption is increasing from
less than 5% in the poorest 10% to being the most used fuel in richest 40 per cent. In the rural
areas, we see that LPG is used by only richest household, and then at level comparable to the
poor urban household. The limited use of LPG in the rural areas is a function of both price
and availability. All economic classes of rural areas shows electricity consumption but it is
only for fulfil their basic need of lighting the space. But if we see the urban areas, electricity
used for television, air conditioner, etc along with the lighting the space. Therefore electricity
is used by the richest as luxury goods to a significant amount in urban richest.

11
Figure 6. Rural (R1-R10) and urban (U1-U10) per capita fuel consumption (MJ/Month), in 2009-10
Figure 7. Per capita fuel consumption (MJ/Month) by Rural and urban for major states of India, in 2009-10
Figure 8 represents the per capita energy consumption is highest for rural than urban areas of
all the states, but difference between rural and urban varies by state to state. Reason for that is
same as stated above i.e urban population use more efficient fuel as compare to rural. Rural
people of Karnataka, Kerala, Orissa, Assam, and Uttaranchal consume 600MJ or more fuel in
a month on the other hand states Uttar Pradesh, Bihar and Chhattisgarh consume less than
300MJ per month. For urban areas, Kerala and Orissa consume highest i.e, more than
400MJ/month. States like Uttar Pradesh, Bihar, Chhattisgarh and Madhya Pradesh consume
less energy as compare to other states and urban–rural difference is also low because these
states are less developed. Socio-economic conditions of rural people are not very different as
0
100
200
300
400
500
600
R1 R2 R3 R4 R5 R6 R7 R8 R9 R10 U1 U2 U3 U4 U5 U6 U7 U8 U9 U10
Coal/coke
Kerosene
LPG
Electricity
Biomass
Per
cap
ita
fuel
co
nsu
mp
tio
n (
MJ/
mo
nth
)
Monthly per capita expenditure decile
0.0
100.0
200.0
300.0
400.0
500.0
600.0
700.0
800.0Rural Urban
Per
cap
ita
fuel
co
nsu
mp
tio
n (
MJ/
mo
nth
)

12
urban population but we say that these people are more vulnerable than other because these
sates use more inefficient solid biomass fuel still consume less energy. Situation of Gujarat,
Maharashtra, Andhra Pradesh, Tamil Nadu and West Bengal is reverse; these sates are
developed and large percentages of rural household also use clean and efficient energy.
CO2 emission:
Though residential energy consumption contributes negligible in overall CO2 emission in
India but still it is very important issue because it directly expose to household members.
Figure 9 gives the distribution across household of direct or indirect CO2 emission due to
direct use of fossils fuels and LPG in cooking and use of kerosene and electricity in lighting
and for electronic appliances, etc. emission due to direct use of fuels by rural household are
low and vary between 22 and 179 kg per person. In urban areas, the figures vary between 44
and 690 kg per capita. The substantial difference in the emission of urban top class U10 from
the rest of the population is primarily due to use of electronic appliances by this class. If we
use the ratio of per capita emission of top 10 per cent to bottom 10 per cent, it is 16:1 in urban
areas while it is about 8:1 in rural areas.
Figure 8. Direct and indirect CO2 Emission due to household fuel used for cooking, lighting and electronic appliances by
expenditure classes, 2009-10
Overall per capita household CO2 emission in a year for India is 61 kg and 161 kg for rural
and urban respectively; shows in fig.10. It varies by state to state and urban areas emit greater
per capita CO2 than rural in all states of India. Tamil Nadu emits highest CO2 in urban and
rural both (140 kg for rural and 268kg for urban) followed by Punjab (136 and 226 kg for
rural and urban respectively). Bihar emits least CO2 followed Uttar Pradesh, Assam and
Rajasthan for urban rural both. There are seven states which emit per capita CO2 more than
the average for urban India i.e. 161kg and for rural, that are twelve states emit more than
21.7 29.8 37.8 48.3 53.6 65.8 74.1 93.8 113.7 178.6
43.5 68.6 90.5 118.8 142.5 178.8
250.0 279.1
363.6
690.1
0.0
100.0
200.0
300.0
400.0
500.0
600.0
700.0
800.0
EC1 EC2 EC3 EC4 EC5 EC6 EC7 EC8 EC9 EC10
Rural Urban
CO
2 e
mis
sio
ns
(K
g p
er C
apit
a in
a y
ear)
Expenditure class

13
Indian average (61kg). Electricity contributes higher in urban CO2 emission followed by
LPG. In rural areas consumption of electricity and LPG is low therefore per capita emission
is lower than urban.
Figure 9. Per capita direct and indirect CO2 Emission due to household fuel used for cooking, lighting and electronic
appliances in a year by Major States in India, 2009-10
Discussion and conclusion: This study based on unit record data of the 66th
round of the
National Sample Survey corresponding to the year 2009-10 assessed the pattern of household
energy use and household CO2 emission. Irrespective to other characteristics, around 82 per
cent of rural household and 20 per cent urban relied on solid cooking fuel. Overall monthly
per capita fuel consumption in rural areas much higher than in the urban areas, with the
exception of the 10 per cent richest of the urban population. Because inefficient (biomass
fuel) fuel use; i.e 468 and 306 MJ/month for rural urban respecti vely for overall India.
Income and location (urban-rural) are main determinants of choice of cooking fuels.
Education of head of the household also positively influences the choice of clean fuels.
Though income increases, household is shifting to better option but it not completely, first
prefer mix fuel. Among the all household 41% using three types of fuel for fulfil their need of
lighting and cooking in India.
It also analyses carbon dioxide emissions by using emission coefficient by fuel type. Result
shows, per capita CO2 emission is 16 times higher for highest expenditure class as compare
to lowest class in urban and for rural it is 8 times higher. Urban emits higher than rural for all
states and amount is varies by state to state. Improving the scenarios for modern energy use is
an essential requirement for improving the situations of poor household in India. In precise,
providing access to modern cooking fuels to such population would reduce their exposure to
0.0
50.0
100.0
150.0
200.0
250.0
300.0Rural Urban

14
harmful particulate matter, save time and deforestation. It calls for immediate interventions
to protect the rural and poor households from their daily exposure of such risk factors.
From the analysis there are two strong points that are, income or their proxy monthly
expenditure and location that is urban or rural played very significant role in choice of
cooking fuel, amount energy consumption and CO2 emission.
Limitations: All the results given here are based on sample data so may be it cannot be
generalised for whole India and states. Here we only estimate CO2 emission due to
household energy consumption for cooking, lighting and electronic appliances not included
fossils fuel or petroleum products use for personal household vehicles for travelling, that
emits significantly large amount of CO2. We are also not estimated emission of particulate
Matter (PM particles) due to combustion of solid fuel, which adversely affect the health of
household members.
References:
Balakrishnan, K., Mehta, S., Kumar , P., Ramaswamy, P., Sambandam, S., Kumar, K.S., and Smith ,
K.R (2004): Indoor Air Pollution Associated with Household Fuel Use in India. ESMAP, World
Bank.
Bhattacharyya, S (2006) Energy access problem of the poor in India: is rural electrification a
remedy? Energy Policy 34 3387-3397
Farsi,M., Filippini, M., and Pachauri, S ( 2007) Fuel choices in urban Indian households.
Environment and Development Economics 12(6): 757-774.
Gnagopadhyay, S., Ramaswami, B., Wadhwa, W (2005) Reducing subsidies on household fuel in
India: how will it affect the poor? Energy Policy 33 22326-2336.
IEA. (2004) World energy outlook 2002. Paris, France: OECD/IEA 2002.
IEA. (2007) World energy outlook 2007. Paris, France: OECD/IEA 2006.
Kumar, K.S.K., Viswanathan, B (2011) Household level pollution in India: patterns and projections.
Madras School of Economics, Working paper, 58/2011.
Leach, G (1992) The energy transition. Energy Policy 20 (2), 116-123.
Masera, O.R., Saatkamp, B.D., Kammen, D.M (2000) From linear fuel switching to multiple cooking
strategies: a critique and alternative to the energy ladder model. World Development 28 (12), 2083-
2103
Mestl, E.A.S, and Eskeland, G.S (2009) Richer and Healthier, but not Greener? Choices Concerning
Household Energy use in India. Energy Policy, 37, 3009–19.
Murthy, N.S., Panda, M., Parikh. J (1997) Economic development, poverty reduction and carbon
emission in India. Energy economics, 19(3).

15
Pachauri, S (2004a) On measuring energy poverty in Indian households. World Development 32 (12),
2083-2104.
Pachauri, S (2007) An energy analysis of household consumption. In: Changing Patterns of Direct
and Indirect Use in India. Springer.
Pachauri, S., Jiang, L (2008) The household energy transition in India and China. Interim Report 08-
009, International Institute for Applied system Analysis.
Pachuri, S (2004b) An analysis of cross-sectional variation in total household energy requirements in
India using micro survey data. Energy Policy 32, 1723-1735
Parikh, J., Balakrishnan, K., Laxmi, V., Biswas, H (2001) Exposure from Cooking with bio-fuels:
Pollution Monitoring and Analysis for Rural, Tamil Nadu. Energy-The International Journal , 26 (10),
949–962.
Parikh, J., Gokarn, S (1993) Climate change and India’s energy policy options. Global Environmental
Change, 3(3).
Parikh, J., Panda, M., Ganesh-Kumar, A., and Singh V (2009) Co2 emission structure of Indian
economy. Energy , doi:10.1016/j.energy.2009.02.014.
Sharma, S.K., Bhattaacharya, S., Garg, A (2006) Greenhouse gas emission from India: a perspective.
Current Science, 90(3)
TERI (The Energy and Resources Institute). (2002) TERI energy directory and yearbook 2002-03
(TEDDY). New Delhi, India: TERI.
Venkataraman, C., G. Habib, A. Eiguren-Fernandez, A.H. Miguel, and S.K. Friedlander (2005)
Residential Biofuels in South Asia: Carbonaceous Aerosol Emissions and Climate Impacts. Sicence,
Vol. 307.
Venkataraman, C., Sagar, A.D., Habib, G., Lam, N., Smith, K.R (2010) The Indian National Initiative
for Advanced Biomass Cookstoves: The benefits of clean combustion. Energy for
SustainableDevelopment, 14, 63–72.
Viswanathan, B., and Kumar, K.S.K (2005) Cooking fuel use patterns in India: 1983–2000. Energy
Policy 33(8), 1021–1036.