housing & economic development in the commonwealth
DESCRIPTION
Housing & Economic Development in the Commonwealth. Kirk Sykes President, Urban Strategies for America Fund Barry Bluestone Dean, School of Social Science, Urban Affairs, and Public Policy, Northeastern University Ted Carman - PowerPoint PPT PresentationTRANSCRIPT
Housing & Economic Development in the Commonwealth
Kirk Sykes President, Urban Strategies for America Fund
Barry Bluestone Dean, School of Social Science, Urban Affairs, and Public Policy, Northeastern University
Ted Carman President, Concord Square Development Corporation
Progressive Business Leaders NetworkOctober 26, 2007

The Economic State of the Commonwealth

-3.0%
-2.0%
-1.0%
0.0%
1.0%
2.0%
3.0%
4.0%
5.0%
6.0%
7.0%
Jan-9
3
Jan-9
4
Jan-9
5
Jan-9
6
Jan-9
7
Jan-9
8
Jan-9
9
Jan-0
0
Jan-0
1
Jan-0
2
Jan-0
3
Jan-0
4
Jan-0
5
Jan-0
6
Jan-0
7
US MA
Economic Activity Index: Massachusetts vs. U.S. (1993-2007)
January 1993 – October 2001Leading the Nation
October 2001 – June 2007Lagging the Nation

2,800
2,900
3,000
3,100
3,200
3,300
3,400
3,500
1996 1997 1998 1999 2000 2001 2002 2003 2004 2005 2006 2007
Nu
mb
er
Em
plo
yed
, in
Th
ou
san
ds
Feb 2001 - Dec 2003: -205,100
Dec 2003 - Dec 2006: +79,100
Jan 2007 - Aug 2007: +25,800
Feb 2001: 3,384.0
Dec 2003: 3,178.9
Aug 2007: 3,286.8
Jan 1996: 2,997.9 Jan 1996 - Feb 2001: + 386,100
Total Massachusetts Non-Farm Employment
Employment in Massachusetts
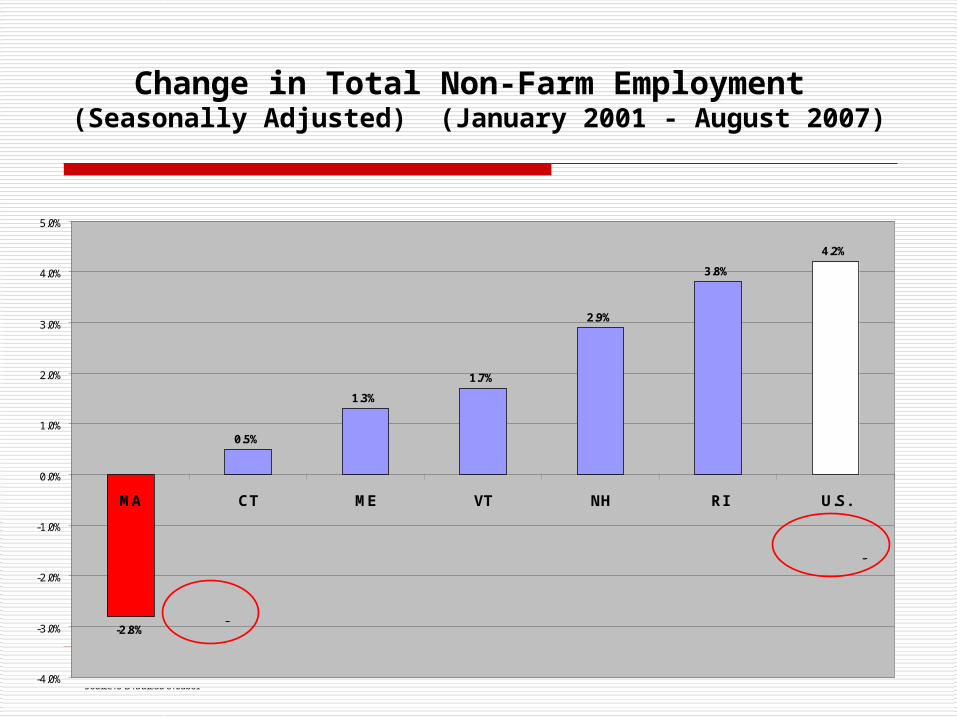
-2.8%
0.5%
1.3%
1.7%
2.9%
3.8%
4.2%
-4.0%
-3.0%
-2.0%
-1.0%
0.0%
1.0%
2.0%
3.0%
4.0%
5.0%
MA CT ME VT NH RI U.S.
-95,900 jobs
+5,566,000 jobs
Source: U.S. Bureau of Labor
Change in Total Non-Farm Employment (Seasonally Adjusted) (January 2001 - August 2007)
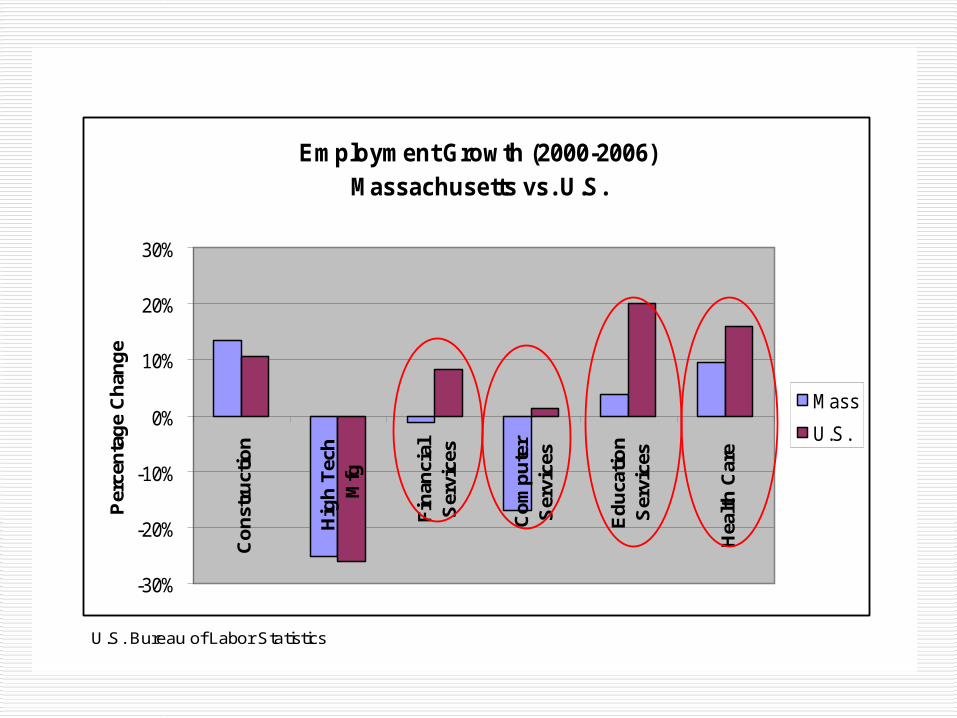
Employment Growth (2000-2006) Massachusetts vs. U.S.
-30%
-20%
-10%
0%
10%
20%
30%C
on
stru
ctio
n
Hig
h T
ech
Mfg
Fin
anci
alS
ervi
ces
Co
mp
ute
rS
ervi
ces
Ed
uca
tio
nS
ervi
ces
Hea
lth
Car
e
Per
cen
tag
e C
han
ge
Mass
U.S.
U.S. Bureau of Labor Statistics

• Between 2000 and 2006, the population of Massachusetts increased by only 74,000 (1.2%) – the slowest increase in New England.
• Since 2000, Massachusetts has suffered a net domestic out-migration of over 280,000 residents.
• This outflow of people has been softened only somewhat by the arrival of about 186,000 foreign immigrants.
Population Trends

Massachusetts Population
5737.0
6016.4
6349.1 6394.8 6411.6 6417.6 6407.4 6398.7 6402.5
5000.0
5200.0
5400.0
5600.0
5800.0
6000.0
6200.0
6400.0
6600.0
1980 1990 2000 2001 2002 2003 2004 2005 2006
Popu
latio
n (in
thou
sand
s)
U.S. Bureau of the Census
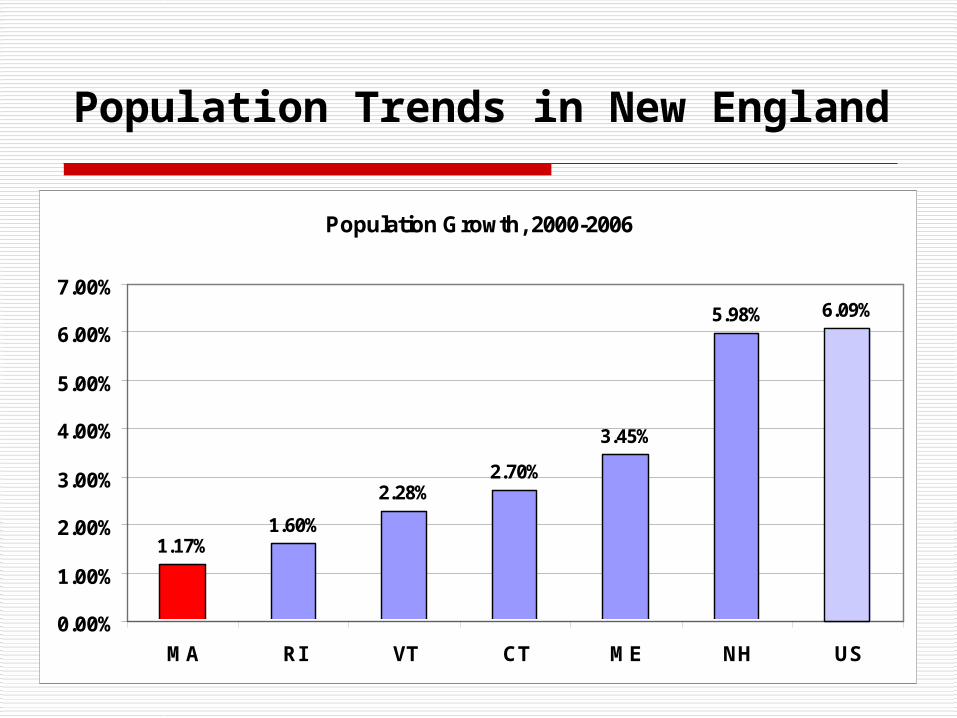
Population Trends in New England
Population Growth, 2000-2006
1.17%1.60%
2.28%2.70%
3.45%
5.98% 6.09%
0.00%
1.00%
2.00%
3.00%
4.00%
5.00%
6.00%
7.00%
MA RI VT CT ME NH US

33,292 33,347 31,785 29,041 26,51530,285
-22,892
-39,506
-48,514
-61,980 -60,053
-49,528
-80,000
-60,000
-40,000
-20,000
0
20,000
40,000
2000-2001 2001-2002 2002-2003 2003-2004 2004-2005 2005-2006
Foreign Migration Internal Migration
Immigration & Net Domestic Migration
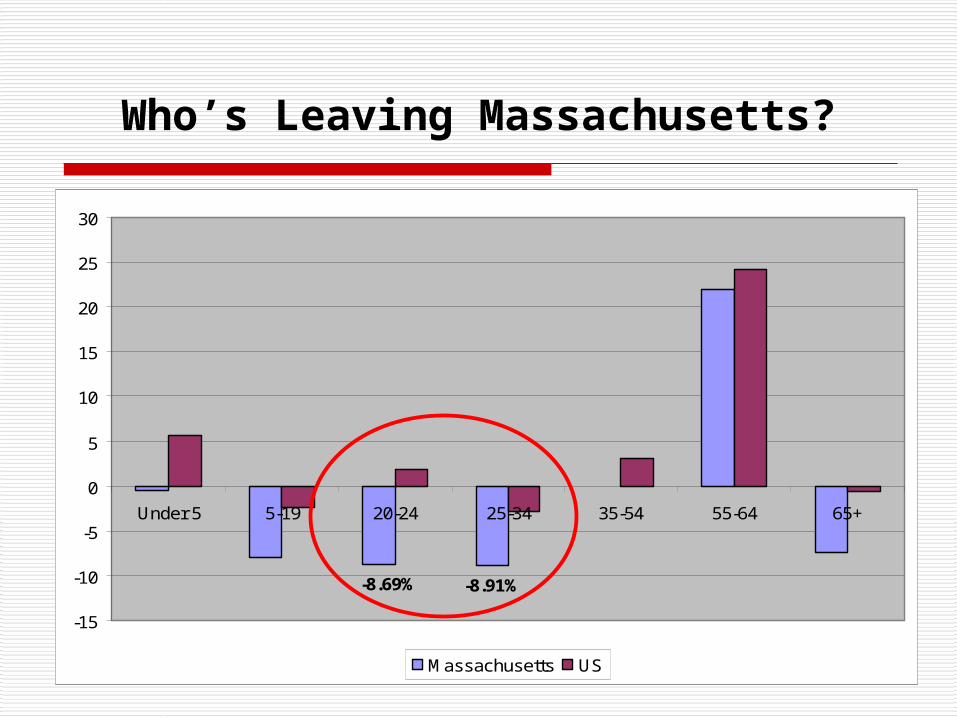
-8.91%-8.69%
-15
-10
-5
0
5
10
15
20
25
30
Under 5 5-19 20-24 25-34 35-54 55-64 65+
Massachusetts US
Who’s Leaving Massachusetts?
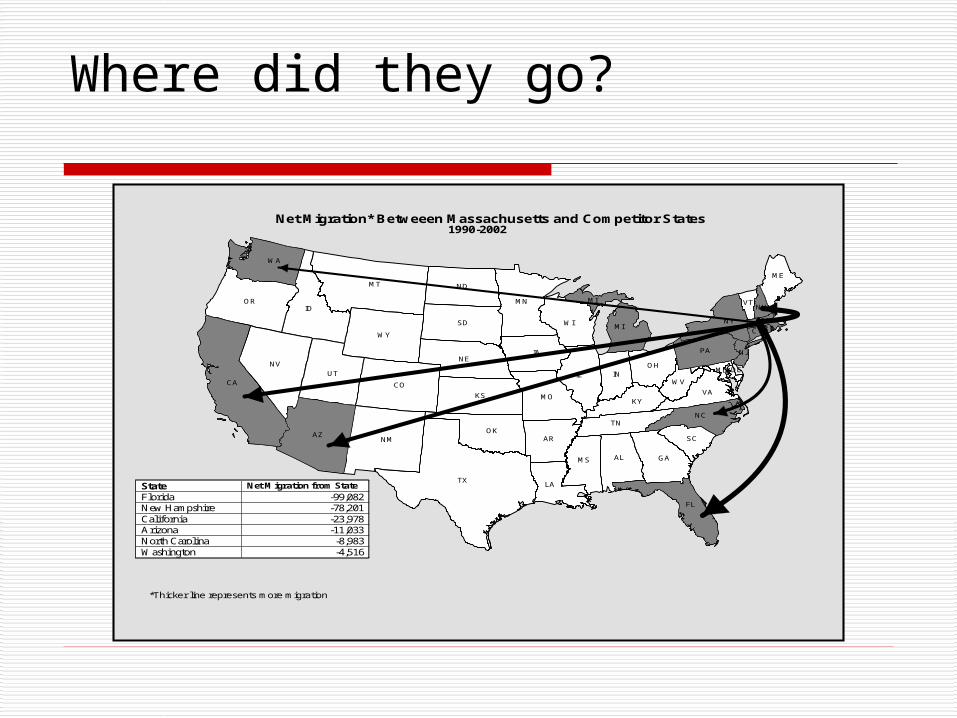
Where did they go?
TX
CA
MT
AZ
ID
NV
NM
CO
IL
OR
UT
KS
WY
IA
SD
NE
MN
ND
FL
OK
WI
MO
AL
WA
GA
AR
LA
MI
IN
NY
PA
NC
MS
TN
KYVA
OH
SC
ME
WV
MI VTNH
MD
NJ
MA
CT
DE
RI
Net Migration* Betweeen Massachusetts and Competitor States1990-2002
*Thicker line represents more migration
State Net Migration from State
Florida -99,082 New Hampshire -78,201 California -23,978 Arizona -11,033 North Carolina -8,983 Washington -4,516

Stagnant Incomes/Rising Poverty in Greater Boston
Year 2000 2002 2004 2005 % Change 2000-2005
Real Median Household Income
$62,481 $65,569 $64,060 $62,462 -0.03%
Real Median Homeowner Income
$80,995 $82,925 $80,936 $81,886 1.10%
Real Median Renter Income
$38,780 $39,602 $39,762 $35,748 -7.82%
Families Below the Poverty Line
59,913 58,882 68,687 68,038 +13.56%

$0
$50,000
$100,000
$150,000
$200,000
$250,000
$300,000
$350,000
$400,000
$450,000
1986
1987
1988
1989
1990
1991
1992
1993
1994
1995
1996
1997
1998
1999
2000
2001
2002
2003
2004
2005
2006
2007*
Pri
ce
Single Family Home Price Condominium Price
1995-2005: +156%
2005-2007: -6%
Slow Growth … But Housing Costs Remain High
Median Price of Single Family Homes and Condominiums
2000-2005: +61%

Effective Rents – Rising Again
$0
$200
$400
$600
$800
$1,000
$1,200
$1,400
$1,600
$1,800
1995 - 2005: +58%
2000 - 2005: +1%2005 - 1Q 2007: +6%
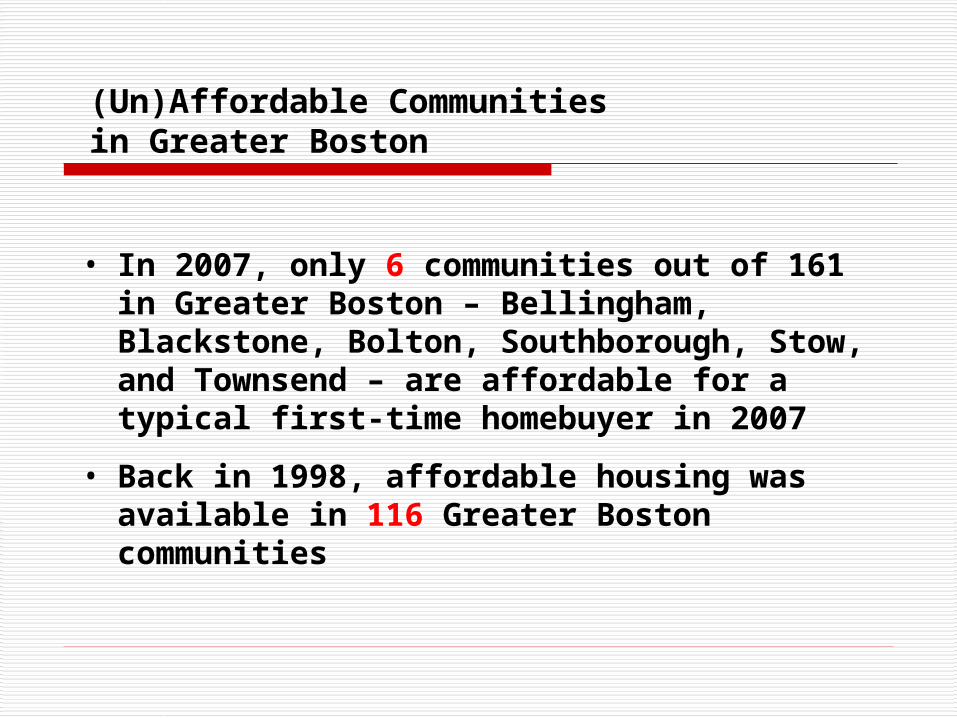
(Un)Affordable Communities in Greater Boston
• In 2007, only 6 communities out of 161 in Greater Boston – Bellingham, Blackstone, Bolton, Southborough, Stow, and Townsend – are affordable for a typical first-time homebuyer in 2007
• Back in 1998, affordable housing was available in 116 Greater Boston communities

Year
Communities Affordable to Median Income Homebuyer Purchasing Median Priced
House (20% down payment)
Percent Affordable
Communities
Communities Affordable to First Time Homebuyer Earning 80% of Median Purchasing House Priced
at 80% of Median (10% down payment)
First Time Homebuyer
Percent Affordable
Communities
1998 148 92% 116 72%
2000 101 63% 87 54%
2001 86 53% 42 26%
2002 77 48% 17 11%
2003 59 37% 5 3%
2004 27 17% 1 <1%
2005 19 12% 0 0%
2006 30 19% 1 <1%
2007* 46 29% 6 4%
Summary of Affordability Gap Analysis
Number of Affordable Communities
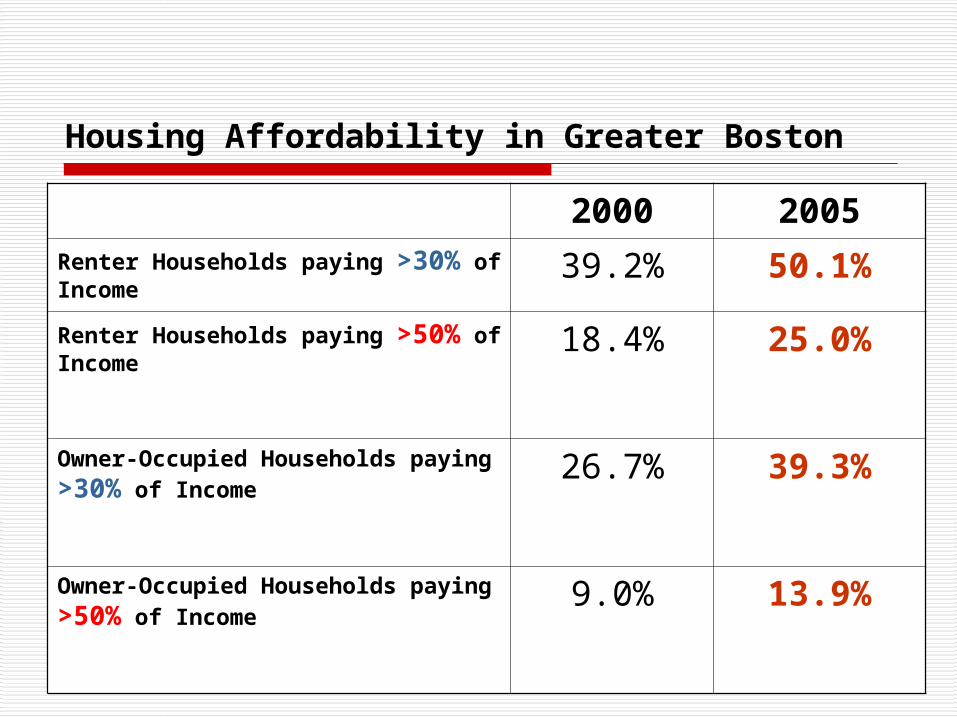
Housing Affordability in Greater Boston
2000 2005Renter Households paying >30% of Income
39.2% 50.1%
Renter Households paying >50% of Income
18.4% 25.0%
Owner-Occupied Households paying >30% of Income
26.7% 39.3%
Owner-Occupied Households paying >50% of Income
9.0% 13.9%
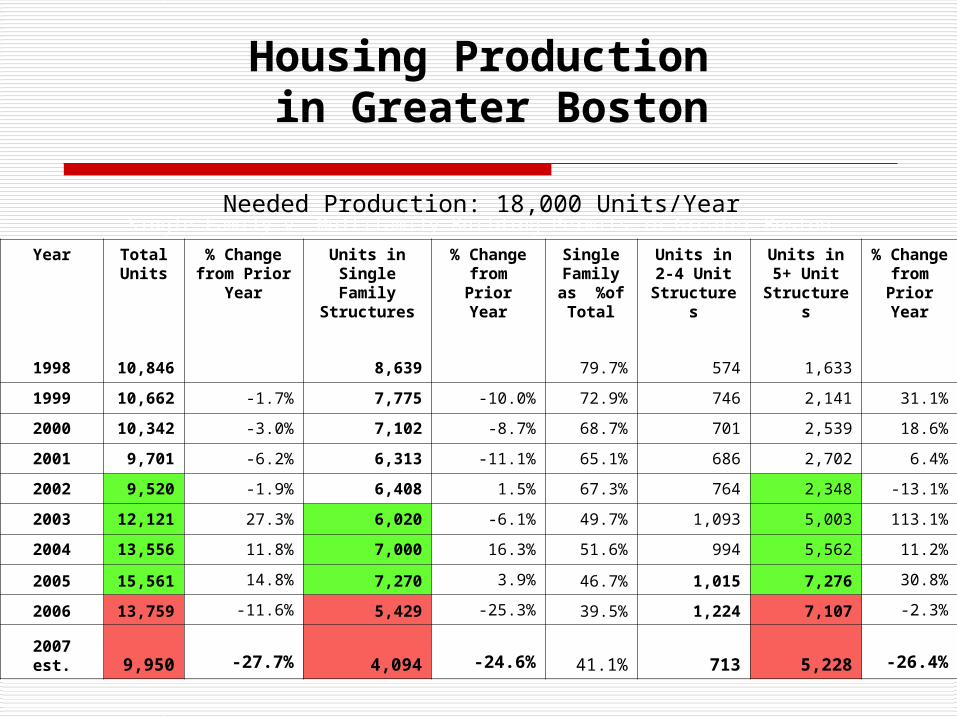
Year Total Units
% Change from Prior
Year
Units in Single Family
Structures
% Change from Prior
Year
SingleFamily as
%of Total
Units in 2-4 Unit
Structures
Units in 5+ Unit
Structures
% Change
from Prior Year
1998 10,846 8,639 79.7% 574 1,633
1999 10,662 -1.7% 7,775 -10.0% 72.9% 746 2,141 31.1%
2000 10,342 -3.0% 7,102 -8.7% 68.7% 701 2,539 18.6%
2001 9,701 -6.2% 6,313 -11.1% 65.1% 686 2,702 6.4%
2002 9,520 -1.9% 6,408 1.5% 67.3% 764 2,348 -13.1%
2003 12,121 27.3% 6,020 -6.1% 49.7% 1,093 5,003 113.1%
2004 13,556 11.8% 7,000 16.3% 51.6% 994 5,562 11.2%
2005 15,561 14.8% 7,270 3.9% 46.7% 1,015 7,276 30.8%
2006 13,759 -11.6% 5,429 -25.3% 39.5% 1,224 7,107 -2.3%
2007 est. 9,950 -27.7% 4,094 -24.6% 41.1% 713 5,228 -26.4%
Single Family v. Multifamily Building Permits in Greater Boston
Housing Production in Greater Boston
Needed Production: 18,000 Units/Year
Housing Costs and Economic Development

Boston Family Budget – 4 Persons
Housing Costs: 7th Highest MSA Child Care: 7th Highest MSA Health Care: 7th Highest MSA Personal Care: 6th Highest MSA Fed/State Tax: 2nd Highest MSA
Total Cost: 1st Highest MSA
Economic Policy Institute, Family Budget Calculator, 2005
Among 304 U.S. Metropolitan Areas

Top Decile: Metro Area Cost of Living
Boston $ 64,656Washington (D.C. portion) $ 61,440Nassau-Suffolk, NY $ 60,780 Stamford-Norwalk, CN $ 60,720 Lawrence (Mass. portion) $ 59,280 New York, NY $ 58,656 Barnstable-Yarmouth, MA $ 58,236 San Francisco, CA $ 57,624 Worcester (Mass. portion) $ 55,704Springfield, MA $ 55,320Minneapolis-St. Paul, MN $ 54,948 Nashua, NH $ 54,852 Santa Cruz-Watsonville, CA $ 53,808Oakland, CA $ 53,412 San Jose, CA $ 52,800 Pittsfield, MA $ 52,632 Rochester, MN $ 51,288
Monmouth-Ocean, NJ $ 50,736San Diego, CA $ 50,088Newark, NJ $ 49,992New Haven-Meriden, CN $ 49,848Honolulu, HI $ 49,824Philadelphia (Pa. portion) $
49,716Boulder-Longmont, CO $ 49,596Bridgeport, CN $ 49,272Manchester, NH $
49,152Santa Rosa, CA $ 48,924Albany-Schenectady-Troy, NY $ 48,900Hartford, CN $ 48,684Trenton, NJ $ 48,576Rochester, NY $ 48,540
Economic Policy Institute: Family Budget Calculator
Universe: 304 U.S. Metro Areas
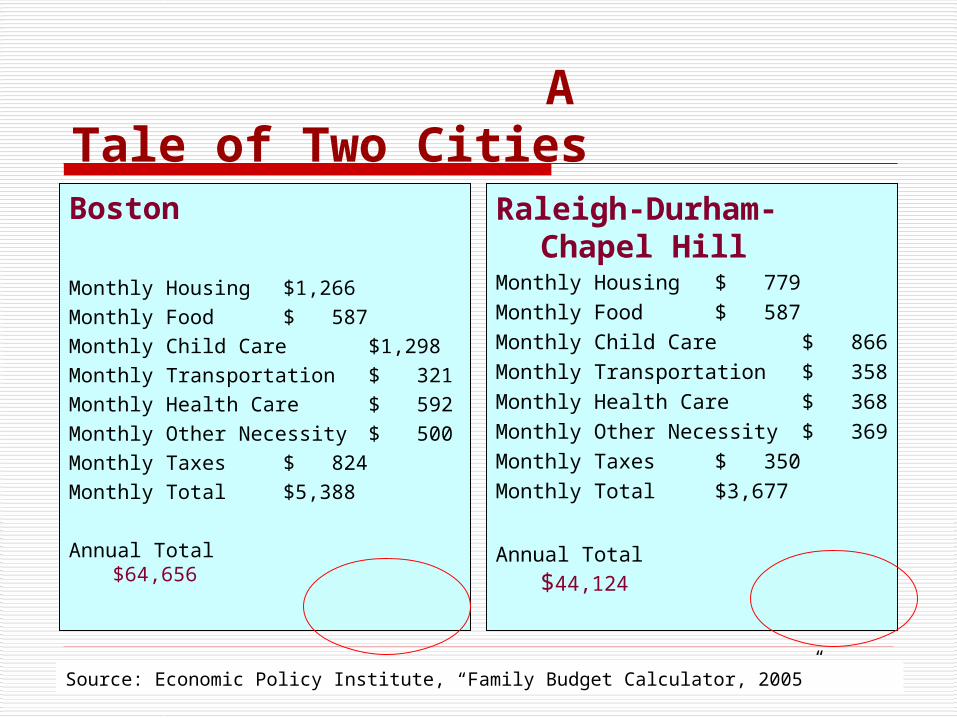
A Tale of Two CitiesBasic Budget2 Parents, 2 Children
Boston
Monthly Housing $1,266
Monthly Food $ 587
Monthly Child Care $1,298
Monthly Transportation $ 321
Monthly Health Care $ 592
Monthly Other Necessity $ 500
Monthly Taxes $ 824
Monthly Total $5,388
Annual Total $64,656
Raleigh-Durham-Chapel Hill
Monthly Housing $ 779
Monthly Food $ 587
Monthly Child Care $ 866
Monthly Transportation $ 358
Monthly Health Care $ 368
Monthly Other Necessity $ 369
Monthly Taxes $ 350
Monthly Total $3,677
Annual Total $44,124
A Tale of Two Cities
Source: Economic Policy Institute, “Family Budget Calculator, 2005”

Employment Growth (%) (2000-2004)
-1.00%
-0.50%
0.00%
0.50%
1.00%
1.50%
2.00%
2.50%
3.00%
3.50%
1 2 3 4 5 6 7 8 9 10
Housing Price Decile
Per
cent
Cha
nge
Low Price High Price
Economic Policy Institute, “Family Budget Calculator, 2005”; U.S. Bureau of Labor Statistics
Universe: 245 U.S. Metro Areas
0.95%
2.91%
2.29%
0.86%
1.53%
0.68%
-0.68%
0.12%
-0.62%
1.49%

Employment Growth (%) (2000-2004)
-1%
0%
1%
2%
3%
1 2 3 4 5 6 7 8 9 10
Cost of Living Decile
Per
cent
Cha
nge
Low Cost High Cost
Economic Policy Institute, “Family Budget Calculator, 2005”; U.S. Bureau of Labor Statistics
-0.21%
0.93%
-0.02%
0.84%1.06%
0.50%
1.09%
1.98%
0.62%
2.53%
Universe: 245 U.S. Metro Areas

Internal Net Migration (%) (2000-2004)
-6.00%
-4.00%
-2.00%
0.00%
2.00%
4.00%
1 2 3 4 5 6 7 8 9 10
Housing Cost Decile
Decil
e P
erc
en
t
Boston MSA (-5.2%)
Economic Policy Institute, “Family Budget Calculator, 2005”; U.S. Bureau of the Census
Universe: 304 U.S. Metro Areas
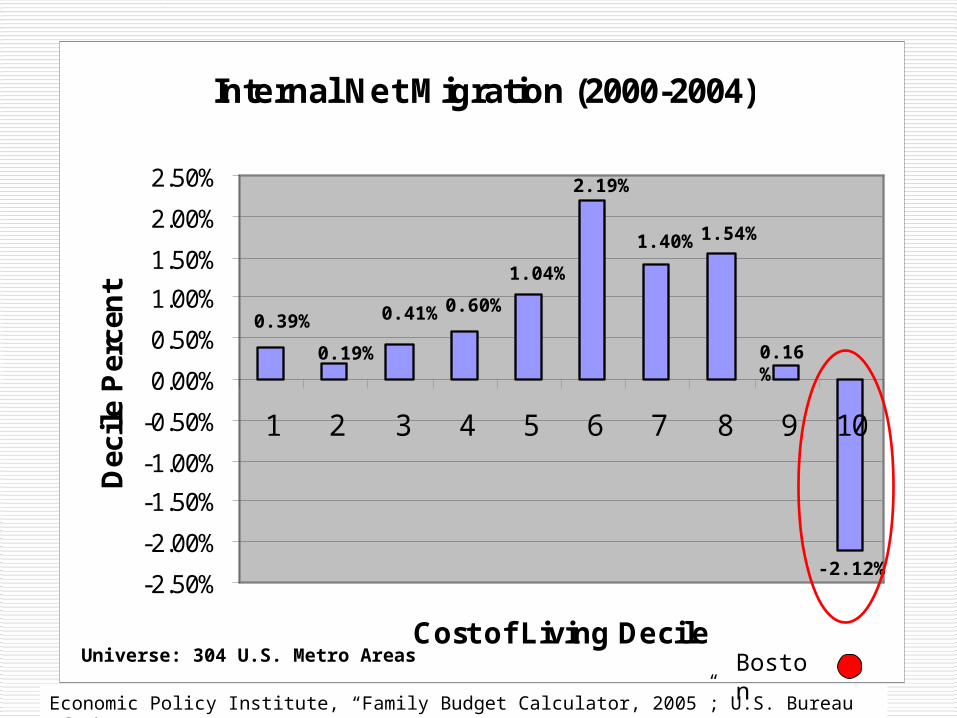
Internal Net Migration (2000-2004)
-2.50%
-2.00%
-1.50%
-1.00%
-0.50%
0.00%
0.50%
1.00%
1.50%
2.00%
2.50%
1 2 3 4 5 6 7 8 9 10
Cost of Living Decile
Dec
ile
Per
cen
t
-2.12%
0.16%
1.54%1.40%
2.19%
1.04%
0.60%0.41%
0.19%
0.39%
Economic Policy Institute, “Family Budget Calculator, 2005”; U.S. Bureau of the Census
Universe: 304 U.S. Metro Areas Boston

Key Point
Housing Costs – and more generally the cost of living – is a key economic challenge in the Commonwealth … and perhaps the #1 barrier to a full economic recovery
Progress on the Housing Front: Chapter 40R/40S
ADD SLIDES FROM TED CARMAN

Chapter 40R/40S
• As of July 2007, 16 communities in Massachusetts towns have approved Chapter 40R “Smart Growth” districts. More than 30 others are considering such districts.
• Existing 40R Districts can provide over 5,800 new units of housing
• Over 3,000 more units in the pipeline

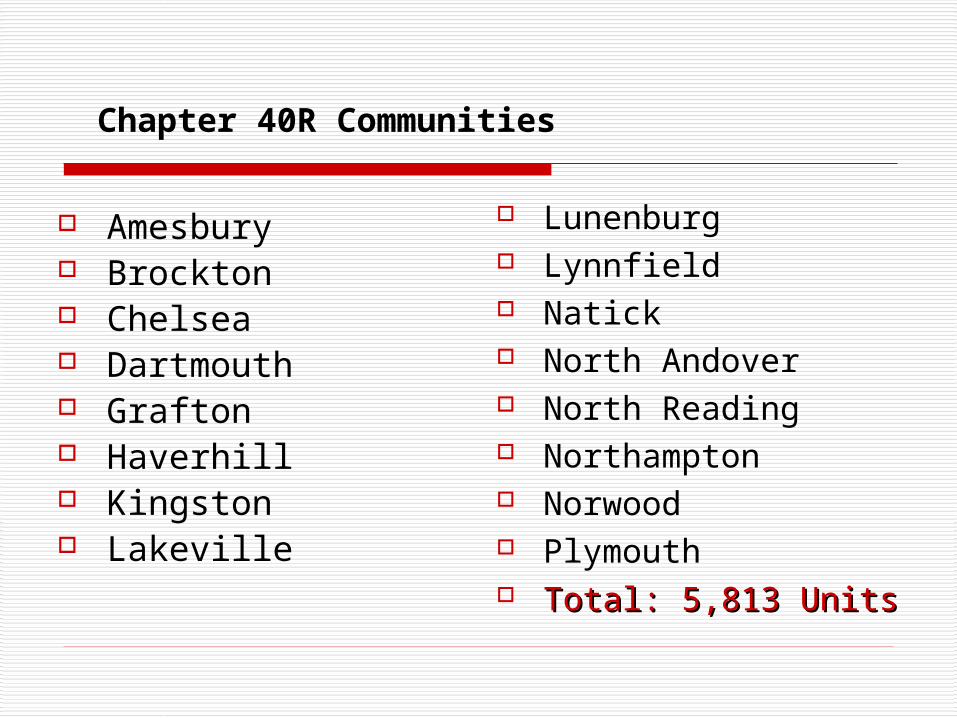
Chapter 40R Communities
Amesbury Brockton Chelsea Dartmouth Grafton Haverhill Kingston Lakeville
Lunenburg Lynnfield Natick North Andover North Reading Northampton Norwood Plymouth Total: 5,813 UnitsTotal: 5,813 Units
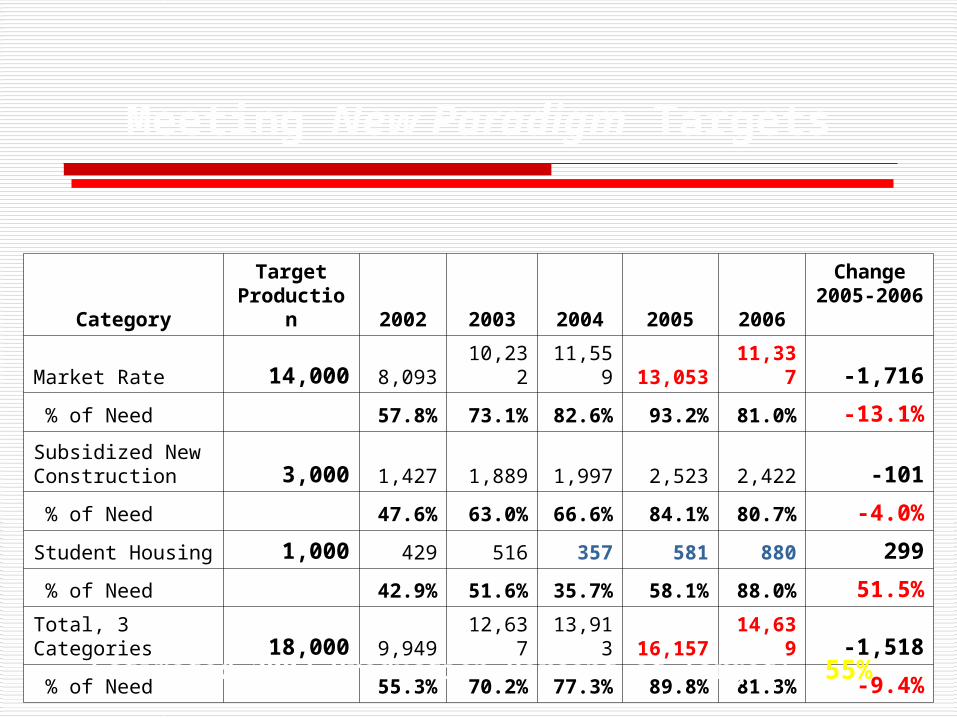
CategoryTarget
Production 2002 2003 2004 2005 2006Change
2005-2006
Market Rate 14,000 8,093 10,232 11,559 13,053 11,337 -1,716
% of Need 57.8% 73.1% 82.6% 93.2% 81.0% -13.1%
Subsidized New Construction 3,000 1,427 1,889 1,997 2,523 2,422 -101
% of Need 47.6% 63.0% 66.6% 84.1% 80.7% -4.0%
Student Housing 1,000 429 516 357 581 880 299
% of Need 42.9% 51.6% 35.7% 58.1% 88.0% 51.5%
Total, 3 Categories 18,000 9,949 12,637 13,913 16,157 14,639 -1,518
% of Need 55.3% 70.2% 77.3% 89.8% 81.3% -9.4%
Meeting New Paradigm Targets
Estimated 2007 Production Percent of Target: 55%

Conclusions
The “Perfect Storm” – Anxious homeowners, declining production … but no improvement in affordability
The weak economy is linked to the continuing housing crisis
We still have a lot to do to get us back on track toward economic prosperity equitably shared

Finding Solutions
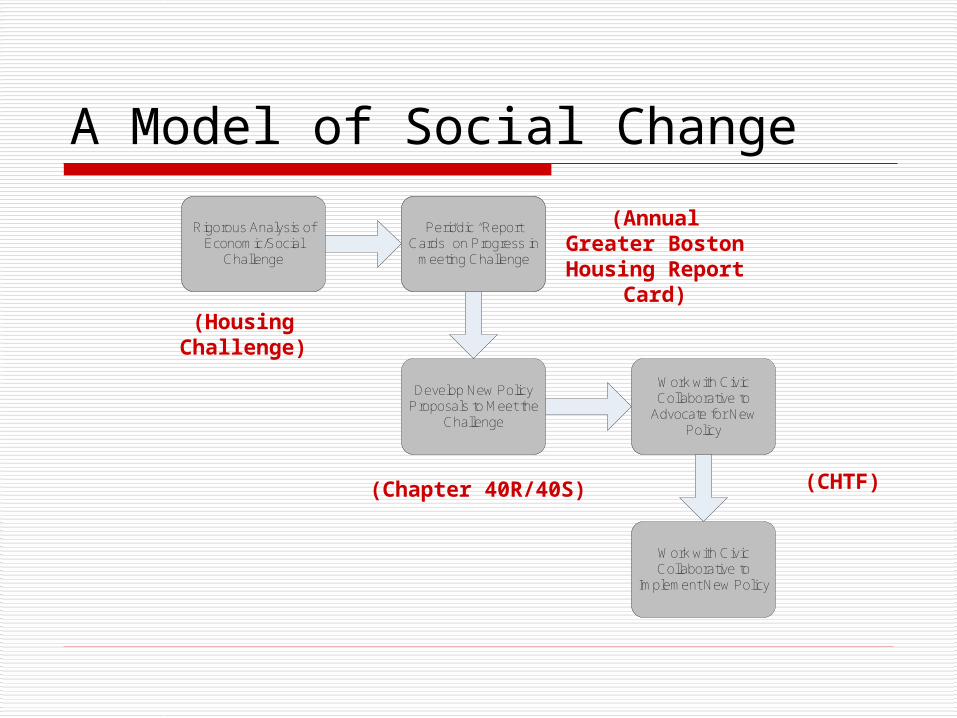
A Model of Social Change
Rigorous Analysis of Economic/Social
Challenge
Periodic “Report Cards” on Meeting the
Challenge
Develop New Policy Proposals to Meet the
Challenge
Work with Civic Collaborative to
Advocate for New Policy
Work with Civic Collaborative to
Implement New Policy
Periodic “Report Cards” on Progress in
meeting Challenge
(Housing Challenge)
(Annual Greater Boston Housing Report Card)
(Chapter 40R/40S) (CHTF)

The Nature of the Problem
With housing – Two Americas
1. The Midwest, the South, the Southwest.
2. The East Coast and the West Coast
Therefore – the problems are not inevitable
The Culprits
Zoning
Multiple Academic Studies Govt. Regulations
Shortage of Land for building
Increases land costs Extensive permitting delays

Local and State Finance
Perverse Interaction
Prop. 2 ½ Property Taxes Chapter 70

Single Family Home
Sale price - $400,000 Property taxes at .15 = $6,000 Half for school costs = $3,000 On average – 1 school child
Actual cost of education: $10,000

A New House
Local Costs: Loss of Open Space Increase in traffic More public services Education
State Benefits Sales Tax Income Tax Corporate Tax

It’s no Surprise
Local communities do all they can to discourage the production of housing.
They are remarkably successful
The economy shows the results

Smart Growth Zoning
Chapters 40R and 40S
Goal: a surplus of zoned land
Incentives if: Smart Growth Locations 20% of units affordable Minimum Densities

Incentives
Initial Payment - $1,000 per unit
Construction Payment - $3,000 / Unit
School Cost Hold Harmless
Design Standards

How has it worked?
Zoned land for 6,000 units 3,000 more in the pipeline Diverse developments and communities
17 of 17 communities have approved A cooperative dynamic
But, all multifamily.
Starter Homes still not being built

Starter Homes
Credible long term funding for school costs.
Additional incentives.
Proposal in the works.

Public Policy Ingredients
A good idea
Institutional Support
Significant Funding
Intense effort
Broad and deep process

How Did it Happen?
18 months from concept paper to legislation
The Commonwealth Housing Task Force The Center for Urban and Regional Policy The Boston Foundation The Legislature and Administration

Conclusion
Much Success, but, more to be done.
The Process can be replicated.